Asymco

Asymmetric Intelligence

Market

  1. The fate of mobile phone brands

    Research · 97 comments

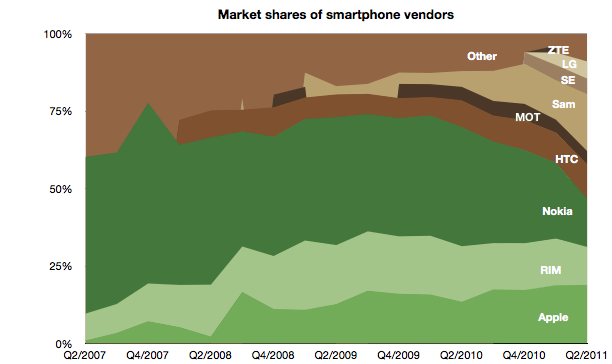
    The violence with which new platforms have displaced incumbent mobile vendor fortunes continues to surprise.

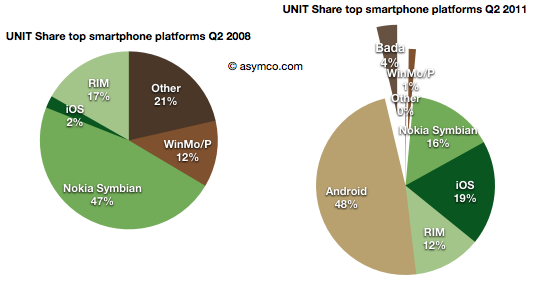
    • Nokia's Symbian platform has gone from 47% share to 16% in three years
    • Microsoft's phone platforms have gone from 12% to 1%
    • Other platforms have gone from 21% to zero
    • Although far less dramatic, RIM's decline from 17% to 12%  is causing acute pain and anxiety

    This while entrants have grown share in spectacular fashion:

    • Android from zero to 48% (A two year period)
    • iOS from 2% to 19%
    • Bada from zero to 4% (two quarters only)
     

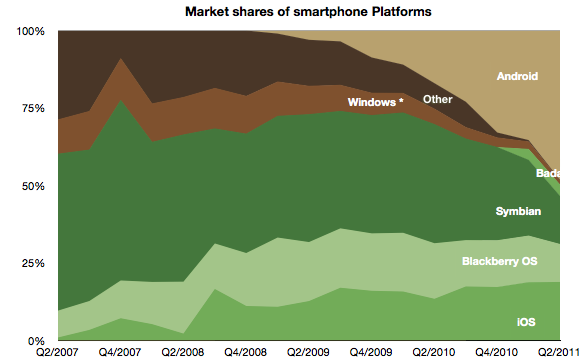
    The picture of platform share over time looks like this:
     

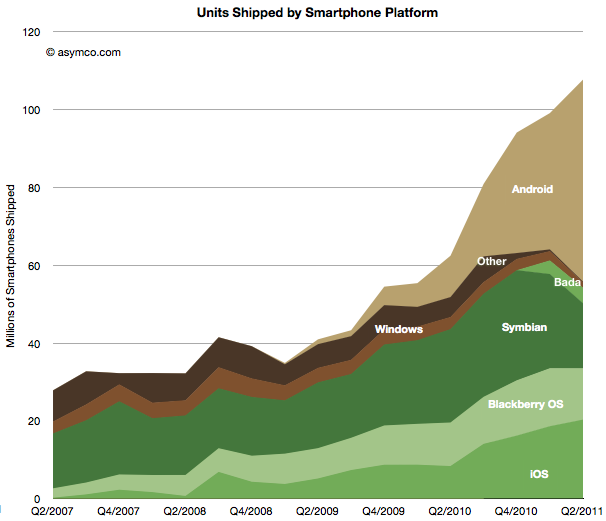
    The platform volume growth is shown in the following graph:
    Shocking

    Or is it?

    The surprising thing is that it should not be surprising. When the iPhone re-defined the basis of competition (at the beginning of the time frame of these charts) it unleashed forces which are still spinning the industry into a new configuration.

    In that context, Android is a natural consequence. As iPhone created a threat, the response from all other vendors (other than Nokia and RIM) was to seek something that would sustain their business. Android was salvation.

    It enabled the pursuit of better margins and hence better returns. So much so that Android offers the escape up-market they have always sought. It enables vendors to abandon the profit-free feature phones to low-end entrants like ZTE and Huawei.

    LG, Samsung, Motorola and Sony Ericsson all took the bait. They are racing as quickly as possible to turn their feature phone portfolios into Android portfolios. This is certainly something that Google also wants to see happen and has been planning all along.

    However one of the consequences of the modular (aka "open") approach is that the low end disruptors gobbling up low-end share are also motivated to move into the Android business as soon as it comes within reach.  The only reliably predictable consequence of Android will be the postponement of displacement of the existing brands by the low-end entrants.

    Is this fate unavoidable for all brands?

    Clearly some vendors see the trap. For all its apparent failings, Nokia saw this outcome and chose to attempt a "Hail Mary Pass" with Microsoft. The strategic point being that because they no longer had faith in their ability to execute on an independent platform, they would pick a platform that gave them at least some control or leverage. There are serious risks and problems with this approach--something which has been covered here already--but the bet being made is a clear rejection of the slippery Android slope.

    RIM is trying to resist with QNX which is a similar approach but timing may also be the undoing of this strategy. HP's approach with WebOS and Samsung's Bada are also hedges to avoid this fate.

    And what about Apple?

    Apple is always skating in a different direction. iOS needs to be seen as not so much a phone platform but a computing platform. Given what we know, iOS was always conceived as the future of computing. Voice, after all, is just an app on iOS. So my expectation is that Apple's iOS will continue its attack on the mobile computing market, skimming (or carving as the case may be) profits from the phone business to sustain its ultimate target of reclaiming the computing universe.

    By this thinking iOS lives only by improving more rapidly than anything else in dimensions that redefine the basis of performance. In other words, doing more of what the iPhone did in the first place to set off this disruption.
  2. The Android and iOS pincer movement

    Research · 47 comments

    Nearly all the data on smartphone shipments is now available for the second quarter 2011. Some fragments are still not public, including ZTE and Huawei (and any others) shipments. We also have estimates for the various platforms including an estimate for Windows Phone and Bada (though not for WebOS).

    This allows the following chart:

    Using the traditional color scheme which separates "integrated" from "modular" vendors, the chart shows overall volume growth and how the volumes are split among vendors.

    The market grew at about 73% y/y and 50% compounded over three years and 9% sequentially. The y/y growth rates for individual vendors were:

    1. Samsung 525%
    2. Apple 142%
    3. HTC 124%
    4. Motorola 63%
    5. "other" 29%
    6. RIM 18%
    7. Nokia -30%

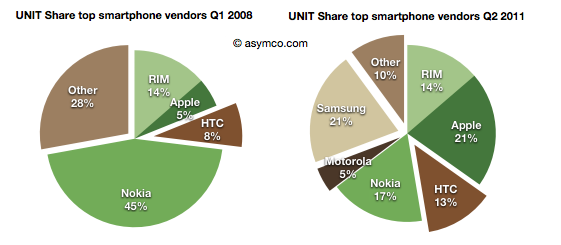
    In terms of unit share, the pie charts below show the before and after (three year span):

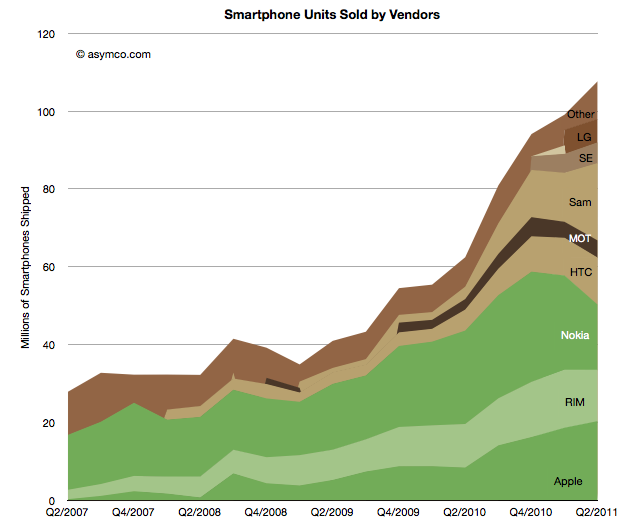
    And the stacked area below shows every quarter over a four year period.

    The story is largely unchanged since last quarter except perhaps in the rapidity or deterioration in Nokia's performance and Samsung's partial exploitation of that decline.

    It should be noted that not all of Samsung's volumes are licensed platforms. An increasing share of Samsung smartphone volumes is Bada, an internally developed OS.

    In the charts above I arranged the bars to place Nokia and RIM in the middle to show their double envelopment. A pincer movement is only an analogy but perhaps it's evocative of what's happening.

  3. The Samsung hedge: Estimating Bada for Q2 and hence Samsung's Android shipments

    Research · 28 comments

    The number of Bada phones shipped last quarter is not public, however some assumptions can be made that lead to plausible estimates.

    First, we know that Samsung shipped about 3.2 million smartphones in Q2 2010 and that total included Bada and Android (and perhaps even some Windows Mobile).

    Second, we know that there were about 19.9 million smartphones in Q2 2011.

    Third, Canalys published an estimate that Bada grew by 355% y/y.

    So if we knew how many Bada phones shipped in Q2 2010 we could derive the current Bada shipments and also realize how many of the nearly 20 million smartphones from Samsung were actually Android.

    The clue is in an estimate from December last year that suggested that there would about 5 million Bada shipments in 2010. Coming close to the end of the year, and from Samsung directly, we can be pretty sure the figure is accurate.

    Taking this 5 million and spreading it over four quarters could give us enough of an estimate. That makes 1.25 million quarterly units. If we assume some seasonality or increase toward the end of the year, a Q2 figure of 1 million might be more accurate.

    Therefore, applying the 355% growth rate yields a Q2 2011 estimate of 4.5 million Bada shipments and hence about 15.4 million Android devices from Samsung last quarter.

    Considering the increasing importance of Bada to Samsung, it should be clear that Android is not the only source of growth for the company and its transition of feature phones to Bada as well as Android is a key strategic driver for differentiation vis-a-vis low end entrants.

  4. The Verizon small bang

    Research · 50 comments

    As Verizon has reported iPhone sales for one and a half quarters, it's time to try to discern the impact on the product. There were several hypotheses floating around prior to the "big bang" of Verizon.

    Some assumed that there would be a large migration away from AT&T and that AT&T iPhone sales would slump. Others that there would be no Verizon iPhones volumes at all because there were so many Android users already converted. There were also suggestions that the iPhone would explode in growth with two major operators carrying it.

    What really happened?

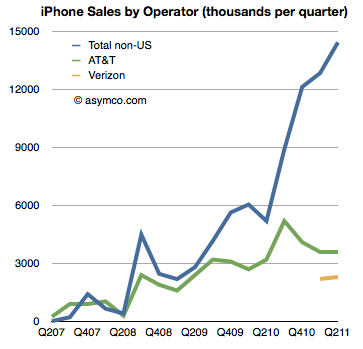
    The first chart shows historic AT&T activation with Verizon activations added. It also shows sales to "none of the above", namely non-US sales of iPhones[1].

    AT&T iPhone activations show no significant impact from Verizon and Verizon itself shows a modest start to sales[2]. What did not happen is an exodus from AT&T. We also did not see a rejection of the iPhone by Verizon customers long exposed to anti-iPhone Droid advertising. We also did not see a considerable impact of Verizon on growth.

    Verizon did contribute (4.5 million Verizon iPhone users is nothing to sneeze at)  but the contribution was to a degree that was nowhere near a big bang.

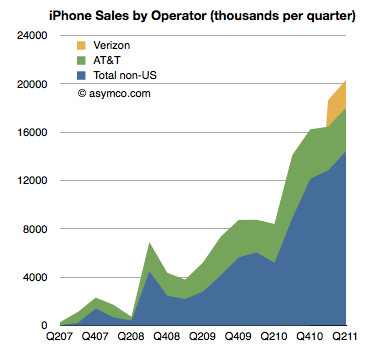
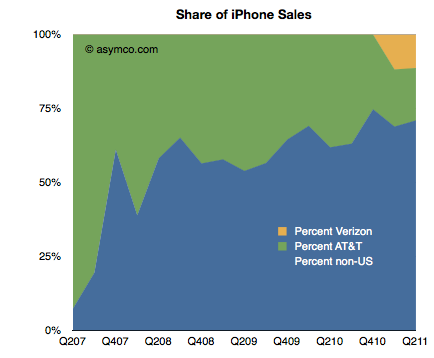
    That was because the real big bang was from the rest of the world. The same data in the first chart is shown below as a stacked area chart and a share chart. Had Verizon not come on board the business would still have grown year-on-year over 100% (and sequentially).

    The US activations have been decreasing as a percent of total iPhones sold. Before Verizon came online, the US share was decreasing (from an average of 45% share in 2008 to 33% in 2010). After Verizon, the US continues to slide to an average of 30% share (two quarters).

     After waiting nearly four years, American observers of the iPhone could perhaps be excused for their obsession on the impact of expirated AT&T exclusivity. But the real impact is that by the time it came, it was moot.

    It would be a mistake to look upon Q1 and Q2 and say that the explosive growth was due to Verizon or the end of US exclusivity.

    The global market is far greater than the US and the iPhone business has simply grown to reflect that.


    ---

    Notes

    1. Non-US sales are total iPhones sold minus activations in the US. There is the possibility that some of the unactivated phones were activated on T-Mobile or that there is some delay between purchase, channel inventory and activation, but the time frame shown should smooth out any of the noise.
    2. What we don't know is what was the impact of iPhone sales start on Verizon's other smartphone platforms. Unfortunately, Verizon does not report overall smartphone sales/activations so we can't conclude directly that iPhone has slowed other platforms on Verizon. Some other data (NPD, Changewave, ComScore) do indicate some slowing in Android growth in the US but we have no definitive data to prove it.
  5. Apple has moved on

    Research · 36 comments

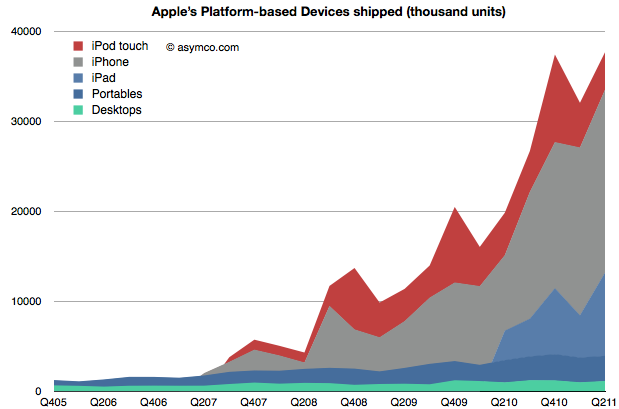
    When Apple changed its name from Apple Computer to Apple Inc. they signaled that their business has moved on. We can say it's to devices or to mobile computing or to the Post-PC era. To understand that this is not a shift driven only by wishful thinking we can plot the change in volumes for the platform-based devices Apple sells.

    The stack of products is shown in an increasing level of mobility. At the bottom is the non-portable desktop Mac, above are Mac portables (laptops) followed by the iPad, iPhone and iPod touch. The mobile computers Apple sells are explosively more popular (and important).

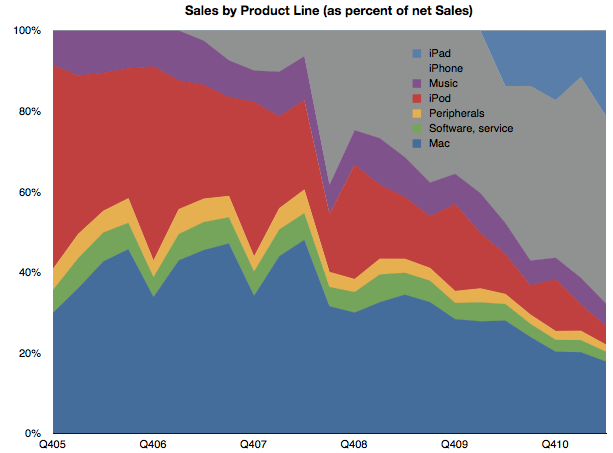
    To gauge importance consider the following chart which shows the unit values above multiplied by the average price they are able to obtain for a picture of the sales mix.

    (I also added Peripherals, Music and Software sales as well as iPod (non-touch) for a complete split of revenues).

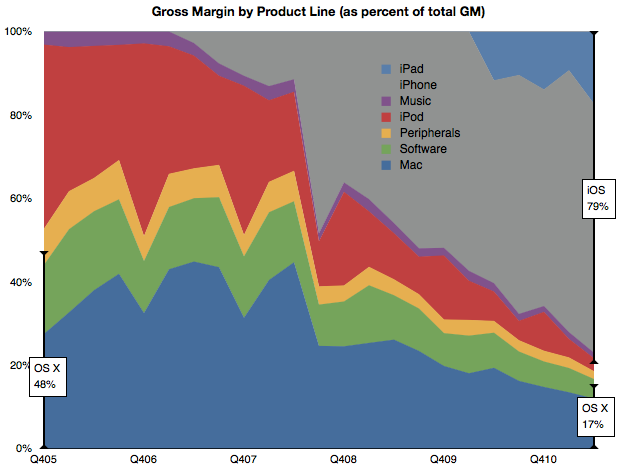
    Mobile computers are now well above half the revenue base for Apple. Finally, if we consider the contribution to profitability of each product line, we can see how iOS-enabled products (as a proxy for mobile computing) have become the vast bulk of profit creation for Apple.

    By this metric, we can see that mobile computing (as opposed to portable or immobile computing) is driving 80% of Apple's profitability. This 80/20 mix of mobile/non-mobile should put aside any doubts that Apple has moved on to be a business oriented around mobility rather than traditional computing.

    This cannot be said for many of Apple's contemporaries. Microsoft derives negligible revenues from mobility. Neither does Intel, nor Dell or HP and even Google's revenue lines don't make mention of mobile income.

    In fact, the only companies which do have mobile revenues as 80% of their income are those dedicated to telecom markets. Namely, Nokia, Motorola, Sony Ericsson, RIM et. al. But, as we shall see in the quarterly mobile market overview, few of Apple's mobile-focused competitors are doing well.

    So Apple is a unique company that has made the transition from one industry to another and, in so doing, captured the bulk of the profits. In passing, I should also mention that the traditional Mac business is still doing well and, by some measures, is capturing the bulk of the PC hardware profits.

    So the key to much of assessing Apple's value and opportunity should be based on this new market (mobile computing) rather than the traditional competitive landscape of PCs and operating systems. The company has moved on, now we wait to see how long before analysis of the company follows.

  6. How we do all this will never be the same

    Research · 36 comments

    In a new ad for the iPad Apple once again makes the case that the tablet is a good substitute for a PC in a number of use cases (and permits some new ones.)

    We'll never stop sharing our memories. Or getting lost in a good book. We'll always cook dinner and cheer for our favorite team. We'll still go to meetings, make home movies, and learn new things. But how we do all this will never be the same.

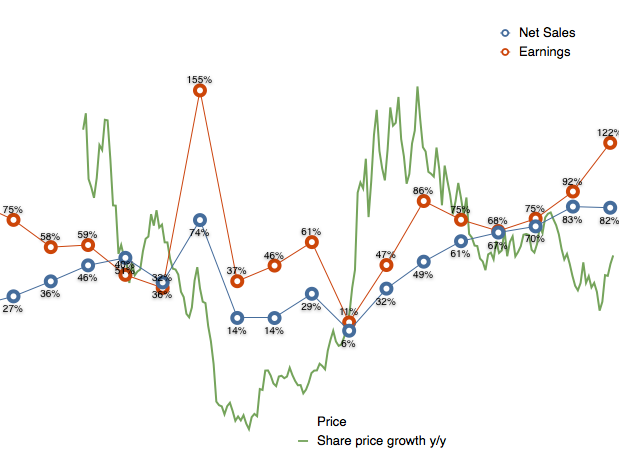
    This belief that the iPad "cannibalizes" the PC is a powerful concept. The growth of the PC has certainly been affected. But has the Mac's growth also been affected?

    Tim Cook seems to think so. In the earnings call he said:

    In terms of cannibalization, we do believe that some customers chose to purchase an iPad instead of the new Mac during the quarter, but we also believe that even more customers chose to purchase an iPad over Windows PC. And as I've said before, there's a lot more of the Windows PC business to cannibalize than the Mac.

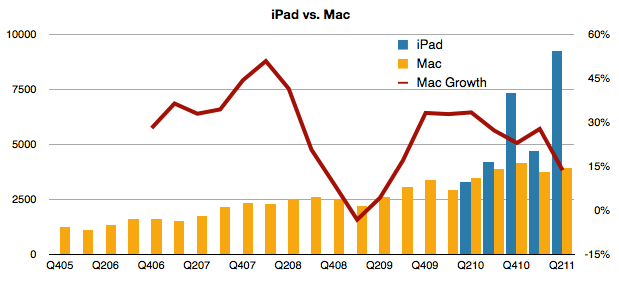
    If we look at the behavior of Mac vs. iPad, the following chart may be useful:

    First off, we can observe that since introduction, iPad has always sold more units than the Mac. Now it's selling more than twice as many units and the revenue from those units is higher than those of the Mac. The other line to look at is the growth (y/y). During the time that the iPad has been shipping, the Mac growth has been declining.

    Yes, it's still growing at five times the rate of the PC market (and 7.5 times the rate of Windows only PCs), but the iPad phenomenon is indeed affecting the Mac.

    With the launch of Lion, Apple is clearly showing that there is dramatic improvement potential in traditional personal computing. But increasingly the improvements are "borrowed" from touch interfaces. Clearly, as the ad implies, computing will never be the same again.

  7. Apple's share price (adjusted for earnings and growth) reaches new low

    Research · 30 comments

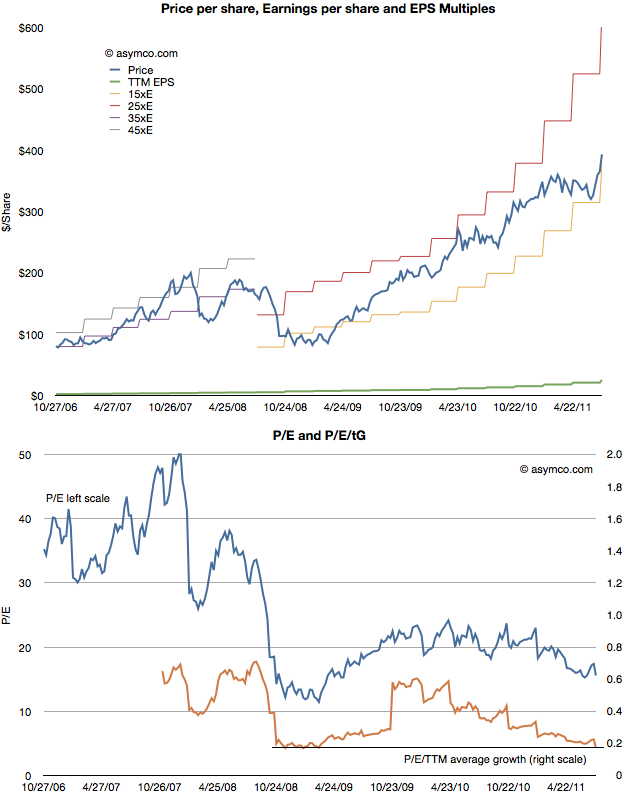
    After Apple reported earnings growth of 125% its share price dropped to a P/E of about 15. This reduction in valuation is part of a trend I've written about for over a year so there were no surprises. The first chart below shows how the stock has traded between increasingly lowered P/E bands.

    As the second chart shows, not only is the P/E ratio declining, but when seen against the trailing twelve months (TTM) average growth rate, the P/E/TTM ratio is now at the lowest since the great recession (around 0.17--a value of 1.0 is a rule of thumb for "fair value" in a growth stock).

    Those values include cash. Excluding cash, the P/E as of Friday was 12.4. On a forward basis (my estimate--which has shown be be conservative lately) the P/E is around 7.

    Perhaps some day in the future investors will come around to looking at Apple as a growing company, but there has been no such inclination for over two years. As I've pointed out numerous times, growth and valuation are moving in opposite directions.

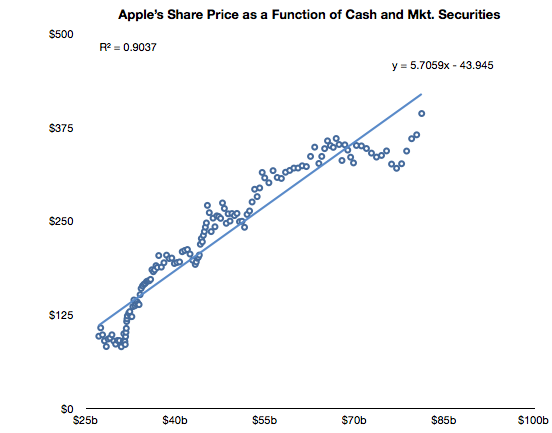
    The only correlation to the stock price has been found on the balance sheet, not the income statement. Looking again at the relationships between cash and the stock price, we see a clear relationship (r squared of .9)

    After a lapse during the first quarter, the relationship that has been in place since October 2008 is returning.

    Note the formula of the trendline which allows some interesting guesses on what the stock price will be. For example, putting $95 in cash per share results in a share price of $500. Let's see if the relationship holds until then.


  8. A new way to value Apple

    Research · 38 comments

    Almost all valuation models for Apple assume it's a hardware company. The modeling algorithm for hardware is simple:

    • For each year in near future
    • For each product line
    • Compute contribution
    • Determine company value by summing contributions and multiplying by a P/E ratio

    The major difficulty is in predicting the growth of each product line. This is difficult because buyers can be fickle. Companies employs all sorts of tools in order to secure repeat customers but if switching costs are low, the company can crash in value. For this reason, analysts pick various ways to predict device  sales. Some choose to index each product on production (channel checks), demand (customer surveys,)  or even on a top-down share of total (market research on growth of whole market and assumptions of share).

    Although simple and convenient, this model does not probably match the way Apple is managed. The company does not build hardware products to sell and forget. It builds platforms which are best seen as sources of recurring revenues. Users are incentivized to continue buying devices. iCloud, iTunes and other Apple properties are expressly designed to that goal--and they are not cheap to run. So, the company must see the world through a different set of lenses than the default model shown above.

    To think about the business like they do, we need to put the data through a similar set of lenses. I began with a modest proposal last month to value each user as a source of recurring revenue. Now it's time to expand on this method.

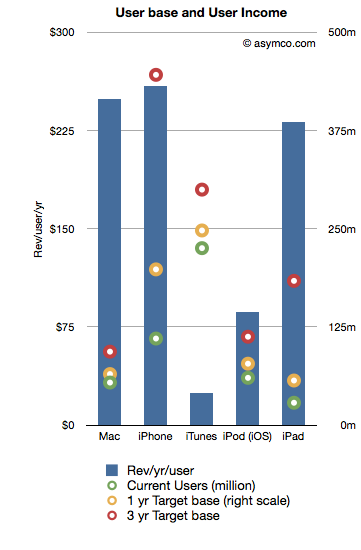
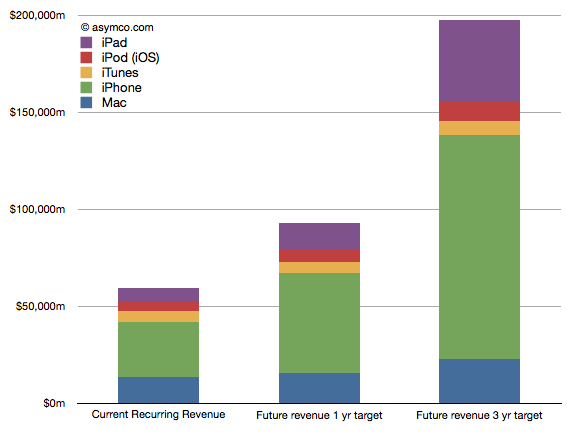
    The following chart shows the recurring revenues per user by product and the current and possible future size of user bases.[2]

    Revenues/yr/user are bars with the left axis and the User bases are various colored circles indexed with the right axis.

    The assumptions that went into the data are as follows:

    1. Device life span is as per previous article linked above
    2. User base growth for 1 year is: Mac 20%, iPhone 80%, iTunes 10%, iPod 30%, iPad 100%
    3. User base growth for 2nd and 3rd years (recurring): Mac 20%, iPhone 50%, iTunes 10%, iPod 20%, iPad 80%.
    4. The Revenue per user is assumed constant

    Note that the user base growth figures are lower than the product growth levels seen historically. Obviously, the model is highly sensitive to these growth assumptions so they need to be scrutinized and tested rigorously.

    Nevertheless, as a straw-man proposal,  the recurring revenues for all these products[1] is shown in the following chart:

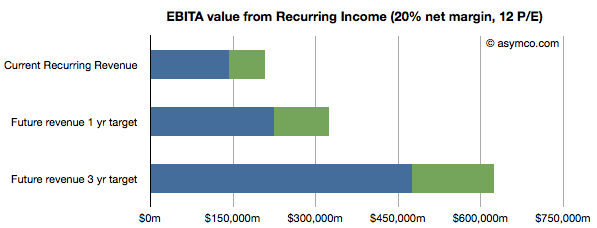
    Once the income is estimated, we can take that value and assume a profit margin (net) and then multiply the earnings by a multiple. Using a 20% net margin and 12x P/E yields the following chart.

    (I added an assumed level of cash in green.)

    This model would imply that the company today could be valued at $208 billion on the basis of its installed base alone. That value would be about $323 billion in one year and $620 billion in three years. Dividing by the number of shares outstanding (935m this year increasing at 2% a year) yields a share price of $222, $339 and $629 by mid 2014.

    These values can be considered "lower bounds" on valuation since they assume income from previously secured customers. The speculative part of investment would be based on what the future bases will look like (so, for example, if one believes these assumptions, the $629 figure could be considered a target to be discounted to today).

    ---

    Notes:

    1. Excludes Software, Peripherals, non-iOS devices, and any other service revenue.
    2. Compare this char to social media companies (MIT Technology Review)
  9. Is the tablet computer a new PC or post-PC?

    Research · 60 comments

    Steve Ballmer stated and Andy Lees confirmed that Microsoft views iPad and other tablets as "just PCs". From a market measurement point of view Canalys agrees. IDC and Gartner don't, calling the new devices "media tablets."

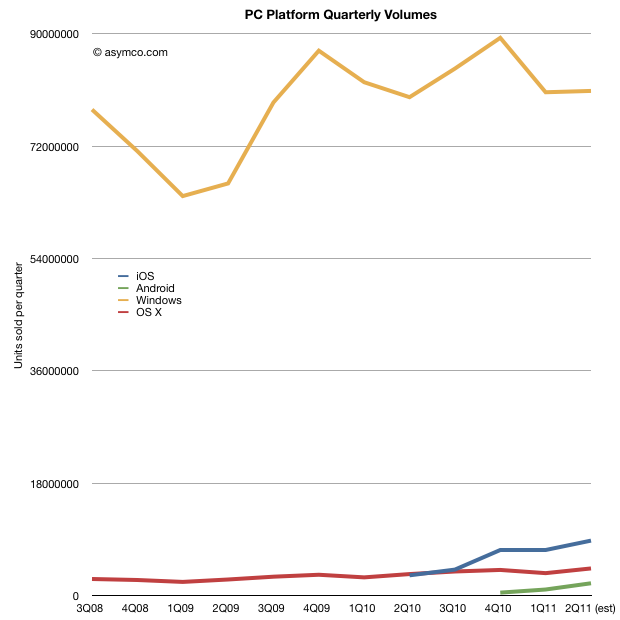
    Before deciding whether tablets belong with PCs in market metrics, it would be interesting to look at what the data shows. When seen as a combined market, the focus should be on platforms. The following chart shows the four main PC+tablet platform volumes since late 2008 [1].

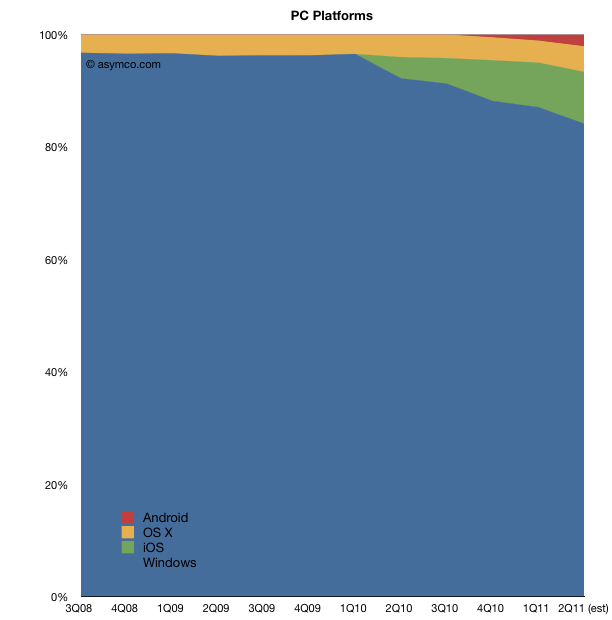
    The second chart shows the same data as share of total market:

    This comparison allows for some fresh observations:

    1. Excluding iPads, Apple is very close to being 5th largest global PC vendor. Global share likely to be above 5%. Including iPads, Apple would be 2nd.
    2. Platform year-on-year growth was Windows: +1.3%, OS X: +26%, iOS: +170%. Android growth cannot yet be measured since Android tablets have not been on the market for more than 1 year.
    3. In Q2 2011 one million more Windows PCs were sold than in Q2 2010. In same time, 903k more OS X PCs and 5.5 million more iPads.
    4. Excluding tablets, nearly 50% of the global PC growth was due to the Mac. Including iPad, Apple was responsible for ~70% of the growth in the PC market in Q2.

    The picture that emerges is that while Windows continues to be dominant with 84% of units sold in the last quarter, the growth belongs to tablets which captured about 90% of it. If Windows remains marginal on tablets, the "PC market" will likely tip away from Microsoft in two years (depending on how quickly Apple can build iPads.)

    Microsoft is making the commitment to move Windows to a tablet form factor but they are doing it while retaining the user interaction model of a desktop. This may or may not work but they are also conceding that a separate experience is also necessary. By rejecting the notion that a mobile OS alone can do the job, they are essentially building a "hybrid" tablet/laptop/desktop product which may be challenging to use but preserve their presence in the form factor.

    Whether Microsoft succeeds or not will depend on whether the new form factor is disruptive in more than user experience. In other words whether this is just a "new PC" or a "post-PC". The argument comes down to business model changes. For example the new model comes with different cycle time of product development (deep, integrated, yearly changes), different ecosystem (apps), different cost structures (high R&D in hardware), vast scale (device economics, components, ramps), and potentially new distribution (operators in the channel mix.)

    Summed up, the real challenge for Microsoft is whether they can keep their business model (selling OS licenses to hardware vendors) as PCs become more device-like. Not only is iOS setting the benchmark for performance but Android is potentially ready to take share if the market turns slightly more modular. Microsoft's differentiation looks to be primarily its legacy of PC software.

    It may also seem that much remains to be discovered in this market but I think the main bets have already been made. The PC market as we know it is in the end game.

    ---

    Notes:

    1. I used Gartner data for overall world-wide PC market and merged it with Mac and iPad data from Apple. Android data is estimated.
  10. iTunes app total downloads (finally) overtook song downloads

    Research · 29 comments

    It was only a few weeks ago (at WWDC) that we had an update on the app store growth rates. The data was presented here.

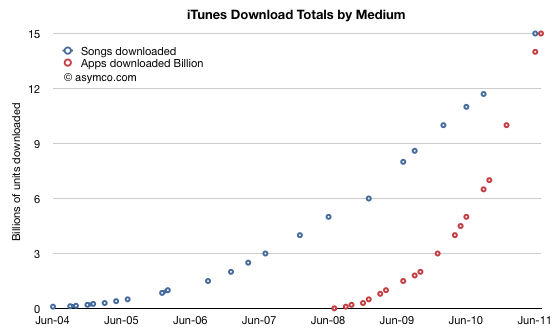
    One of the data points from the event was that iTunes hit 15 billion song downloads. Last week we heard that iTunes also hit 15 billion app downloads.

    The milestones were reached within less than a month so it's a fairly safe assumption that apps have overtaken songs. I had originally guessed that the cross-over would take place at 13 billion at the end of 2010.

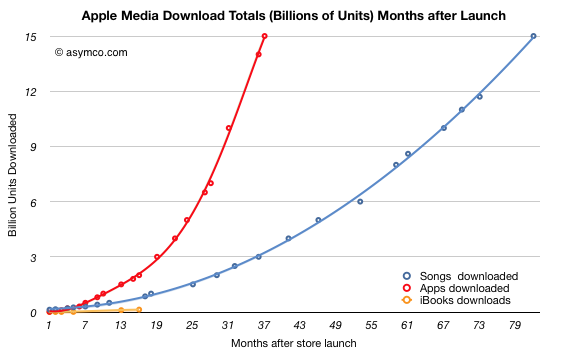
    The actual performance is shown below (total downloads indexed to same starting date):

    The 15 billion app threshold was passed within exactly three years while the 15 billion song threshold was passed in six years and 10 months. Shown on the actual time scale, the chart looks as follows:

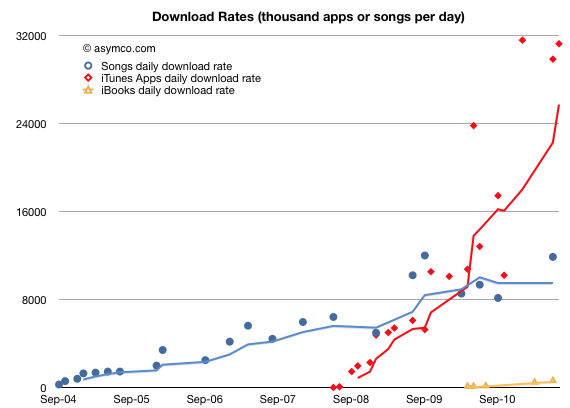
    Download rates for songs had a minor rebound in the last six months.

    The app download rate is now at least 31 million per day while the song download rate is about 12 million per month. Including books (but excluding video content), the App Store in now delivering at least 44 million new content downloads per month.

    My prediction of cross-over was off by seven months. This was due to three factors:

    1. Song downloads increased unexpectedly. There was a rebound in the last six months where daily downloads went from about 8m/day to about 12m/day which is a new high. I had expected download rates to have peaked mid 2010.
    2. App download rates proved to be more volatile than expected. As the last chart above shows, the download rates fluctuate quite a bit. The 4-period trend line is a bit more stable, but there are kinks.
    3. Polynomial curve fitting is always sensitive.

    When dealing with polynomial growth, predictions can be very dangerous. Nevertheless, I think the overall performance of the App Store is phenomenal.


  11. Measuring Mobile Platform Churn in the US Market

    Research · 48 comments

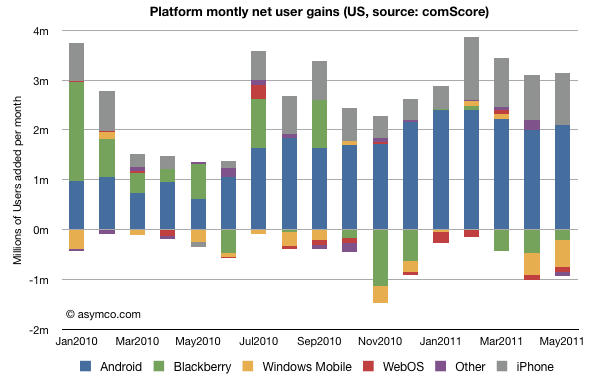
    The following chart shows the net gains in users for the major mobile platforms in the US. The data is derived from comScore's MobiLens report.

    The raw numbers for the last period (ending May) are:

    1. Android gained 2.1 million users
    2. iPhone gained 1.0 million users
    3. WebOS/PalmOS lost 96k users
    4. Blackberry lost 202k users
    5. "Other" lost about 95k users

    The "churn" or percent of smartphone users who switched platforms is 1.22%/month  of the overall users (assuming users to left one platform moved to another rather than to non-smart devices.)

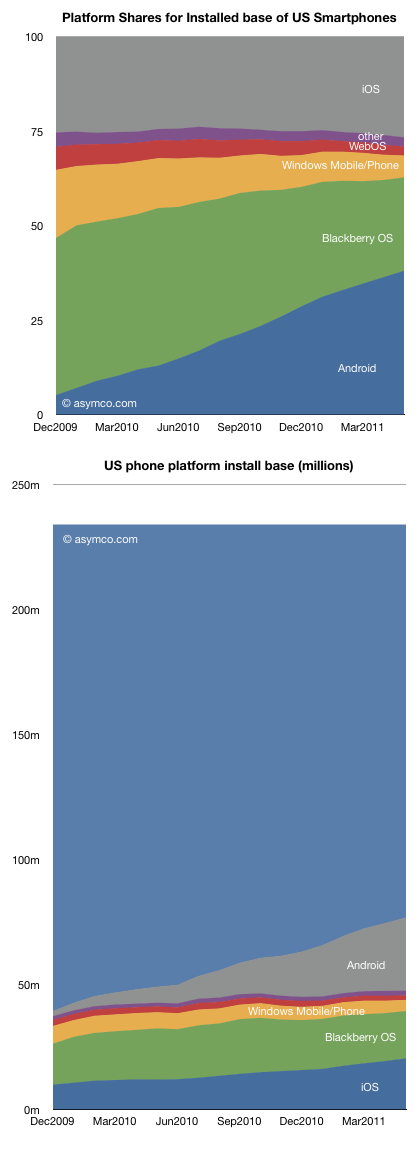
    The share of the platforms and the overall composition of users is shown in the following two charts:

    As usual, caution should be exercised when looking at share (top chart) outside the context of overall growth. The second chart may be more illustrative of what is happening. The light blue area on top is the smartphone non-consuming population.

    Android has been a tremendous accelerant of smartphone adoption while iOS has grown as well but share has not grown significantly. iPhone growth has kept up with market growth. This cannot be said for the other platforms which have been "squeezed" between these two entrants.

    So although the main competition is with non-consuming users and smartphones are winning in general, the loss of users by some of the incumbents is unsettling.

    Microsoft lost just over 2 million users in the US last year while RIM lost a net of 1.5 million. Palm lost about half a million. Contrast this with 8.5 million iPhone additions and 23 million new Android users.

    In particular, Windows Mobile/Phone is down to 5.8 million users (down from 18m in December 2009). With a loss of half a million per month, and share down to 4.5%, a lot is riding on the new platform.

    I've argued that the post-PC era will be a multi-platform era. Although it may seem that the situation in the US is rapidly moving toward a duopoly, it may not end up that way. Note how much non-consumption still exists.

    Note the time frame of the charts is only 18 months. The rapidity with which platforms gain ground could allow for continuing platform churn.