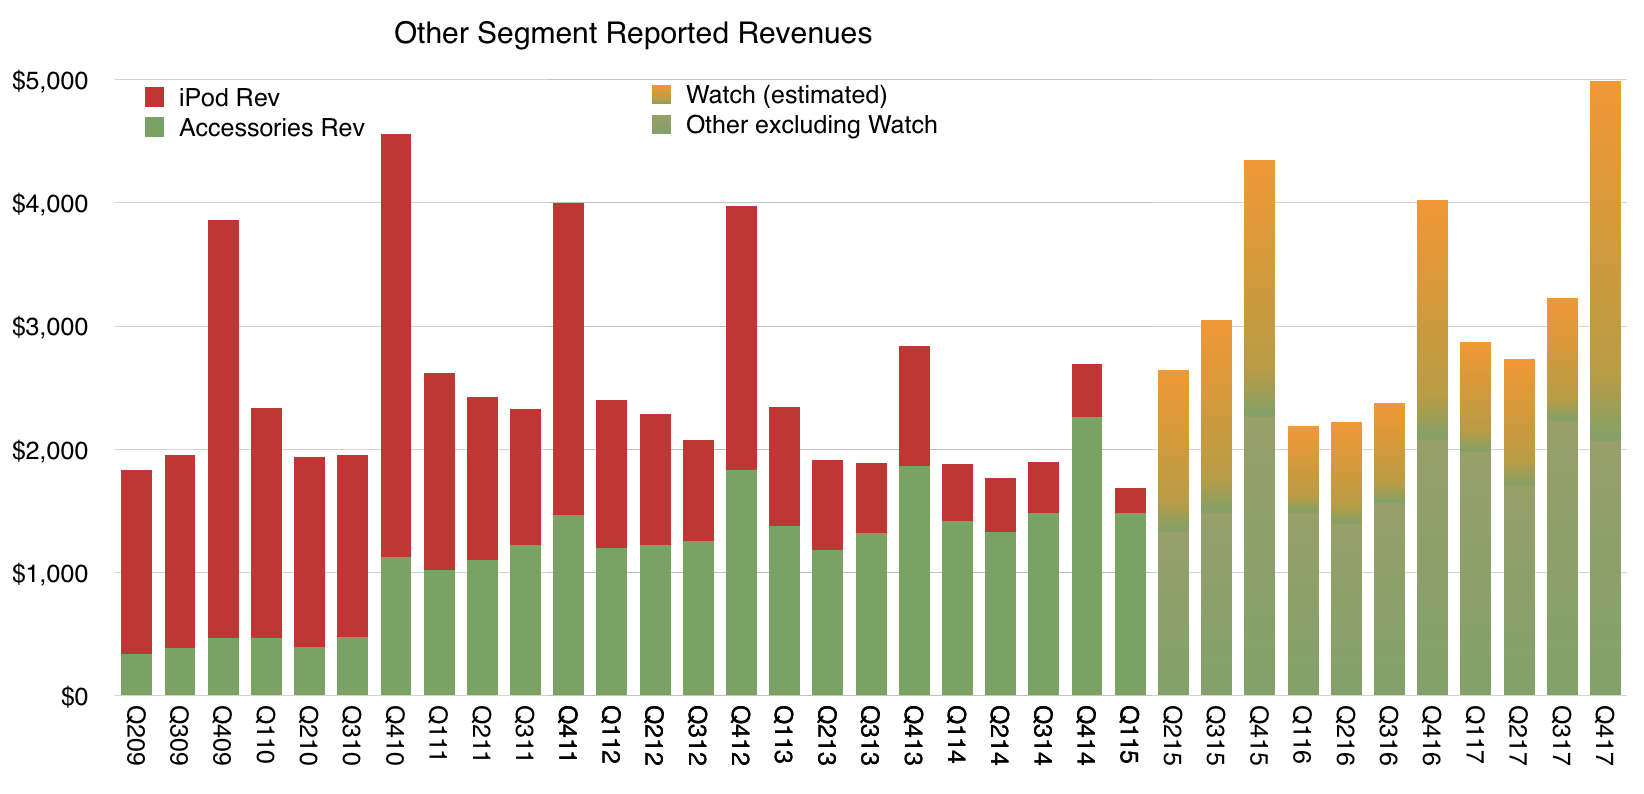
The last time Apple reported iPod unit and revenues was for the third quarter of 2014. Thereafter the product segment called “Other Products” was used to include what was formerly the iPod segment and the “Accessories” segment. Exactly two quarters later Apple began to sell the Apple Watch. Apple Watch was not broken out as a separate product segment and remained a part of Other Products along with iPod touch, Beats, Apple TV, and Apple-branded and third-party accessories. Soon the HomePod will also join the Other products.
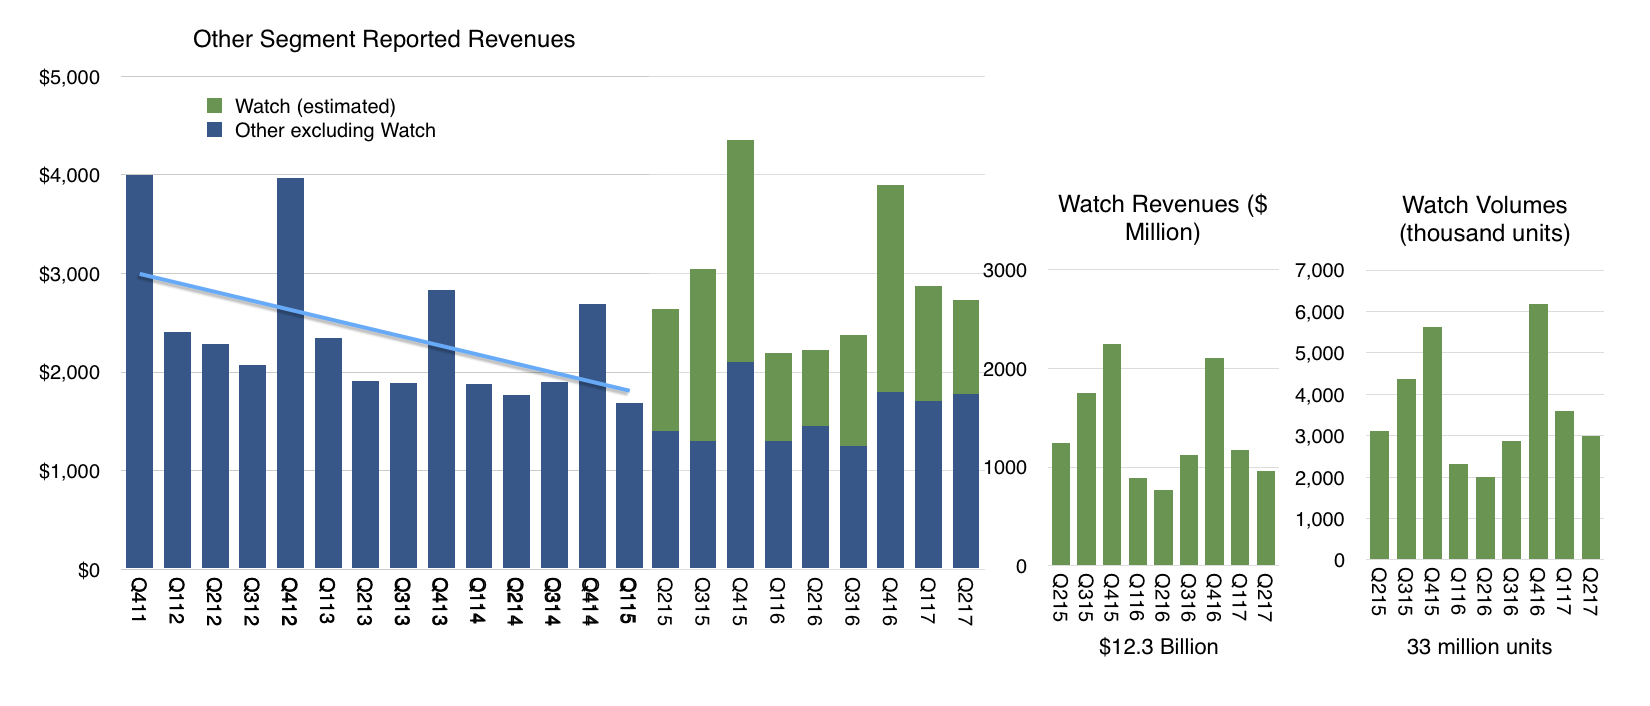
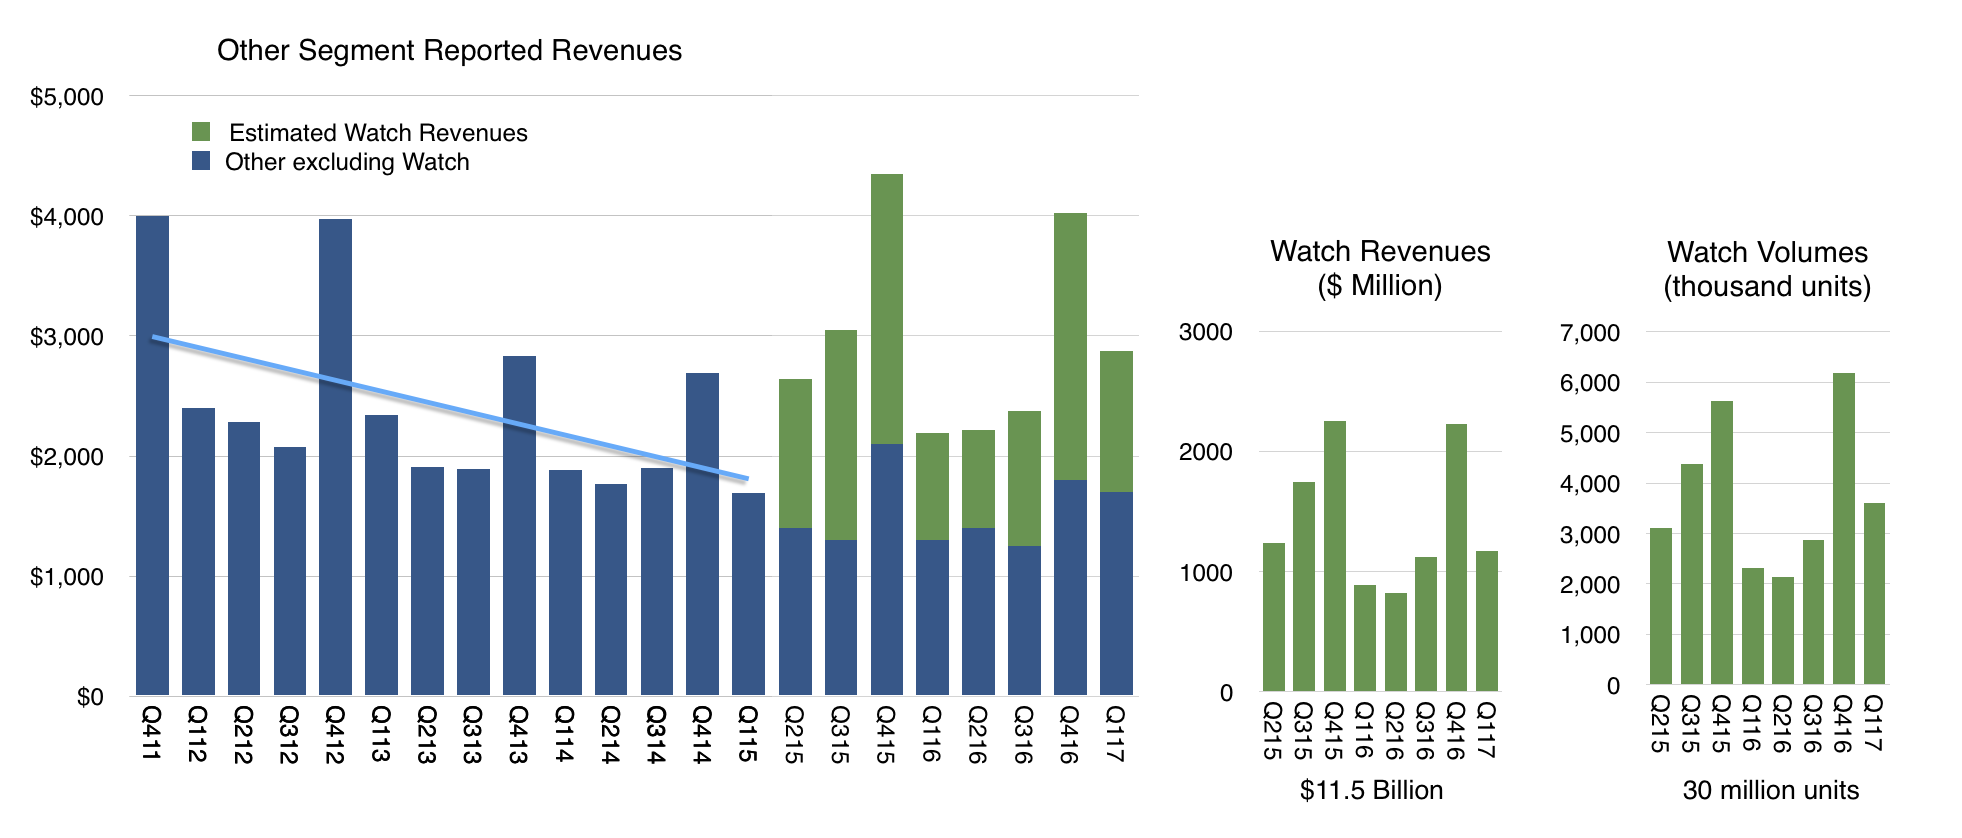
The combined iPod, Accessories and “Other” product sales are shown in the following graph. ((Two quarters include estimated iPod revenues: Q4 ’14 and Q1 ’15. The iPod contribution is estimated with a simple extrapolation using the previous four quarters’ average rate of decline))
Note that an attempt is made to estimate the contribution of Apple Watch to the mix. The method is simple: if you can estimate the non-Watch sales trajectory then the Watch is the difference between Other total and this trajectory.
If we discount the iPod, the non-Watch revenues come down to Apple TV and Beats, mainly. Note that the data shows the contribution of Beats (Q4 2010) but it’s hard to parse specifically the growth of Beats. Since the Watch launched we also saw the introduction of AirPods and new Apple TVs, both of which probably contributed to some growth to “Other excluding Watch.”
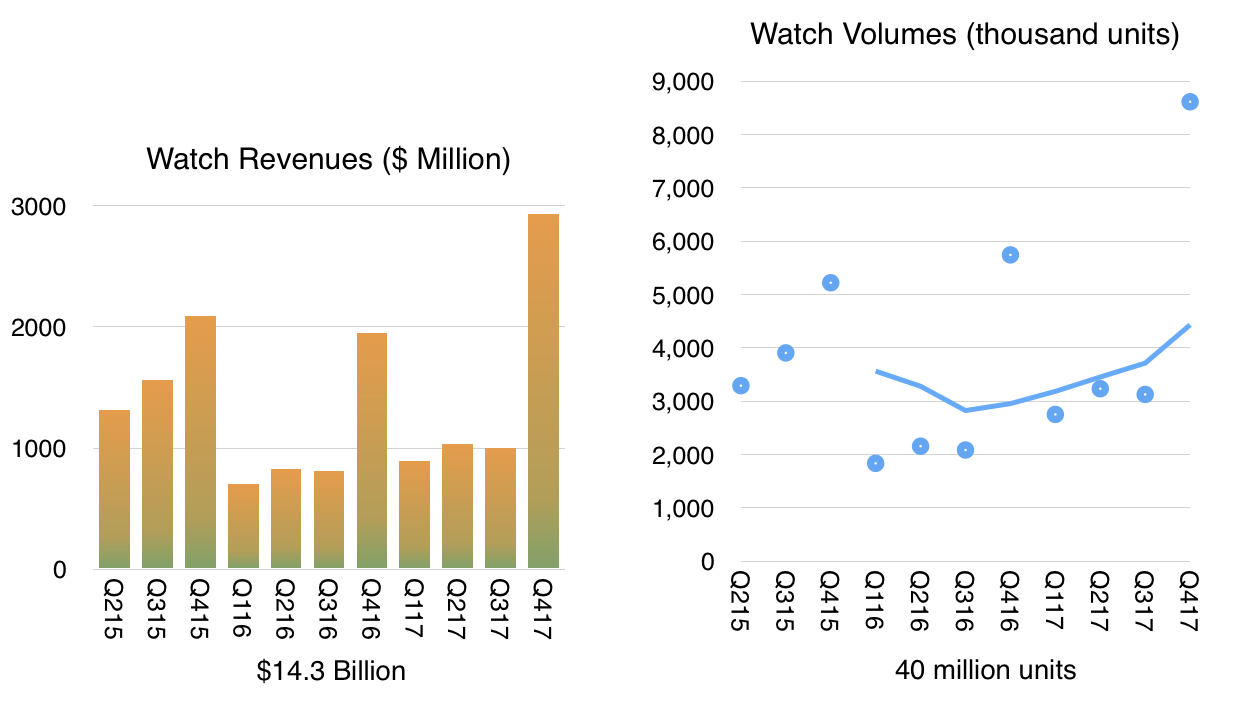
We can take a stab at the first 6 quarters of Watch by projecting Other with some nominal growth. Thereafter Watch can be modeled using growth assumptions. Apple stated that growth was above 50% during the past three quarters. There are a few quarters where we must make guesses but overall the picture that emerges, shown below, is fairly robust. Note that I’ve included estimates for the fourth quarter of 2017 assuming continuing 50% growth. This is driven primarily by the launch of the LTE-enabled Series 3.
The result is a cumulative sales value of $14.3 billion and a volume of 40 million units (based on average pricing assumptions).
But what most catches the eye is the transition from iPod to Watch. Watch entered nearly at the same time as iPod bowed out. Its contribution to sales seems to mirror the iPod as well. The interesting question then becomes if the Watch will eventually match and indeed exceed the revenues from iPod.
I’d say the better question is _when_ Watch will overtake iPod. From a revenue point of view, I believe next year’s fourth quarter will see the Watch generating higher revenues than the highest quarter for the iPod. ((That was in Q4 2007 when iPod managed $4 billion.))
In terms of yearly unit sales it may take longer. The biggest year for iPod units was 2008 when about 55 million iPods shipped. Watch is now running at about 16million. If it could sustain 30% growth then it would take until 2022. 40% growth would mean 2021 and 50% 2020.
It’s not easy to predict growth but my bet remains that Watch will get there eventually becoming the third most popular Apple product. Perhaps even second.
Overtaking the iPod is quite an achievement considering that the iPod was once synonymous with Apple itself. Although Watch may overcome iPod, Apple may never be known as the Watch company. That’s perhaps for the best. I’ve noted before that Apple was once seen as the Apple II company, became the Mac company then the iPod company. Now of course it is thought of as the iPhone company though it’s no more that than it ever was any of the other things.
The above interview was conducted October 17 with Carlos Morales Editor en Jefe, Forbes Digital (Mexico).
The source questions and my answers in English are below:
How can we read the fact that the new iPhone lineup raised so little noise? There was no massive lines outside the Apple Stores and people demonstrated almost zero interest in the new models compared with the hype motivated by the iPhone 7.
I don’t know about you but I don’t like waiting in lines. I don’t think Apple considers waiting in lines to be a good user experience for its customers. Over the years Apple has been able to improve availability and online orders so that lines can be eliminated. I suggest a better way to gauge interest in new models and that would be to look at sales. Sales seem to be going up even as lines have been going down.
The iPhone 8. What do you think of the fact that the iPhone 7 is outselling the iPhone 8?
Is it a fact? I think this notion is coming from a survey of operator stores in the US over a short time period. The mix of phones has never been known and is a matter of speculation. The only data we do have is the average selling price derived by dividing the revenues by the number of units sold (and ignoring deferrals). This price set a new record during the last 12 months. Expectations are that it will increase to another record again next year. I might add that this has never been observed in the phone business as far as I know. The opposite has been the trend.
Whats the outlook for the the iPhone 8 vs the iPhone 7 and the iPhone X?
The iPhone 8 is likely to be the best selling model over the next 12 months. The iPhone X will be the best seller in the first quarter but I expect it will come second during the following quarters. The iPhone 7 will end up 3rd.
What do you think about the smartphone prices, aren't they too high? How far can they be stretched ?
Smartphone prices are very low. World-wide, average smartphones sell for less than $300. You can see a break-down by region here.
iPhone prices are, on average, more than double the average of all smartphones. Note that apple’s latest line-up also includes the cheapest iPhone ever with the SE now starting at $350.
I don’t think the average selling price will increase in 2018 globally. It will probably decrease as it has for a long time. Average iPhone prices will increase but probably only by $10 or so.
The iPhone price tiers are well understood. I published an analysis here:
More important however is that the iPhone remains priced at about $1/day, no matter the model, and as such the value users perceive is very high. The most expensive iPhone costs about 8 cents per hour of use, 1.4 cents each time you unlock it and 1 cent for ever 25 interactions you have with it (touches or taps). On a per use basis the iPhone is extraordinarily cheap. I know of no consumer product that is cheaper. This is determined partly by the intensity of use and by the high resale value (I assume 30% residual value after 2 years).
Do we really need a borderless OLED display in a smartphone? What about the face recognition technology?
Having no borders means you can get a screen that is bigger than the iPhone Plus in a phone the size of an iPhone. I think users will value getting more screen in a smaller phone. I certainly would. Having OLED means it can be curved a bit and also have nicer, truer black.
Face recognition saves time and is more secure. I don’t know another way of making the experience better for something that you do 30,000 times a year.
What do you think about the Apple Watch, which seems to be—finally—on the right track?
The Apple Watch has been on the same track for 2.5 years. I don’t see any change in that trajectory.
"Our Model 3 program is on track to start limited vehicle production in July and to steadily ramp production to exceed 5,000 vehicles per week at some point in the fourth quarter and 10,000 vehicles per week at some point in 2018.”
Overall 2018 production guidance has been 500,000 units and 1,000,000 units in 2020.
The company shipped 220 Model 3s in the July, August and September months. This is well below the expectation of 75,000 that the 2016 guidance would suggest ((100,000 to 200,000 for the second half of 2017 suggests an average of 150,000 for the six months or 75,000 per quarter)) or the 1,630 that might be suggested by the "production grows exponentially" July proclamation.
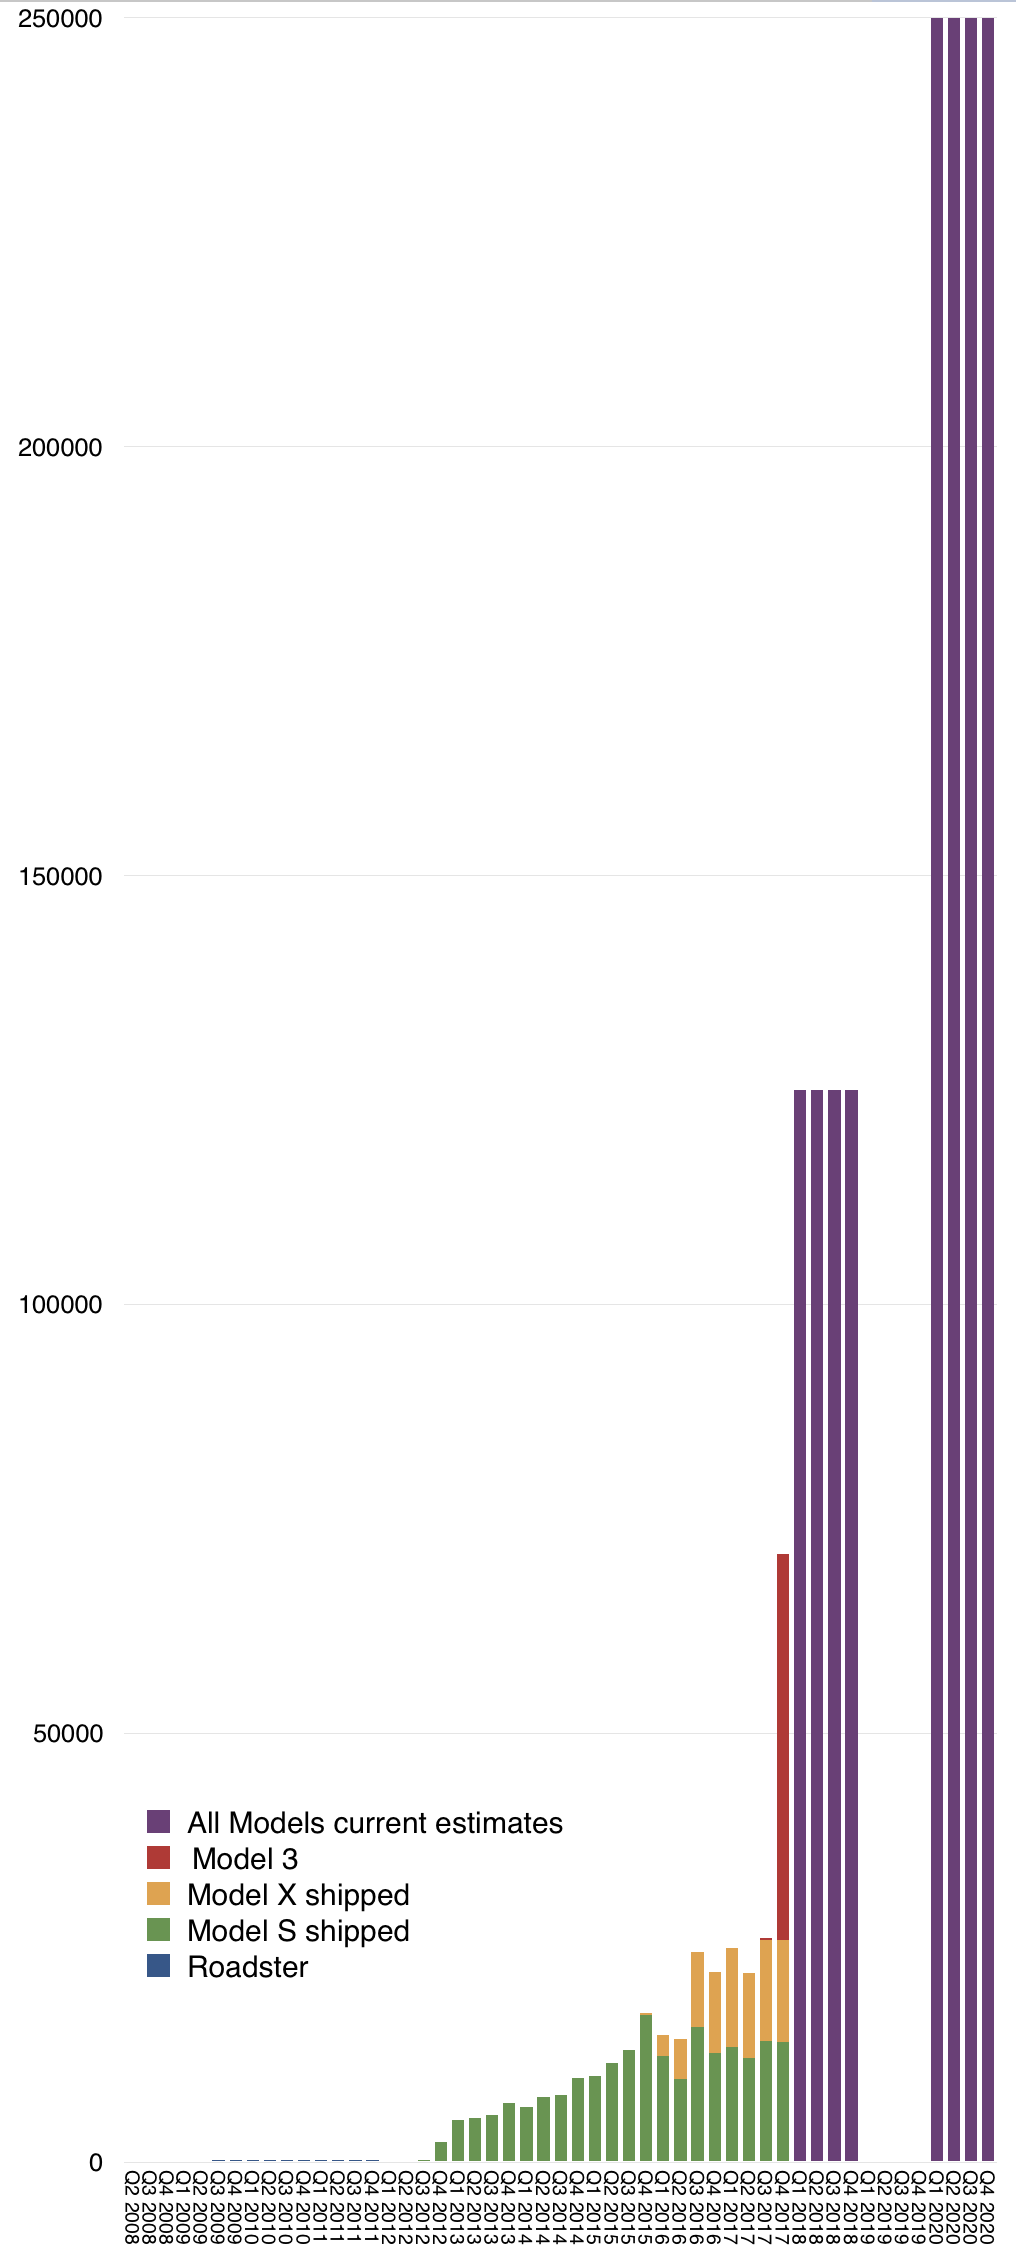
I entered the Q3 production data and kept the previous run rate predictions for Q4 and 2018 and 2020 in the following graph.
Note that the graph includes all previous shipments of Tesla cars throughout its history.
The red bar represents an estimate consisting of the sum of 10,000 Model 3 in October, 15,000 in November and 20,000 in December. This is consistent with reaching the target production of 20,000 in December.
The purple bars are distributing the planned production evenly throughout the 2018 and 2020 calendar years.
Before asking whether these predictions can be relied upon, I'd like to focus on the history of Model S and X production/shipments. Specifically the last five quarters.
Q3 2016: 24,500
Q4 2016: 22,200
Q1 2017: 25,000
Q2 2017: 22,900
Q3 2017: 25,930
Q4 2017: 25,845 ((This is an estimate based on another point of guidance: 100,000 models X and S for the 2017 year.))
Growth in this total figure has been remarkably low. Only about 4% y/y in the last quarter and sequentially the total has bounced in a narrow range.
This level (about 24,000 units/quarter on average) is a distinct plateau but it's also well above the average of the previous 4 quarters of about 15,000 units/quarter. It suggests that there was a “quantum leap” in production at the end of 2016, to a new plateau.
So the question is why, with so much pressure to produce cars to meet presumed unlimited demand, is output so limited?
To see just how limited, consider the rate of output. For the past 15 months and near future, the output is equivalent to 264 cars per day. If the Fremont factory is running three shifts, 11 cars are produced every hour. This is equivalent to a cycle time or takt time of 5.5 minutes.
This would be an tragic cycle time. Most car lines aim for run times between 1 and 2 minutes per station. For example BMW's Spartanburg plant produces 1400 units per day which yields a cycle time of 1 min. ((This assumes one line. The chassis/engine marriage step is clocked at 3 minutes so the worst case is that there are three lines running at 3 min. cycle time each.))
This measure of performance is so important that it drives the depreciation and capitalization schedule for tooling and the very lifeblood of the company: capital expenditures. An underutilized factory is a giant hole in a financial statement and destroys value as much as inventory does. Every manufacturer strives for maximum utilization and is sunk if it does not achieve a minimum threshold.
So why, after a few years of Model S production, is Tesla running at one fifth the speed of a BMW or Toyota plant? One obvious answer is that the company is not running 3 shifts but perhaps 2 or even 1. But why would they shut down the line when demand is infinite? If it is finite, is it really only 25k at most per quarter? That’s a paltry number considering the size of the market they operate in. BMW alone ships 2 million vehicles a year. Tesla X/S topping out at 100k a year suggests a serious limit to their opportunity.
Another possible explanation is that there aren't sufficient battery deliveries for continuous production. We hear about issues with battery throughput as transients that slow production. But the production data we have spans an 18 month period during which the speed has hardly budged. During this time additional battery capacity in the form of a Gigafactory has been announced.
If this giant new factory can’t reliably deliver batteries for 25k cars/quarter then how are we to believe that it can deliver for 125k units in a few months? If it's not batteries, then what? I don't know of other subsystems that are chronically constrained that we can point a finger at. Almost all other parts in a Tesla are sourced from existing supply chains.
The most likely suspect is that Tesla's S/X line is not fully operational. When you study production lines, generally they either work at a decent clip or they don't work at all. They are not designed to be dialed down to be as slow as 5 min for every 10 feet of car. It's much more likely that the line is idle for long periods of time. Perhaps even 2/3 of the time.
This is what is so mystifying about Tesla's exuberant predictions for the Model 3. The X/S line is bogged down and inefficient five years after production start but we are to believe that the Model 3 line will come to operate at >5x speed within weeks, on a new product? Maybe the X/S line is a failed experiment. Maybe the company is moving to "Version 2" and leaving the cruft in Version 1 without fixing it.
Maybe.
Tesla's asymmetric approach to automobile product development and distribution and ownership experience are key advantages but their asymmetry to functioning best practice production systems is a key disadvantage. The big competitive question is will incumbents get good at intelligent EV experiences faster than Tesla gets good at production.
Outsiders might ask "How hard can car building be?" and vote for Tesla winning this race.
There is no data on how fast an incumbent learns the EV experience delivery process, as it's never been tried before, but there is data on how fast a manufacturing company learns lean production. Those times were measured in decades.
[UPDATE]
In the week that followed this post new claims have been made on Tesla's production system by other publications.
Wards Auto published a story on problems with automating the Model 3 production line.
Wall Street Journal published a story on claims that Model 3 production was constrained by hand-building on parts of the line.
Edward Niedermeyer wrote in the Daily Kanban about regulatory documents that show limitations in production of the Model 3.
The most relevant quote to this post is the Wards claim that:
Its current production line in Fremont, CA, can’t build vehicles at [5,000 weekly] rate unless it runs two 10-hour shifts seven days a week, which is not likely for an all-new vehicle, even if everything goes smoothly. The plant presently runs two 8-hour shifts five days a week.
If this is true then the current Model S/X line is limited to about 50% of capacity or about 25 cars/working hour. This is equivalent to a takt time of 2.4 min/station. This is certainly much better than the estimated 5.5 and within a range of reasonableness, but one has to ask why is the line not operating more than half the time?
When I wrote about there being "infinite demand" for the X/S, the logic was that the X/S was still a niche product at 100k/yr and the category into which is sells is assumed to have a lot more headroom for their entry.
The observation that production is topping at 50% capacity for 18 months in a market that is quickly being targeted by competitors remains interesting to me.
You've probably heard of Jony at Apple but probably don't know about Johny.
Jony is a celebrity executive known as the face of Apple Design. Johny is the executive in charge of custom silicon and hardware technologies across Apple’s entire product line.
Under Johny's leadership, Apple has shipped 1.7 billion processors in more than 20 models and 11 generations. Currently Apple ships more microprocessors than Intel. ((Trailing 12 months’ PC shipments 265 million. Equivalent iOS devices 281 million. Not included are Apple processors in Apple TV.))
The Apple A11 Bionic processor has 4.3 billion transistors, six cores and an Apple custom GPU using a 10nm FinFET technology. Its performance appears to be almost double that of competitors and in some benchmarks exceeds the performance of current laptop PCs.
A decade after making the commitment to control its critical subsystems in its (mobile) products, Apple has come to the point where is dominates the processor space. But they have not stopped at processors. The effort now spans all manners of silicon including controllers for displays, storage, sensors and batteries. The S series in the Apple Watch the haptic T series in the MacBook, the wireless W series in AirPods are ongoing efforts. The GPU was conquered in the past year. Litigation with Qualcomm suggests the communications stack is next.
This across-the-board approach to silicon is not easy or fast or cheap. This multi-year, multi-billion dollar commitment is rooted in the Jobsian observation that the existing supplier network is not good enough for what you're driving at. Tiny EarPods, Smart Watches, Augmented Reality, Adaptive Acoustics require wrapping your arms around all parts of the problem. The integration and control it demands are in contrast to the modular approach of assembling off-the-shelf components into a good-enough configuration.
There are times and places where modules are adequate and times and places where they aren't. The decision depends on whether you are creating new experiences or new "measures of performance" vs. optimizing for cost within existing experiences or measures of performance.
The very notion of a microprocessor is a rejection of the discrete component designs that preceded it. Earlier computers had central processors made up of many discrete components. VLSI stands for Very Large Scale Integration with emphasis on Integration. As computing has progressed toward ambience and ubiquity the idea of using discrete components became normative again but that was not considered sufficient by Apple.
So while the "Silicon" in Silicon Valley has come to be seen as an anachronism, silicon development today means competitive advantage. The only problem is that it takes years, decades even to establish competence. The same duration that it took for the building of Apple as a design-centric business fronted by Jony Ive.
Apple also now needs to be understood along the dimension of silicon-centric engineering as led by Johny Srouji.
Apple is now the biggest watchmaker in the world, overtaking Rolex during the last quarter. This achievement happened less than two and a half years after Apple entered the watch market. Rolex, on the other hand, was founded in 1905, 112 years ago at a time when watches were the avant-garde of technology. Given this revelation of sales, we can test the estimates I put forward on the Apple Watch sales, shown below:
We know that Rolex produces about 1 million watches a year and we also know that Rolex had sales of $4.7 billion in 2016. The average revenue per watch ((Includes services such as repairs)) was therefore about $4,700.
My estimate has been that Apple sold about 15 million Watches in the last 12 months at an average price of about $330. This puts the Apple Watch revenue run rate at $4.9 billion, indeed above Rolex.
They may be slightly high but the news makes me feel quite comfortable in my methodology. Note also that within the last quarter Apple said sales for the Watch increased by 50%. This is also reflected in my estimate of 3 million in Q2 vs. ~2 million for 2016 Q2.
Overall, about 33 million Apple Watch units have been sold since launch and they generated about $12 billion in sales. Coupled with a 95% customer satisfaction score, altogether, this has been a great success story. But only 2.5 years in, it's still act one.
To understand the long term trajectory, it's important to qualify this product as part of another, larger story. The Watch, even with LTE, is an accessory to the iPhone. It still cannot be activated without it. Even the coverage plan is an extension to an iPhone plan. The company is careful to address it as a companion product.
But how long will that last?
It used to be necessary to first attach an iPhone to a computer to activate it. That used to be cited as a reason for the iPhone not being a "proper computer", diverting attention from what it would inevitably become. Those who clung to that thin wire as a reason not to face the future were deceived. The iPhone and the iPad now stand alone of any PC or Mac. Will the Watch cut these familial links and stand alone some day?
I think this too is inevitable. The technology trajectories are easy enough to plot. Apple has invested enormously in the silicon that goes inside the Watch and has taken it to new levels of connectivity with LTE, 85% faster WiFi, and a 70% faster processor; all with 50% better power efficiency.
These enable independent voice entry, Siri everywhere, Find My Friends, Maps, music streaming. These breakthroughs are only possible with a new W2 processor which is more powerful than the first iPhone processors.
This comparison is apt: the Watch is effectively stealing usage from the iPhone. At first it took alerts, timekeeping, and basic messaging away. Now it's taking basic phone calls and music and maybe maps.
It's fitting therefore to remember how the iPhone was launched; as a tentpole troika: A wide-screen iPod, an Internet Communicator and a Phone. Today the new Watch is a small-screen iPod, an Internet Communicator and a Phone.
So not only is the Series 3 Watch more powerful than the original iPhone but it is also poetically capable of the same tentpole jobs. But it's not just a miniature iPhone. It has a new, completely orthogonal attack on non-consumption and market creation: fitness and health. This is a key point. The iPhone was born a phone but grew up to be something completely unprecedented, unforeseen by its creators and, frankly, undescribable in the language of 2007.
The Watch was born a timepiece but it is traversing through the early iPhone and pulling in a new direction all of its own. The fact that we are talking about "Resting Rate", "Arrhythmia" and "Atrial fibrillation" at a timekeeping launch event indicates that new behaviors will follow and so will the language we'll use to describe this child-like product once it grows up.
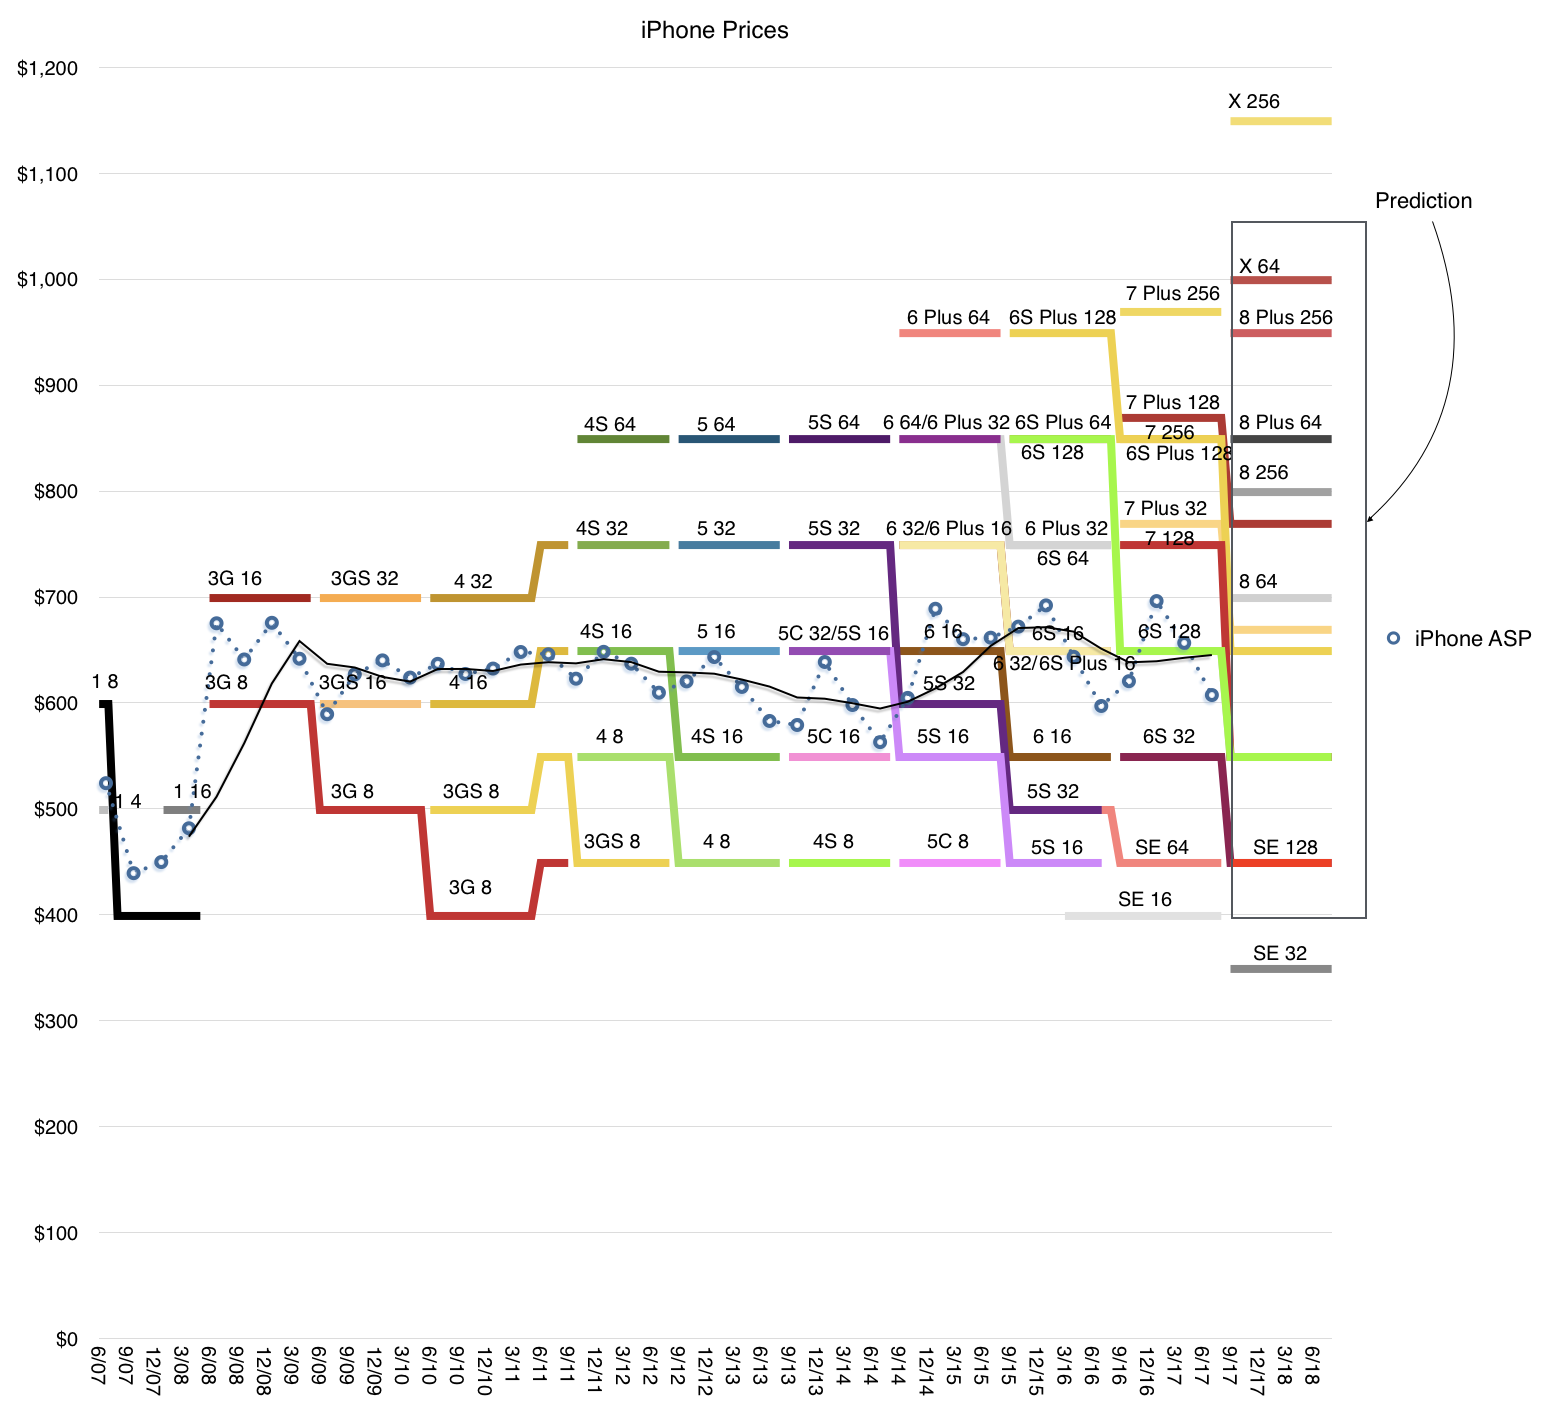
Before the iPhones 8 and X launched I made a prediction on what the iPhone would cost. I concluded that the iPhone price would not change. This is because it has never changed ((Apart from seasonality. Quarterly Minimum = $437, Quarterly maximum = $695, Quarterly Median = $631, Standard Deviation=$58)). Apple collected $767,758,000,000 for the 1,203,732,000 iPhones sold to the end of June or $ 637.8147 per phone.
Of course this is the average price and that average is on a trailing 12 months basis and measures some of the deferrals in income that exist for obscure accounting reasons.
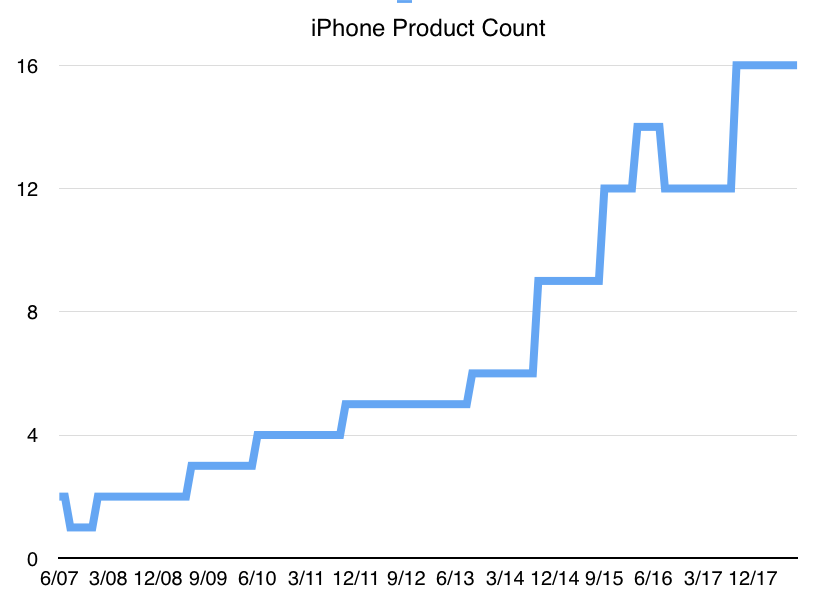
Now that the new iPhones have launched, how probable is my prediction? The first mild surprise is that the total number of phone models has increased to 16. I had no prediction on product count but did not expect the 6S and 6S Plus to remain available. The following graph shows the total number of products in the mix (excluding color variations).
The second surprise was that the iPhone SE has been upgraded in memory from 16Gb/64Gb to 32/128Gb and that the new 32Gb version is $50 cheaper than the old 16Gb. The 128Gb remains priced the same as its 64Gb predecessor.
This means that the SE 32 now occupies a new lowest price band for iPhone: $350. It's a remarkably capable phone at the lowest price for an iPhone ever. It's $100 cheaper than the 5C 8 Gb which I bought 3 years ago.
At this point my prediction looks precarious. The lowering of the lowest iPhone price could drag the mix down. Remember that historically the iPhone average selling price remained constant while the top of the range price increased. The most popular phone sold was likely to be toward the lower end and, with new buyers coming from new markets, the more affordable phones were proving very popular.
Will the improved-but-lower-priced SE bring ASP down?
Well, of course, we have to consider the action at the top of the range. The new iPhone X 64 was introduced with a $30 increase over the 7 Plus 256. However the 8 Plus 256 is priced $20 lower than its predecessor. This is something of a wash in terms of impact on average price.
In addition, the iPhone X 256 is a considerable $159 jump from the 64GB. Gaps used to be $100 between memory bands. This new increased gap is because the memory bands are now 64/256 vs. 32/128/256 in the previous generation. The memory tiers are now two and they are quite far apart (4x).
This places the top of the range at a new high, as expected, but it's a higher high. We see an $180 increase from the previous high. I had expected a more modest $80 jump which was closer to the ~$100 jumps seen three times before.
Regardless of this surge in the top, the percent of units sold at that highest point is not likely to be very significant. X at 256Gb is a great product for enthusiasts but I suspect most people who want to experience the X will comfortably settle for the iPhone X 64. ((The trick here is that Apple offers this "stretch" goal of top iPhone at a $150 premium. The number of people who will stretch is always an interesting exercise. I estimate it at less than 5%.))
The interesting action is in the middle of the pack. The meat of the increase in product mix is right in the $650 to $850 range where Apple went from 4 products to 6. And they are all highly competitive 7 and 8 iPhones. These products are made available at the $30 to $40/mo. plan rates, the sweet spot of consumer phone financing. What I call the "dollar-a-day" for an iPhone plan. Perfect for those who are holding onto 6/6Plus or earlier models and are ready for an update.
Here, I believe, is where the sales action will be concentrated. I still predict that, apart from a transient launch period burst, the ASP will stick to its 10-year trajectory of mild increases (keeping with inflation.) In other words, the iPhone will cost about $650 for another year.
This season the iPhones X will be door busters but over the whole year customers will walk out with 7 and 8 iPhones. The big year of the X will be next year, after the X+1 ships.
In summary, if you see the choice of Good, Better, Best, never underestimate the popularity of Better.
The answer, regardless of when you ask, is: The same as the current iPhone.
Of course, this is the answer to the question of what will the average new iPhone cost. The average selling price (which combines the revenues and the volumes of all units sold and is reported every quarter) has not varied very much since early 2008. To the degree that there is variance (between $600 and $700) it is due mostly to seasonality and reflects a mix of more expensive units during the launch quarters and a cheaper units during later periods when the product is older and due for an update.
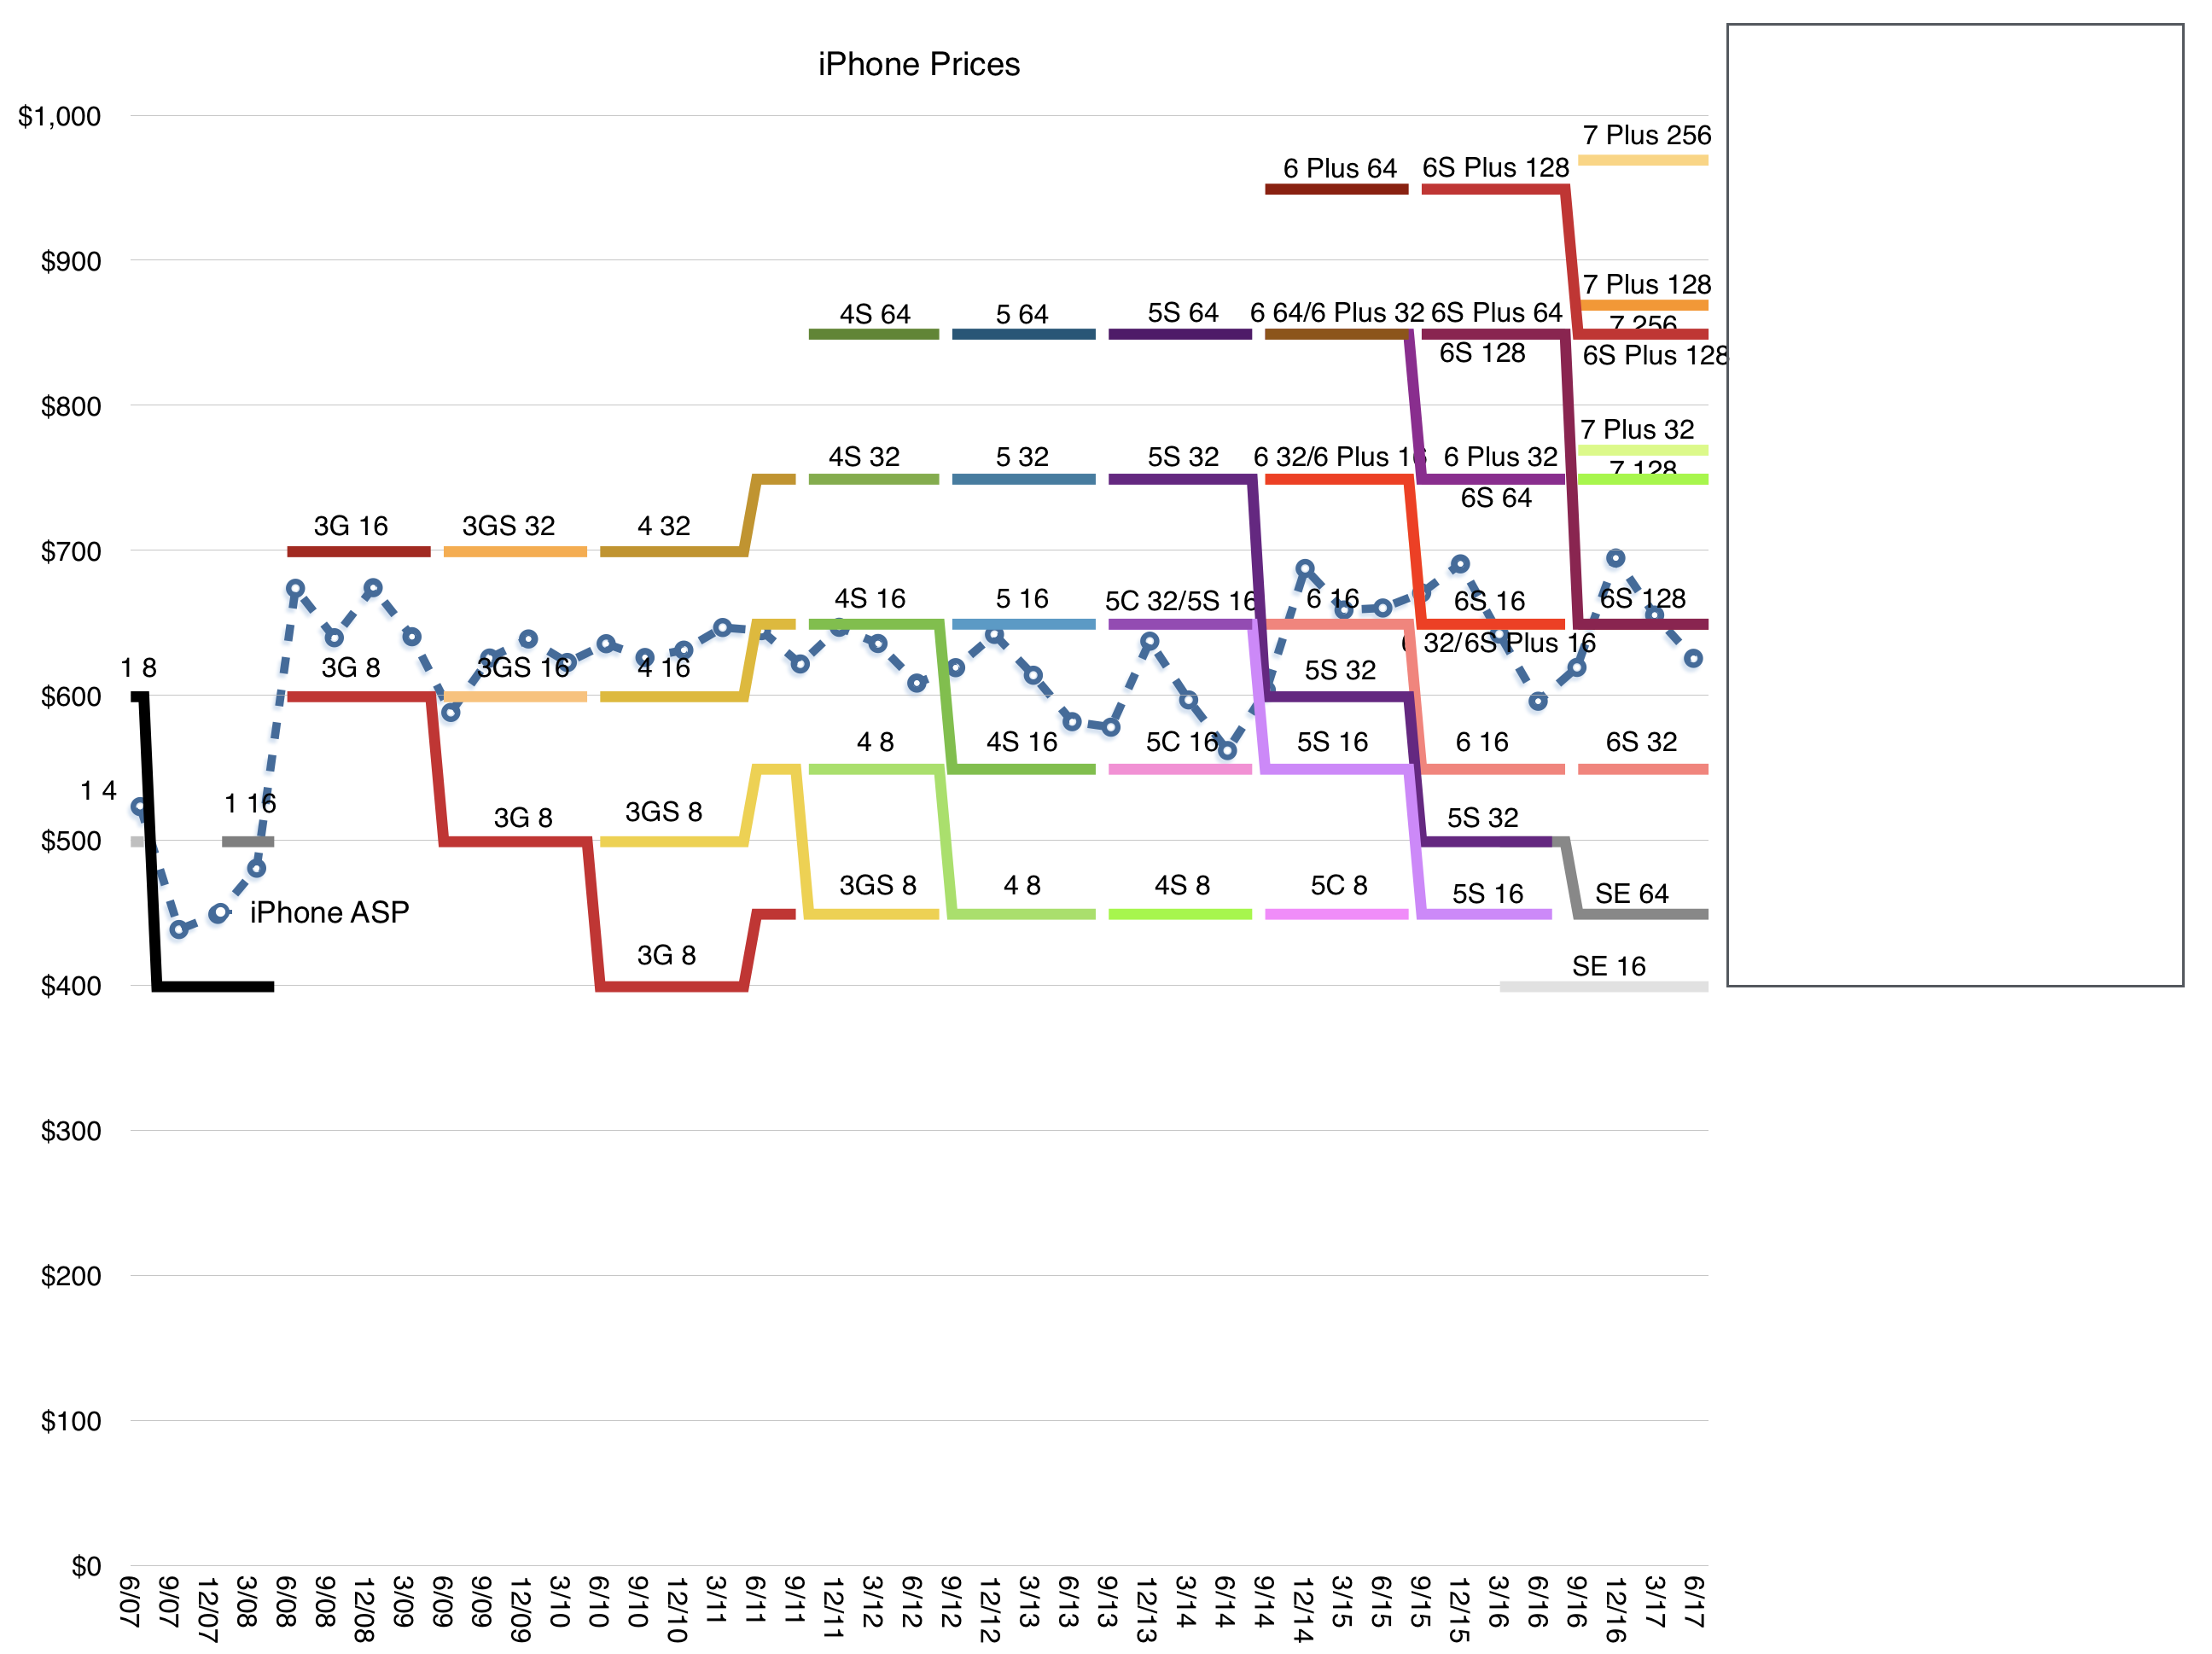
The graph below shows the average selling price as a dashed line and the corresponding prices of individual product variants available for sale in the US during the same time frame. ((Prices outside the US vary depending on duties, taxes and currency hedging but generally are based on the US price))
The graph shows a high degree of consistency of pattern: Every year a new iPhone is launched which replaces the one launched the year before. The older product is still offered at a reduced price. Price brackets are very firm and set at fixed intervals about $100 apart.
A few minor changes in pattern over the years can be observed:
The original iPhone price changed due to a shift in subsidy model shortly after launch.
An increase of $50 mid-2011 when the iPhone became available unlocked.
Every three years a new, higher, price bracket is introduced, with a doubling of maximum memory capacity.
The iPhone SE was introduced at a slightly lower price.
The last year saw a slight increase in the highest price.
The overall pattern looks like a staircase with a widening price range where the lowest price remains constant and the upper price rises every three years by $100.
The "floor" of the range is a consistent $400 while the "ceiling" has expanded from $700 to about $950.
This year's ceiling is due for the fourth leg up and if the pattern persists, we should expect it to reach $1100.
This iPhone staircase has been built over 10 years and I don't see it changing over the next three. I therefore drew the blank box over what I thought would be the price range from now until late 2020.
This is what I call the staircase model of Apple pricing. The staircase model must be understood in combination with the flat iPhone average price as the product matures.
As the product matures the user base grows (to nearly 1 billion today). Later buyers will opt for the lower price points, but the availability of higher, more aspirational models (sustained by the brand) means that a minority will gravitate upward, mainly because they can. This ensures that although the median and mode of the price trend downward, the average price stays the same.
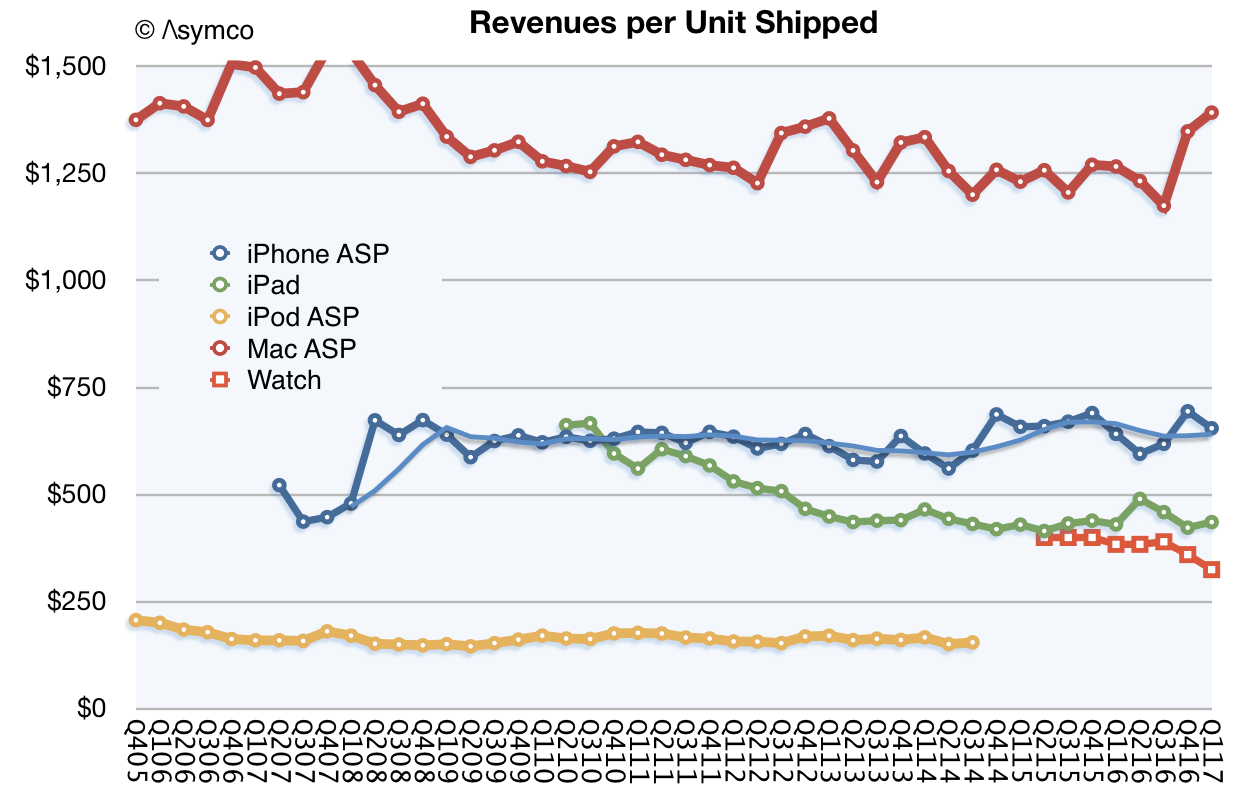
The flatness of iPhone pricing is also to be understood in combination with the flatness of Mac, iPod and iPad average pricing (shown below)
The technique of preservation of average price seems to be in effect across Apple. In other words, the evidence suggests that Apple prefers to keep average pricing for all products constant. Individual variants are priced so that, as the category matures, the changing mix leads to consistency in price ownership.
Thus the iPhone can be seen as controlling the $650 point, the Mac $1200, the iPod $200 and the iPad $450. This pricing signals the product's value and the value of the brand.
The signaling is not just to buyers but also to competitors. Ownership of price forces competitors to occupy adjacent brackets. This process begins at launch: the new Apple product is introduced in what is perceived as a premium stratum ((See for example the pricing of the new HomePod)) thus the reaction from competitors is to "undercut" it. But, as Apple climbs the price staircase, preserving the floor, it keeps competitors bunched up at the bottom. Competing in the same brackets with Apple is futile as other brands can't sustain the perceived premium position.
The result is a remarkable consistency of average pricing which, coupled with a remarkable consistency of competitive positioning, coupled with a remarkable consistency of customer satisfaction and loyalty, leads to a remarkable predictability of cash flows and ability to invest in new product creation..
Apple is thus quite easily understood as a remarkably consistent consumer products business. The only surprise that remains is how long it takes for that understanding to propagate.
Apple reports second calendar quarter results in about a week. I propose the following estimates:
Fiscal Q3 2017: Rev ($B) 45.321 EPS ($) 1.62 iPhone (units) 41 million iPad (units) 9.8 million Mac (units) 4.35 million Watch (units) 2.5 million Services ($) 7.2 billion Other products ($) 2.6 billion Gross margin (%) 38.4
The revenue estimate is visualized in relation to guidance (revenue between $43.5 billion and $45.5 billion) and shown in the context of previous actual revenues below:p
The estimates are also consistent with additional guidance provided:
Gross margin between 37.5% and 38.5%
Operating expenses between $6.6 billion and $6.7 billion
Other income/(expense) of $450 million
Tax rate of 25.5%
The estimates (and guidance) suggest modest growth of 7% in revenues and 13.7% EPS. The predictability of the quarter suggests that attention will mostly be focused on guidance for the next quarter.
Expectations can vary quite a bit because of the effects of a new launch. The product mix, pricing and timing are all unknown at this time.
What is known however is that the customer base for Apple is increasing and loyalty is higher than ever. What I sense, coming from very few data points, is that there are more iPhones in use than ever before. A few years ago when the market was less saturated it was easy to assume that commodity Android phones and tablets would surge and swamp iPhone/iOS usage.
This has not happened, indeed the data suggests that iOS usage is stronger than ever and that there are many more "switchers" moving from Android to iOS than vice-versa.
This may surprise some but if we look at the PC market, a similar phenomenon has been taking place for years. Mac usage grows and Macs are more visible and valuable than PCs.
It's important to note that in the latter, post saturation stages, the markets for both phones and computers are increasingly driven by brand value. This resistance to commoditization is due to buyers' perceptions of quality moving beyond utility and of the prioritization by buyers of new measures of performance. These new measures defy measurement.
Much of what is therefore required of market analysts is intuition.
From the way Apple reports its revenues you might think that the company has several operating segments. There are the iPhone, the Mac, the iPad for which units and revenues are reported. Then there are Services and Other Products for which we have revenues only.
Services is a collection of all non-hardware revenues and is (finally) being recognized as a non-trivial business. With reported revenues of $26.6 billion in the last twelve months, it's big enough to be a Fortune 100 company and set to double in four years. ((Although a non-zero business, the valuation of Services continues to confound observers who cannot separate it from the hardware businesses it attaches to--which themselves are considered near commodity value--thus paradoxically valuing the overlying asset of Services near or precisely at zero. Incidentally, Facebook is Fortune 98 at $27.3 billion and it is also one of the top 5 largest business by market capitalization.))
That leaves "Other Products" which now becomes the revenue segment that is "most likely to be ignored." This segment had revenues of only about $11.5 billion in the last 12 months which would place it at only a Fortune 245 ranking, equivalent to a Toys "R" Us or Biogen. How should we value Other Products?
Other includes many hardware products including iPod, Apple TV, Beats, Apple Watch, AirPods and, soon, HomePod. Each is a significant product, with Watch probably the largest single contributor. But since we don't have specific unit numbers, we are left guessing at the contribution of each.
The Watch itself has been a point of scrutiny as it could be initially teased out of the mix through an observation of the before-and-after launch vs. trend-line as shown below:
This separation of Watch became harder to discern after the launch of AirPods. Though they are still very hard to obtain, they might be "moving the needle" by now with a contribution that would muddy the Other category further. Same with updated Beats headphones.
This separation will be harder still with the launch of HomePod later this year. This product is priced at a point similar to the Watch and the quantities sold will be very hard to estimate without Apple's revealing of actuals.
Fundamentally however, all the "Other products" will have a common relationship to the iOS and MacOS hardware: attachment to and integration with a "parent" platform. Apple TV might be stand-alone but I strongly doubt there are many sold into offices or households which don't have iOS usage.
This means that "Other Products" are very similar to "Services" in that there is a dependency on a primary platform and, as it has been argued, they are therefore fragile. If the core platform declines then the Services and Other Products decline as well.
Given this dependency it makes little sense to carve these categories out as separate businesses. They cannot stand alone. They are very much the "children" of the parent platforms.
This is why it's assumed that Services, (a Fortune 100 company) and Other Products (a Fortune 250 company) can be discounted to zero. By focusing attention on the iPhone one can capture all the essential value of Apple. This is in contrast to the "sum-of-parts" valuation that could be applied to a set of independent business units in other companies.
And yet I started this discussion with the point that you might be tempted to look at Apple on the basis of these reported revenue segments. The choice of what Apple reports is arbitrary. It could report no segment revenues at all and publish just one revenue number. This is roughly what Google Amazon and Facebook do. Or it could report segments in some other way. For instance, app store revenues and AirPods could be reported as part of "The iPhone Division". Or maybe it could bundle all iOS devices and services and accessories into another segment called "The iOS Group". Or it could create a "Devices group" and a "Personal Computing" group. Microsoft famously shuffles its revenues into creative segments based on various organizational structures or choice of what it wants to project as its focus.
There is no limit to the ways Apple could slice revenues into segments. The reason Apple does it the way they do is mostly due to historical reasons. The company used to report the iPod separately as a segment but it no longer does. It also used to report Software separately, because, presumably, it charged for it but now it no longer does. It also separated laptops or portables from desktops.
The current reporting system is tempting us to draw certain "business unit" conclusions. These boundaries are illusions because Apple does not have business units. It has only one Profit and Loss statement (P/L) and is organized functionally. There is no "head of iPhone" or "head of Mac" responsible for each siloed revenue and cost structure. Instead, the entire business should be seen as a whole because it is managed as a whole.
This is easily evident in how the products are designed and marketed and how they are engineered. The iPhone may spawn AirPods and AirPods may have no value outside the iPhone but the iPhone is valuable precisely because it has AirPods and Apps and Music and iCloud. And Apple TV, and HomePod and whatever comes next. The reason the iPhone can be sold at three times the price of competitor products is because of the Services and Other Products and iPad and Mac symbiosis. This integration drives the satisfaction, loyalty, price and brand value. There there are the Apple Stores and the launch events and the countless details that make up the ownership experience.
The fact is that you can't slice and dice Apple.
There is one Apple and it must be analyzed as a unitary entity. That analysis is therefore difficult. It is easy to pick up the numbers given and study them in isolation. The iPhone, the iPad, the Mac. We all do that.. However we miss a great deal in doing that.
The lesson is that data we obtain leads us to see something but it also blinds us by taking attention away from what we cannot see. All data lies by omission. That which is left unmeasured may be where all the truth lies.
The App Store is almost 9 years old. In that time it has generated about $100 billion in revenues, of which about $70 billion has been passed on to developers and $30 billion was kept by Apple. It's very likely that running the App Store for 9 years did not cost $30 billion so, if it were an independent "business unit" it would probably have been and still be quite profitable.
But Apple does not run "business units" with separate Profit and Loss statements. The App Store is a part of Services which is an amalgamation of non-hardware sources of revenues but that does not mean it's a business. The purpose of Services isn't to turn a profit or define its value through some metric of financial performance.
The purpose of Services is to make the experience for the Apple user better. The combination of good experiences allows Apple to be perceived as a valuable brand and that allows it to obtain consistently above-average profitability through pricing power. I like to emphasize that the iPhone at over $600 in average price is more than twice the average price of all the other smartphones and captures over 90% of all available profits.
This is something that remains after a decade and indeed the price is rising in the face of overall price erosion, all without a decrease in volumes. The sustainability of this exceptionalism is due to no one single thing. It's due to the persistence across all the things Apple does: product, stores, software and services and many other details too numerous to count.
The result is a large and expanding base of satisfied customers and a large and expanding base of partners both in hardware and software and services. The WWDC event this year showed how the ecosystem of Apple is booming with over 3 million new developers and Keynote screenfuls of partnerships. All this makes for a complex picture but it's a real picture.
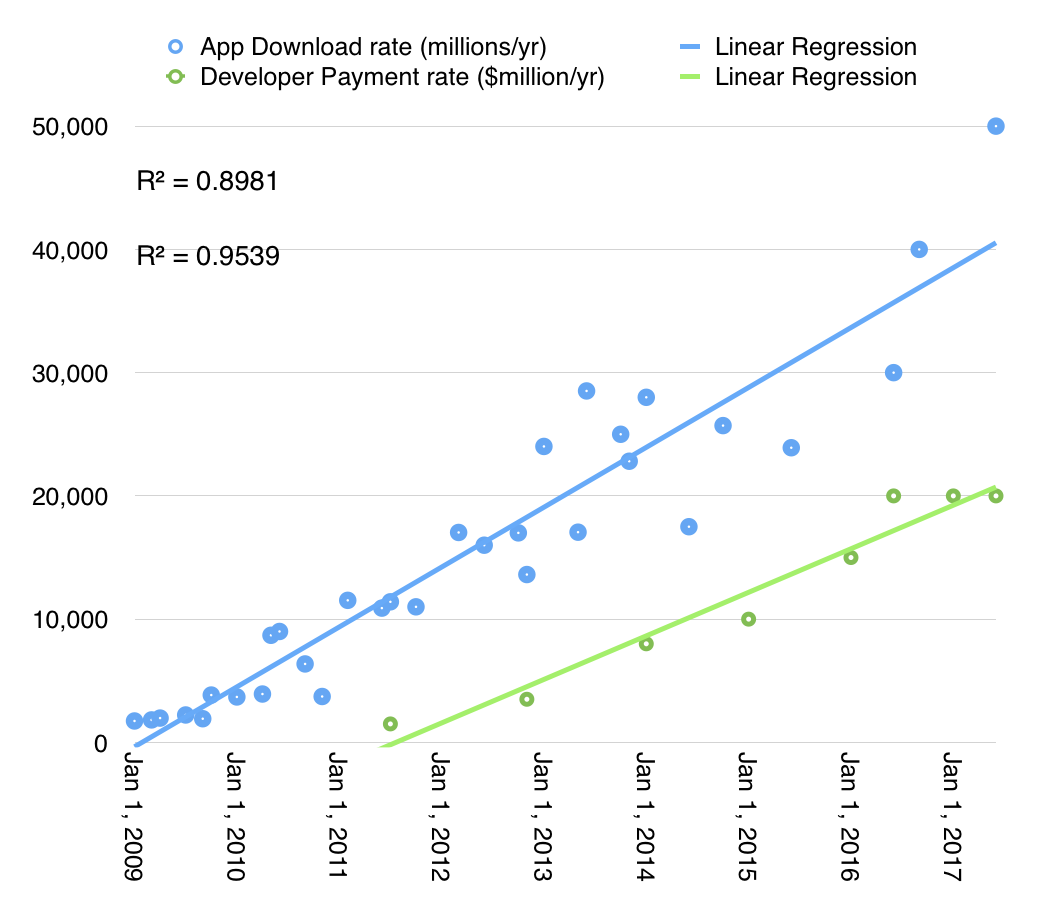
The latest numbers on Services try to tell this story: 180 billion App downloads from 500 million App store weekly visitors. The download rate is accelerating as shown in the following graph:
The revenue or payment rates can also be shown as accelerating though at a different rate. In both cases, the story of apps is not yet over, regardless of commentary to the contrary. Much of this growth comes from new markets like China and as India joins the iOS world, there is yet more opportunity emerging.
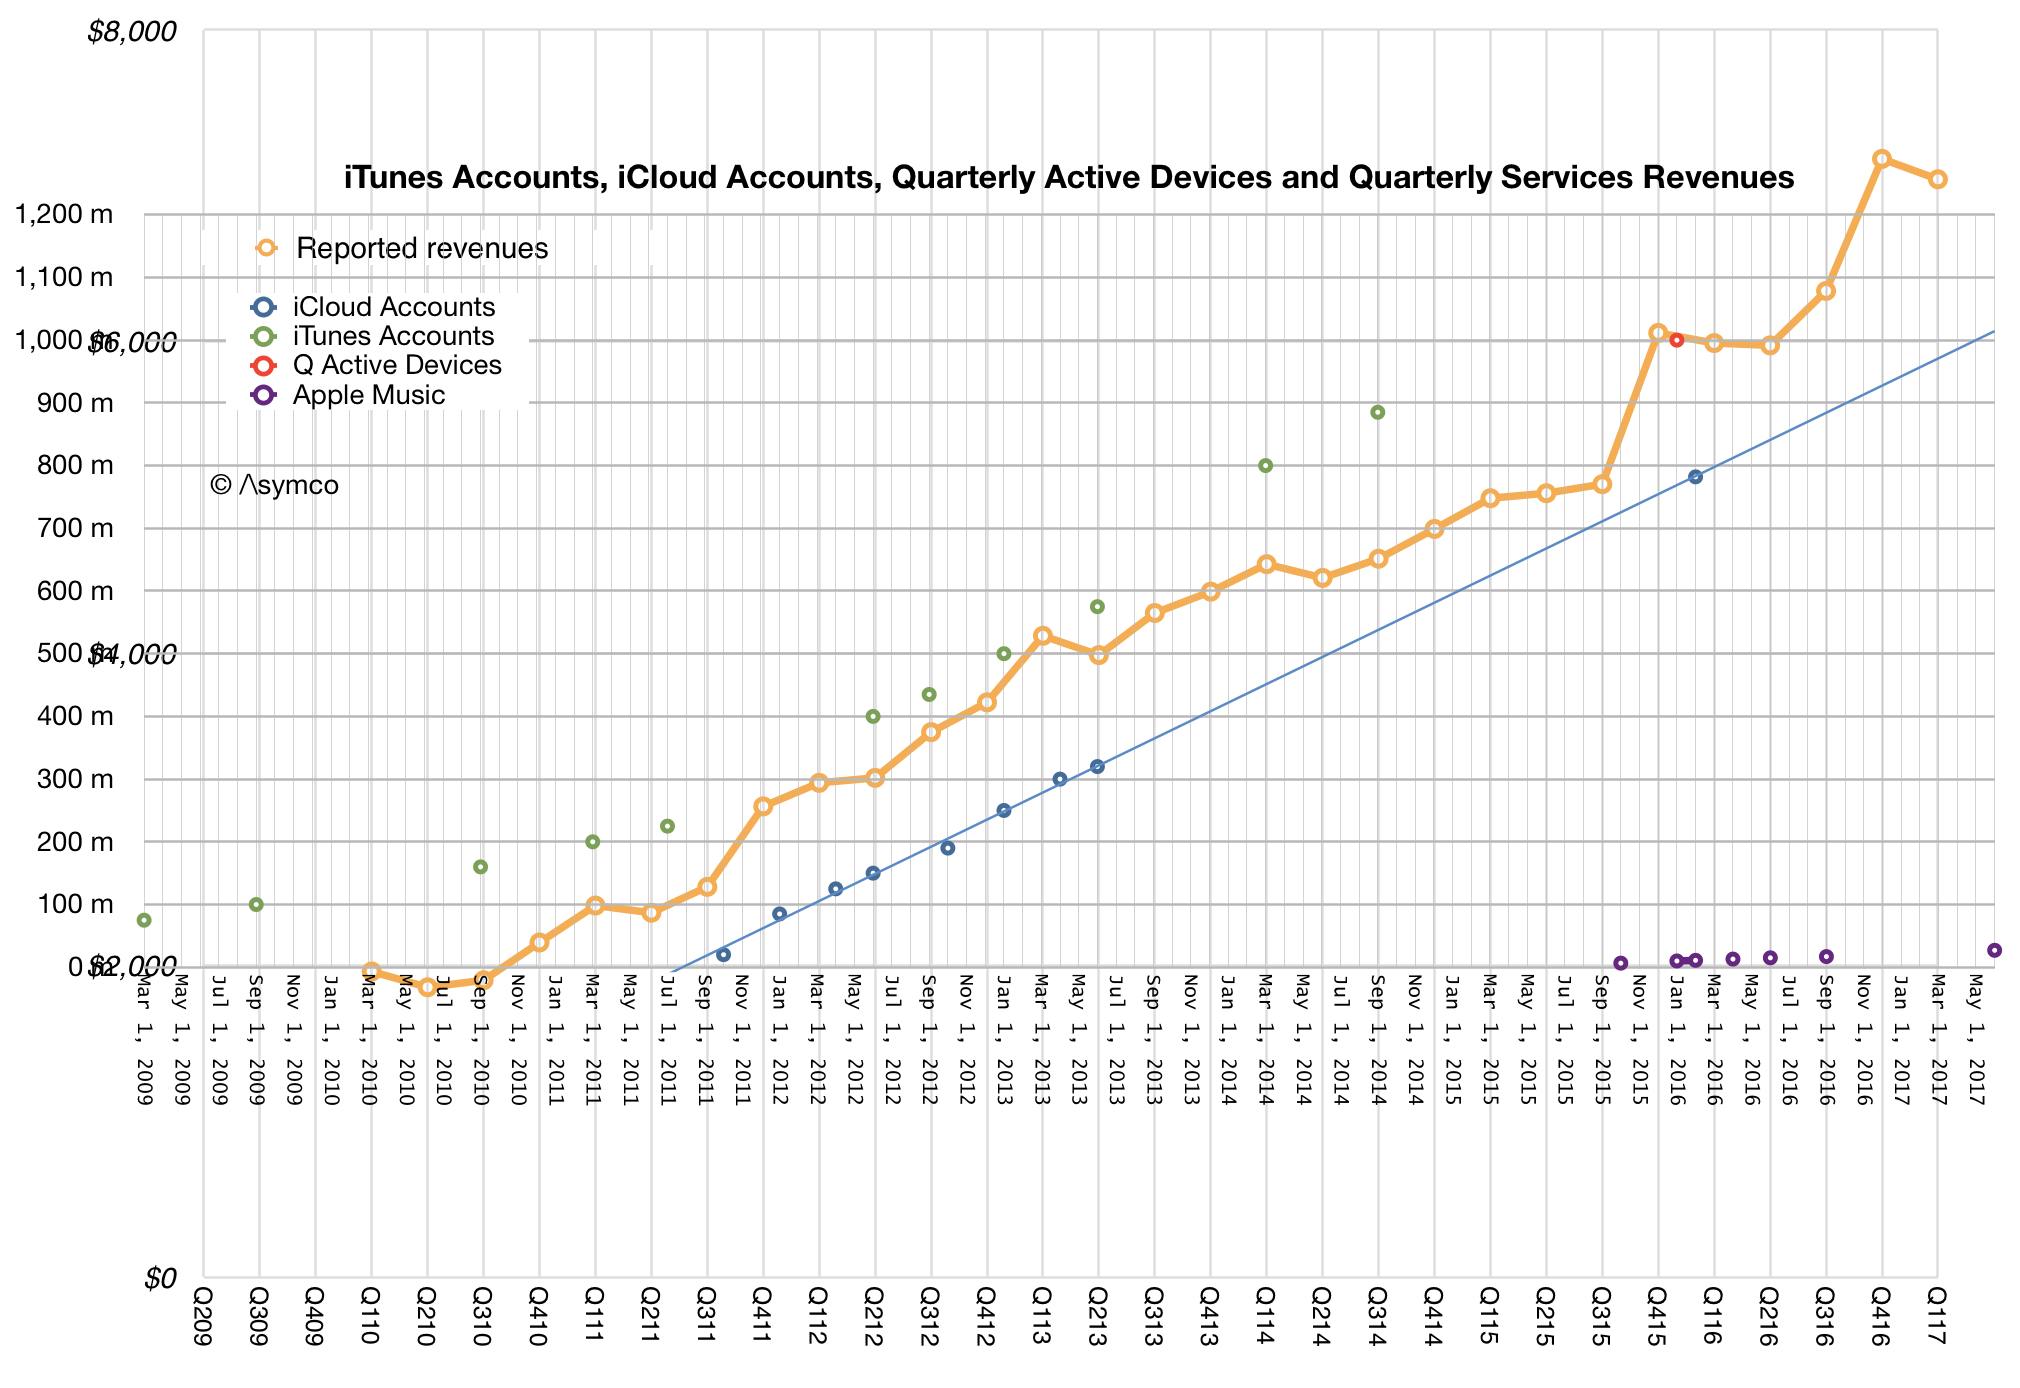
This enables part of the story of Services which can be tracked with several other metrics: reported revenues, iCloud accounts, active devices, and iTunes accounts are highly correlated.
The patterns after a decade are remarkably consistent. One would have thought that with mobile saturation in advanced markets, the content story would be told through horizontal lines. What we still see is the same slopes we've seen since the earliest days.
But the biggest story at WWDC was the re-design of the App Store as a curated content market. The changes are profound: discovery, curation and the surfacing of content have been revamped. It's hard to predict the implications of this but one of the indications of direction was the separation of "Games" from "Apps". This is a jarring idea since if all Apps are content, what makes Games different from other Apps? Is this a genre elevated to a new medium?
I can't yet get a sense of where this is heading, if anywhere, but the remarkable story of Apps is that it's still an ongoing story. We may be on chapter 2 and we can't predict how many chapters remain.
Keep an eye on Apps and Services and developers. They are not lagging indicators of success for Apple. They are very much leading.
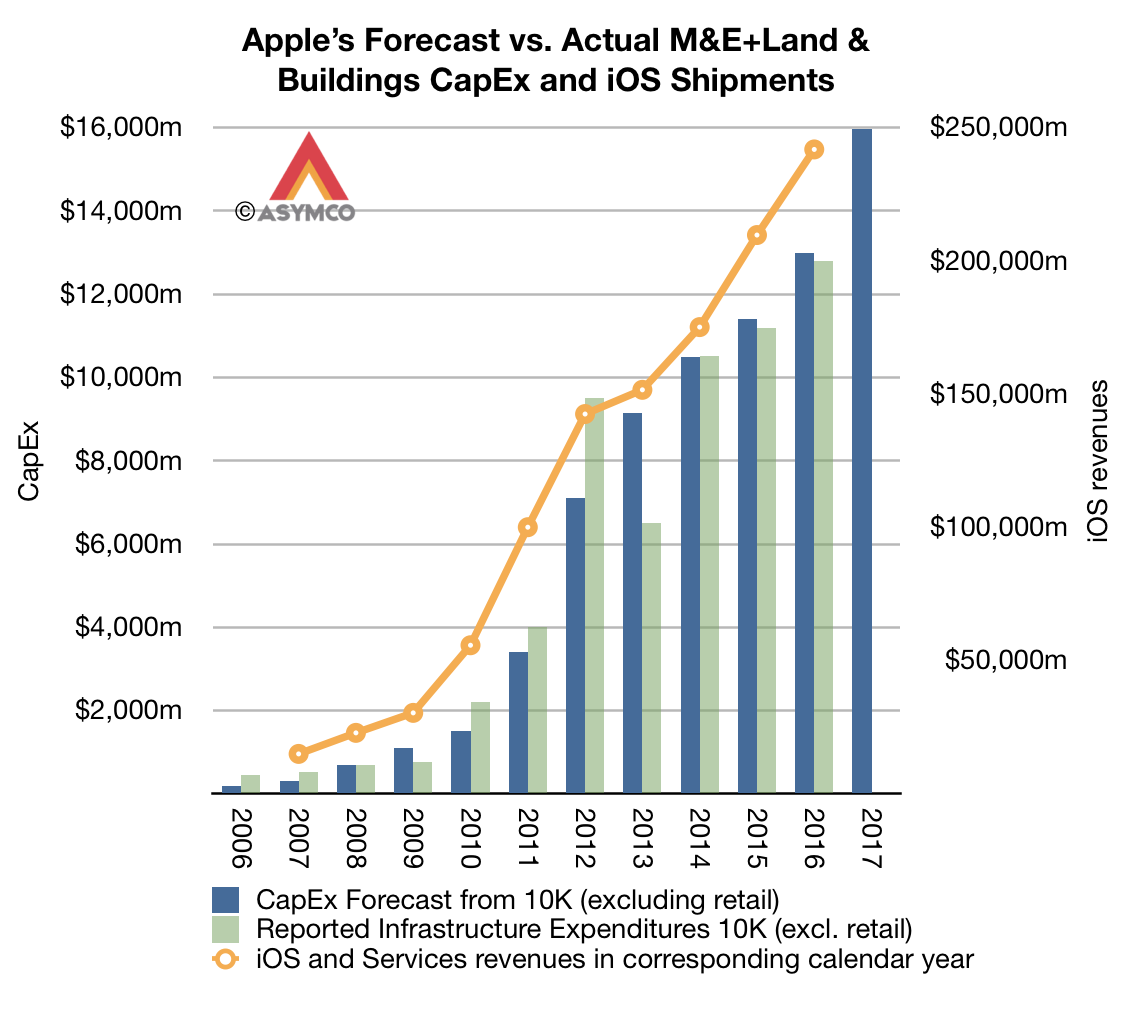
Predicting Apple's yearly revenues has been fairly easy. The following graph shows the relationship between budgeted spending on Machinery, Equipment, Internal-use software, Land & Buildings and the shipment of iOS device revenues.
The company conveniently publishes a full-year forecast of these expenditures every fiscal year so by October we know roughly how sales will be during the following year. This pattern has held for 10 years so there is little uncertainty about the 11th year of iOS devices.
Although the two are not very tightly coupled, there is a causal link between them: spending on machinery and equipment for production leads to more production which leads to more sales (assuming prices are stable--which they are).
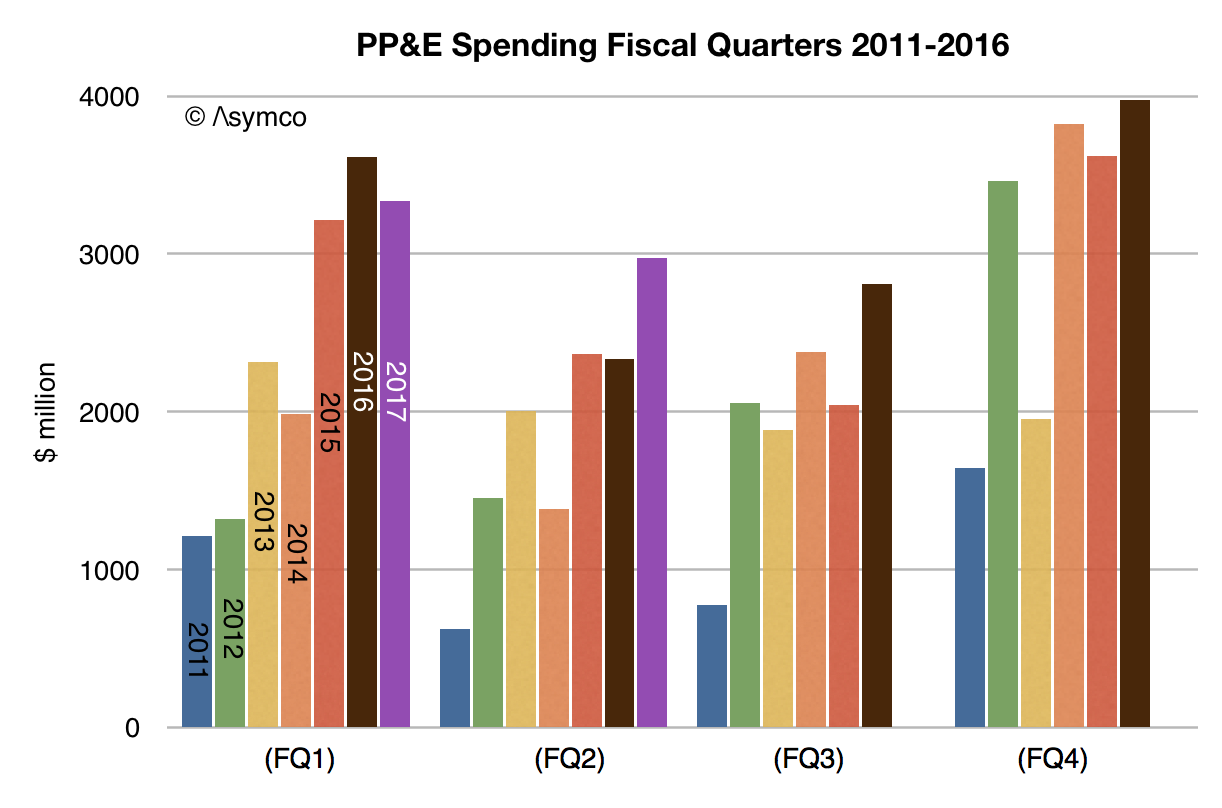
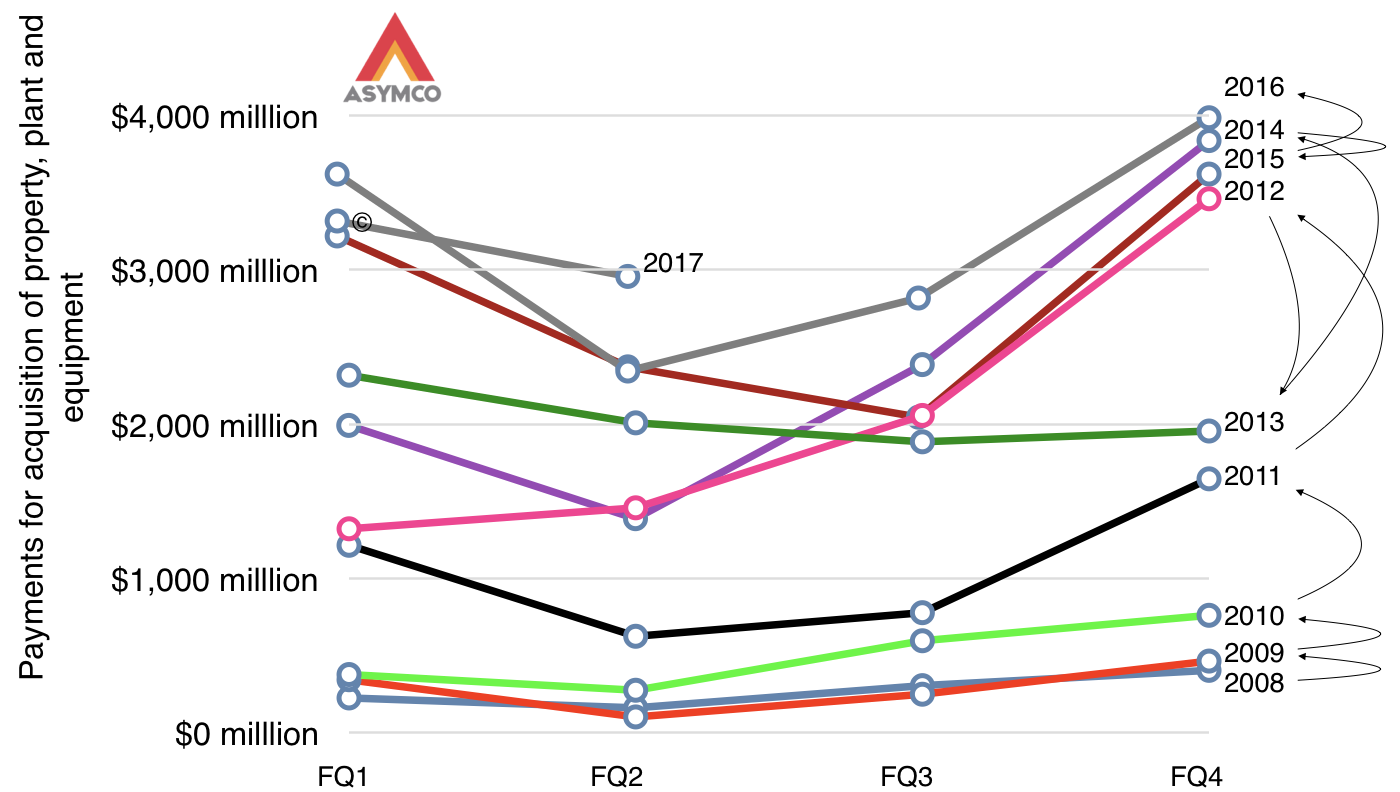
We are, as of the time of writing, half-way through a fiscal year and the quarterly spending can be inspected for any surprises. None are evident as the second fiscal year (first calendar quarter of 2017) shows a new high in capital spending at nearly $3 billion, placing us on track for the surge into the production of the new iPhone (and iPads.)
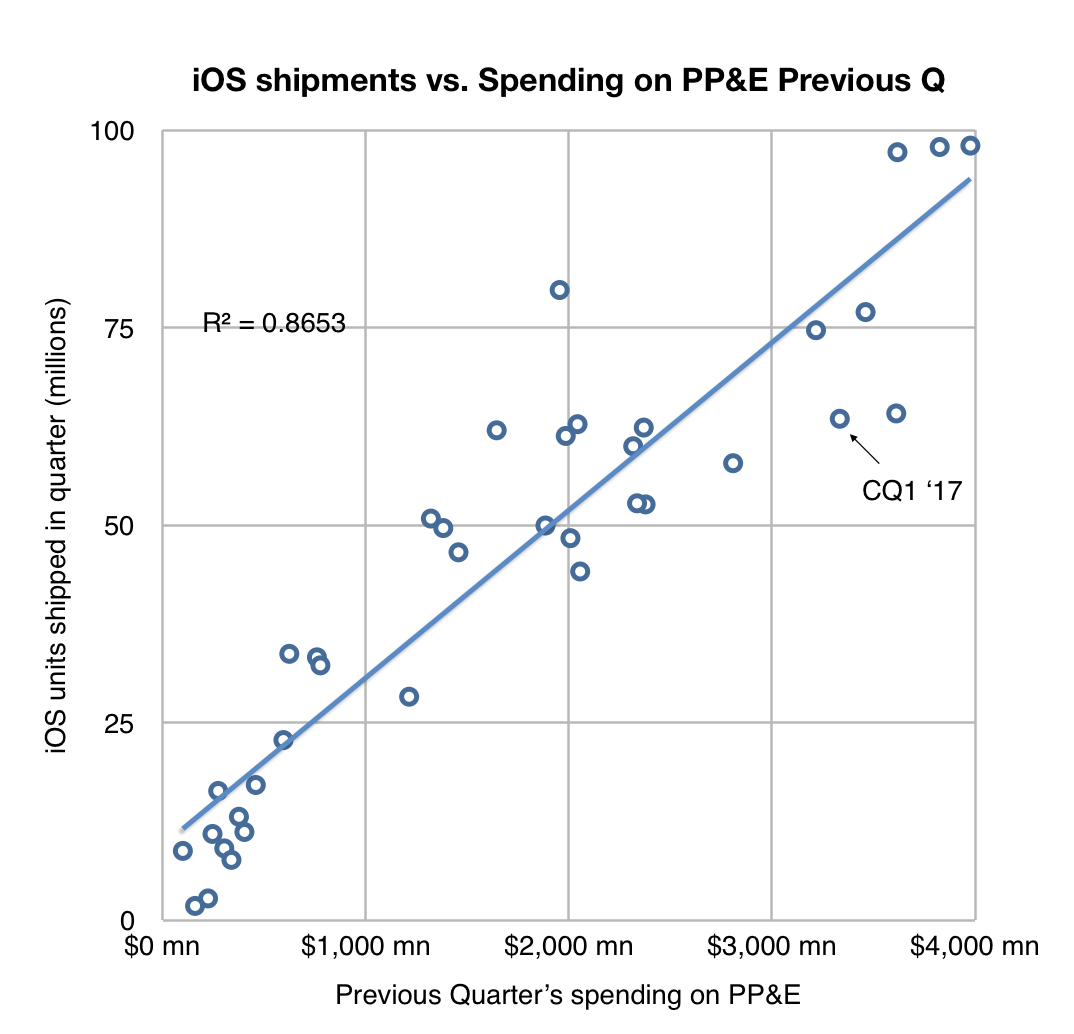
The quarterly relationship between sales and spending is less precise as equipment buying is "front-loaded" into a production cycle but there is a strong correlation nonetheless.
When looking through the data, quarter after quarter, year after year, there is a consistency and reliability to the spending/revenue relationship which implies, to me at least, a high degree of certainty.
This predictability, however, has not detracted from the volatility in Apple's share price--an instrument designed to embody precisely this prediction.
Apple's share price continues to see swings of more than 70% in any given 52 week period. In the latest 52 week period the shares traded between $89.47 and $154.88, a 73% swing.100% is not unheard of. Incidentally, S&P 500 volatility ranges around 45%. Apple is by far the largest company in the world and fairly old by large company standards. It should attract a certain premium of stability.
And yet it doesn't. Skepticism around the company is continuously evident. It's in the headlines written every day which concoct convoluted reasons to doubt future performance. It's in the conversations I have with investors who question the tiniest of details in the design of a product (like headphone jack or home butto) in order to gauge their impact on the survival of the firm. It's in the continuous parade of "disruptive entrants" or "established giants" ready to knock the company off its perch by virtue of simply existing.
Perhaps the panic it induces in investors with its reliable profits is Apple's most predictable attribute.