Asymco

Asymmetric Intelligence

Theory

  1. Hollywood by the numbers

    Research · 73 comments

    It's perhaps fitting that an industry that produces illusions is in itself an illusion. The absence of public scrutiny of its finances and business model leads to a lot of myths or misconceptions. Some of these are discussed anecdotally in books and other works[1], but the absence of data makes the anecdotal evidence unsatisfying to an analyst.

    What if we could find patterns in data about the industry to confirm or deny these oral histories? Fortunately some data actually exists. There are collections of data about movies released and some of the attributes of these releases such as box office receipts, theaters opening, budgets (sparsely), and distributors. This data is typically used for marketing purposes to celebrate the "hits" and thus entice more people to see the movies.

    However, other information can also be obtained through analysis of the data. In fact, a rather compelling story can be told. That's the purpose of this post. Our story will be expanded over time but this first draft should be enough to allow a discussion to begin. The story is built in four sub-stories:

    1. Drama / Comedy vs. Adventure / Fantasy: Why the Ancient Greeks had it all wrong.
    2. The magic of summertime: Market access and school schedules
    3. The perpetual incumbency: What happens to Hollywood startups
    4. The Popcorn economy: The peculiar power of theaters in an age of television

    These stories were the result of observations in data alone. We have no first-hand knowledge of the industry and have only used basic software tools to seek out patterns in public data[1].

    The data set includes approximately 12,000 titles released between 1975 and present with various degree of completeness. Some of these years are not completely populated and some data is undoubtedly in error. However the large sample should offer enough substance for patterns to emerge in spite of this.

    Drama / Comedy vs. Adventure / Fantasy: Why the Ancient Greeks had it all wrong

    Storytelling has not changed throughout history. The same types of stories affect audiences the same way since stories were first told. The earliest known "genres" were tragedy and comedy and they are still seen as the bedrock of theater today. The same is true for movies. The following bar chart shows the distribution of genres as cited by movies over our data set.
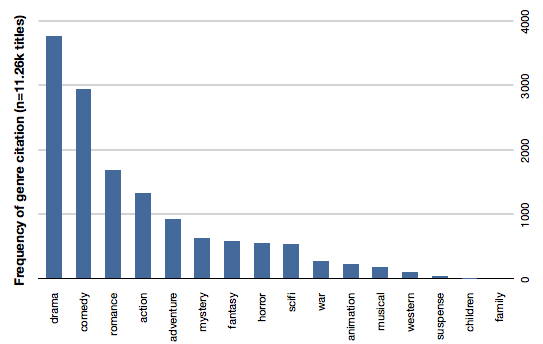
    Drama and comedy are about 50% of all movies made. If we add romance they are 60% of cited genres. This is understandable given the history of theater. However the profitability (or revenue potential) of those genres is not as strong as Action, Adventure and Fantasy. The following chart shows the same count of genre citation but only for movies grossing over $200 million (which we chose to call "blockbusters").
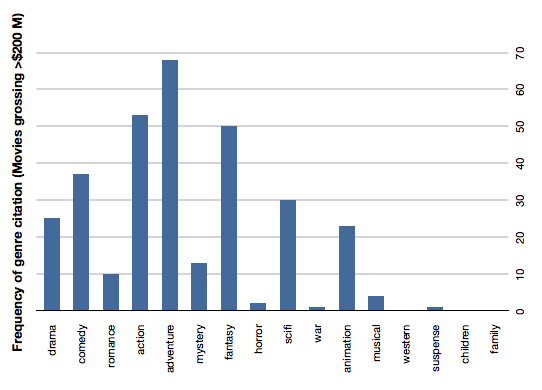
    Action, adventure and fantasy handily beat Comedy and even SciFi beats drama. Romance, musicals and and mystery genres typically associated with female audiences are very rarely successful as blockbusters. The overall data is shown in the following table. The rows represent gross revenues and the columns genres cited ranked in order of frequency. One can easily observe the density of low earning drama and comedy (grey colored) vs. the more lucrative instances of fantasy and adventure. These male-dominated genres have consistent success into middle, high and very high revenue tiers.
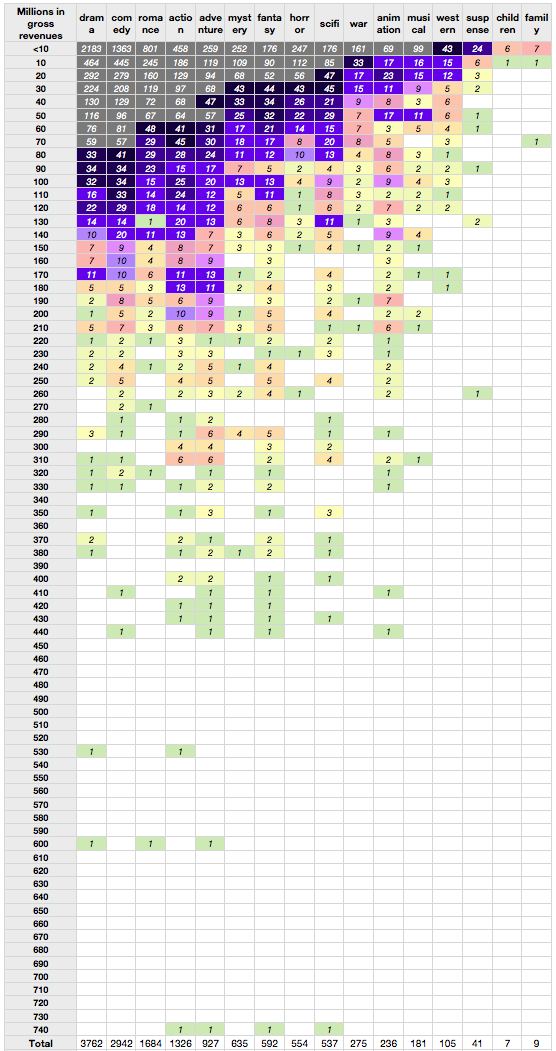
    The reason for this blockbuster attention to action and adventure is probably the prevailing theater-going audience demographic: adolescent males. The industry still produces the classic genres but less profitably than what the current targeted markets.

    Indeed, these genres were very uncommon in eras predating the late 1970s. More "adult-oriented" movies like romance (Gone with the Wind), musicals (The Sound of Music) and epic movies (Ben Hur, The Ten Comandments) were common in the "golden age" of Hollywood. As we'll see in the next section, the age of the audience is a now driving more than just genre selection.

    The magic of summertime: Market access and school schedules

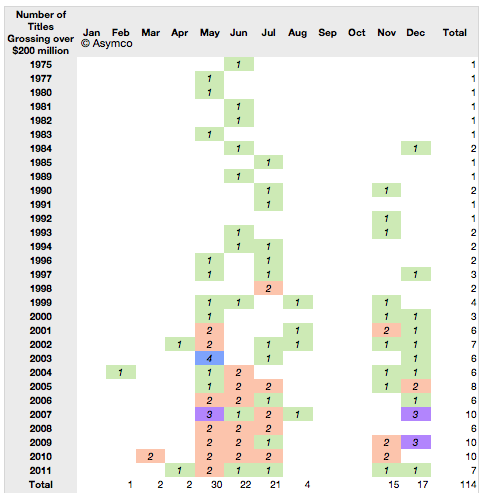
    Using the word "Summer" before "Blockbuster" has become almost redundant. What is less understood is that watching movies in the summer is rather a new idea. It started effectively with Jaws in 1975  and ever since major film studios have planned their annual marketing around a summer schedule. There is clear evidence for this in the data. Here is a table showing the blockbuster release months since 1975. (The number of titles grossing over $200 million and the months in which they were released).
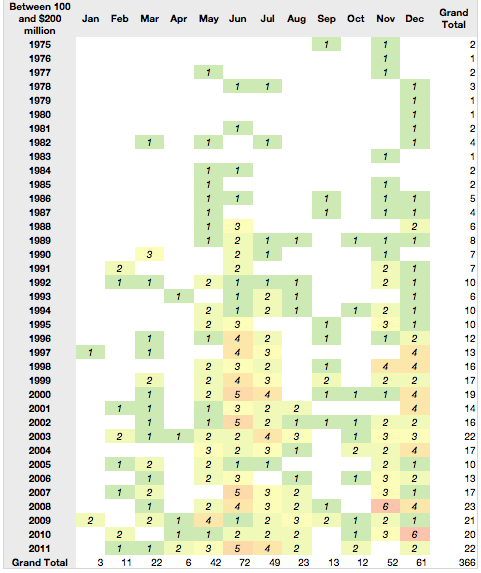
    The same pattern repeats for the next tier of highly successful movies--those grossing between $100 and $200 million.
    But what about the less successful movies? Those earning less than $50 million actually show a counter-success pattern.
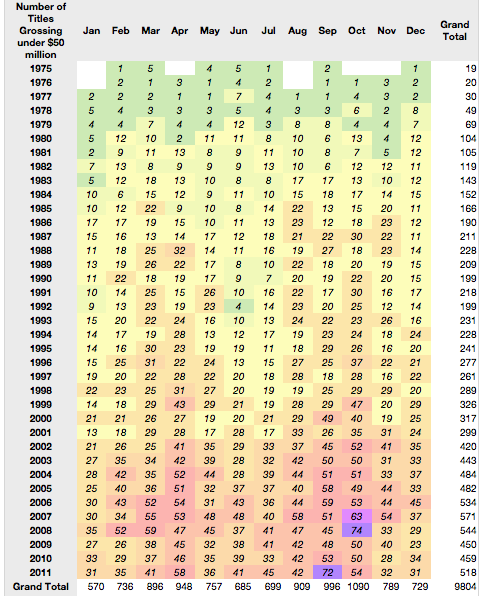
    To contrast this further, here is a stacked bar chart comparison between frequency of release by month for the most successful tier vs. the least successful tier (colors represent years with oldest at the bottom).
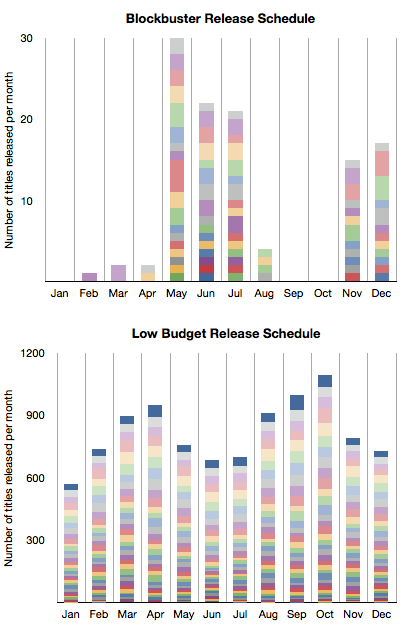
    It would seem that summer and success are in a causal relationship. There is a clear pattern with the only non-summer months having blockbuster releases being November and December.

    But there is more to this pattern.

    The blockbuster schedule happens to coincide with the school holiday schedule in the US. This again points to the "profitable" audience being school-age children, and mostly male.

    The perpetual incumbency: Where are the Hollywood startups?

    The third observation has to do with the  major film studios. We took the box office revenues and allocated them to the studios over time. The following chart shows the share of those revenues for the top 30 studios.
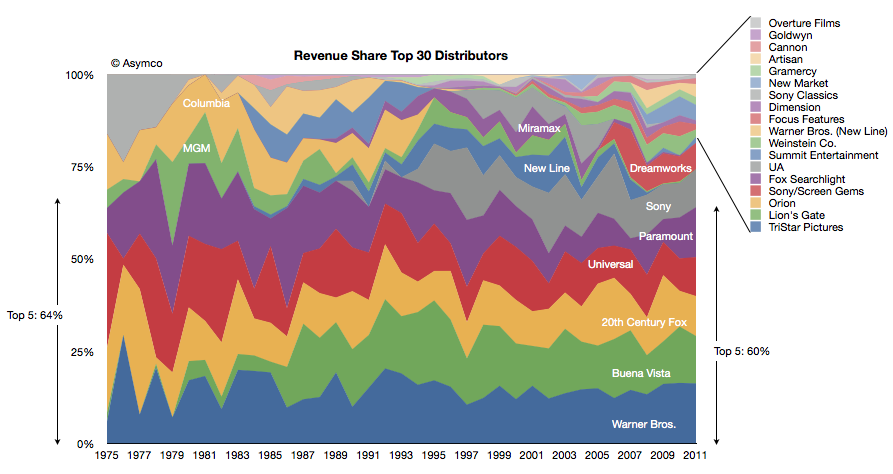
    The top five were earning 64% of revenues in 1975 and the top five were earning 60% in 2011. One of the top five from 1975 is no longer in the running this year (MGM) and one new major was added (Buena Vista, owned by Disney).

    There has been one other notable change: Columbia was acquired by Sony but stayed out of the top 5. Beside Disney there is one new significant entrant in Dreamworks gaining share in the last decade.

    But the prevailing impression from the data is that the incumbents remained as such during the last four decades. There are many small studios but they have not "disrupted" the market by shifting significant revenues out of the hands of the majors. Indeed the typical strategy seems to be to start a studio with the hope of it being acquired by a major.

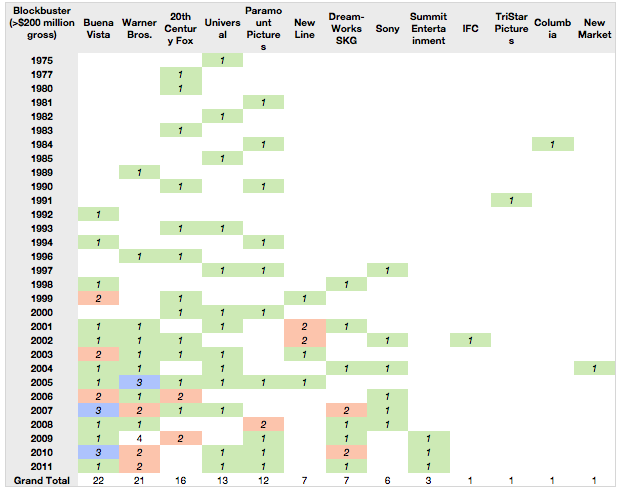
    Even the entrants are industry insiders: Disney and Dreamworks are not asymmetric in their business models in any way. In fact, when viewing the data by blockbuster creation, the majors feature prominently. There are only a handful of blockbusters from the smaller companies.
    When looking at overall production rates, again the majors (and their subsidiaries) dominate. Here are the top 75 distributors of movies showing nearly 9000 movies (click image for full-size):
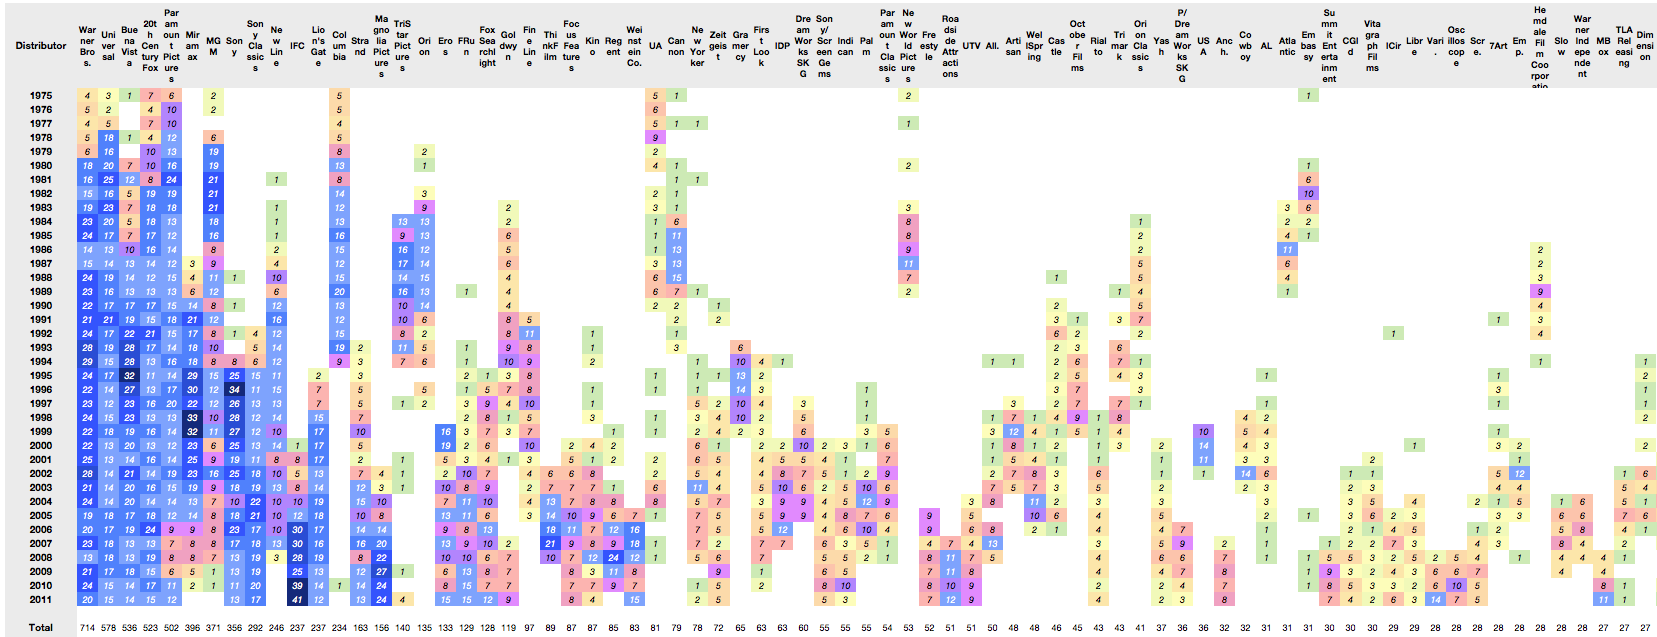
    The conclusion from this data might be that Hollywood does not change all that much in terms of who makes the money. But that itself is a symptom of a deeper reality: that there is little that changes at all.

    We can even perhaps hypothesize that there is no business model innovation taking place. Any such innovation is usually manifested in a reversal of fortunes for incumbents.

    But technological change is happening. The following section describes how this appears in the data.

    The Popcorn economy: The peculiar power of theaters in an age of television

    The data we are sampling (box office gross revenues) is actually a small and shrinking subset of what movies generate. In addition, there are international revenues, media sales (DVD, video tape), TV rights, and merchandise to name a few. But theaters are still an important part of the picture.

    Although they make up less than 20% of gross, their importance is disproportionate due to the signal they send other markets about the popularity of a movie. In other words, a movie must first be proven in a US theater before its value is priced by the other channels.

    However, this essential theatrical release has changed in one fundamental way. Releases are now geared for larger initial scopes with shorter runs and less dependency on "word of mouth" to increase sales.

    Consider the following view of release breadth (how many theaters are in an opening) by openings over time. The columns represent the number of theaters used in the opening of a movie in increments of 100. The rows are years. The cells contain the number of movies opening with that size footprint.
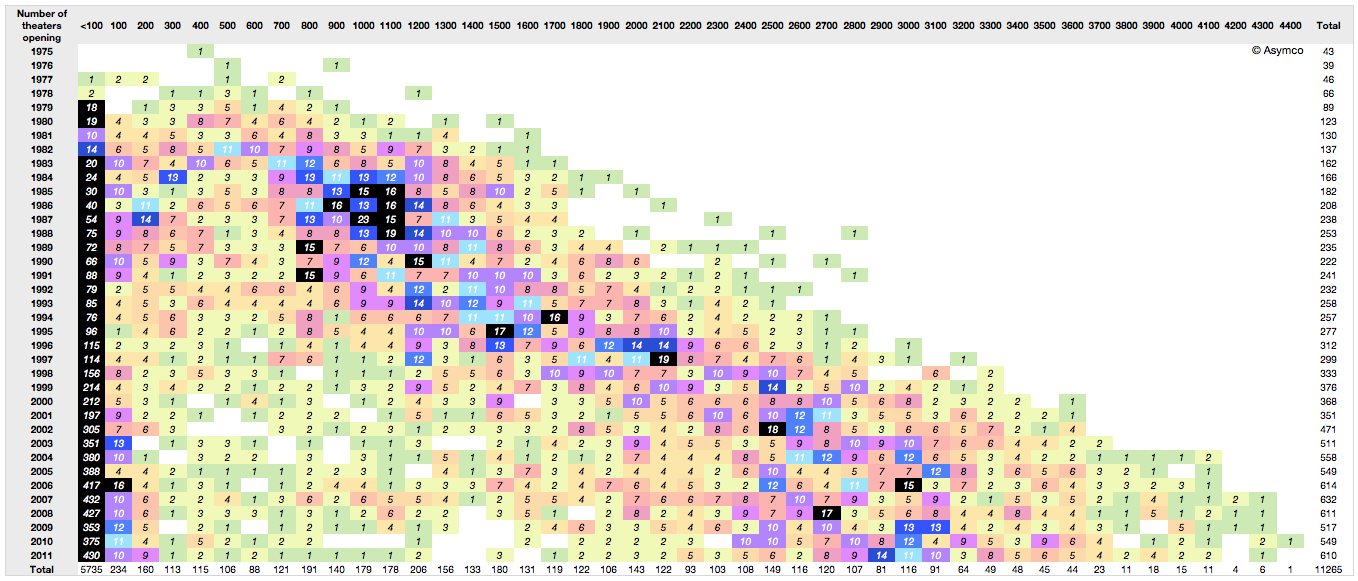
    The pattern shows the number of theaters used in openings increasing steadily. the mean number of releases is shifting to the right. Part of the reason is that theaters shrank in size over time, but there is also the factor of needing to create a large audience at the outset of a release. The increase in "footprint" at launch (a factor of 10) is in excess of the slicing of theater sizes (a factor of two)

    This broadening of launch is coincident with a decrease in viewers. As a result the notion of how movies are marketed has changed. The idea that a movie could start small and gain a following gradually through word of mouth is obsolete. That low cost approach to marketing (called "earned media exposure" in marketing) is unreliable and completely discounted.

    Instead, studios manufacture an audience through paid advertising and promotion. This initial burst of viewers is essential not just for generating revenues. It's essential to driving long-term revenues.

    The reason is that technology now allows the movie to be "monetized" through multiple channels. Recorded media, broadcast rights and even in-flight entertainment are all there to milk a franchise. But there is a need to get that initial vote of confidence from one crucial audience. That happens to come only from theatrical release.

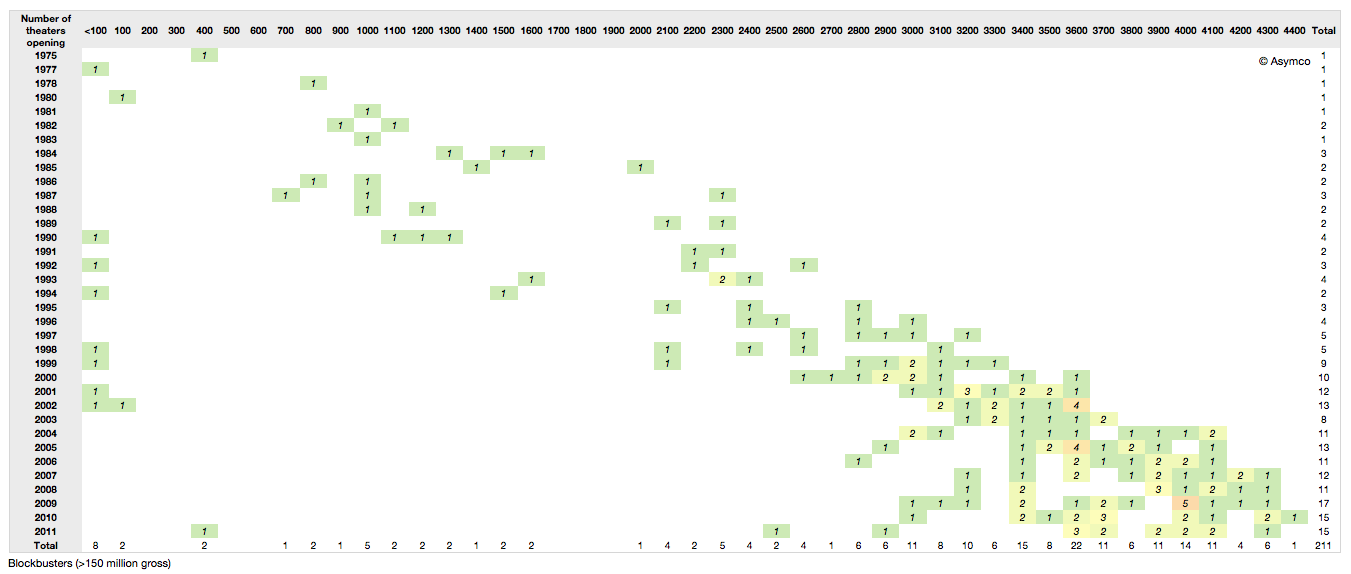
    So with the scheduling pressures, the narrow window of purchased release buzz, the onus is on a broad release as quickly as possible. This holds especially true if we filter out only the blockbusters. Note how the release has increased steadily as well and that since 2000 all blockbusters released to over 3000 theaters. Compare that to Star Wars in 1977 releasing to only 30 theaters.
      Notes:

    1. See Jay Epstien's The Hollywood Economist.
    2. Tools used include Excel, Numbers and our own App
    3. Data sources: Coolector, Imdb, BoxOfficeMojo, The-numbers.com
    4. Many thanks to David McCandless and the Information is Beautiful  folks (http://www.informationisbeautiful.net) for setting up the Hollywood Budgets Award that provided us with much motivation for researching this topic.
  2. The story of Fernforest and Petro Dale

    Research · 79 comments

    Once upon a time there were some innovative farmers that developed a new hybrid crop that could satisfy the hunger of a growing population. This crop grew best in large farms which had to be situated far from where people lived. The food was so tasty and production could scale so quickly that it became necessary and possible to build a novel way to deliver this food to the population. The farmers built their own transportation network, which they called a "railway".

    This network of rail was itself very efficient and soon overtook the ability of restaurants and small shops to absorb the produce. In order to keep the pipeline of food filled, the farmers (now with their own railways) bought most restaurants and grocery stores. They transformed them into more efficient food retailers and the result was even more consumption and demand for the food.

    To keep the population happy, the farmers constantly devised new food hybrids and new recipes for the restaurants. The food design process became a profession, even an art form. The farmers employed the best and most creative minds  when it came to food. They created unique recipes that became instant hits and were widely consumed. They invented "star foods" and "blockbuster dishes". The process of churning out these hits was so highly honed that farms became factories of ideas.

    At the same time, the workers on the farms became unionized and they reached an understanding with the farmers so that every new "food production" allocated healthy wages to the workers. Due to their newfound fame, some of the food designers even got a portion of the profits from their creativity. Food making reached unprecedented levels of quality with very wide distribution to almost every restaurant in the world.

    After a while the government became nervous about the level of control the farms (and their railways etc.) had over the nation's food supply. The government worried that this level of concentration would lead to price gouging. They sought concessions and eventually the Supreme Court decreed that farmers could not own restaurants. The restaurants became independent. However, since the main food supply came from the same farmers and they owned the railways, the independent restaurants could do nothing but serve the same food that was on offer when they were part of the syndicate. The consumer did not see much change in either the availability or the quality of food though food prices did remain steady and the government was satisfied.

    This system worked so well that it remained in place for over 100 years. The food production system became the stuff of myth and legend. It had its own name based on the fertile valley where it started: Fernforest.

    It was not a system without any innovation. In the interest of efficiency small changes were always made. These "innovations" included outsourcing the farming so independent farmers who concentrated on efficiency had the largest share of production. Fernforest innovated in their financing practices and in their accounting for new food products. Fernforest accepted new ways of packaging the food. For example, freezing dishes and selling them in supermarkets ready to eat. They gave more creative freedom to the food designers and the farm technicians, many of who became rich.

    But they all depended on the robust rail network. Over time, the rail network became the most critical component in the Fernforest system. So much so that 30 to 40 percent of all the money collected from food sales went to the railway consortium. With that vast cash flow the magnates of Fernforest decided which food hybrid would be grown, how much money would be spent in its production and essentially determined the flavors and tastes of society. They claimed that only they knew how to gauge what meal would become a hit and only they could be trusted to bet heavily on producing the source ingredients. Each production ended up costing hundreds of millions of dollars and since only they could ship the stuff, only they would finance the production. It was a self-fulfilling prophecy: Fernforest became taste makers and their executives used that advantage to maintain the enormous distribution fees which financed the next hit.

    It looked like the system would remain in place, essentially unchanged, forever. Food was a necessity, people would always need to eat, and this was the most efficient way of making and selling food. And it almost always tasted good.

    Then a strange new invention came into being. It was completely unrelated to the food business. It was, in fact, a new engine--the internal combustion engine. This spawned a new invention called the automobile. The automobile was so useful for many transportation tasks that it developed its own network architecture: the so-called "road network". A new industry developed to harness the value of this engine, vehicle and transportation network. It became based in a different part of the country, coincidentally also a valley. It was called Petro Dale after the fuel the new engines used.

    Fernforest took no notice of this new industry. They did not find use for the new technology. The Petro engines were too small and inefficient for their food train locomotives. Automobiles were designed for moving around small loads. Fernforest wanted to increase the size of its trains, not to decrease them. Autos were taking stuff in small portions to small consumers. It all looked inefficient and useless.

    But Petro Dale was booming anyway. They found that their engines and cars were hugely useful for individuals transporting all manner of goods beside food. They thrived even without the support of Fernforest. The car owners built small businesses and grew them as the power of the engines grew. Eventually some entrepreneurs with cars decided that they could build gardens, greenhouses and farms and get their produce to local markets quite efficiently. It was not a big opportunity and some of these creative food innovators were acquired by the big farms and their recipes were scaled up for the Fernforest system. But small operators kept popping up and many made a modest living growing food.

    However, some unscrupulous car owners copied the recipes of the big hits from Fernforest and duplicated the food locally and sold it locally in violation of the laws protecting recipe rights. Fernforest saw this as a clear and present danger and reacted very angrily. So much so that they sought to ban all cars. They saw cars and roads as built primarily to steal food ideas. Quickly, this became a toxic political conflict. After an outcry from car owners, the efforts of the rail and farm protection society (Nourishment Association of America or NAA) failed. They had reached the limit of their political power.

    However, the attempt to ban cars caused Petro Dale to wake up to the threat of railways. They realized that even though much more commerce took place with cars and roads, and even though railways were becoming increasingly irrelevant, they would remain a potential regressive threat. In the past Petro Dale had sought to do business with the incumbent food network distributors, suggesting ways of taking the mass market food produce and distributing it to new franchises like mobile food trucks and fast food restaurants. They were spurned. Now they realized that trying to work with Fernforest was not just futile but  harmful.

    Instead, Petro Dale changed strategy and sought to encourage local food production and guaranteed that any local recipe designer could get their dish distributed via a far more pervasive road and take-out network. Thousands of food designers took up the challenge. Even some of the designers that worked on the big farms saw the future was in independent distribution. Even though they had grown rich working for the big farms, they had been chafing under the "green lighting" process of railway magnates.They wanted to connect to take-outs and consumers directly, bypassing both rail and restaurants. Cars seemed suddenly good enough.

    Farmers themselves began to be disenchanted with the railway system and Fernforest as a way to produce food. Their role had been reduced to being outsourced factories. The decisions on what to plant came from the railway executives. They felt that their technical knowledge, which created the industry in the first place, was not valued. What's worse, from their point of view, the service railways provided was becoming inefficient. Freighting by train meant that they could not package food in novel ways. Being disconnected from the consumer, they could not create some of the hybrids they knew were in demand (as small growers had already proven). The creative people that had been working for them were fleeing while the cost structures (and union wages) remained. Their idea factories were falling apart.

    Even the public woke up to the blandness of Fernforest products. They were becoming increasingly attracted to meal alternatives that came direct to their house (home delivery and take-out) and were tiring of chain restaurants. The local stuff was fresher. Besides, they reasoned, I own a car myself. Why should so much of my money be paid to railroads?


  3. The conditions for survival and prosperity

    Research · 37 comments

    Yesterday's post described the history of personal computing platforms over the past 37 years. It showed a distinct shifting of "eras" between traditional personal computing and the emergent mobile computing represented by device-based platforms.

    Underlying these lives (and deaths) of platforms were the growth (and decline) of fortunes of companies and people. I hoped that by observing these patterns insight could be gained into the conditions for success or failure.

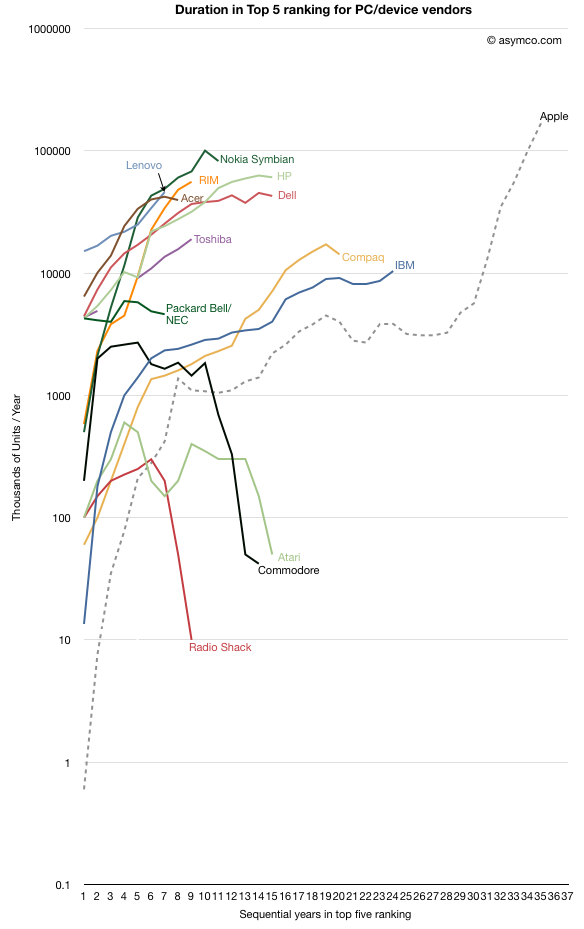
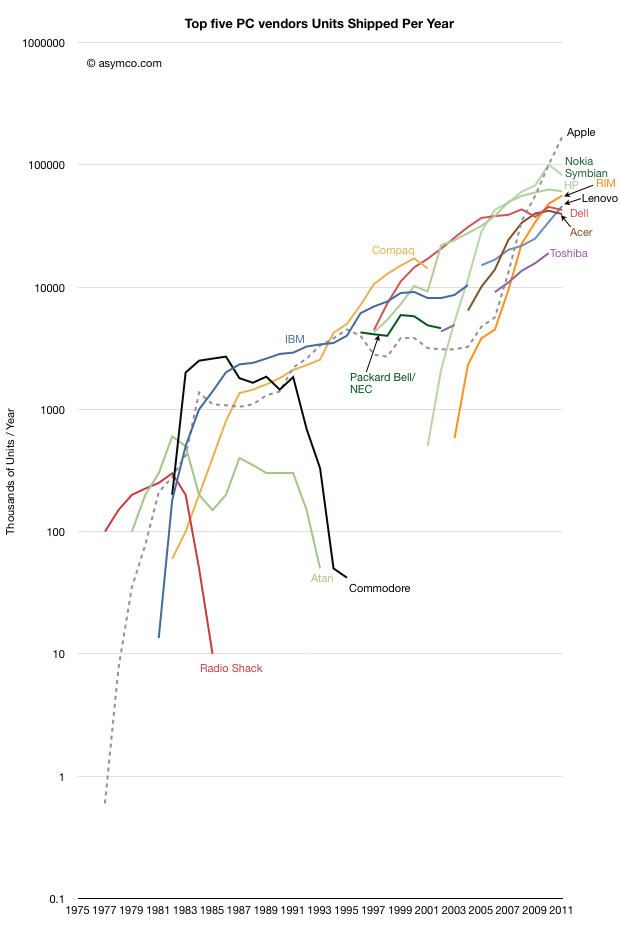
    The following graph shows the companies which were predominant (in the top five ranking by shipments[1]) during each year of the industry's history and the volumes they were able to obtain during that period. I also added Nokia and RIM as examples of the challengers coming from mobile devices.

    It's a difficult graph to interpret. The pattern I observed was that most companies were not able to sustain presence in the top five ranking for long. Indeed, regardless of having one's own platform or being a licensee, companies seemed to fade reliably. Some were acquired, some sold their operations but there is a distinct impermanence to their prosperity.

    To sharpen this perspective of longevity I indexed each company to the point when they entered the "prosperity zone" and measured their staying power within it. The following graph shows these indexed lives.


    Apart from Apple, IBM remained in the business the longest (24 years). Compaq was second with 20 years before being bought by HP. HP and Dell are still operating after 15 years, having tied Atari and Commodore. After these ancients, the upstarts Nokia and RIM are struggling to remain relevant after 10 to 12 years.

    Then there are the transients like Packard-Bell/NEC, Toshiba, Radio Shack and Fujitsu which lasted less than 10 years. The newest PC companies are all from China or Taiwan: Acer, Asus and Lenovo. Their longevity cannot be called yet though Acer seems to be in decline. Lenovo, which took over IBM's brands continues to grow. However, as yesterday's post showed, without diversification into devices, pure PC makers are likely to fade.

    But besides this interesting history lesson, there is a deeper, unsettling observation. The scale of these periods of prosperity is far shorter than the average person's career. Indeed, the entire time span of the study is 35 years, about the time an average person will be employed. All the companies failed to maintain prosperity over this time frame.

    These are a small sample, flawed by showing only hardware units, but I consider it a proxy for the overall technology market. Software-only or services companies have had no better records.

    The implications for company managers and workers is profound. Chances are that the business you work for will not prosper for more than a decade and will reward you for an even shorter period. Similarly, as witnessed by the P/E ratios, investors have  given up on this industry as one with any quality of earnings.

    There is no "rule" that this has to be so. The high mortality rate and short longevity of technology companies is a consequence of a failure to manage innovation and disruption. Apple may be an exception--one I think worth studying. Though not always prosperous, it has managed to survive, being the only company from the early era of personal computing to still be operating in the industry. Indeed, it's now the most prosperous. Maybe it's a fluke, but I rather think it's due to an ability to re-define itself as the market shifts. Its essential quality being an ability to disrupt itself.

    And if we think about it this way, ultimately, longevity is more important than prosperity. Without patience there is nothing but chance determining prosperity. The fate of more than company finances rests in the balance.

    Notes:

    1. Apple did not maintain a position in the top 5 throughout this period but is shown as a benchmark as it remained in the same business throughout this period.
  4. Predictions for 2012

    Research · 54 comments

    I have none to offer.

    It may sound strange to hear me say that I don't make predictions even though I often talk about how things will change and even provide some forecasts. The difference is one of degrees. A prediction to me is a very specific, time-sensitive and materially valuable recommendation. An observation about the future is an imprecise, intuitive hunch based on pattern recognition. It's mushy. It's theoretical. It's the difference between saying a company is great and recommending to buy its stock with a price target in a time frame.

    But it gets even weirder.

    One of the recurring themes in Apple analysis has been that independent analysts, as a group, have been, on average, more accurate in quarterly forecasting than highly paid Wall Street Analysts. Many have asked why.  I believe that the answer is because independent analysts are theorists who make observations while professionals are data gatherers who make predictions.

    First, we should understand the reasons why each group does what it does.  Wall Street sell side analysts are rewarded for making Buy/Sell recommendations that cause clients to retain the services of the firm they work for. They are not paid to be accurate with specific forecasts in fundamentals. They are paid to predict how stocks move. The objective is not to be accurate in the quarterly but to support the "call" or prediction. The disconnect from accuracy comes in trying to sustain the call with a "conservative" forecast.

    For example,  an analyst with a "Buy" recommendation (and a prediction in the form of a price target) thinks Apple could ship 30 million iPhones this quarter and generate EPS of $10. But he also thinks the stock looks cheap even if they only ship 28 million iPhones and report EPS of $8.50. In this scenario he's incentivized to publish the lower (less accurate) number. That way he supports his prediction. By dampening expectations, the stock rises on the "surprise".

    Because an analyst sells predictions, he self-censors what he believes.

    Contrast that with the motivation of an independent analyst (aka blogger). His motivation is to (presumably) gain a reputation of accuracy and insight. He sells his reputation as a keen observer. Precise predictions or recommendations can turn out wrong quite often. Getting caught with these errors exposes the independent to instant negative feedback. The risk is far greater than the  opportunity.

    So here is the difference: Analysts have an incentive to put forth a version of the future that supports their call on the stock. Bloggers have an incentive to put forth the most accurate version of the future. By taking the prediction out of the picture, accuracy in describing the future improves.

    So I don't have any predictions or recommendations. I just hope to help you see patterns that lead you to making your own predictions.

  5. Apple's commoditization discount

    Research · 80 comments

    When asked where Apple's growth will come from, most analysts or observers will cite new products. As long as there are new products, then there is growth. Conversely, if there are no new products, then there will be no growth. This is such a commonly held belief that it's axiomatic: Apple is being valued based on short-term foreseeable growth.

    To be more precise, analysts value the wave of growth of every new product and heavily discount the post-growth phase assuming commoditization. There is no value assigned to Apple for extending market reach to the mass market.

    Consider: Analysts currently forecast an operating income (or EBIT) of $43.3bn for 2012 and $49.7bn for 2013. That implies growth of 28% in 2012 and 15% in 2013. These growth rates are modest in light of Apple's recent historic growth and especially 84% in 2011 on EBIT level. Much of this growth has been due to iPhone which quickly captured 4% market share in four years. To suggest 15% growth in 2013 is to suggest that Apple will not increase its phone market share by an appreciable amount. The implicit assumption in that growth figure alone is that Apple will remain a niche player.

    Bear in mind that 15% growth is so low as to be half the the growth in the Mac business and below the likely growth in the overall phone market. Considering the risk premium on equities, this growth forecast assumes essentially a no growth scenario. But even with no growth, Apple's cash flows are huge and thus they should add up to some significant present value. Since we know the value as reflected in the current price, we can work backwards to determine the discount rate being applied to those future flows. In other words, we can calculate how risky Apple's existing product cash flows are seen to be.

    Based on  assumptions originating from analysts' consensus, we can construct a simple model that will approximate the discount the stock market puts on Apple's future cash flows. Let's have a look at an adjusted Gordon or dividend discount valuation model on EBIT basis:

    Shares are valued based on the projected future cash flows of a company. Discounting EBIT with Weighted Average Cost of Capital and subtracting growth will yield enterprise value (= market capitalization - cash).

    Applying analysts’ assumption of close to zero growth to Apple's post 2012 EBIT means EBIT stays constant for 2013 and beyond. Let’s solve for the implied capital costs. Right away we can eliminate growth (g) as it equals zero. EBIT reflects operating cash flow since in a zero growth scenario CapEx will equal deprecation and there are no changes in net working capital. As Apple has no debt but a cash surplus, WACC will be equal to cost of equity[1].

    Solving for capital cost (WACC) with available analysts' EBIT estimates reveals a discount rate of 15%.

    But let’s remember that analysts have consistently and by a large margin missed Apple's financial performance. So let’s dial in a more aggressive estimate of around $56bn of EBIT for the fiscal year 2012. The discount rate goes up to 19% and implies an EBIT multiple of 5.3x.

    In other words, Apple's cash flows for a zero growth scenario are being discounted at a rate of 15% to 19%. This places the company in an extremely risky category of investment. It is certainly not something that can be categorized as a value stock.

    The discussions on this blog regarding Apple’s valuation have been insightful, but only danced around the triangle of price, earnings and growth. When the growth forecasts are considered vis-a-vis current pricing, the assumptions built into 'consensus' forecasts for Apple are condemnations of the company.

    They present a view of a company that is extremely vulnerable and can neither preserve its current cash flows nor find new sources of growth. It is, quite plainly, a company doomed to commoditization.

    ---

    Notes:

    1. Or one can even assume that cash has a positive effect lowering costs of equity (less indirect bankruptcy costs).
  6. Hiding in plain sight

    Research · 66 comments

    Guessing the next Apple product has become the parlor game of choice for a whole generation of technology journalists and analysts. The premise of the game is that given a track record of breakthrough products, there is always another one just around the corner. Being the one to predict this next breakthrough product creates credibility and demonstrates the domain knowledge of the predictor. If the prediction fails to materialize there is consolation in dismissing the actual announced product as disappointing, unsophisticated or, worst of all, uninteresting.

    Most often, these guesses are as much a reflection of the analyst as they are an analysis of the company. Too many predictions are designed to impress or demonstrate the imagination or knowledge of the predictor. They typically anticipate a giant leap of functionality, power or market re-structuring. They envision revolution not evolution; a cutting of the Gordian knot not a polishing of ugly rocks.

    Yet nearly all of Apple's launches have been sustaining improvements in existing products, technologies or platforms. To name just a few:

    • The iPad is an evolution of the iPod touch
    • The iPod touch is an evolution of the iPhone
    • The iPhone uses OS X and Objective C from the Mac
    • OS X came from NeXT
    • The app store market model came out of the iTunes store
    • The iTunes store came from iTunes which came first to the Mac as a media sync tool for the iPod
    • etc.

    John Gruber explained the process last spring as it relates to many of Apple's launches. Although the iPhone did introduce a new user input method and experience that takes consumption in a new direction, its building blocks were there for all to see for many years. The iPhone is a natural evolution of the computer with a handy little "Phone" app.

    Likewise, the iPod came seemingly out of nowhere but by watching the original launch you see it as part of a "media hub" strategy that envisions the Mac as a personal server. The very products which ended up disrupting the Mac/PC began as extensions of their victims.

    You can trace the DNA of almost all of Apple's products to previous products. If Apple did not have these foundations, the slow-motion revolutions would not have happened. Rather than a deliberate big bang, Apple's disruptions are the result of a discovery process. A test, iterate and improve loop. This is why they seem obvious after the launch but also why they seem to be such an anti-climax.

    Therefore, the challenge of predicting Apple's next product should be tackled not only through an act of imagination but by carefully projecting the current products and understanding where they can evolve.

    So it is that I approach the question of Apple's TV disruption. My working assumption about the next Apple TV is that it already exists. It's none other than the existing Apple TV, improved.

    Here are the clues or hints I noted:

    • It uses iOS and the hardware from the devices that run it. It originally ran a PC architecture and shared a kernel with Macs.
    • It has been integrated with iTunes media stores (with the notable exception of the iTunes app store)
    • It has begun to introduce channels other than downloads (ESPN, Wall Street Journal) thus establishing its own distribution for traditional content
    • It is a global product, depending only on the Internet protocols and independent of the balkanized cable standards
    • Through AirPlay it is integrated with Macs and Apple devices.
    • Through display mirroring, iOS devices can use the TV as an external monitor and can even change their own behavior when doing so

    This last point is intriguing. I have not seen discussion of this feature, but if using an iPad 2 or iPhone 4S with iOS 5 and an Apple TV with the latest software updates it's possible to have an iOS device become a controller for TV-based game experiences. Developers are already using the API. When using a pinball game with screen mirroring, the device becomes a controller while the action takes place on the big screen. Switching display mirroring off bring the action and control back onto the small screen. There are still problems with lag and the processors are over-taxed on high frame rates, but the APIs are already there for developers. (I could also mention the potential of new a Bluetooth standard for better wireless response).

    What these signals point to is Apple defining the TV as an iOS portfolio product. This means integration with iTunes, including an app store. This, in turn, means unleashing developer/creative talent through new monetization opportunities. This means new user experiences in discovery. This means FaceTime-like communication through the TV. This means many other things but mostly it means that the TV will be a platform product.

    The only challenge is a (currently lacking) smooth interface. Perhaps that's where voice comes into the picture. But whether that is built-in at the next rev of the product or not is not the story. The story is going to be the sustaining improvement in the original Apple TV. A wonderfully asymmetric product begging to be ignored. A product that because of its apparent lack of success, effectively hides all its secrets in plain sight.

  7. The big bang theory of computing

    Research · 63 comments

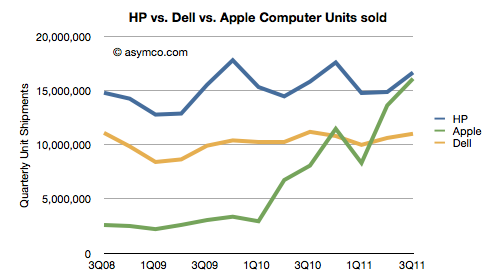
    HP's CEO Meg Whitman admitted that, when iPads are included, Apple will overtake HP as the world's leader in computer shipments.

    “We need to improve our game and our products to take over the leadership position. Apple could go past HP in 2012. We will try to become the champion in 2013.

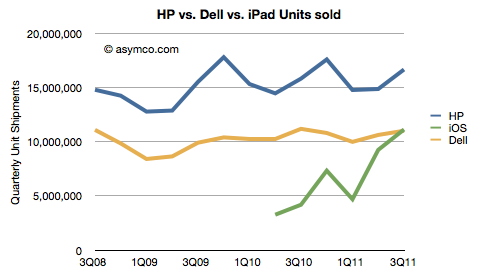
    When the quarterly shipment data is seen as a chart the doubt of this happening disappears:


    Note that the combined iPad+Mac has already overtaken Dell. In fact, the iPad alone overtook Dell in Q3 and might overtake HP in two quarters.


    The iPad is growing at an average of 170% y/y (average of two quarters) while the Windows PC market is growing at an average of 1.9% over the same period (source: Gartner, company reports). The

    Placing the iPad in the "competitor" category is an important admission for a PC company. Categorization choices make all the difference when thinking about strategy. The new tablet product may not appear at first glance to be competitive with the current definition of a PC (though it might very well be a personal computer.) But definitions tend to evolve. Categories are abstractly defined. The original PC was certainly not competitive with Mainframe computers and perhaps it still isn't. But that does not mean that usage (and hence value capture) did not migrate. Most people today would say a PC is a "real computer" and the Mainframe is simply an old computer.

    Whitman notes that the iPad is not the only computer people use and most have a PC as well. That may be true as it was true when the PC was new. Most companies that supplied PCs to workers maintained large computers for "mission critical" applications like accounting and engineering. The two technologies lived side-by-side for many years. In fact, in the beginning there was a thriving market for software and hardware that would allow PCs to be used as terminals to access central computers. It wasn't until PC servers and server software like that from Novell and networking from 3COM became commonplace that mainframes and minis began to fade.

    So in practice, there was no big bang start to the post mainframe era. The evolution of the PC went through stages. It was an isolated local computer, a client-server solution and then finally a web-enabled communication product on its way to ubiquity. But the era did change.

    So if history serves as a guide, the displacement of the PC won't come from a direct substitution but a more sinister and hard-to-predict subversion through new applications and a re-definition of what a PC is. The driving forces are not just volumes but new input methods, new user interfaces, new jobs to be done, new software and many innovative companies working within an ecosystem.

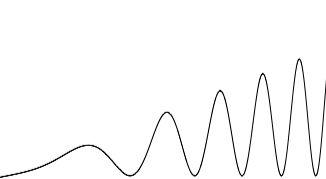
    If there is one difference today it's that things are happening a lot faster. A transition that took a decade is happening in three years today, even though the entire market is orders of magnitude bigger.

    When I visualize the cycle time of technology change, I see it as the waveform to the left: as cycle time decreases (i.e. frequency increases), the opportunity (amplitude) also increases.

  8. Is Innovation Valuable?

    Research · 197 comments

    I began thinking carefully about Apple in 2005 when the stock was priced at around $55/share. I remember that the events which made me consider Apple in a different light were the launch of the iPod shuffle and the launch of the Mac mini. Both moves signaled to me that the company was serious about competing with non-consumption. At that point I thought that the company was a potential opportunity as an investment.

    But I also remember that many people at the time thought that the stock price was too expensive. At $50, the company was much more expensive than the year before. The stock started 2004 at about $11/share. The reason it had climbed so much was that the iPod began to be a real world-wide growth phenomenon. Buying Apple was buying into the iPod and many said the price was unsustainable given such a strong dependency on fickle consumer tastes. It was a much riskier proposition than that of competitors like Dell and HP which made product for reliable buyers like enterprises.

    Indeed, by 2006, the shine was off. In the first half of 2006 the stock collapsed from $85 a share to $50, a fall of 40%. It was becoming clear that with mobile phones taking on more music playing features, the iPod was not going to be a big story for long. What's more, Apple had just announced that they were switching to Intel for the Mac product line. Investors saw just how vulnerable the company still was and considered that the Mac brand was in jeopardy as it transitioned to becoming a Windows-friendly machine.

    However, in 2007 the company's value recovered with the introduction of the iPhone. Suddenly there was a new product to drive sales. Nobody knew by how much or how but there was a sense that the iPhone was enough to keep Apple from oblivion.

    Yet, again, in early 2008 the company lost 40% of its valuation. In a rather inexplicable period following the launch of the MacBook Air, the company's shares went into free fall. Inexplicable because the company continued to deliver solid growth with 2008 calendar quarters showing between 32% and 155% EPS growth.

    Then the recession came. It caused another 40% share price collapse. Growth slowed to a range of 11% to 61% during 2009. As the marco "headwinds" blew over, by the end of 2009, with the help of a lukewarm response to the iPad, the company's value recovered to its 2007 level. In the mean-time its earnings more than doubled.

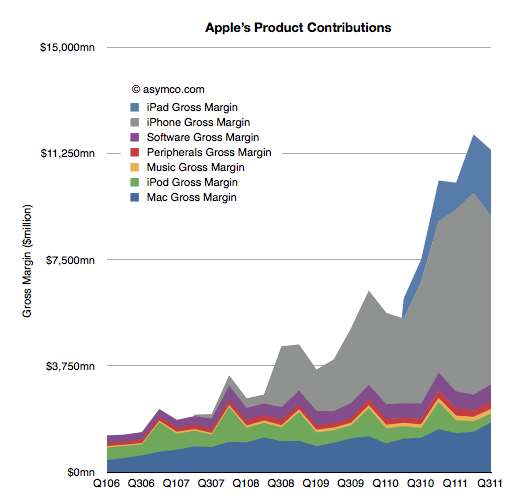
    It may not appear to be the case, but throughout this volatile period, the investment thesis remained fairly constant: Apple is a rather small collection of product bets. Owning Apple meant riding the iPod or the iPhone or the iPad as waves of growth. As soon as one growth wave was seen to start to fade, investors would say the same thing: Apple is done.

    The chart below shows just what that looks like in terms of product contribution to gross margin.

    The investment thesis is the same today. I've had dozens of conversations with fund managers and if anything, it's even more about betting on products. The iPhone and the iPad make up such a large part of profits that the company seems to be nothing but those two things. So if there is any hint that those products might slow down, the stock is sold off.

    What intrigues me about this investment thesis is not whether the signals of growth are interpreted correctly or not, but rather that an investor in Apple in 2006 was considered perfectly rational valuing Apple as an iPod company as much as an investor today is perfectly rational valuing Apple as an iPhone company. Why would anyone buy Apple for any other reason? There is no evidence that Apple can be anything more. Any fund manager positing a different point of view would surely be limiting her credibility.

    The consensus is that the value of future, unknown products is zero. Not only that but the probability that there will be any products at all is equally zero. Not only that but whatever Apple does to create new products is not perceptibly valuable. The company is simply the sum-of-the-product-parts and nothing more. Cash flows from current products can easily be shown to be more than the current valuation so even these products are deeply discounted. If and when a new product shows up, it will be considered and maybe if it shows promise, the stock will reflect that, briefly.

    A corollary to this investment thesis therefore is that the process of product development at Apple is worth nothing. It does not matter if the company has shown an ability to disrupt and to create new categories. The past is not a predictor. The value of the company is a discounted cash flow of current products--discounted for the odds of commoditization, which are seen to be quite high. A new hit product is a windfall, a winning lottery ticket. Something that you cannot count on.

    Think about that in a different context. That's like valuing Pixar on the box office revenues of its current movie. If Cars 2 is not beating records, Pixar is suddenly nearly worthless. The fact that Pixar repeatably creates blockbusters would be seen as meaningless. The way they built a reliable pipeline with predictable cost structures for movie-making is not interesting.

    However, the fact is that Pixar did not get acquired on the basis of the last hit it made. It was acquired for its system of production. This can be confirmed not only by the price paid but by the fact that the organization was not folded into the Disney machine. It stands alone and is given autonomy. So at least in the movie making industry, predictability is seen as valuable.

    So why is Apple not valued as a process company?

    I think the answer lies in the lack of understanding or belief in a theory that predictable success in product development is possible. Until and unless an explanation is available that persuades a majority that Apple is as much a hit factory as Pixar then Apple without the products will intrinsically be valued at zero.

    The premise of the stock market today is therefore that being innovative in technology is meaningless. Innovations are valuable but there is no such thing as an innovation process. If there was such a thing then we could measure it and put a number of its value. Until then innovation is nothing more than a spin of the roulette wheel.

  9. Revolutionary User Interfaces

    Research · 223 comments

    A few years ago, around the middle of the last decade, the mobile phone market was characterized by the rivalry between a few established vendors. These were Nokia, Samsung, LG, Motorola and Sony Ericsson. These incumbent companies had a broad portfolio of devices including smartphones and feature phones and basic phones. Many also sold networking equipment and were deeply engaged with their customers, network operators.

    There was also a set of entrants who offered only smartphones.  They were quirky. HTC was a a prominent "ODM" or original design manufacturer who built phones for companies who added their brands and sold and supported the product. HTC made phones and PDAs for operator brands and for some large PC companies. It also began to sell phones under its own brand. RIM was also offering products that had evolved from pagers into email appliances with added voice capabilities. But RIM's products were not very good as phones. Voice was so poorly integrated that many people carried both a BlackBerry and a voice phone. Then there was Palm with something called a Treo which promised many things but did not quite deliver.

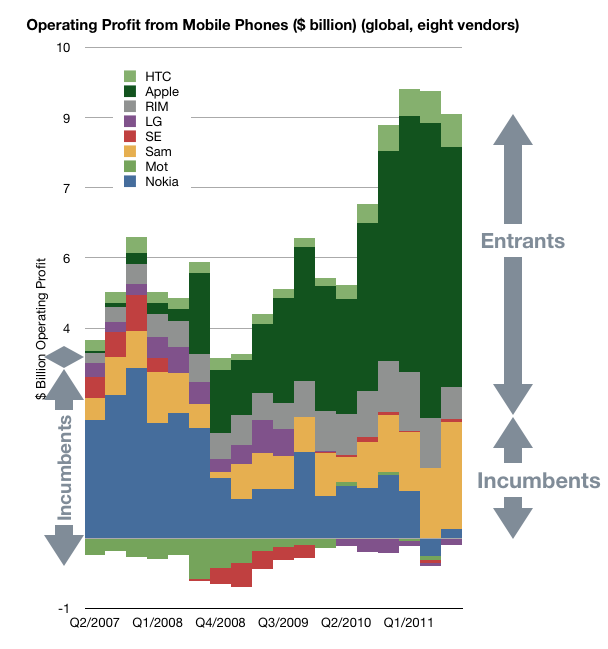
    In 2007 something happened which changed the industry. It took a few years to even realize it was happening but by the time it was obvious, it had changed to such a degree that huge companies found themselves in financial distress. This chart illustrates the effect.

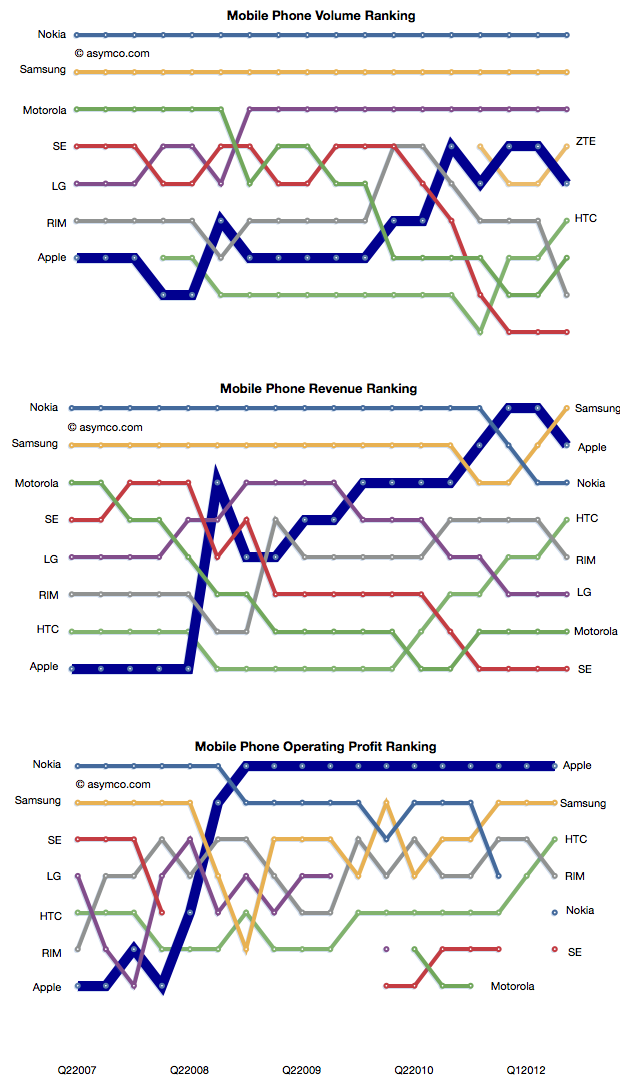
    In a few short years the rivalry between incumbent handset makers has evolved into a rivalry between mobile platforms where the incumbents were caught in an increasingly unprofitable role of hardware integrators. Motorola is now being absorbed by a search company. Sony Ericsson is being absorbed into a consumer electronics company. Nokia is going through a potentially existential crisis and even abandoned its platform. Acquisition talk surrounds LG's phone efforts. Samsung is prosperous but sill at the mercy of its software suppliers. Even the entrants are starting to feel beleaguered. RIM, the oldest pure play smartphone company is trading below book value and has regressed in value to 2004 levels. Palm evaporated. A view into the changes is the rankings of the companies in terms of volumes, sales and profit as shown below.

    How did large, powerful, smart companies let this happen?

    It happened despite having a clear, front row view of the transition of the industry from mobile voice to mobile computing. The shift in the basis of competition from "connecting people" to "connecting people to data" ended up being a classic disruptive trap. Many will argue that it was the failing of individual managers. Perhaps, but how did they conspire to fail simultaneously?

    When you see disruption happening, it's natural to seek out a cause, a pivotal magical "force" or event that enabled the weak to humble the strong--the proverbial sling that enabled David to defeat Goliath.

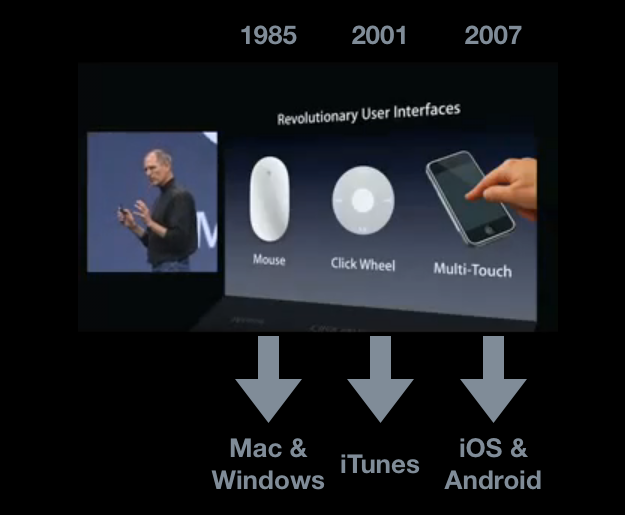
    My hypothesis is that The Primary Cause for the shift of profits from Incumbents to Entrants has been the disruptive impact of a new input method. I illustrated this with the help of the January 2007 slide presented by Steve Jobs at the launch of iPhone.

    Screen-Shot-2011-11-03-at-11-3-10.45.20-AM

    Each new input method led to not just a disruption but new platforms and new business models. Each new "sling" victimized a set of historic companies. Mainframe and minicomputers, consumer electronics giants and now telecoms.

    Just like David's sling, these technologies are not powerful in and of themselves, but rather, the way they are used makes them unpredictably sinister. The context of using capacitive touch on a handheld device rather than on a table-top makes it disruptive. Coupling it with high-speed mobile networks and powerful but efficient microprocessors made it into a force.

    That is now ancient history. The consequences and repercussions are still being felt and weighed, but the smart money should be focusing on the next shift. From the time frame in the diagram above, it's clear that the cycle time between "Revolutionary User Interfaces" is shrinking. It's been five years since multi-touch. Is the next "RUI" already here? Is Siri the next RUI?

    There are many things going for it:

    1. It's not good enough
    2. There are many smart people who are disappointed by it
    3. Competitors are dismissive
    4. It does not need a traditional, expensive smartphone to run but it uses a combination of local and cloud computing to solve the user's problem.
    5. It is, in a word, asymmetric.

    My disruptive hypothesis for Siri is that it shifts the competition from platforms positioned on a device to a "coupled" super-platform dependent on broadband and infrastructural computing.

    Just after collecting enough data and observing patterns in it that give us clarity, It looks like things are about to change all over again.


  10. Apple's Residual Enterprise Value is less than 7x Earnings

    Podcast · 70 comments

    In his third “The Critical Path” podcast, Horace Dediu explained how Apple’s cash can be viewed as a strategic option, an opinion that resonated also with other analysts [1]. Cash is one of the most flexible resources as it can convert quickly into other resources such as brands, companies, technologies, people and even processes. More cash means more strategic flexibility. The large cash reserve Apple has accumulated provides high flexibility for future investments. These characteristics of cash already imply an intrinsic option value. But how big is this value?

    Calculating Option Value

    To help us determine, I will apply the Black-Scholes model. The model has two key characteristics that are applicable to valuing the option character of Apple’s cash. First, the simple form of the calculation excludes dividends and, as far as we have seen, there is no new information available that would suggest that Apple will pay dividends in the near term. Second, it implies that the option can be exercised at any given time until the end of the option exercise period - just like any buying or investment decision made by consumers. Lastly, we will assume that Apple’s cash (including short-term and long-term cash as well as financial investments) is instantly available. Although large amounts are held by foreign subsidiaries or are invested in maturities longer than one year, we can overcome these practical issues by borrowing against it. As we are interested in the value of the whole pile, we use the latest reported figure of $81.6 billion as the strike price (or exercise price).

    What other inputs do we need to determine the option value of Apple’s cash [2]?

    • Volatility: A measure that determines financial risk of a certain asset. Apple’s share has shown a volatility of 26,1% over the last year.
    • The risk free rate determined by the 10 year US governmental bond interest rate: 1,96%.
    • A timeframe in which the option can be exercised. Let’s assume a 10 year timeframe in line with the risk-free rate and an imaginable horizon for mere mortals.
    • The value of the underlying (or what Apple is investing in):

    The return of the investment exercised with the cash at hand should yield a higher Return on Capital Employed (RoCE) than previously achieved to increase shareholder value. On the other hand, such a high cash pile also provides the flexibility to invest into lower return ventures. Such an investment would be taken if a certain technology or trend has been missed by management or becomes suddenly more important in the priorities of the company. In defensive moves or moat creating ventures, the expected return would be significantly lower or can even be negative. For the last twelve months, Apple has returned 106% in terms of operating income over its capital employed [3]. I use the return to value the underlying. For example, investing $81.6 billion in assets that yield 106% return equals a underlying value of $168 billion.

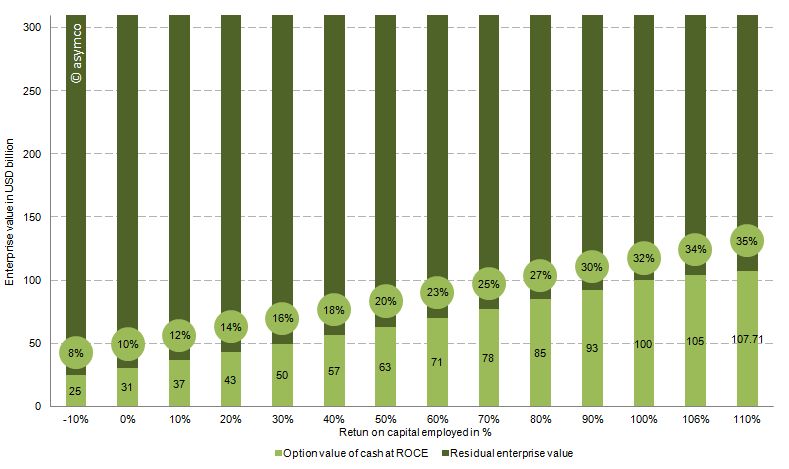
    The chart below shows the option value of the cash as a percentage of enterprise value of Apple (at the time of writing $310 billion) based on the range of the expected return on capital employed. Or in other words, how much of Apple’s current value is explained by the option value in holding such a large cash reserve.

    Conclusion

    Therefore, with the assumptions above and a RoCE from -10% to 110%, between 8% and 35% of Apple’s current valuation is explained by the option value of cash. We can see that even with large variations of the key input variables, Apple’s enterprise value is partly explained by the option value of cash which, in turn, is attributable to the sheer amount of cash at hand.

    If we look at the option value explaining 25% of Apple's enterprise value then 75% or $232 billion is the "Residual Enterprise Value" (REV) representing the value of Apple's cash flow generating operations. That puts Apple's valuation at 6.9x REV/EBIT 2011 or 6.5x REV/EBITDA 2011 -- fairly low relative to recent performance. EBITDA and EBIT have been growing at a rate of 70% for the last two years and at a rate of 84% over the last year alone.

    1. It’s good to be king (http://5by5.tv/criticalpath/3) , Apple: Behold The ‘iEndowment,’ Says Wedgewood (http://blogs.barrons.com/techtraderdaily/2011/09/20/apple-behold-the-iendowment-says-wedgewood/)
    2. For more information regarding option pricing see http://en.wikipedia.org/wiki/Option_(finance)
    3. Operating income of the last twelve month of 33.8 USD billion divided by capital employed of 31.8 USD billion defined as total assets minus cash (or sum of all asset excluding cash)
  11. Assessing the Smart TV Opportunity

    Research · 82 comments

    There has been increasing chatter about a new TV being developed by Apple.

    My opinion on the subject was summarized in the post called Tele Vision. I contend that a TV cannot be smart until the content it delivers becomes smart. The logical conclusion is that the value chain needs re-integration so that the component which is not good enough (the content) can be improved along the dimensions that users value. And it cannot be improved unless the direction it needs to go into is aligned with the direction of the disruptive innovator. I won't repeat the theory here, but it suffices to say that whatever will change television will do so by re-defining the core product not just the tools we use to consume it.

    But today I wanted to address another question: how do we value the opportunity? In a back-of-the-envelope manner, can we tell if this business is big enough to try to fix.

    The answer depends a lot on the business model of the disruptive entrant. The entry could depend on software or advertising or hardware or distribution, and each would have a different valuation.

    But for the sake of calibration, I want to start with a proxy. The basic question of how many "terminals" exist to the value networks. How many units of TVs are sold and how many could a new entrant convert to a new paradigm?

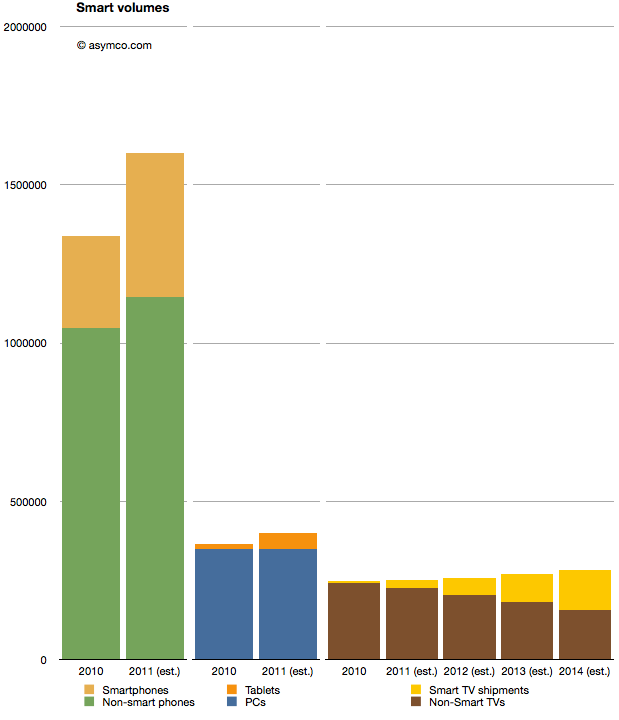
    I prepared the following chart showing the world-wide TV market with a highlighted subset of so-called "smart TVs" (source TRi). The market is shown from 2010 actuals through 2014 estimates. To make it more interesting I also added similar data for two other markets. Mobile phones and PCs with their own sub-categories of smartphones and tablets as equivalent "high growth" opportunities.

    When considering the opportunity, the Smart TV volumes are small relative to either tablets or smartphones. 2011 shipments are expected to be around 25 million Smart TVs, vs. 454 million smartphones and 51 million tablets. Looking forward, it seems that even by 2014,  smart TVs will be smaller volumes relative to either (projected) smartphones or tablets.

    A reason for this is that the TV market is not that big. It barely reaches 280 million units in 2014. Having reached saturation, the rate of growth is never assumed to be greater than 5%. The growth in the Smart TV business is assumed to be much higher however, being at least 100% in 2012, though off a low base.

    But the concept of what "smart" means in this forecast is troubling. Christina Bonnington at Wired highlights many of the failings of Smart TV.

    “In most cases consumers are buying a television with Internet connectivity as insurance. In other words, they are buying them just in case they need it in the future,” says Van Baker, a vice-president at the research firm Gartner. “Less than half of Internet connected televisions actually get connected to the Internet so clearly consumers don’t yet see this capability as a must have feature.”

    There is vast under-consumption even if the devices are being purchased. This looks eerily familiar to the smartphone market before they became usable by the vast majority through the transformative touch input method.

    So this market seems to be ripe for some serious re-definition. It may not be large today because there is nothing worth buying. Absent any innovation the forecasts can only foresee more of the same. If there is a breakthrough which "cracks" this puzzle then we might indeed witness unforeseen opportunity.