Asymco

Asymmetric Intelligence

Theory

  1. The face and the brand

    Research · 70 comments

    In the five years since the iPhone launched, Apple created a total of 35,852 retail jobs.

    Some of those jobs came from new store openings. The total store count went from 172 to 361, more than doubling. But the growth in employment was faster: from about 6400 to 42,200, more than quintupling. This is reflected in the total number of employees per store which increased from 37 in Q1 2007 to 117 in Q1 2012.
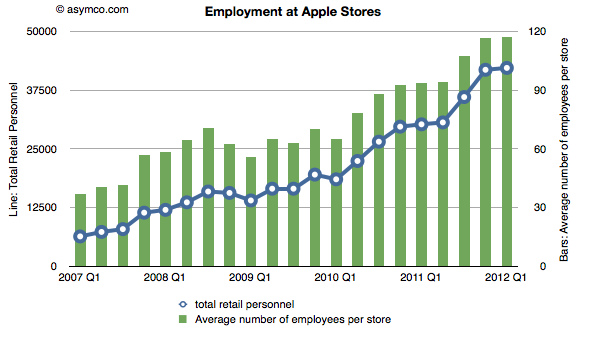
    Which brings up an obvious question:  Why did Apple triple employment at each store? One could answer that many of the newer stores are bigger, so-called flagship stores. But the vast majority of stores are in mall locations which are of limited size. Flagship stores alone cannot account for the increase. One could also suggest that perhaps the stores are open longer and there is a need for more shifts. Again, the vast majority of stores are constrained by the opening hours of malls which, as far as I know, have been steady. Anecdotally, it's also evident that there are more employees in a store at a given time. There are many more of those colored T-shirts at first glance.

    One hint is in the design changes in the stores. Apple has removed shelving, registers and almost all non-Apple merchandise. It has replaced the visible stock with tables on which rest products that can be used. If there weren't any people in the store, the store would look almost completely empty, just an open space.

    But that's the whole point. The stores are designed to be filled with people. The stores have an open layout because it allows more people to be inside the store at the same time. And the more people the more employees.

    We have the data to prove this: The visitors per store per quarter increased from 125k in Q1 2007 to 235.5k last quarter. Nearly double the number of visitors in five years. It's this increased traffic that is closest tied to the increase in employment. This is illustrated by the following chart:
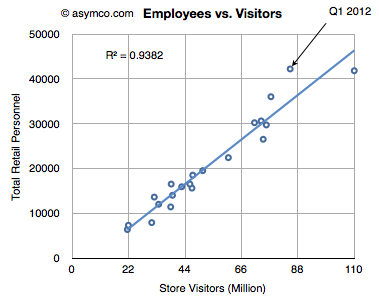
    Employment is very closely correlated with total visitors. In fact, employment has risen faster even than visitors. By dividing the number of visitors by the number of employees we see how the number has declined.
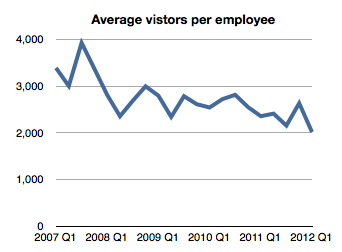
    [If we consider the time an employee spends working we can even guess that the average visit was served by about 14 minutes of employee interaction--this is up from 9 minutes five years ago.]

    If we assume this relationship as causal, then it might be that the stores are "tuned" to ensure a reasonable if not pleasurable experience for the visitor. In other words, the proxy for a "quality" experience is the assistance of an Apple retail employee.

    Taking this a step further, we can perhaps hypothesize that Apple is treating its retail stores as hired to provide a human touch to its products--not just as a service but as a way to listen and help in the most basic way. Steve Jobs once said that Apple no longer had to be present at trade shows because they have millions of conversations with their customers every day through their stores. These conversations happen with the retail staff.

    Through their Apple retail staff, Apple might even be said to be putting a face on their brand. You can see it in the advertising.

    The corollary to this would be that the job of the store is not primarily to sell things. This is confirmed by the fact that store employees are not on commission and there is no sales pressure on visitors. Indeed, the sheer number of employees in a store of modest size (117 employees on an average of about 8k sq. ft.) implies a brazen disregard for the economic orthodoxy of retail efficiency and incentives to sell.

    And yet the stores are astonishingly efficient at selling things. The statistics are off the charts in terms of sales per square foot and overall profitability. Even though this employee time has a cost, revenues and profits have all risen in unison.[1]
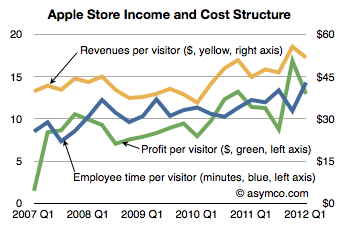
    Of course, the products have a lot to do with this performance. Apple stores sell desirable, popular products which are premium priced. But taking these desired products and coupling them with a "human touch" job to be done strengthens the brand as well as expands its volume of sales. It may be that Apple's retail approach could not work with a brand that was less desired. I.e. regardless of a large head count, a Sony store may not see the return on retail investment that Apple gets. Conversely, by not putting a face on Apple's brand the products may not sell quite as briskly. Ron Johnson said on the launch of the iPad that the stores were almost designed for it. Discovery and hands-on time create demand.

    It's as if Apple retail has an inter-dependence with Apple, the brand. One cannot live without the other.

    This is, as far as I know, a unique relationship for a technology company. If anything, most technology companies have sought the exact opposite: to put others' faces in front of customers--to break the messy process of sales and support down into pieces to be outsourced to "value adding" resellers.

    A pity then that this humanizing touch takes such a long time to build.

    ---

    Note:

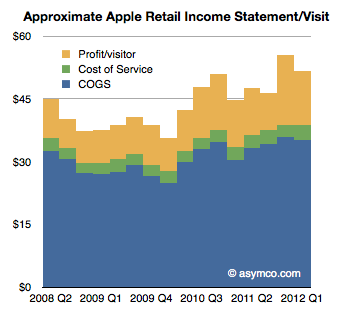
    1. If we take a visitor-centric point of view, the analysis of the retail business simplifies considerably.  We can even derive an "income statement per visitor". Revenues are measured per visitor (currently about $52/visit). Costs are measured in terms of employee time. A $15/hr average wage and 15 min interaction time per visit puts the service cost at $3.75/visit. Profit per visit is also measurable and it's currently at $13/visit. Therefore the employee "FaceTime" costs 7% of sales, while other costs, including the cost of goods sold, add up to 66% of sales.
  2. The evolution of the computing value chain

    Research · 34 comments

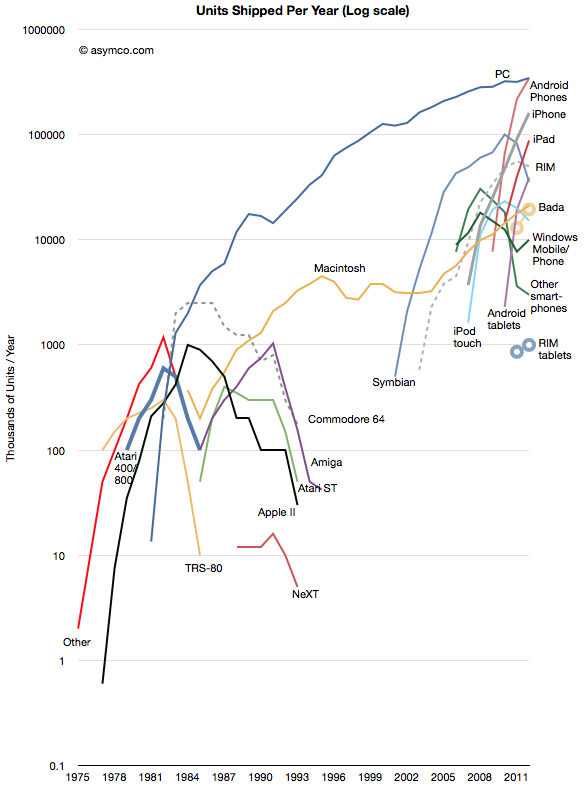
    The history of personal computing has come to be defined as the history of Microsoft. At least since 1981 Microsoft's operating systems have been the consistent market share leaders, and by a very large margin. That is about to change. This year Android will be on more devices sold than Windows. iOS is also set to also overtake Windows next year. The following chart illustrates the wave of mobile platforms that has emerged, and in spite of some notable failures, is overtaking traditional computing.

    Of course we should remember that PC themselves overtook entrenched predecessors like minicomputers and mainframes which themselves overtook business computing systems based on adding machines, typewriters and slide rules. This is the cycle of disruption and there is nothing new about it.

    However, it always seems to take people by surprise. This is because it happens in unforeseen ways and at unpredictable rates. And so it is that we are surprised by Microsoft's seeming abandonment of a business model that has sustained it for three decades.

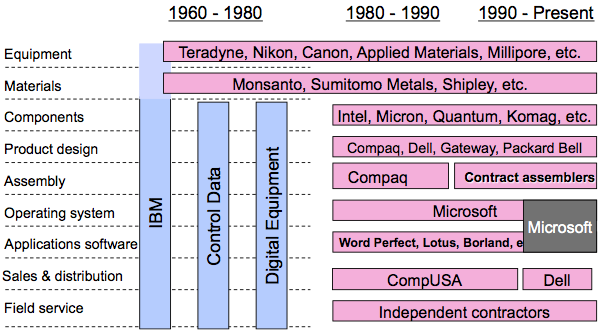
    Yesterday's reveal of Surface, Microsoft's first personal computer, was a watershed event in the evolution of value chains around computing. In a famous slide Clay Christensen illustrated (in 2004) the value chain evolution in computing from the 1960s to 2000.

    As computing moved from the desktop to the pocket the industry re-integrated. First, Apple moved from Product Design into Sales & Distribution with its stores. Then it moved into service with Genius bar. Then it moved into component design with the A series chips and unique batteries. Then it moved into materials with exclusive licensing of LiquidMetal. It also began to own the equipment used in its manufacturing. This in addition owning the operating system.

    Now we see Microsoft following in the same footsteps. First applications came early then stores, then service, and now product design. Google is also tracking closely behind as well with its acquisition of Motorola, the results of which have yet to be revealed.

    And so we can see value chains evolving in real time before our very eyes. They have always evolved but in technology industries they evolve far more rapidly and will continue to accelerate.

    Whether Microsoft or Google will be successful in their integration efforts remains to be seen. The challenges are immense as the value of the existing chains are enormous and the bonds that tie the company to them very strong. Breaking these ties will seem like value destruction and corporate antibodies will be set loose to kill the transitions. HP, RIM, Nokia and Dell are vivid examples of what happens when the response mechanisms have their way.

  3. The highway to hell

    Research · 57 comments

    A glance at Nokia and RIM's market values today shows that they are both valued below book. With respect to RIM,

    The company's share price has collapsed in the past year, and it is now only valued at about $5.4 billion, down from $84 billion at its peak in 2008. Excluding its cash and the estimated value of its patents, RIM's device business and its 78 million subscribers around the world are in aggregate worth less than $1 billion to investors.

    Analysis: RIM's new woes seen speeding loss of BlackBerry users - Yahoo! Finance

    With respect to Nokia,

    MKM: We are downgrading Nokia to Sell from Neutral following our U.S. retail Lumia model checks. We assume no value for the handset business and no value for the roughly four billion euros [about $5 billion] in net cash.

    Nokia Suffers From Hang-Ups - Barrons.com

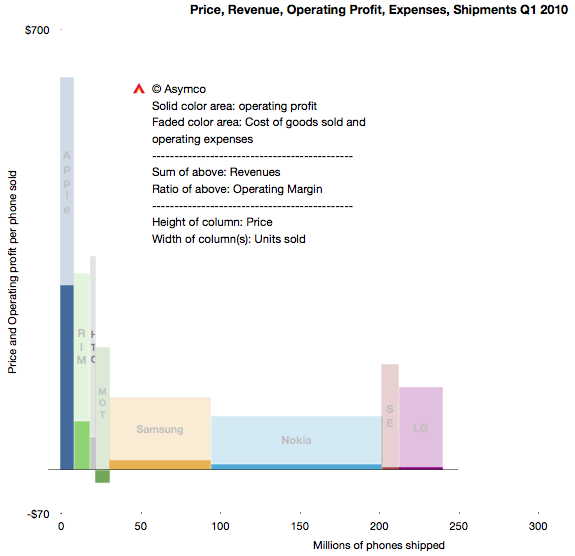
    Three years ago the situation was dramatically different. RIM's share price was six times higher and Nokia's about four times higher. Here's what the market looked like in Q1 2010:

    This summary view shows individual competitors in the phone market as well as their combined total volumes. The profitability/volumes/pricing can be visualized as well as margins and revenues.

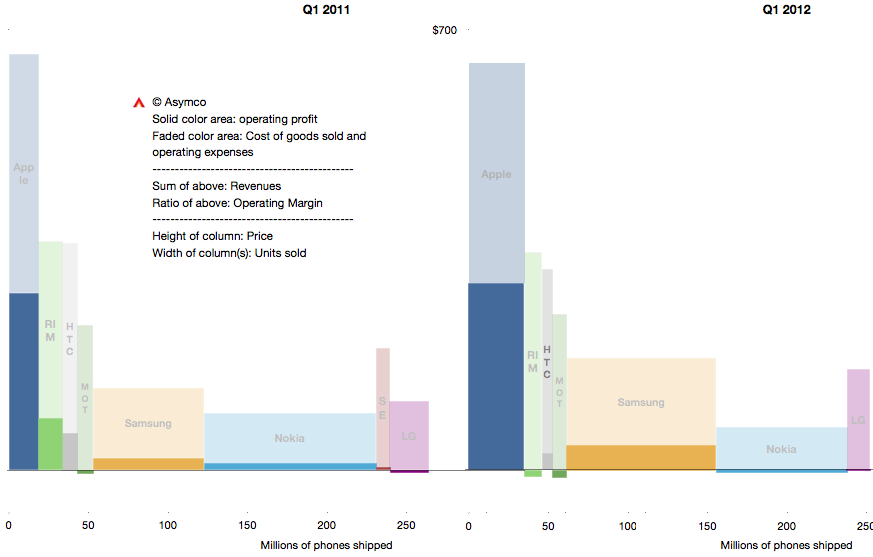
    The same visual summary is presented for the first quarters of 2011 and 2012 below:

    The change may be subtle to the untrained eye, but it can be summarized as contraction for most vendors and expansion for Apple and Samsung. RIM and Nokia not only contracted in terms of revenues and volumes but also, crucially, lose money.

    I've written about this before (many times.) But it's important to repeat again that this is a very short time span. Only three years separate the top chart from the bottom right. The "shape" of the market participants has not changed much but a tipping point has been crossed. This is the point where some participants are disrupted enough that they cannot recover.

    Did it happen in 2010, 2011 or 2012? We're only looking at data which results from hundreds of decisions and thousands of actions. It's improbable that there was a single moment when the shift occurred or a single decision that caused it. But it's equally improbable that the disrupted could have countered any of the actions that got them to this point.

    The cause (and remedy) for disruption is never found in a single act. It's a process and a way of operating and thinking. Is management to blame? That's always the answer. But how did management go from being smart to foolish so quickly and why did all managers in a firm, even an industry, conspire to become foolish at the same time?

    If you study the decisions on a day-to-day basis, management consistently applies all the lessons they learned that led to success in the past. But these lessons lead to decisions that end up with exactly the worst result possible.

    The crux of this dilemma is that doing the "right thing" leads to the wrong result. In a comment I questioned the possibility of management in a public company solving the dilemma.

    Some have argued that public companies with professional managers entrusted with fiduciary responsibility are inherently incapable of solving the innovator's dilemma and are thus doomed to be disrupted. I'm starting to believe the argument. Whenever you as a manager try to work out the solution to the dilemma, you encounter a value destroying obstacle that cannot be surmounted while maintaining your position in the company. [As you attempt to solve it, you lose your position] Your successor won't make the same mistake and [thus] the whole enterprise collapses.

    There are counter-examples however. The reason Apple should be studied is that it gives hope that they have cracked this problem.

  4. Shipped and sold: A brief introduction

    Research · 39 comments

    Markets are difficult to measure. Mainly because the information is not easy to obtain and that which is obtained is not made public. Collecting, analyzing and filling in the gaps is big business with many firms involved in selling it.

    However, with all the analysts and companies selling and promoting their "numbers" it's important to understand the difference between the methods used. There are for instance at least the following measurements:

    1. Units sold to end users. For example NPD or GfK data of retail transactions. Also Gartner's estimates for phone units sold.
    2. Units sold to the channel. For example units recognized on income statements usually reported by companies. Also IDC's estimates for phone units sold.
    3. Units in use. For example comScore and Nielsen survey data.
    4. Units "activated". The measurement Google uses to describe Android performance.
    5. Intent to buy. For example ChangeWave surveys of early adopters.
    6. Utilization rate. For example browser statistics.

    Each measurement tells a different story about the market but the best story is told when all data is analyzed in a combined integrated market review.

    Before diving into that it's important to understand the difference between the first and second measurements or the difference between shipped and sold.

    What does "Sold" mean?

    Let’s say that you sell a phone to another party. What constitutes a sale? The sales agreement? That you shipped it? That he wanted it? That you were paid for it?

    What if he changes his mind and returns it? Is it still a sale? What if a manager's bonus depends on these sales? What if the company’s share price depends on these sales? Is there a way to rig the accounting?

    As it turns out, yes there are; many ways. Unethical and fraudulent practices happen surprisingly often. A classic instance would be: A customer is shipped ten phones, though he only wants one, and he gets paid to ship the other nine back, after the close of the year.

    The sales manager records ten times the sales he actually made, making ten times the commission and the company’s stock price rises. To compound the offense, the manager could also tip his friends to short the stock at the end of the year, leaving investors “holding the bag” when the inevitable correction follows.

    There have been so many cases of this kind of accounting fraud that the FASB (GAAP), SEC, and IFRS have placed a very stringent definition on “revenue recognition”. This means that although you can sell all you want, the company can only recognize the proceeds and profit in the financial statements according to strict rules.

    In the case of hardware (Sales of Goods), the customer must receive it (“delivery has occurred”), and like it enough to not return it (“amount to be refunded”), and be able to pay for it (“collection is probable”). If some are projected to be returned or unpaid, that percent is subtracted from total revenue. In the case of software (Sales of Services), it is generally accounted for over a time period. And because it is customary to send the customer upgrades, the revenue must be spread out over the time the service is provided. (“upgrade rights … 24 to 48 months.”)

    It gets complicated when a piece of hardware has upgradeable software. The rules used to stipulate that the hardware, in its entirety, must be accounted for as a service and have subscription accounting. This is how Apple had to report sales during the first few years of the iPhone. It still defers some revenues for its hardware, mainly on account of iCloud, but the vast bulk of hardware revenue (96%) is now accounted upfront, recognized upon the product's acceptance by customers. 4% is for software upgrades and is accounted for over a specific lifetime of the product (24 months in the case of the iPhone).

    What does "Shipped" mean?

    The discussion so far implies that if a product that is accounted for as "Sold" on an income statement does not mean that it's in the hands of an end user. These "revenue recognized" products are sold to a distributor, typically for a phone that's an operator.

    These sales satisfy the requirements for financial reporting as revenues booked. But they are not in the hands of users. Nor are they "activated" and they don't generate page views that are measured by web analytics companies. Most analysts and companies now use the phrase "Shipped" to describe these revenue-recognized units though it's also common to hear "sold".

    When a product sells to end users it's sometimes called "sell-through". It's counterpart is "sell-in" which is sales to the channel distributors.

    A big gap between sell-in and sell-through might imply large amounts of in-channel inventory. This is product that is sitting either in stores or in warehouses or on trucks in transit. If sales are steady, the inventory is measured in time as in "weeks of inventory". This means that the excess is expected to be sold within a fixed time frame if shipments were to end. The smaller this amount, the better or "tighter" the operations are. Inventory, as Tim Cooks says, is fundamentally evil. It eats capital and erodes profitability.

    Sometimes miscalculation of sell-through could result in vast amounts of inventory that has to be returned by distributors. That inventory is either written off or sold at fire sale prices resulting in a "write-down". This happened recently with both the HP TouchPad and with the RIM PlayBook. This special charge against income is a one-time (usually) incident but it can also affect a firm's reputation with channel partners for a long time. This type of failure is very costly.

    Therefore what matters most is to keep the difference between Sell-in and Sell-through as small as possible. However, it can't be too small. Sometimes if Sell-through is too fast, you get stock-outs which means that there is more demand than supply and sales opportunities are missed. This has happened many times with iPhones and iPads. This is also an unwanted situation (unless there was too much inventory in the channel during the previous period and thus it was being drained in the current period.)

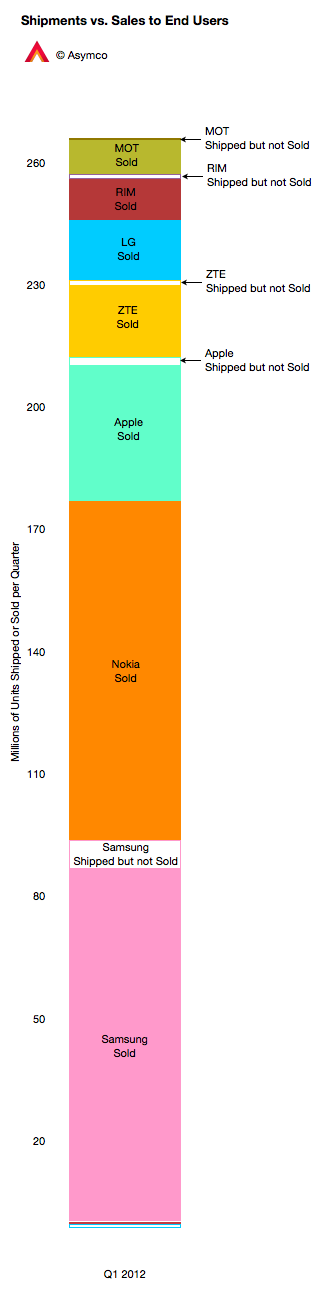
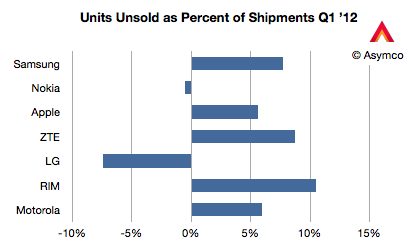
    The chart to the left shows how the phone market looked for various vendors last quarter. I compiled the data based on Gartner's "sales to end users" and IDC's "shipments" data. Two vendors had higher sell-through than sell-in (Nokia and LG) probably because they were draining excess inventory. The others had channel inventory of between 5% and 10% of units shipped.

    This ratio is shown below in a chart comparing the largest phone vendors.

    Management is often rated for performance on this metric, as they should be, since it's a measure of operational skill. However, there are many factors that affect overall performance.

    New product launches, windows of opportunity related to seasonal buying patterns, anticipating macroeconomic slowdowns, even natural disasters and legal challenges can affect this metric.

    Understanding the overall market requires an appreciation of this distinction but also an understanding of all the other metrics listed above and what stories they tell.

    ---

    Notes: My thanks to Michael Dediu for input on this discussion.

  5. Interview with Bruno Ferrari of Exame magazine Brazil

    Research · 10 comments

    My thanks to Bruno Ferrari of Exame magazine Brazil for asking the following questions. My answers were written two weeks ago on April 2nd.

    Based on financial data of the first fiscal quarter, it is possible to confirm that 2012 will be the best year in Apple's history?

    Actually, it's possible to confirm without looking at first quarter data. Every business line Apple has except the iPod is growing and is likely to keep growing during this year. That means that sales will increase over 2011, which was Apple's biggest year. You can see historic sales growth data here:

     What are your predictions for the second fiscal quarter?

    I published my predictions here.

    The iPhone number seems to be higher than consensus. It's aggressive but I'm basing my opinion on the launch of the iPhone 4S in China and the Chinese New Year and new carrier agreement there. Also the iPad will do quite well.

    Do you think Apple will hold the iPhone 5 launch to September in order to open 2013 with an extraordinary result?

    The next iPhone will launch between June and September. It might be earlier due to the 4S being the "wide end of the egg". Think of the iPhone as an egg rolling down the hill. There is a sharp end and a wide end and the speed of rolling depends on which end is down.

    Besides the iPhone 5, which products that Apple could announce in 2012 you think may help them to maintain this extraordinary growth?

    I think the iPhone is becoming more predictable. What I'm more curious about is what they will do with the iPod. Apple takes its brands seriously. I am watching the iMac, MacBook and iPod for clues of a re-fresh or replacement as they have aged.

    Do you think we will see the “iTv”? Do you think it could be “the next iPad” of technology market?

    Apple TV is in waiting mode. It's like an airplane circling, waiting to land. Something will happen but not sure when. Fundamentally, the opportunities are still there but the entertainment industry is very complex. The more complicated it is the more necessary for an entrant is to create a parallel version of it. That takes time.

    The building blocks are all there however. See additional thoughts here.

    If we analyze the growth of Apple in recent years, it is supported by the launch of new products, especially the iPhone and the iPad. Do you think Apple can lower your rate of growth in coming years since we don’t see in its roadmap new innovative products like a new smartphone or a new iPad?

    New products created new growth but iterations of those products also created and will continue to create growth. Of all of Apple's products only one product is not growing today, the iPod. And that is after 10 years in the market and with a "dominant" market share. In addition, Apple has a lot of room to expand internationally and into enterprise and professional sectors.

    I do agree that 100% growth is hard to maintain without new products. I believe there might be a few products still waiting for launch. TV is one area (along with game-based entertainment). New user interfaces might be enabling new categories of products. Intelligent assistance and companionship are open problems that software can solve but which have not been productized.

    When do you think we’ll stop to see Job’s legacy in Apple new products. And what then?

    Jobs' legacy is not in specific products but in how products are built. He also taught the importance of putting products first and markets second (this is, at its base, an artistic principle, not a commercial one). I think that legacy can last forever, if managed properly.

    How do you analyze the dividends pay and the buyback made this month?

    I wrote some thoughts about it here. I believe the impact will be mostly psychological for investors.

    And finally, I was reading at Asymco some analysis of Apple’s share price. Do you think $600 is enough? Do you think in a 1 trillion dollars company in 2014 as some analysts are saying?

    The share price depends on the psychology of people. I like to say that Apple is the same exact company today as the one that was priced at $78/share three years ago. When I look out the window of my office I see the same view year-to-year. When I look on my computer screen at Apple's financials I also see the same view year-to-year. I don't know how people can see Apple differently one year to the next. To me it's like looking out the window and seeing mountains instead of the sea.

    But this is how markets behave. I can't say what the price will be. It may be $1000 or it may be zero. But the company will not change in either case. It won't change because it does not need to change.

  6. Why was Wall Street surprised by Apple's performance?

    Research · 75 comments

    The Earth's axis is tilted relative to the orbital plane it follows around the Sun. The angle is about 23.44 degrees. Because of this axial tilt, the intensity of sunlight incident on the northern and southern hemispheres varies alternatively throughout the orbit, which, by its duration, is called a "year". This change in sunlight intensity causes weather changes. Colder when there is less light, warmer when there is more light. Life on Earth became used to this cycle and humans came to call these changes in weather "seasons".

    The warm seasons became the easier seasons for people, especially when agriculture was introduced, since that was when food grew.  Because of the geography of landmasses on Earth, humans became more concentrated in the northern hemisphere. As the northern hemisphere turned away from the Sun darkness and cold returned every year. When that darkness was at its worst people decided it was time to celebrate the return of warmth and sunshine, and thus plentiful food.

    So it became very common in northern lands to celebrate the winter solstice or the darkest and coldest time of the year. The amazing thing was that all peoples did this regardless of culture or geographic location. In fact, it became common to mark the end of year at around the same time as the solstice. A new year was said to begin when the Sun began to move higher in the sky every day. The Europeans celebrated the solstice with a festival which eventually came to be called Christmas and the Chinese celebrated it as a Winter Festival which came to be called Chinese New Year.

    As part of these celebrations, gift giving also became the default practice. And so, around what came to be called "December" and "January" most of the people in the Northern Hemisphere gave gifts to each other. Interestingly, as people migrated to the southern hemisphere they kept the same festival schedule so that gifting was done in what was the height of summer!

    What Wall Street seems to have missed is that the gifting season is a global event spanning into January. In other words, buyers of iPhones aren't concentrated in one part of the planet and they don't all celebrate one single gifting festival.

    The reason lies in the way the Earth is tilted and the way the continents are arranged upon it. So perhaps a better understanding of astronomy and geography would have helped investors make decisions during the past few weeks. I suggest remedial lessons for those who missed this.

  7. Did the dividend decision affect Apple's share price?

    Research · 23 comments

    One of the arguments made for the cause of the increase in Apple's share price of late has been that dividends would attract more institutional investors and provide more liquidity to Apple's shares. Can we test this argument?

    We're not dealing with speculation. The decision to start paying dividends was made three weeks ago. It makes sense to assume that this new information has been absorbed by the  markets and market participants have adjusted their positions. Funds that were previously restricted in their investment in Apple due to its lack of dividend policy, could now go ahead.

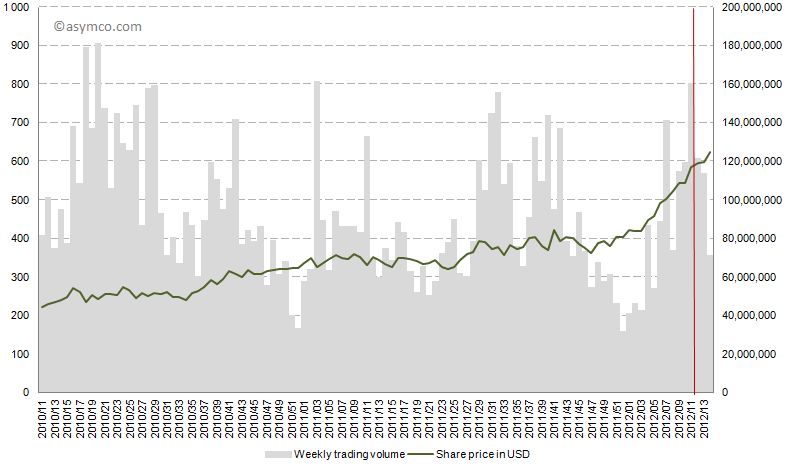
    However, as the following chart shows, the share price climbed continuously before and after the dividend declaration of March 19th (shown in red). Trading patterns did not show unusual highs or lows. In fact, after March 19th the trading volume decreased on a weekly basis.

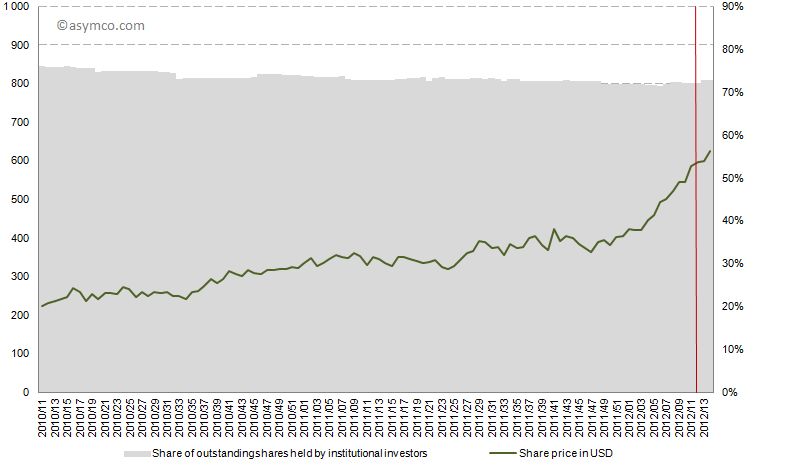
    The other indicator is institutional holdings. The share of institutional investors as percentage of all outstanding shares did not increase significantly, and has been in an overall decline since late 2010.

    But this lack of visible response to the decision should not be surprising.

    Dividends are a tool to adjust capital structure based on optimal investment decisions. Dividends do not add value. The value of a company reflects the perceived net present value of all free, future cash flows. Whether the cash is in or out of the company is immaterial to its value. In either case the cash belongs to shareholders.

    What the market is reflecting is fundamentals, not any change in liquidity due to "more buyers" available. For a long time the fundamentals were not accepted as sustainable. The best explanation for the rise in the share price is therefore that the company's future is now becoming clearer and a cloud of doubt is being lifted.

  8. Apple at $600. Who knew?

    Research · 90 comments

    Apple's share price has increased rapidly in the last few weeks. The rise to $600 was swift and broke the pattern of slow growth the the stock was able to obtain over the past few years. The level, however, shouldn't have been a complete surprise.

    I think Apple is going to $600...It's really not that complicated. Apple has a number of key drivers in its business model which have yet to be properly priced into the stock because I think it's very cheap at this level.

    -Stephen Coleman, chief investment officer at Daedalus Capital

    This prediction was made October 26, 2007. On that date Apple's share price closed at $184.7. It may have seemed like a bold bet, but as Coleman noted, the reason why it would reach $600 was easy to spot.

    The real story on how I get to that valuation doesn't even involve the sale of (the Leopard operating system) or the growth in the Mac business. How I get there is through the iPhone itself.

    What was not easy to tell was when it would reach $600. Back in October 2007 the stock had a P/E ratio of 48. It's PEG(trailing) was 0.65, and cash per share was $17. Sales were $6.6 billion for the quarter and earnings were 98c/share. If an analyst were to take those ratios and apply a forecast of sales five years hence, the $600 price would have been reached much sooner: Sales had tripled by 2010 and earnings had tripled by 2009. In contrast, the stock took until 2012 to triple.

    The delay of one or two years is perhaps reflecting the risk involved in investing. Namely, you can predict outcomes but not their timing.

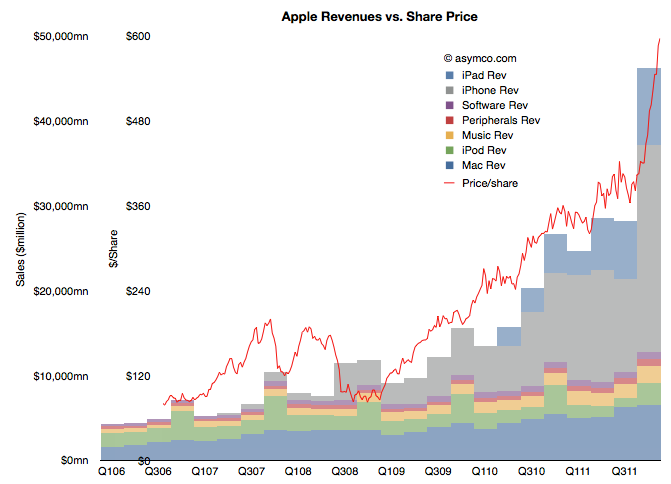
    But still, we have to return to the question of why the stock has rallied in the past few weeks. There has been no new information about the company since it reported earnings and any product launches (e.g. new iPad) or increased distribution (China) are completely predictable.  Curiously, the market did not react until late in the quarter. The following chart shows the phenomenon.

    (Note the two scales on the left: inner is share price, outer is net sales)

    It shows the share price as a line superimposed on the sales chart with stacked product revenues. The recent rise can be attributed to the rise in revenues/earnings from the fourth quarter. But why would a stock react in March to data from six months earlier (and published two months earlier).

    Classical market theory suggests that markets anticipate and "discount" the future. Efficient markets supposedly react to all available information and do so instantly. If that was the case, the chart above would show the red line shifted significantly to the left.

    What we are observing is market inefficiency.

    Inefficiency implies that perception of reality is not the same as reality. It happens when people are reluctant to believe the truth. It's also implies that with $15 billion being "bet" on the share price every day, each one of those bets is misinformed!

    The cause of this divergence between reality and perception is that disruptions are divergent from perceptions. A disruptive company always "leads" its valuation. There is cognitive delay for the vast bulk of observers. You can then argue that for those, like Mr. Coleman, that don't suffer this delay, there will be profit.

  9. What is disruption and how can it be harnessed?[1]

    Research · 49 comments

    The phenomenon we call business disruption could benefit from a different name. Although it signifies a disturbance or an interruption in an industry, it's much more than that.

    The nominal definition I work with is that disruption is the "transfer of wealth in an industry from dominant incumbents to disadvantaged entrants." It's a convenient definition because it's brief, it puts the emphasis on economic value and because it alludes to a reversal of fortune and the implied extraordinariness.

    However, there are several nuances lost and contradictions ignored in this definition. I want to enumerate them here and now:

    1. Although in a disruption there is a transfer of wealth, that wealth is not necessarily conserved. An industry that undergoes a disruption often emerges larger, more productive or more influential. Disruption typically creates net growth.
    2. Although extraordinary and spectacular it is also very commonplace. Disruption is not rare. In fact, it rarely fails to happen. One could even say that if it does fail to happen, it's a symptom of an industry in crisis.
    3. Being so common, it can be seen as a regular occurrence. But if the regularity of disruption can be considered to have a clock cycle, its frequency is increasing.
    4. Disruption in the literal sense implies discomfort, displacement and even destruction. But it's necessary to the health of any economy. The analogy to biology is that death is the most important thing in life.
    5. Although only recently characterized and studied in cases set in the past century, the pattern is evident throughout history.

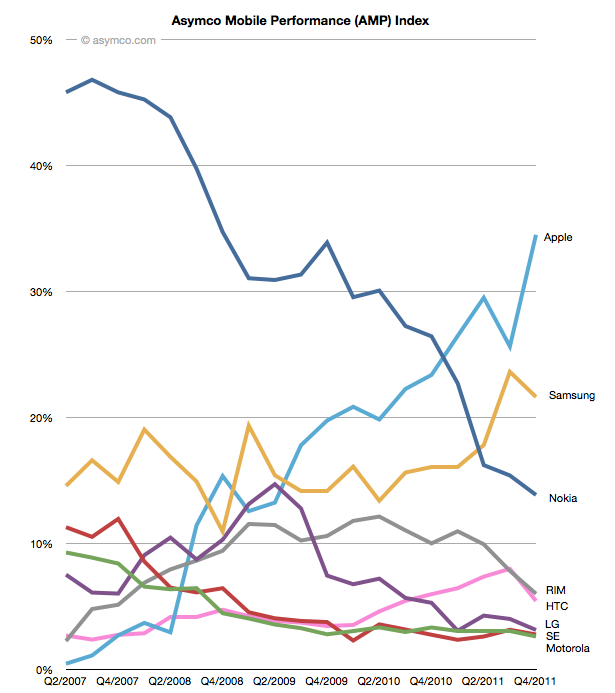
    I've offered examples of these consequences or side-effects of disruption but I'll emphasize once more the example I'm most familiar with. To illustrate the primary definition, the AMP index is a measure of the success of one company relative to a set of peers in the mobile phone industry. It's the average of four market shares: mobile phone units, smartphone units, revenues and operating profits.

    This chart shows the shift in AMP index values for the competitors whose data is public and which make up the vast majority of units sold:

    The reversal of fortunes, though not complete, is clearly evident. Motorola and Sony-Ericsson, two of the brands that were a significant part of the mobile phone landscape for more than a decade, have ceased to exist as independent companies. A third, LG, is likely to follow. Nokia, the most successful phone vendor for the decade of the 2000's is in severe distress at this time, valued barely above book. RIM, a pioneer, is priced below book value and HTC, another pioneer is also looking for a way to remain relevant.

    But we have to appreciate that as these valuations evaporated, the market grew both in value and in volume. The overall spending on phones has never been higher. The total profits captured is also growing. By any standard, smartphones are a booming business. Queues form for the latest versions, there are supply constraints and media coverage is almost universal.

    We also have to appreciate that the Nokia that is faltering today was itself disruptive when it gained its prominence. In the 1990s the mobile phone market was dominated by Motorola, then by Ericsson. Nokia was a relative latecomer and succeeded by being better in some regards (e.g. the ease of use of text messaging on its phones) but also by being asymmetric. Using logistics and a portfolio approach to the market allowed it to build scale while maintaining margins. Process innovation led to component shortages for competitors and allowed Nokia to build massive distribution. It also allowed it to invest in software which gave it a unique selling point for several years.

    Looking into the even more distant past, the mobile phone market has seen several waves of disruption. Going from analog to digital was such a turnover. The companies which were successful with analog (mainly Motorola which supplied not just handsets but infrastructure) were sidelined when global digital standards took root. Integrated European vendors dominated a period when 2G GSM was becoming predominant. Isolated pockets of integrated innovation like iMode in Japan also had mini-booms but were swamped by standardization and the Galapagos syndrome.

    And let's not forget that mobile itself has been disruptive to fixed line telephony. Looking at all telecom, the transitions from fixed to mobile, analog to digital and most recently feature-based to computing-based platforms have all been disruptive, bringing a new set of companies to lead while incumbents fretted.

    It should also be noted that these changes are happening more rapidly. The chart above has a five year period. The change from analog to digital took longer. Over 10 years since its inception analog was still dominant. If we look how long it took for mobile to take consumption away from fixed, that process is still ongoing, several decades later. The speed is so slow that some countries have skipped over fixed networks altogether.

    With software-defined devices and cloud-based distributed computing the changes will become even more rapid. Even though the user base is expanding to cover nearly the entire global population, the replacement rate of devices means that change in the tools and services people use are limited by supply rather than demand. Supply-based innovation or "the new manufacturing" will probably be the dominance-defining asymmetry of the next decade.

    The disruption of mobile phones that Apple has foisted on the world through iOS has caused it to reach a point where it dwarves the values of other companies, not just in the sectors it competes, but in all sectors. Some suggest that Apple is an anomaly and does not reflect the economy. To truly understand the state of the economy, they say, means to subtract Apple from it. But I feel this is exactly wrong. Apple is, through the iPhone and iOS ecosystems, defining this era. Just like Microsoft defined an era of increased productivity through the creation of the "knowledge worker", or like GM re-defined transportation and the notion of the brand in the 50's, or like IBM re-defined business process efficiency with automation in the 60's and 70's, these companies were not anomalies of their era. They were the eras. They were the locomotives of growth that taught other companies how to operate and the contemporary managers how to manage.

    Companies that study Apple today will benefit by understanding how it re-wrote the rules. The anomaly is the norm. The exception is the rule. The times they are indeed a-changin'.

    Finally, to put disruption in a historical perspective. I wrote a retrospective on the history of the telegraph as a parable of how disruption could be interpreted to have happened even a century ago. What I hope to do now is to show how, given this set of spectacles, we can see how the fate of nations was determined, in part at least, by the ability of leadership to accommodate disruption.

    The case of growth or limits to that growth, the question of integration vs. modularity and the evolution of value chains all have application for regulators, policy makers and political leaders.

    The dialogue on this topic will begin in Amsterdam on April 13th 2012, at Asymconf. I look forward to seeing you there.

    ---

    Notes:

    1. This is the material accompanying the first case discussion at Asymconf. Participants are encouraged to read it before the show.
  10. The new feeds and speeds: iPad vs. MacBook Air and iMac

    Research · 81 comments

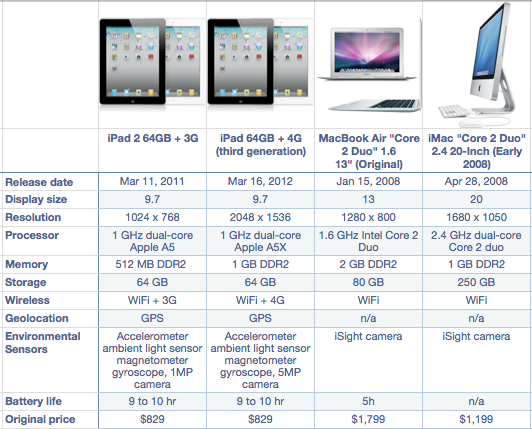
    At last year's iPad 2 launch, I compared the specs of the newly announced iPad with those of a laptop and desktop from five years earlier. This year I am comparing the new iPad with Apple's computers from four years earlier:

    The new iPad now exceeds the total display resolution, has similar speed and storage capacity while having twice the battery life of the thinnest laptop of four years ago. It also has very high quality cameras and GPS and cellular network connectivity which have yet to appear on mainstream PCs. It's still a lot smaller and half the price and has a larger selection of available software titles at prices a fraction of its elder cousin.

    The only value that a desktop of 2008 has over a new iPad is the size of the screen and a larger hard drive.

    The point is not so much that the usurper is a "better" computer but that it has come from non-existence to being a contender in two years. It is also narrowing the gap to its comparable ancestors by one year, every year. Arguably that gap now stands at four years.

  11. How much does it cost to manufacture an iPhone?

    Research · 98 comments

    An iPhone generates approximately $650 in revenue for Apple. This figure has remained fairly steady over time. Using deduction from overall margins, it's possible to estimate the gross margin on the product to be around 55%.

    That means that the cost of goods sold (COGS) for the iPhone is about $293. Is that a lot? Where does that money go? What else does it tell us about how the company operates?

    To find out we need to understand the cost structure of phone building.

    Typically there are four main categories of costs for a phone:

    1. Bill of materials (BOM). This represents the cost of the components that go into the device. These are paid to suppliers.
    2. Transportation/warehousing. This is the cost to transport and store the product before sale. This is paid to shipping companies and warehousing.
    3. Manufacturing cost (including labor). This is paid to contract manufacturers.
    4. Warranty expense. This is paid back to customers for returned product that can no longer be sold.

    We can estimate a device's BOM through a teardown analysis and there are firms that do this. Usually this offers enough competitive insight into the cost structure and hence gross margin because the other items are predictable in that they do not vary greatly from product to product.

    In the case of the iPhone the BOM has been fairly steady around $200 for a new model. That leaves quite a big gap to the overall COGS of $293.

    Could transportation, manufacturing and warranty costs really add up to $90 for an iPhone?

    The manufacturing costs are not usually discussed in detail openly because the processes used are secret. However, thanks to and ABC Nightline report,  some clues have emerged about how iPhones are built and, although incomplete, they offer some interesting bounds.

    One data point recently published is that the iPhone takes 24 hours to be built. Of that 6 to 8 hours is spent in "burn-in" to install and test the software and components automatically. This leaves about 17 hours unaccounted for in the throughput time. Could this time be spent in labor intensive operations? In the ABC report the wage of workers on the line is given as $1.78/hr[4]. 17 hours of labor input would imply $30 labor cost per iPhone. That seems a lot higher than the industry (i.e. iSupply's estimate is $8 for manufacturing cost.)  This is an upper bound. Obviously, those 17 hours could be spent in automated operations which were not shown or simply sitting idle, waiting for a process to begin.

    Is there another way we can check this?

    There is. The ABC report also mentioned that there were 141 (presumably labor) work steps in the production for an iPhone. If we knew the time each step took we could obtain another estimate. For example, if each step in the human assembly process took 3 minutes[2] then human hands will touch the iPhone for 423 minutes or about 7 hours. This would imply a labor cost for an iPhone of about $12.5. If each step was longer or shorter, the cost would vary accordingly.

    Unfortunately we can't be sure of the exact cost. However, these recent clues offer some interesting bounds and observations[3]:

    • Manufacturing costs for the iPhone are likely to be much higher than comparable devices. This is partly because of the design of the product and partly because of the quality testing needed.
    • Those costs are likely to range between $12.5 and $30 per unit.
    • The iPhone manufacturing costs are likely to be twice or three times the average.
    • Labor costs are still a small part of the overall cost structure at between 2% and 5% of sales price.
    • The high level (141 steps) of human interaction in the process could be automated however, the fact that it isn't implies that the cost of automation would be higher and the flexibility of the automated process would be lower. It's much more likely that the process is a mixture of labor and robot intensive sub-processes.
    • Even if we assume a $30 manufacturing cost, there is still $60 that needs to be allocated to transportation and warranty expense. These require sanity checks as well.

    ---

    Notes:

    1. Note that R&D (engineering and development) and Sales, General and Administrative (e.g. Marketing) costs are not part of this cost structure. They are considered fixed costs and are not allocated to individual units of production.
    2. Note that during the ABC video there was mention of automated instructions being broadcast to the line. This implies that each worker is working on a "clock cycle" and each work stage is timed to take an equal amount of time. This clock cycle time is crucial in understanding the cost structure. One further clue to this cycle time comes from the iPad output rate per worker. This was mentioned in the slide show to be up to 6,000 units per day. Assuming 10 hours of working time per day means 600 units per hour or 10 per minute. This seems extremely high as the worker would have to handle the product for only six seconds. [UPDATE: Apple clarified this point: "In manufacturing parlance this is called deburring. Her line processes 3,000 units per shift, with two shifts per day for a total of 6,000. A single operator at Ms. Zhou’s station would deburr 3,000 iPads in a shift"]
    3. As this post shows the amount of information that can be obtained from observing operations can be significant and lead to competitor advantage. It should be clear why this is not something done willingly.
    4. UPDATE: In a statement Foxconn clarified wages as "We have over 75 percent of the employees in the category of earning at least 2,200 RMB ($349/month) basic compensation standard. That means they are earning 13.75 RMB ($2.18) per hour".