In previous posts I described the patterns of asset value growth for Property Plant and Equipment at Apple and how that change has been thus far correlated to the production of iOS devices.
The analysis was based on looking at the declared value of the PP&E assets on Apple's balance sheet. These values include depreciation so they reflect not only the "spending" on new assets but also the value lost due to wear and tear. As such it's not a perfect measure of investment.
The better approach is to use declarations on the cash flow statement. Apple reports a specific cash flow related to PP&E: Under Investing Activities, Payments for acquisition of property, plan and equipment.
In the latest 8-K the amount for the 12 months ended September 29 the value was $8.295 billion.
Compare this with the statement in the Annual Report from one year ago:
The Company anticipates utilizing approximately $8.0 billion for capital expenditures during 2012, including approximately $900 million for retail store facilities and approximately $7.1 billion for product tooling and manufacturing process equipment, and corporate facilities and infrastructure, including information systems hardware, software and enhancements.
Compare also with the PP&E net asset value on the Balance Sheet currently at $15.452 billion but valued at $7.777 billion a year ago (an increase of $7.7 billion).
This means that Apple intended to spend $8 billion, actually spent $8.3 billion and realized a net asset gain (after depreciation) of $7.7 billion.
So there are no major surprises. The spending was only about 4% above expectations a year earlier.
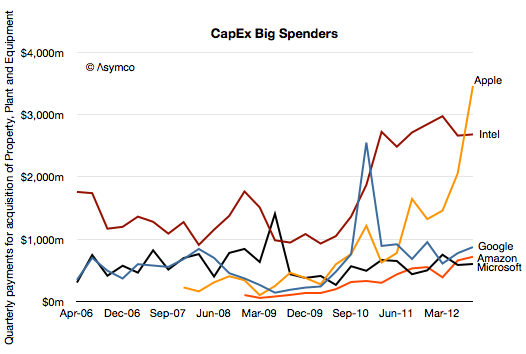
The other pattern to observe is that the spending rose dramatically into the fourth quarter. The fiscal quarterly spending was:
$1.32 billion
$1.46 billion
$2.06 billion
$3.46 billion
I illustrate this pattern (and previous quarterly spending) in the following chart.
The question remains what is this $8.3 billion being spent on?
To help answer I also added the comparable spending (from cash flow statements) of a few other technology companies. Google, Amazon and Microsoft have been spending in the same range of $500 million per quarter. Over the past eight quarters the average spending of these companies has been:
Amazon $487 million
Microsoft $583 million
Google $800 million
Intel is different. Its average spend level has been $2.6 billion/quarter.
But Apple has just spent about 30% more than Intel. And it spent three times in Q3 than Google, 4.8x Microsoft and 3.8x Amazon.
The level of spending and growth from a far lower level implies to me that Apple is spending primarily on process equipment (aka tooling) rather than servers. Data centers are expensive at $1 billion for a large one, but they are not being built fast enough to account for $3.5 billion in one quarter.
Note that Apple's CapEx is above that of Intel whose fab-based semiconductor production method is known as particularly capital intensive. And Intel's Capital Expenditures have been increasing to all-time highs.
If Apple spent at Google levels on server infrastructure it would only be spending a quarter of what it's actually spending. If Apple spent on production at Intel levels it would only be spending three quarters of what it's spending.
In other words, Apple is spending at the equivalent of one Intel of fabrication and one Google of server infrastructure.
In a few days we will learn what the plan for expenditure for fiscal 2013 is. Historically, the company has roughly doubled spending for each year of the iOS platform. If that continues then Apple will be spending the equivalent of several Intels and several Googles.
Matteo Fumagalli is a student of economics at University of Insubria, Italy. He is writing a thesis for a bachelor's degree analyzing the smartphone industry.
He asked me to answer the following questions:
-First question is about you. Why did you found Asymco?
I founded the company to develop software, mainly apps. I began writing the blog as a way to drive traffic to the site. I would have preferred to build a blog only but did not think it was possible to earn any money doing that so I treated it as a hobby. Even after the site became more visible I changed from development to consulting and did not expect that writing in itself could be self-sustaining. It took about two years before I felt comfortable with the idea that I could do writing and speaking exclusively. I am still exploring additional business models however.
-You worked 8 years as analyst and business development manager at Nokia and you anticipated their current crisis with your first post on Asymco. Do you think Nokia will have the chance to recuperate, and eventually what will be the role of Windows Phone?
Nokia may recover or remain independent, at least. But it will be far smaller. The idea of a return to dominance or 40% share seems very unlikely. As I pointed out in the first post, the organization cannot cope with the new marketplace. Large organizations require extreme stress and damage to change. It's a phenomenon at all levels of society that success results in rigidity. From the individual to the nation to the civilization, success makes change very, very difficult.
Windows Phone is an attempt to create a third ecosystem. I am concerned that the logic of having a third alternative is not solving a consumer need but an operator need. In other words, consumers are not asking for a third option and when they are presented with a third option they are not excited by it. The consumer does not think in terms of increasing their options. They decide once every two years which phone to buy and that is the end of their thinking on the subject. By focusing on the operator's needs the platform is fundamentally mis-positioned.
What Windows Phone needs to be positioned as is either as fundamentally different, solving a different job for the consumer. Or fundamentally better along a new dimension like price or convenience. These are some of the claims it makes but they are very weak claims right now.
-What about RIM, other company which is going through difficult times? What do you think about their decision not to move to Android and stake everything on their closed OS?
The decision to remain with their own platform may sound risky but it's a simple decision about retaining their business model. RIM is not a general-purpose manufacturer. They have always made an incremental margin on services, messaging and email. For them to use a third party OS would force them to build within the constraints of that OS or platform. That would result in a difficult competitive environment and not one where the company could sustain margins vs. larger competitors. In other words, the company faced two risky alternatives. They chose the risk they were more familiar with or the one that they already had an operating company organized for.
-Recently Apple lost market share in Europe and China favoring Android. What will be the impact of iPhone5 on this situation? As expert of Apple strategy, do you think Apple has done something wrong in these last months?
Apple lost market share when considering the smartphone market. I agree with management (and I've argued this before they did) that the market for the iPhone is all phones, not just smartphones. In that context, Apple is increasing its share consistently. Since Apple has only one product in the market (with some residual older versions as well), it's very seasonal. It would be natural to see variance in share through the year. What should be watched is a four period average performance. Overall, Apple is growing its iPhone business faster than the overall phone market so it follows that its share is increasing. I see a long-term potential for the iPhone having 20% share of all phones. That would give it an installed base of over 1 billion users.
-Smartphone penetration is reaching 60% and we probably talk about saturation in next 2 years. What will be for you the future role of tablets and phablets, they will be threaths of substitution for smartphone or maybe an opportunity to offer complementary products?
The evidence so far is that buyers don't mind having more than one device. It makes sense if each device is hired for a different job and it cannot be general purpose enough. We've seen this phenomenon with mobile phones where penetration in many markets is above 100%. That implies that even a basic feature like a phone number cannot serve all the needs on one person. To me it seems likely that one person will have more than one device and more than one form factor.
-What do you think about legal battle between Apple and Samsung? There will be consequences also for Google and Android?
I defer to my blog post Deus Ex Machina. Legal battles are not strategy.
-What will be the role of the possible entry of Amazon in the smartphone industry? It's too late for them?
Amazon is a retailer. I find it hard seeing a retailer becoming a platform provider. Not only is retail a difficult to expand business model internationally, but it's hard to imagine partners being comfortable building an ecosystem on top of retail. Retail is not sufficiently flexible as a business model.
Amazon will sell as many Kindles as they make, but the number they will make will not be the most they could make.
The logic of selling a product which has a profit model unrelated to the cost of goods sold is tricky. The incentives are different. The risk is not selling too few but selling too many.
For this reason I think the total number of new Fire units to be sold has already been determined by a production order. You cannot think about the business from a demand point of view. If the product would be free then the demand would be infinite. The decision about how many will be "sold" will depend on the goodwill of the producer.
What Amazon tries to do with the brand is ensure that the Fire is in the hands of its most ravenous consumers. That is why it's not sold in all markets or through all channels. They are sold through Amazon.com in the US (limited sales in UK as well). This is because a large number of the product in the hands of users who only use it for browsing or in areas where Amazon does not have content deals or where its ads are poorly targeted (e.g. India, Indonesia or Madagascar) would be a disaster. It may not be all that helpful to Google to have Android in those markets but as you would expect it's still a profitable business for Apple.
So one way to think of the Fire is as a promotional item (aka swag) for another business (Amazon.com). Using this frame of mind, assessing its "threat" to another business which charges for the product itself is like assessing whether free t-shirts from trade shows affect the sales of clothing or apparel in general. They do, but mostly the sale of cheap t-shirts. I doubt that people stop buying more functional clothing because they have hundreds of free t-shirts. And then there's the problem of looking like an advertisement.
Last September I argued against the potential of the Kindle Fire acting as a low end disruption in the tablet market.
Now that the first version of the product has reached is end of life, it's time to review the discussion.
The first problem is finding out how well the product did. Amazon just released a statement that the Fire accounted for 22% of tablet sales in the US in the nine months it was available. The challenge becomes knowing how many total tablets were sold in the US during this time frame.
Fortunately we know the vast bulk of that total based on the Samsung v. Apple trial. Both Apple and Samsung submitted as evidence sales of the iPad and the Tab product lines in the US. The iPad added up to 16.14 million units (Q4'11 through Q2'12) and the Tab was 540k units. That makes the iPad and the Tab add up to about 16.7 million units. Assuming an additional 1 million units for the other (non-Kindle) total yields an estimate of 22.7 million tablet devices sold in the nine months ending June.
Applying the 22% claim to that total gives a Kindle sales total of 4.987 million. That's awfully close to a round number of 5 million.
Since Amazon admitted that they ended production prior to launching a replacement (and presumably did so quite early in order to drain inventory,) then we can safely assume that the original production order was 5 million units.
Five million Kindle Fire units becomes the first reliable estimate of Kindle sales (based on Apple, Samsung and Amazon supplied information rather than guesses from analysts.)
So the question now is whether this is consistent with the hypothesis that the Fire is disrupting the tablet business.
Bearing in mind that this 5 million total was reached with prominent placement on Amazon.com and a loss-leading pricing, I would conclude that this is not an auspicious start for a disruptive product.
As I argued nearly a year ago, the business model for the Kindle is limited to the footprint of the Amazon franchise, which is small internationally. Amazon itself implicitly admitted that the product was a US-only phenomenon. Further worry comes from the way the company approached production. It was not planning it as a maximization of reach into the market. What they did was order a batch production and then wait for it to be sold through.
Perhaps Amazon is being patient for growth, but I don't see a hunger for profit in this strategy. We know that Kindle probably lost money at the price charged. Perhaps it's on the order of $40 per unit. Five million units would imply a charge against the business of $200 million. Did Amazon earn a profit on content sales of $40 on each of those five million units? The margins on content sold through Amazon are so low that I have a hard time imagining that Fire users are that ravenous in their consumption.
In terms of units Windows-based computers made up 78% of all PCs sold in Q1. That was an increase from the 74% in the previous quarter but a decline from 90% a year ago. OS X based computers were about 3.7%, a decline in share both q/q and y/y, something the company attributed to a transition quarter.
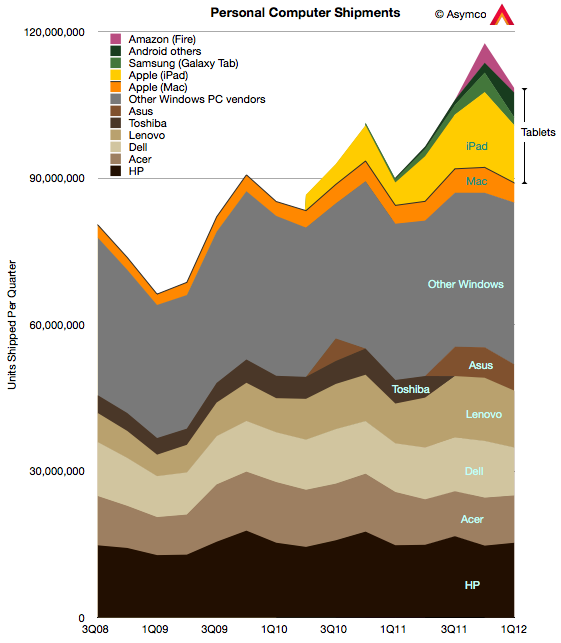
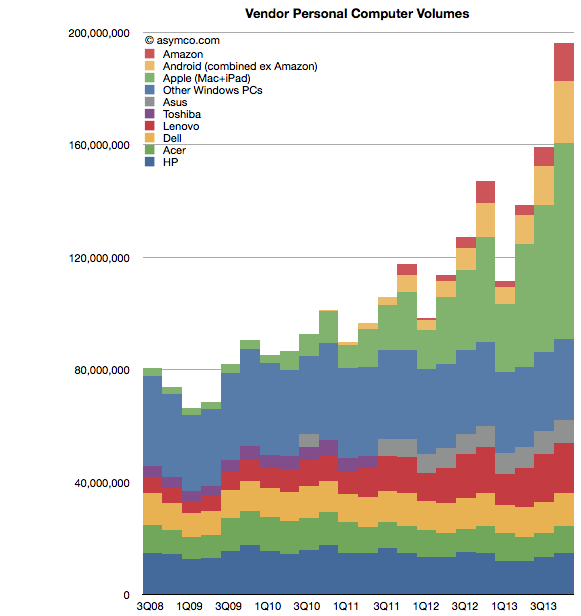
The following chart shows the composition of vendor volumes with tablet and traditional form factor computers included:
iOS computers (i.e iPad) were 11% of the market, declining from 13% last quarter but increasing from Q1 '11's 4.2% share. Apple reported that the iPad was not at supply/demand balance and thus could have sold more units.
Amazon's shipments went down significantly though sell-through was perhaps twice sell-in due to inventory build-up during the previous quarter. Overall, about 5 million Amazon Fire tablets were sold since the product's launch.
The third significant tablet vendor was Samsung, which sold about 1.6 million tablets, down sequentially but up y/y. Other Android tablets may have shipped another 5 million units.
Overall, Apple remained the top vendor with 14.6% share, followed by HP with 14.1% and Lenovo in third at 10.7%. Dell just barely managed to beat Acer with 9% vs. 8.9%.
The impact of the tablet (aka iPad) market is being described in the response to a significant earnings miss by Dell:
Sterne Agee, which admits it probably shouldn't have upgraded DELL from underperform last week, says it's notable that the PC maker acknowledged competition from Apple and Google for the first time as part of Tuesday's dour F1Q report and forecast. Meanwhile, Mizuho calls DELL a "show-me-story for now" in cutting it to neutral and cutting its price target 25% to $15. And ISI snarks "everything is bigger in Texas--including the misses." It adds while the company "is making the right business-model changes...results will remain 'chained' for years (not quarters) to commodity desktops/notebooks, which comprise over half of sales."
- Dow Jones Newswires (Kevin Kingsbury)
And so, two years later, the impact of the iPad is becoming abundantly clear, even to the incumbents. The resistance and denial was profound. Even on this blog, the agitation and anxiety when the subject of the iPad as disruptor came up was palpable.
Perhaps that is the greatest testament to the disruptive potential of a product.
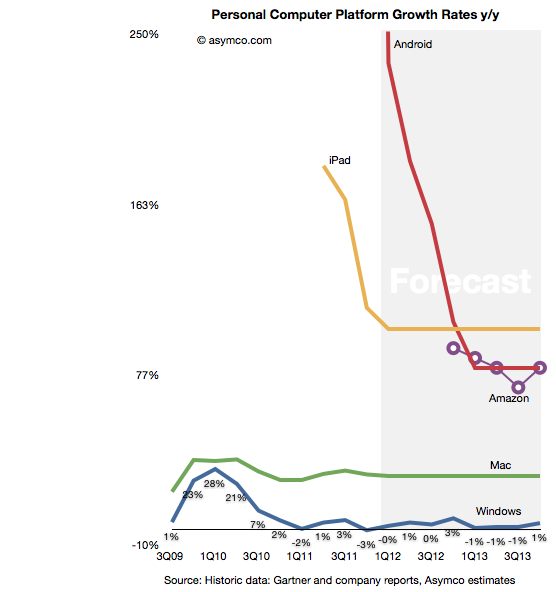
I began by projecting growth rates of various market participants including the leading Windows PC makers (HP, Acer, Dell, Lenovo and Asus), the combined "others" and the Mac. I also added the iPad, Samsung's tablets, other Google sanctioned Android tablets and Amazon. I also projected a split between traditional and tablet Windows shipments.
The underlying assumptions are:
Mac growth continues at 25% as it has on average for a few years
Windows grows slightly in 2012 with the introduction of Windows 8 late in the year. However I anticipate Windows 8, including tablet versions, to mostly be upgrades with slow enterprise take-up within this time frame.
The tablet versions of Windows begin shipping in Q4 2012 with 7% of total Windows shipped. The ratio reaches 20% by end of 2013.
iPad growth will flatten for '12 and '13 at 100%, similar to iPhone's historic performance.
Android tablet growth will be significant in the current year and follow iPad growth pattern though settling at 80% during '13.
Amazon growth will be approximately 80%.
Building the platforms combined growth bottom-up gives the following forecast for the next two years (and historic growth shown for perspective.)
[FF = form factor]
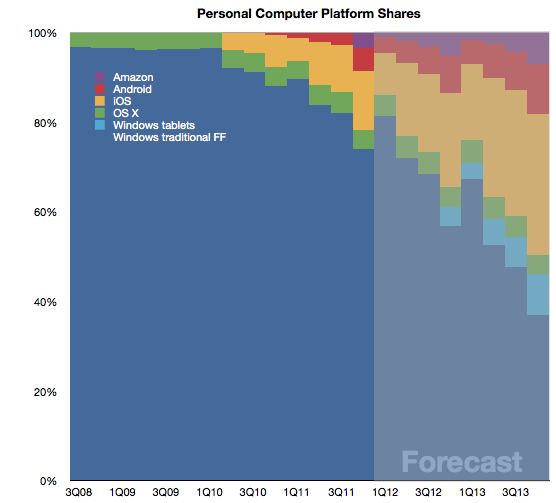
Given these assumptions, the day when the tablet market (by units) will exceed that of traditional PCs will come sometime in the fall of 2013.
As yesterday's post noted, the tablet market will be additive. This can be seen in the vendor shipments forecast that accompanies the model:
In a previous series of articles we discussed the capital Apple expends on equipment, real estate, leasehold improvements and data centers. Cost structure analysis reveals subtle shifts in strategy and the CapEx analysis demonstrates Apple's increasing integration into its supplier network and integration into the distribution and service infrastructure that sustains its ecosystems.
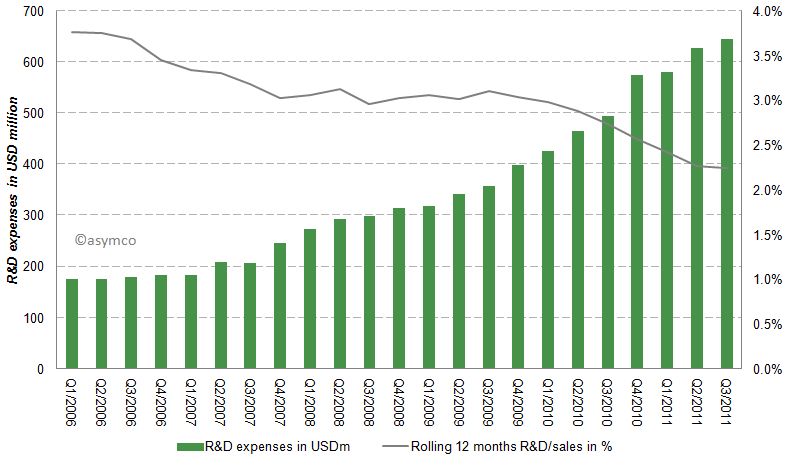
Another form of investing (spending now, reaping benefits later) is the spending on research and development (R&D). Let’s have a look at Apple’s R&D expenses by quarter since Q1/2006.
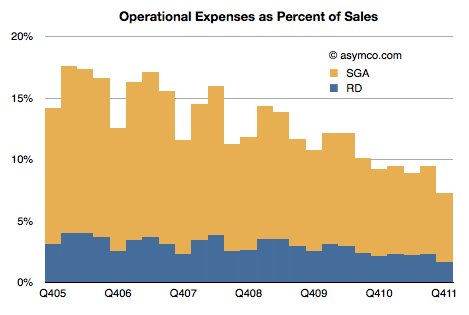
Apples R&D expenses as percentage of sales have been declining from almost 4% to close to 2% in the last six years as shown in the following chart:
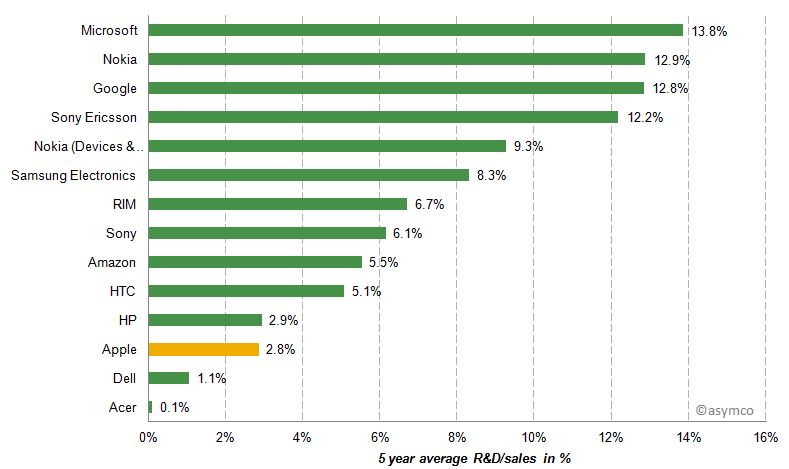
While Apple's absolute R&D expenses have grown at an annual rate of 33% they have not kept up with the far higher sales growth rate. Apple's current rate of R&D expenditure is compared to a peer group [1] below.
Apple's R&D/sales ratio is between Dell and HP, companies which do not develop their own software or hardware.
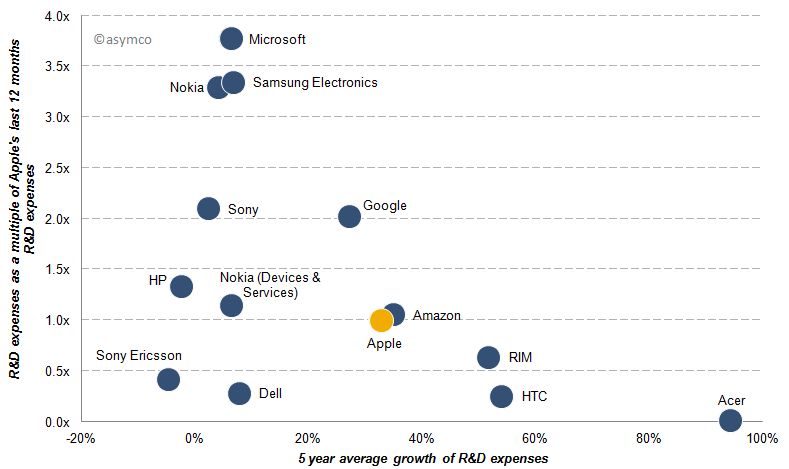
Beside the absolute, relative to sales and relative to peers, another perspective is to measure relative growth. The following chart represents shows the 5 year average growth of R&D expenses and on the y-axis the size of last 12 months R&D expenses as a multiple of Apple's R&D costs [2].
Acer's R&D expenses for example are almost non-existent compared to Apple, but have grown almost 100% per year while Microsoft’s last 12 months R&D expenses are almost 4x that of Apple's and have only grown slightly over the past five years. Google's R&D costs have grown at a similar rate compared to Apple, but remained double those of Apple’s throughout the last five years.
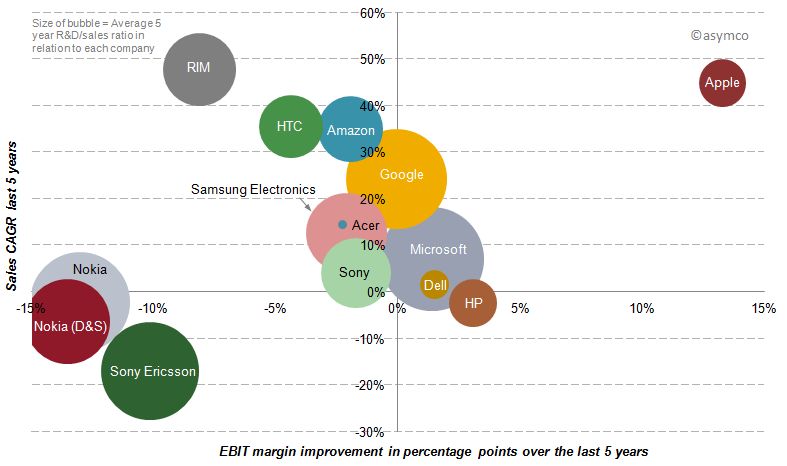
Finally, we should look at the payoff from R&D spending over the last five years. R&D growth should result in margin improvement, but does it? The following chart shows the relationship between spending (size of bubble), margin improvement (x-axis) and sales growth (y-axis).
Of our sample, only three companies have achieved sales growth AND simultaneous margin improvement over the last five years. But while Microsoft and Dell have achieved sales growth and margin improvement slightly above zero, Apple has improved its bottom line by 13 percentage points and its top line by an average rate of 45%.
In spite of Microsoft's, Google and Nokia's massive R&D growth, their returns from that investment have been meagre to negative in terms of margin and only Google showed appreciable sales growth.
Discussion
R&D expenditures on a stand-alone basis, in absolute or relative terms, do not correlate with disruptive growth. Essentially, you cannot buy innovation.
In fact, sometimes it's nearly free. Most startups spend less on R&D than large companies do on stationery and yet the bulk of wealth creation has come from these tiny companies. The challenge is, in fact, that if you have resources you find ways of spending them (the quaint American cliche of 'cash burning a hole in your pocket'). The temptation is always there to fund a new initiative which bright people can always envision.
Leadership in innovation is not the courage to spend but the courage to focus.
“Focus is about saying 'No'. And the result of that focus is going to be some really great products where the total is much greater than the sum of the parts.”, Steve Jobs (1997)
[1] Our set of peer companies as shown in previous posts but excluding LG, Lenovo and Motorola Mobility due to lack of data, but including Sony Ericsson and Nokia’s mobile phone division Devices & Services.
[2] In this post “year” and “last 12 months” refers to the time frame from Q4/(year-1) year to Q3/year due to lack of published data regarding Q4/2011. Five year data runs from Q3/2006-Q3/2011.
[3] A note on capitalized R&D: Most of the companies analyzed do not have capitalized R&D costs. Some have small capitalization, but so small that the inclusion would not change the decimal points of percentages. The only significant amount of capitalized R&D appeared in Amazon's earnings releases: capitalized R&D cost were USD 100 million in Q3/2011. The amortization of theses costs in included in Amazon's EBIT (Operating imcome).
In last week's discussion of Apple's (historically low) valuation, comments arose that perhaps the company's discount is not unique. Can we look at comparable companies and determine whether the relationship between growth, size and valuation are consistent?
The challenge is in finding "comparable" companies. Apple is characterized by being large in terms of market capitalization, highly profitable, in the technology sector and growing relatively quickly. One can find a cohort of companies with each of these characteristics but not all.
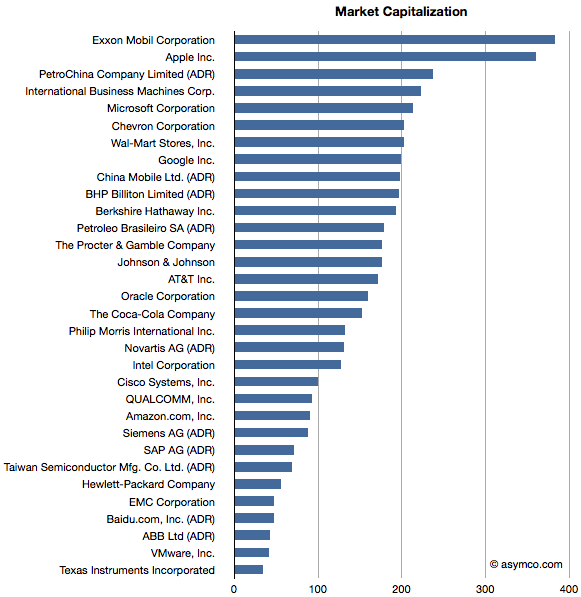
Here is an attempt at looking at the largest companies by Market Capitalization (the so-called Mega-caps) to spot patterns of valuation. Some of the companies in the top 20 mega-caps were technology companies so I thought I'd highlight them. I then also added a few of the top 20 technology companies by capitalization to create a larger sample.
The group I settled on is shown in the list below ranked by market cap.
Companies below $130 Billion in market cap (i.e. below Novartis) are in the top 20 technology list but not in the top 20 overall list.
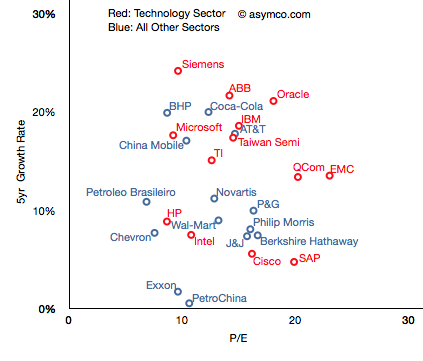
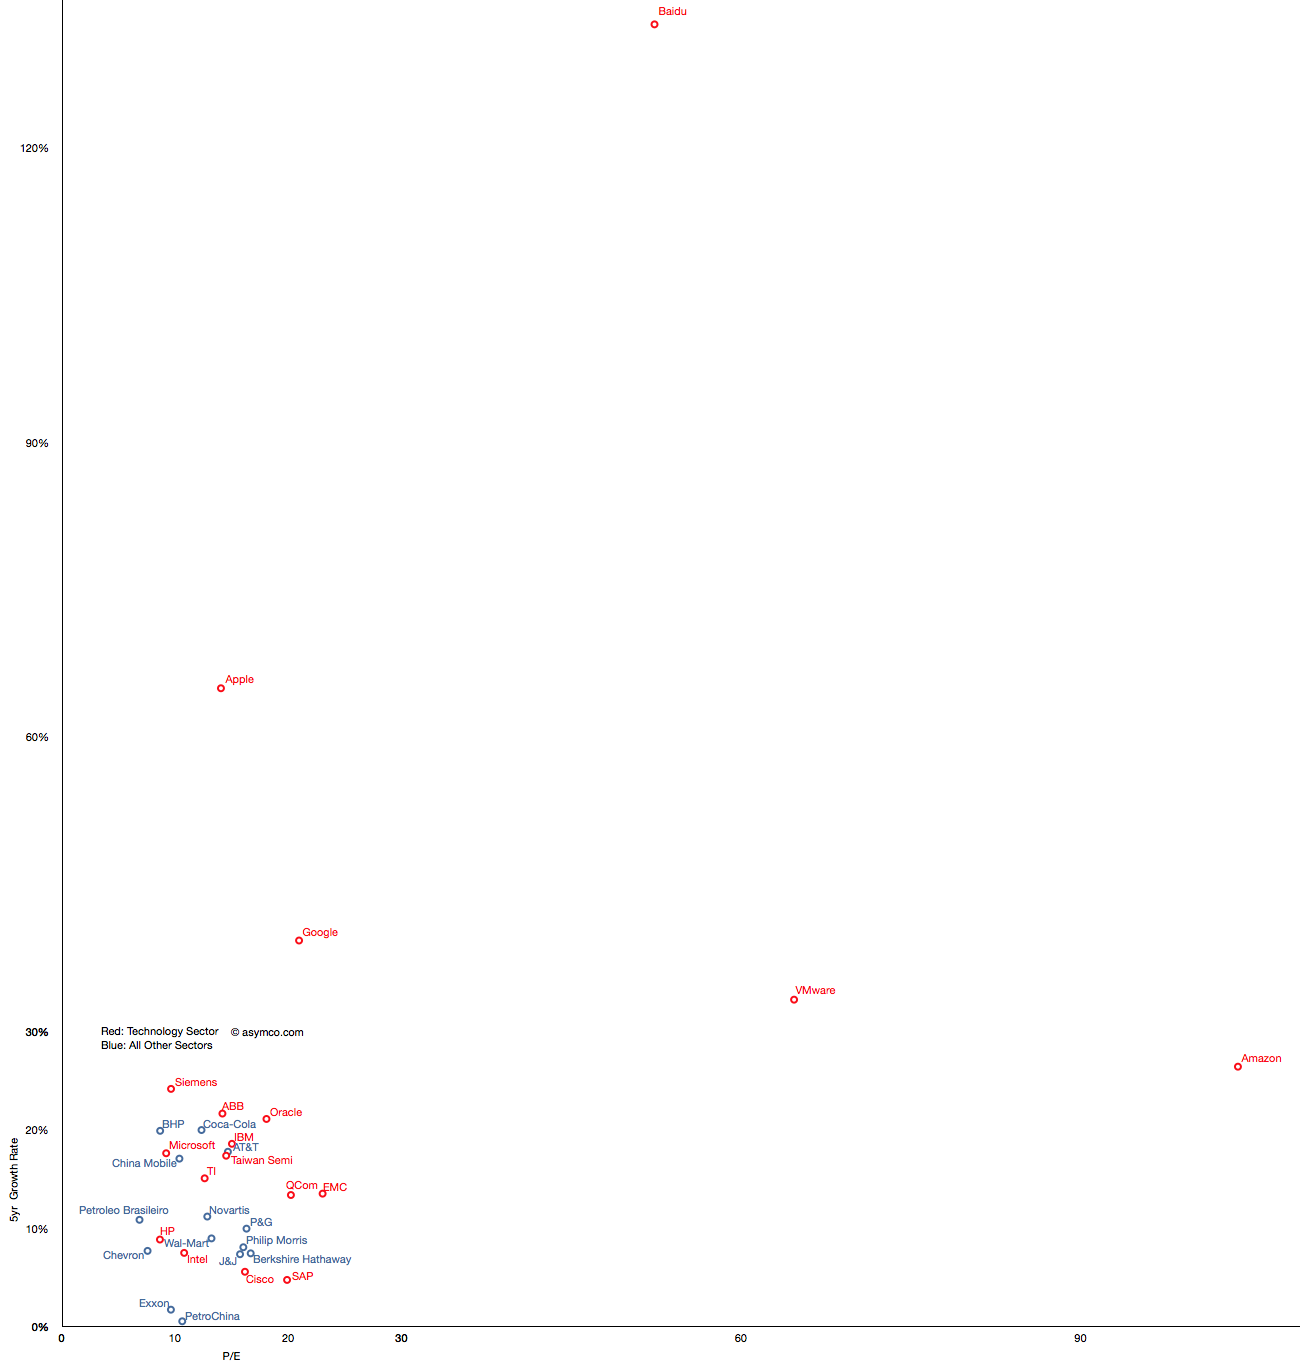
I then plotted the P/E rate vs. 5 year Growth Rate for these companies, separating the tech sector by color (Red):
The pattern is not encouraging. It appears that there is no correlation. Perhaps the technology companies are, as a group, further up and to the right, but overall they are equally unobservant of growth.
For example, SAP has grown less than 5% in five years and yet enjoys a P/E of 20 whereas Microsoft has grown 18% and has a P/E of less than 10. The non-technology sector companies are similarly broken. Berkshire Hathaway, a conglomerate, is rewarded for slow growth and China Mobile is punished for relative high growth.
But you'll notice that some companies are not on this chart. That's because they are outliers. Their growth or P/E are so far out of this cluster that the would make it impossible to discern individual performance. The complete "top 20" picture is shown in the following chart which will require either a large display or a lot of scrolling (1300x1364 pixels):
With this level of detail, we can see how distinct some companies are. Not only from a correlation point of view but from a cluster of peers. The outliers are Amazon, Baidu, VMware, Google and Apple.
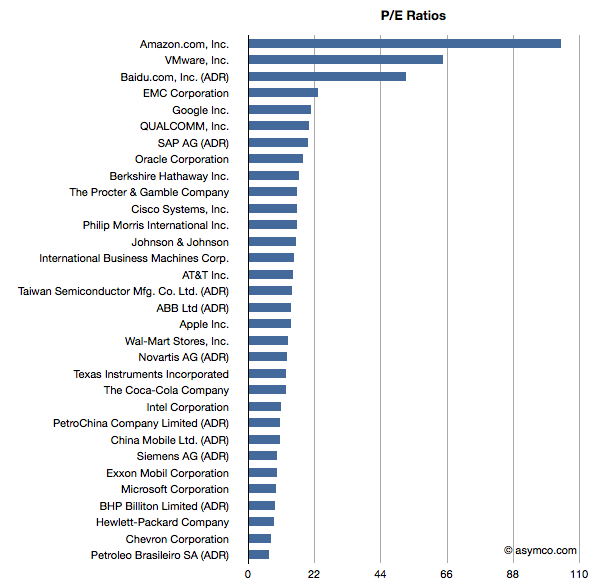
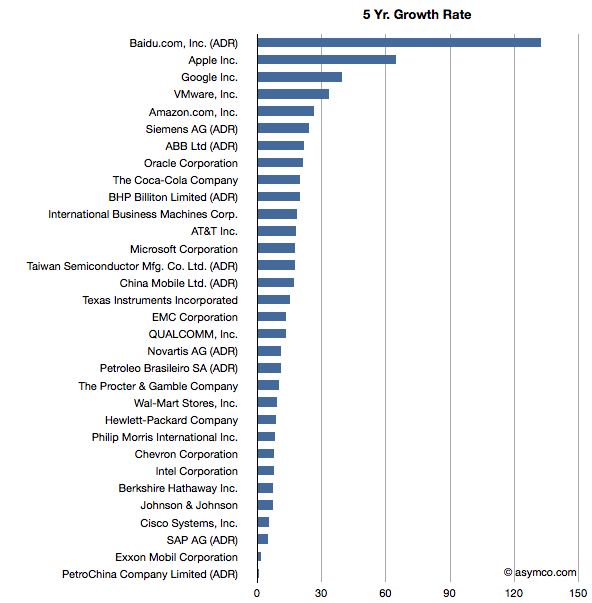
These outliers can be seen also in ranking of P/E and Growth:
Baidu has grown earnings by 132 percent while creating a market cap of $47 billion and has a P/E of 52. Amazon has grown by 26% while having a total value of $90 billion and a P/E of 104. VMware is "only" a $40 billion market cap company with a 5yr EPS growth of 33% and a P/E of 64. Finally, Google has returned a 39% growth rate, a market cap of about $200 billion and a P/E of 21 and Apple brings up the rear of P/E with 14 but with the second largest market cap of $360 billion and the second largest growth of 65%.
What this analysis shows is that the market does not have any "rule" of rewarding growth with a high P/E. If anything, the outlier analysis shows that there are significant anomalous valuations that cannot be explained by growth data.
---
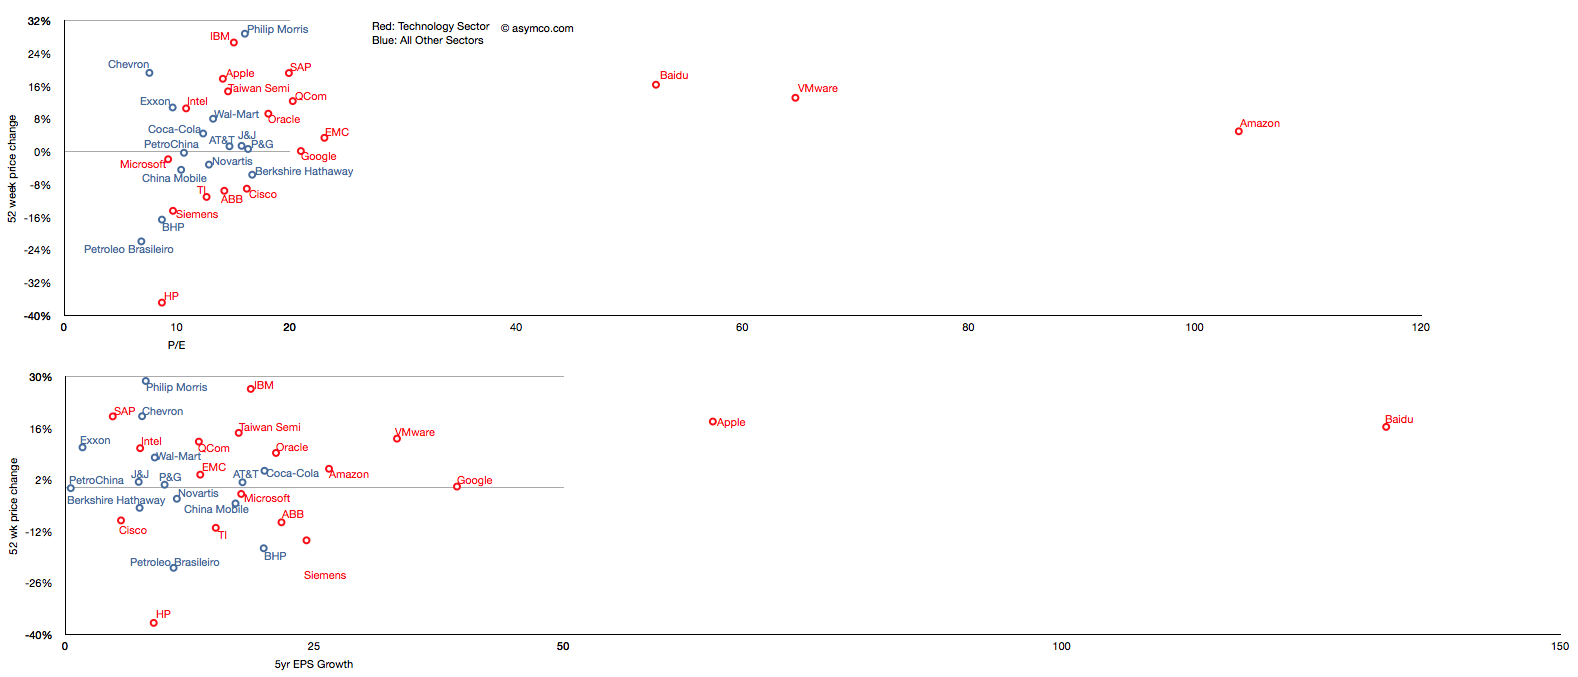
Note: I've also tried to observe correlation between recent share price change and growth and recent price growth and long-term earnings growth.
Similar anomalies and lack of correlation can be observed.
On October 27th, Nintendo published half year results for the fiscal year ending in March 2012. Management stated that the company lost over $900 million with a negative outlook. Nintendo cited weaker than expected sales of Nintendo DS hardware and 3DS software and Yen appreciation as the main reasons for the miss. Is this the end of Nintendo?
Before we look more closely, here is a quick summary: The company is exclusively involved in selling game hardware and software. Their console platform is the Nintendo Wii, which will be followed by the Wii U late in 2012. The Nintendo DS and Nintendo 3DS are the company’s portable game consoles. The Wii and the DS are nearing the end of their product cycles. On the software side, the company is known for gaming titles such as Super Mario and Zelda. Nintendo also pioneered the licensing model to allow third-party developers to produce games for its hardware products.
A closer look
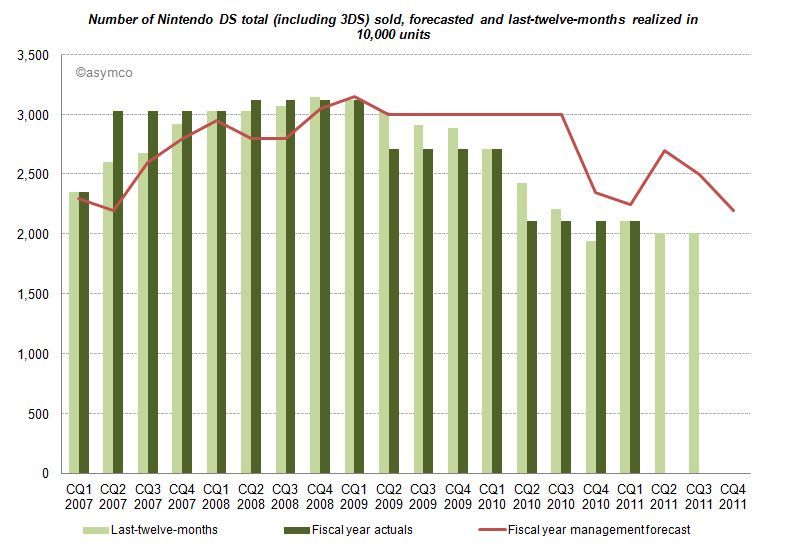
The good news for analysts is that Nintendo publishes their estimates for hardware and software unit sales. This allows us to measure management predictive accuracy. The red line (management forecast) should be as close as possible to the dark green pillars (realized unit sales in the fiscal year).
Until CQ1 2009 devices sales grew in excess of forecasts. A similar pattern can be found for consoles and game titles. After Q1 2009 forecasts have been always higher than results, and more worryingly, the deviation between forecast and sales is widening. Management missed and lowered forecasts for two consecutive years. Management's hope for an increase on the back of initial 3DS sales in the launch quarter (CQ1 2011) did not come to pass and they subsequently lowered forecasts again in the following two quarters.
Looking at all categories, management lowered forecasts almost continuously. The deviation remains the largest in the portable hardware business segment indicating that management was largely surprised about the development.
What caused this reversal of fortune?
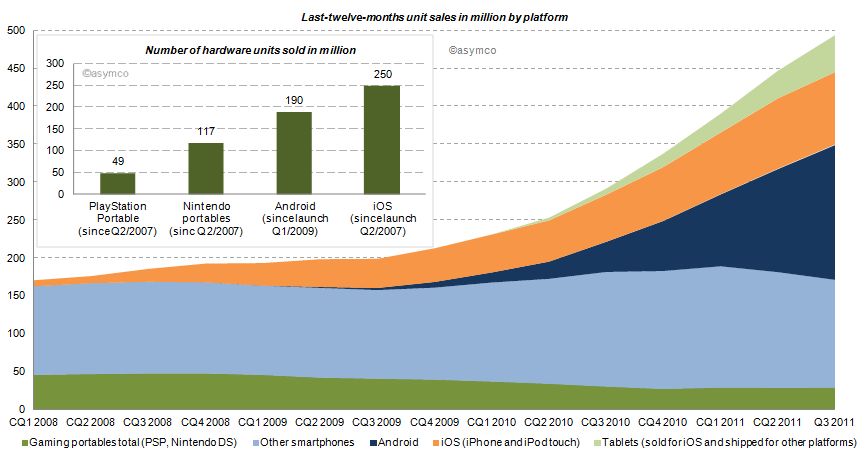
Two years earlier the iPhone had launched and by CQ1 2009 iOS reached an installed base of about 38 million, half the number of Nintendo portables in the same period. Furthermore, in CQ1 2009 Android phones came to the market. Smartphones (light blue area of the chart below) sold before (and after) the debut of iOS, but the iPhone redefined the category and an avalanche of smarter phones running iOS and Android followed (blue and orange area). Portable gaming devices from Nintendo and Sony declined ever since: 17% in 2009, 31% in 2010 and already 16% in the last twelve months.
How do the game players stack up?
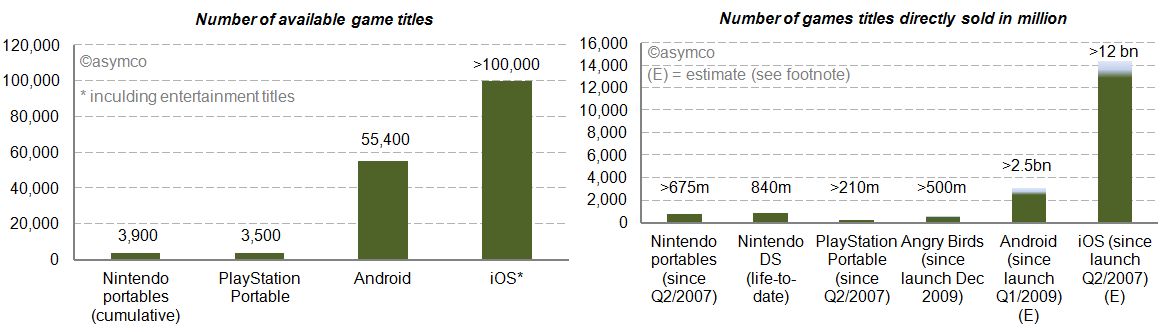
We already looked at the installed base in the chart above. iOS and Android have outsold Nintendo portable units by a factor of 2.1x and 1.6x. Furthermore, we can see (in the charts below) that the two main mobile platforms have 14 to 26 times more game (and entertainment) titles available. Nintendo and Sony also publish unit sales of directly sold software titles. For Android and iOS we know the cumulative app download statistics. By taking the share of Septembers’ paid and free app downloads as a proxy, we can conclude that also by this measure Android and iOS dwarf Nintendo and Sony [1]. The reach of iOS and Android is further underlined by the more than 500 million downloads of Angry Bird game titles - first released only two years ago - for any platform having sold more than twice the amount of Sony’s cumulative portable game titles and almost as many as Nintendo’s cumulative games titles since Q2/2007.
Who else has skin in the game?
Besides Nintendo, Sony, Apple and Google, who else is making a push into mobile gaming? Before investigating, let’s first have a closer look at Sony. Sony, just like Nintendo, is also active in stationary gaming segment with the PlayStation franchise. The Sony group also has access to entertainment most notable through Sony Pictures Entertainment and Sony Music Entertainment. Furthermore, Sony recently decided to buy Ericsson’s stake in the mobile phone joint-venture Sony Ericsson and is making a push with Android to bring its gaming titles as a differentiator for its own products to the platform. And the other major suspects? Microsoft, also active in the stationary gaming segment with its Xbox franchise, is pushing to bring the Xbox experience to mobile phones with Windows Phone. Amazon has retailed software and games for years and has started to distribute software and games via direct download on its own Kindle devices but also for the Mac. On the Kindle, Amazon is relying on a forked Android version on which it leverages its eBook and other entertainment assets. And then there is Facebook, a social network that wants to be on any platform or device. Out of 800 million users, 350 million access Facebook via a mobile device. Around 50% of Facebook members play games on the desktop. With Project Spartan, Facebook is aiming to bring the desktop experience to the mobile device including a stronger focus on gaming and video.
The competition between Apple and Google is already asymmetrical. Including the other contestants in the competitive landscape reveals Nintendo’s key weaknesses in the portable gaming market: attraction as a platform for developers in terms of ease and reach, pricing of hardware competing with operator-subsidized mobile phones and the jobs-to-be-done or value preposition. The new generation of mobile devices is standing against Nintendo’s dedicated approach. Although slowly adding features such as a browser and “app store” to its portables, Nintendo devices fall short in the variety of jobs-to-be-done compared to smartphones, let alone making a call.
Average selling prices and financial impact
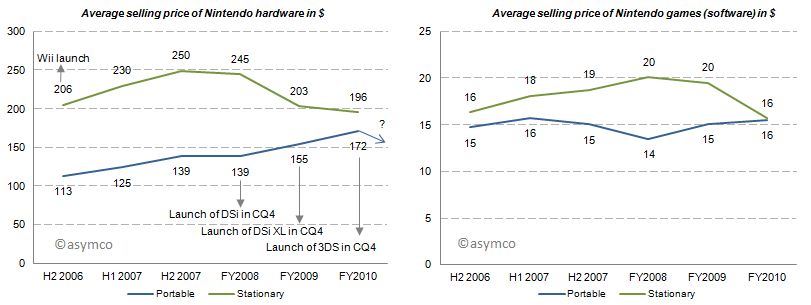
With this market pressure one would imagine that average selling prices decreased for Nintendo portables. But for the last three fiscal years average selling prices for portables have increased, all things equal, mainly due to new product launches. Game title’s average selling prices have remained relatively flat. Note that these are wholesales prices for hardware and a mix of retail and wholesale prices for games. In 2011, for which we do not have data yet, the price of the newest portable, Nintendo 3DS, was lowered from its U.S. debut of 320 250$ in February to 170$ in July which will have a negative impact on ASP going forward.
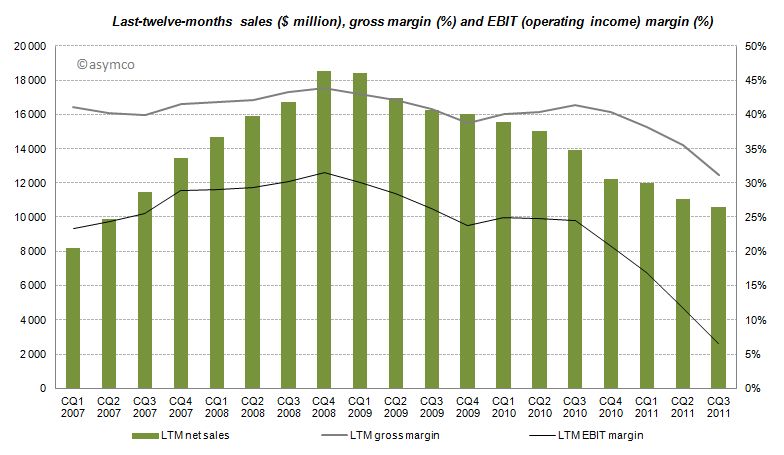
The effects of Nintendo’s rigid strategy and the fast changing competitive landscape are manifested in the devastating financial performance over the recent quarters with LTM sales, gross margins and EBIT margins declining starting from CQ4 2008 and even accelerating to decline after CQ3 2010.
Furthermore, even though the company has recognized its own difficulties, Nintendo has no intention of adjusting its strategy:
CEO Iwata on the question of whether Nintendo plans to bring its game library to other platforms:
This is absolutely not under consideration. If we did this, Nintendo would cease to be Nintendo. Having a hardware development team in-house is a major strength. It’s the duty of management to make use of those strengths. It’s probably the correct decision in the sense that the moment we started to release games on smartphones we’d make profits. However, I believe my responsibility is not to short term profits, but to Nintendo’s mid and long term competitive strength.
Although realized and obvious, the disruption’s invisibility is often manifested in the paralysis of the incumbent.
Conclusion
According to Isaacson, Steve Jobs apparently always worried who could eat Apple's lunch. The lunch of the iPod, he concluded, was ripe for mobile phones. Subsequently, Apple entered the mobile phone space. Google followed. Since then more powerful mobile phones have eaten the lunch of the dedicated gaming device. The jobs-to-be-done and their priorities in people’s life have not changed, but the tools people use to get them done have. Permanently.
---
Notes:
Estimated by multiplying total cumulative app downloads with September’s share of game downloads: For iOS ranging from 72-80% based on Top 150 free and paid app downloads, for Android ranging from 38-47% respectively. This is a very crude estimation, but the gist of it is that 4% for iOS and 11% for Android game downloads as percentage of cumulative app downloads would outsell Nintendo.
Analysts have to count things in order to measure value. It sounds easy but it can be tricky. As I pointed out with PCs vs. iPads, if you count an iPad as a PC you can get into a lot of trouble with your clients. But if you don't you end up directing them away from confronting an existential threat. Only very rarely is a market report published in contradiction to widely held sustaining beliefs. More often than not analysts bow to the source of their paychecks and in so doing show their rear end to the truth.
This comes up again now with respect to how to count tablets. Consider that there is little difference in architecture, software or design between an iPhone and an iPad. They run the same OS, use the same microprocessors and have similar communication methods, inputs and sensors. However they are considered completely different products and counted as part of separate markets. The only physical attribute that differs is the screen size. So we have to conclude that the size of the screen is a huge determinant factor in deciding whether a product is a tablet but not a smartphone (or music player).
But what about tablets themselves? Their screen sizes vary widely. A 10" screen is certainly a tablet device, but a 4" screen certainly isn't. Where is the boundary exactly? It seems that a 7" device is still a tablet but a 5" may not be. The Dell Streak 5 device is presumably not a tablet. The arguments then descend into an arbitrary definition of tablet based on whether it fits in one hand or in a bag of a certain size.
This begins to sound academic. Why should it matter what size is or isn't a valid tablet? Buyers are not in the market for screen sizes. They are in the market for products that can be hired to do jobs or address pain in their lives. So as far as consumers are concerned, these categories are meaningless. If you want to design something you'd better segment according to jobs to be done.
However, buyers are not the target audience for the analyst. Nor are product designers (hopefully anyway.) Part of the reasoning of offering market research is that it presumably helps ecosystem participants (vendors, developers, retailers, etc.) decide where to invest their time and money. They are the target audience. They don't spend their lives reading tech blogs. For them it's important to understand "which way the wind is blowing" and that's where an analyst should be helpful with data.
But then if we are to measure ecosystems, we have more difficulties.
The iOS ecosystem is pretty well understood. Apple publishes the number of devices it sells and the number of apps on its store and downloads, etc. We can assume Microsoft will do the same with Windows 8 as they do already for Windows in general.
For Android, it's a challenge. Google measures activations, but that may not cover the actual units sold. Google admits that it does not know how many Android devices are sold or even how many are for sale. It's in the nature of open source that it's not controlled and hence not measurable.
But analysts still try. Consider the estimate that about 27% of all "tablets" shipped are Android. That's not something Google helped with. Google can report the number of activations of a certain version of the OS, but they themselves don't know what the device looks like or what size screen it has. A device vendor can put any version of Android on a device of any size. To find out how many tablets run Android, you need to try to estimate "bottom up" by adding the output from various vendors.
However, it's clear that a large number of these devices are not exactly Android. Consider what Kevin C. Tofel writes for GigaOm:
I asked Strategy Analytics to clarify both of those points and received the following email response from Neil Mawston, the analyst who wrote the report: ”Yes, the press release refers to shipments, not sales. All sub-versions of Android are included. Yes, the B&N Nook Color tablet is included in the tablet figures.”
So the B&N Nook is counted as an Android tablet and part of the 27% share of Android. But Google itself does not count the B&N Nook as an Android tablet. It's not something that can even use the Android brand. From Google's own documentation:
We define an "Android compatible" device as one that can run any application written by third-party developers using the Android SDK and NDK. We use this as a filter to separate devices that can participate in the Android app ecosystem, and those that cannot. Devices that are properly compatible can seek approval to use the Android trademark. Devices that are not compatible are merely derived from the Android source code and may not use the Android trademark.
In other words, compatibility is a prerequisite to participate in the Android apps ecosystem. Anyone is welcome to use the Android source code, but if the device isn't compatible, it's not considered part of the Android ecosystem.
So to summarize, whereas the Nook is counted as an "Android tablet" it...
cannot be called an Android device without violating the trademark
may or may not compatible with Android Apps
does not include Google Services like Google Maps
cannot license the Android Market client software or brand
is not considered to be a part of the Android ecosystem by Google
All this is also true for the Amazon Kindle Fire and whatever Baidu, Alibaba and other Google competitors will be selling. Furthermore, Google can define compatibility and therefore what "being Android" means arbitrarily and can change that definition at will. It can even withdraw compatibility on the basis of business priorities.
It matters because these devices might end up very popular (see Amazon's reporting of Fire's pre-orders in its quarterly earnings call) and in aggregate could even be the majority of "Android tablets".
The result is that most analysis of the Android ecosystem (and by comparison, all mobile ecosystems) depends on classifying as Android devices those that compete with Google, and indeed, with Android. For the purpose of assessing value, growth and opportunity for third parties such reports fall short.
So what should be done?
The solution is simple: Count as Android devices those that are allowed to be called Android as per Google's own definition. It makes clear that developers can reliably sell their software through the Android Market. It makes clear that those devices are designed to use Google services and it makes clear that those devices are not designed to compete with Google.
Those devices which are using "derived" Android source code and are not compatible (as per Google's definition) and are not allowed to be called Android by their vendor should be called something else. Maybe "Android-like" or "Android derivative" or "Non-Google Android" or just "Other".
In his recent posts Horace took a look at Apple’s fixed assets and their development over the recent years. He also tested the hypotheses that Apple is making investments into machinery & equipment on which iOS devices are produced by overlaying iOS volumes with preceding changes in property, plant and equipment (PP&E).
The question that has arisen is: Are Apple’s investments in PP&E extraordinary?
To answer, I have compiled the capital expenditures (CapEx) for our previously established peer group [1].
But first we need to clarify what CapEx include and not include. CapEx includes investment into property, plants, equipment, office furniture, larger IT hardware and in some cases patents; CapEx do not include investment into long-term marketable securities or other long-term financial instruments, acquisitions or capitalized R&D. Furthermore, CapEx are gross values and are not net of any sold equipment [2]. CapEx are largely depending on a company’s business model and strategy. For example if you are a manufacturer you need equipment to operate, if you are a software company or a retailer, your business will not be capital intensive.
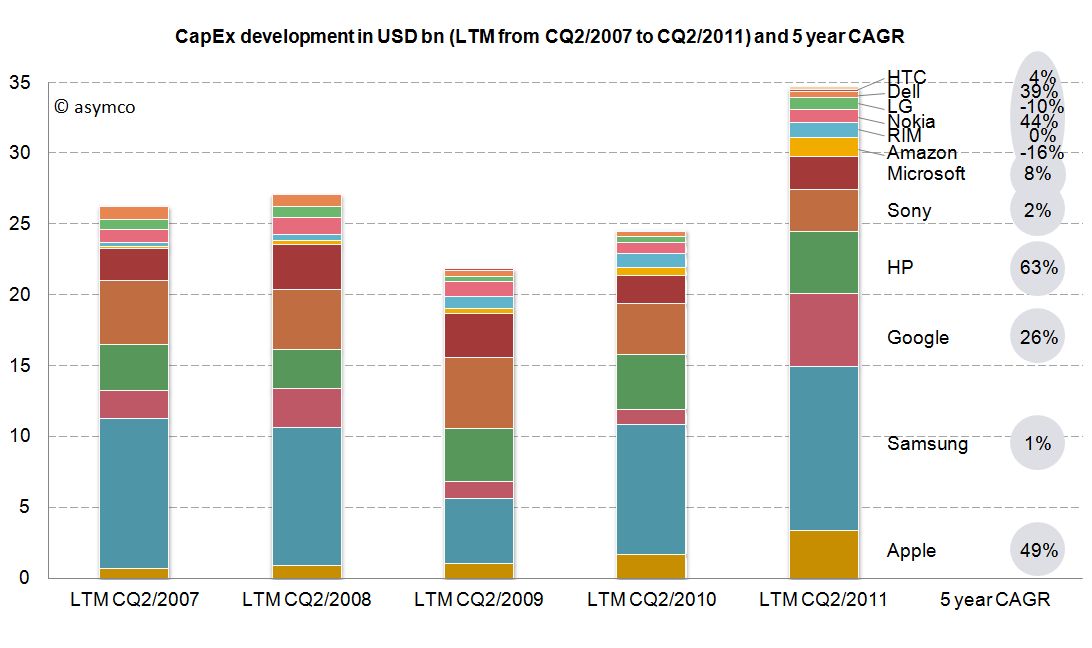
As the second calendar quarter of 2011 is the latest quarter for which all companies have reported figures, we will take a look at last twelve months’ (LTM) figures from Q2/2011 backwards. The following stacked bar chart shows the combined CapEx of our peer group:
The combined capital expenditures of our peer group for the LTM CQ2/2011 have outpaced even pre-crisis levels of investments and, combined, account for $34.7 billion. Samsung, a diversified manufacturer of IT hardware and other equipment, has invested more than $11.6bn with Google ($5.1bn), HP ($4.4bn) and Apple with $3.4bn following in line. While Google’s CapEx mostly account for its infrastructure of server farms and other IT hardware, HP’s CapEx mostly account for IT hardware it leases to its customers [3]. In absolute terms, Apple takes fourth place in CapEx spending for the last twelve months ending in CQ2.
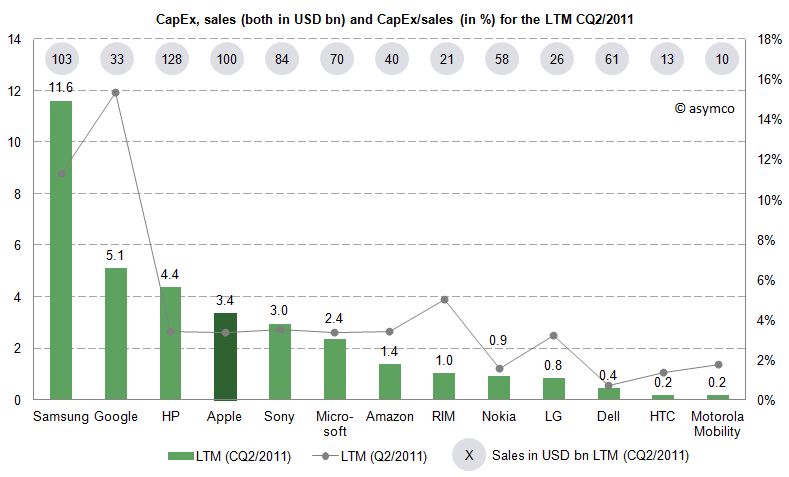
Since the business model and sales magnitude varies largely in our peer group, we can also take a look at a common measure to compare CapEx intensity by dividing CapEx by sales achieved in the same period. For the last twelve months we can depict the following chart:
The average of the peer group accounts for 4.4% of CapEx over sales. Samsung’s and Google’s business model are clearly more capital intensive, while Apple’s CapEx ratio of 3.4% is below the peer group average but above some of its peers like Nokia, Dell, LG, HTC or Motorola Mobility. Interestingly, capital intensity of HP, Apple, Sony, Microsoft and Amazon is at a comparable level of around 3.4%.
As noted before, business models and strategies are significantly different among companies in our peer group. However, while Apple’s CapEx intensity is not extraordinary, Apple’s CapEx in absolute terms are among the largest in it this peer group and have grown constantly throughout a five year period.
Is this a good thing and why does it matter?
CapEx by itself does not tell us much. We still do not know in what companies specifically invest as financial regulations do not require detailed CapEx accounts. We know that even if a company is not growing assets they need to be maintained, upgraded and replaced – this spending is also called "Maintenance CapEx". Everything else can be called "Expansion CapEx" associated with new product launches, entry to new business area or geographies or expansion of (manufacturing) capacity.
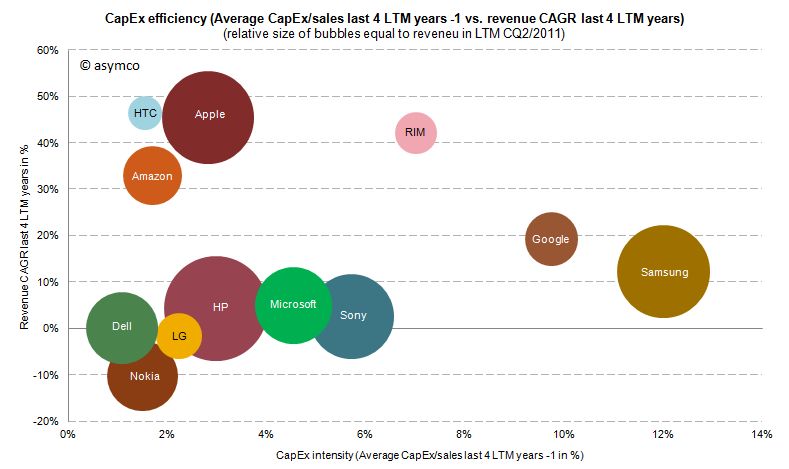
Therefore, Expansion CapEx is closely linked to expected organic sales growth in the future. So let’s go ahead and link CapEx ratio of the previous years with the sales growth of the following year. The following chart shows the cumulative average growth rate (CAGR) over the last four years versus the average of CapEx/sales ratio of the four last preceding years:
We can see that high CapEx efficiency has been achieved by Amazon, Apple and HTC with sales growth rates of 33-47%. RIM reached similar revenue growth but with higher CapEx intensity. Google and Samsung with high CapEx intensity have only reached modest growth rates. Dell, HP, Microsoft and Sony have not grown significantly but have close to average CapEx intensity.
We cannot state that CapEx in absolute terms have been extraordinary for Apple, but we can witness that with below average CapEx/sales ratio Apple outgrew in absolute terms Dell, LG, Microsoft, Nokia and Sony and has grown close to the revenue size of Samsung and HP in the last four years.
---
Notes:
Excluding Lenovo (not reported) and Acer (extra-ordinary low numbers reported, to be investigated), Motorola Mobility figures only available for the last six quarters
Minor differences may occur due to local Generally Accepted Accounting Principles (GAAP)
HP assumes ownership of these assets and rents them to the customers who in turn have a smaller balance sheet and can run IT hardware CapEx through the income statement as lease expenses