Asymco

Asymmetric Intelligence

Apple TV

  1. Other Products

    Research · 6 comments

    From the way Apple reports its revenues you might think that the company has several operating segments. There are the iPhone, the Mac, the iPad for which units and revenues are reported. Then there are Services and Other Products for which we have revenues only.

    Services is a collection of all non-hardware revenues and is (finally) being recognized as a non-trivial business. With reported revenues of $26.6 billion in the last twelve months, it's big enough to be a Fortune 100 company and set to double in four years. ((Although a non-zero business, the valuation of Services continues to confound observers who cannot separate it from the hardware businesses it attaches to--which themselves are considered near commodity value--thus paradoxically valuing the overlying asset of Services near or precisely at zero. Incidentally, Facebook is Fortune 98 at $27.3 billion and it is also one of the top 5 largest business by market capitalization.))

    That leaves "Other Products" which now becomes the revenue segment that is  "most likely to be ignored." This segment had revenues of only about $11.5 billion in the last 12 months which would place it at only a Fortune 245 ranking, equivalent to a Toys "R" Us or Biogen. How should we value Other Products?

    Other includes many hardware products including iPod, Apple TV, Beats, Apple Watch, AirPods and, soon, HomePod. Each is a significant product, with Watch probably the largest single contributor. But since we don't have specific unit numbers, we are left guessing at the contribution of each.

    The Watch itself has been a point of scrutiny as it could be initially teased out of the mix through an observation of the before-and-after launch vs. trend-line as shown below:
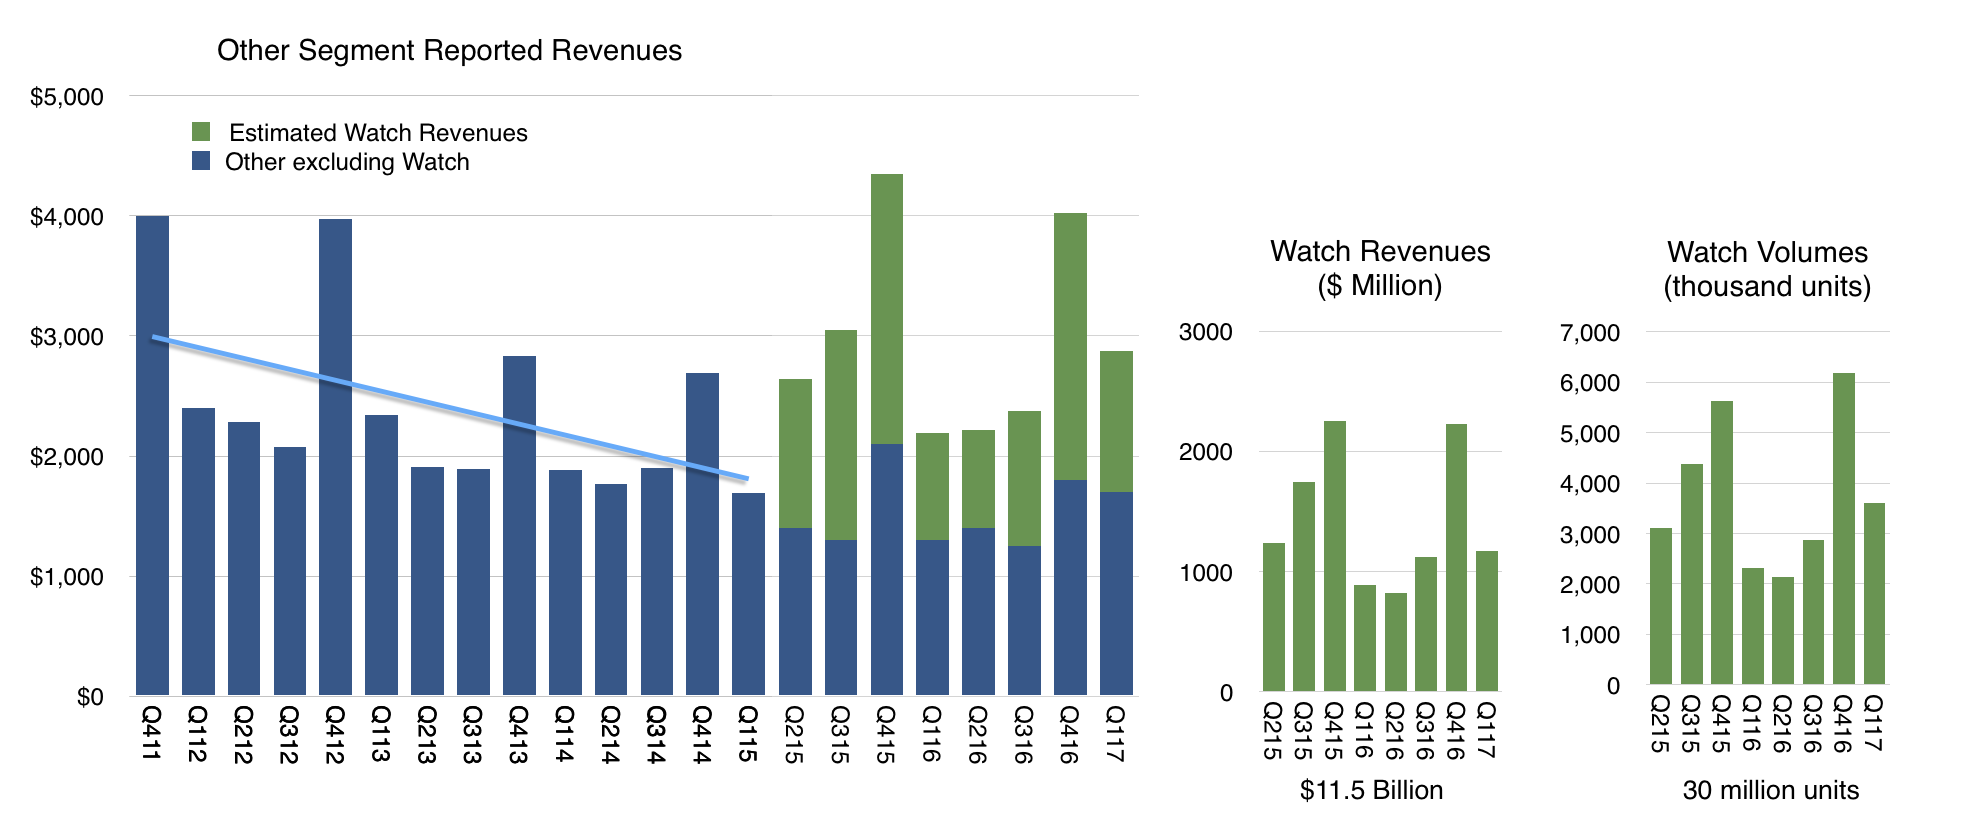
    This separation of Watch became harder to discern after the launch of AirPods. Though they are still very hard to obtain, they might be "moving the needle" by now with a contribution that would muddy the Other category further. Same with updated Beats headphones.

    This separation will be harder still with the launch of HomePod later this year. This product is priced at a point similar to the Watch and the quantities sold will be very hard to estimate without Apple's revealing of actuals.

    Fundamentally however, all the "Other products" will have a common relationship to the iOS and MacOS hardware: attachment to and integration with a "parent" platform. Apple TV might be stand-alone but I strongly doubt there are many sold into offices or households which don't have iOS usage.

    This means that "Other Products" are very similar to "Services" in that there is a dependency on a primary platform and, as it has been argued, they are therefore fragile. If the core platform declines then the Services and Other Products decline as well.

    Given this dependency it makes little sense to carve these categories out as separate businesses. They cannot stand alone. They are very much the "children" of the parent platforms.

    This is why it's assumed that Services, (a Fortune 100 company) and Other Products (a Fortune 250 company) can be discounted to zero. By focusing attention on the iPhone one can capture all the essential value of Apple. This is in contrast to the "sum-of-parts" valuation that could be applied to a set of independent business units in other companies.

    And yet I started this discussion with the point that you might be tempted to look at Apple on the basis of these reported revenue segments. The choice of what Apple reports is arbitrary. It could report no segment revenues at all and publish just one revenue number. This is roughly what Google Amazon and Facebook do. Or it could report segments in some other way. For instance, app store revenues and AirPods could be reported as part of "The iPhone Division". Or maybe it could bundle all iOS devices and services and accessories into another segment called "The iOS Group". Or it could create a "Devices group" and a "Personal Computing" group. Microsoft famously shuffles its revenues into creative segments based on various organizational structures or choice of what it wants to project as its focus.

    There is no limit to the ways Apple could slice revenues into segments. The reason Apple does it the way they do is mostly due to historical reasons. The company used to report the iPod separately as a segment but it no longer does. It also used to report Software separately, because, presumably,  it charged for it but now it no longer does. It also separated laptops or portables from desktops.

    The current reporting system is tempting us to draw certain "business unit" conclusions. These boundaries are illusions because Apple does not have business units. It has only one Profit and Loss statement (P/L) and is organized functionally. There is no "head of iPhone" or "head of Mac" responsible for each siloed revenue and cost structure. Instead, the entire business should be seen as a whole because it is managed as a whole.

    This is easily evident in how the products are designed and marketed and how they are engineered. The iPhone may spawn AirPods and AirPods may have no value outside the iPhone but the iPhone is valuable precisely because it has AirPods and Apps and Music and iCloud. And Apple TV, and HomePod and whatever comes next. The reason the iPhone can be sold at three times the price of competitor products is because of the Services and Other Products and iPad and Mac symbiosis. This integration drives the satisfaction, loyalty, price and brand value. There there are the Apple Stores and the launch events and the countless details that make up the ownership experience.

    The fact is that you can't slice and dice Apple.

    There is one Apple and it must be analyzed as a unitary entity. That analysis is therefore difficult. It is easy to pick up the numbers given and study them in isolation. The iPhone, the iPad, the Mac. We all do that.. However we miss a great deal in doing that.

    The lesson is that data we obtain leads us to see something but it also blinds us by taking attention away from what we cannot see. All data lies by omission. That which is left unmeasured may be where all the truth lies.
  2. Why does Apple TV deserve to exist?

    Research · 93 comments

    Since writing Peak Cable six months ago, surveys, research and analysis have contributed to the themes of unbundling the TV package. The data under scrutiny is, as usual, the data that can be gathered. Unfortunately the data that can't be gathered is where the insight into what is happening may lie. For instance, what matters for an entertainer is not how much you're watched but how much you're loved. Measuring love is done poorly with data on payment for subscriptions.

    A better proxy might be time. Liam Boluk makes the point in his post that "focusing on cord cutting or even cord shaving largely misses the point." Don't follow the dollars, he says, follow the time or engagement. "Relevance" is what matters.

    His data shows how linear TV has fallen by roughly 30% among the young (12-34) in the last five years. The trouble for the TV bundle (and advertisers) is that this is the most culturally influential group. They are also the group which will grow into the highest income group over the next decade. And this group does not love TV.

    We have to remember that it was the youth who drove early radio, TV and consumer electronics markets. Those young are now the old which still cling to the old media, served by companies that grew old with them. They are the "high-end" customers with which Nielsen itself has grown. They have the most money to spend and they are the targets for the ads ((no longer the Pepsi generation, they are the Depend and Viagra and pharmaceuticals generation))

    Paying $150/month to watch incontinence and erectile dysfunction ads—at a time not of your choosing—is preposterous for the young. They may like the programs but not the way they are packaged, delivered or interrupted. They are not smarter than their parents. They, like their parents, took to new technology more quickly. What makes the technology new is also what lets its makers separate the content from its delivery. These new technologies allow "modularizing" or unbundling that which was was integrated/bundled and thus allow their developers to focus on the customer's real jobs-to-be-done.

    Unsurprisingly, incumbents have responded by throttling access to original programming–an asset over which they still exert influence as distributors. Netflix and Amazon are taking the path of responding with their own blockbuster productions. Although Silicon Valley has more capital to deploy than Hollywood  this battle of attrition is by no means one that incumbents will win, and generally, it's not going to be pretty.

    Tweaking the nose of the incumbent might not be the way to establish asymmetry. The better tactic may be to help the system survive but offer a "short-term alternative". This is how iTunes took on and won Music. When Napster and file sharing created a clear and present danger to the industry, Apple's approach of a controlled alternative allowed the industry to finally move to a digital download model.

    An observer in 2004 would have said that Apple was bowing to the industry and providing it sustenance against "disruptive" free music. However, as behavior shifted to an overwhelming preference of iTunes downloads over physical media, the music labels found themselves in an untenable negotiating position. They had to concede on DRM, pricing and bundling itself. The music disruption occurred with a tacit acceptance and collaboration by the incumbents.

    Is history repeating? Looking at the situation around TV today, the strategies of the challengers can be summarized in a similar way:

    1. The content low-end: Now, YouTube, Twitch. Then, Napster, Gnutella
    2. The distribution low-end: Now, Netflix, Amazon. Then, incumbent music download sites.
    3. The nominally sustaining: Now Apple TV. Then, iTunes

    Apple cannot play an "ignore me" strategy because as much as investors think the company is irrelevant, everything it does is closely watched by anybody who might be even remotely touched by it. Especially in entertainment.

    In addition, due to brand considerations, the company cannot ship low-quality or no-quality product, including material that sits on its platform.

    They have to do something different. Something more complicated and something that takes much longer.

    What Apple best contributes asymmetrically is a new experience. The experience allows new behavior, new usage models and hence new loyalties to emerge. The loyalties create affinity which shifts the "love interest" for the user. The new Apple TV attempts to provide such a contribution. Not only in terms of the experience but also for becoming, finally, a platform for developers, who will try to make the product itself better in collaboration with Apple. Thus the "new experience" flips when bits which are streamed cohabit a device with bits which expect a consumer response.

    This "appification" becomes an interesting experiment in behavior alteration. Will "couch time" change from pure passivity to partial interaction?

    To the orthodox adherents to the religion of linearity of immersive programming this sounds impossible. But why else should a product deserve to exist? A great product is one which changes the user and for Apple TV to become great it needs to engage us to do something different than we do today. It needs to make us feel we are better for using it.

    Is this new Apple TV up to it? We'll have to wait and see. But then again, if not this one, then another one will. TV will not remain unchanged forever.

  3. Apple Assurance

    Research · 42 comments

    Apple is categorized as a vendor of consumer electronics. More specifically, a member of the "Electronic Equipment" industry in the "Consumer Goods" sector. If indeed this is what it's thought to be selling, there is a problem because it isn't  what its customers are buying.

    Apple's customers buy a mix of hardware, software and services under a brand that assures a certain quality of experience. This bundling and integration of otherwise disparate things is why the brand is such a success.

    This anomaly between what Apple is thought to sell and what buyers actually buy can leave the casual observer confused. As a result the company's categorization as vendor of hardware deeply discounts its shares. It is, in other words a less valuable business. This is because a seller of consumer electronics does not benefit from "system valuation" since there is minimal loyalty to the product after the sale.

    The consumer electronics vendor has no network to leverage, no ecosystem adding value after the sale, no platform and works through multiple levels of distribution to reach the customer. In contrast, a system vendor can expect benefits from network effects, ecosystems, and a coveted relationship with the end user.

    The result is that the valuation of a consumer electronics vendor is based on the momentum of individual products. Apple has always been valued this way. Each hit product is considered to be a stroke of luck/genius and the chances of recurring are discounted to about zero. Regardless of the fact that it has a track record of "home runs", Apple's hit rate is not considered sustainable. ((The P/E ratio is the primary indicator in this analysis)). Certainly Apple is not valued as being able to generate reliably recurring revenues.

    But what if we were to value Apple on the basis of what people are buying rather than what it's thought to be selling?

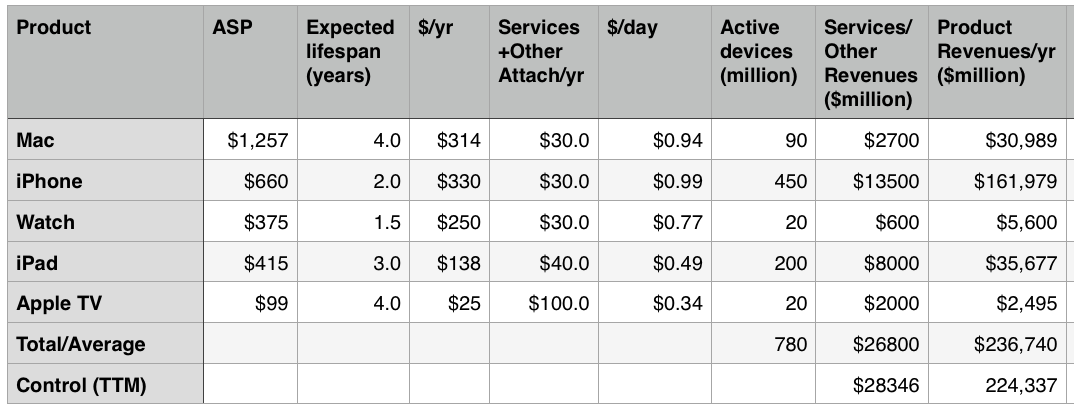
    The model is simple enough: determine the number of users, estimate the lifespan of the products, and figure out the services attached to the products; then, given the price, obtain a price per product per day. You then can get a recurring revenue figure.

    I did just that and the results are in the following table:

    Screen Shot 2015-09-15 at 5.13.27 AM

    The first column is the product, the second is the Average Selling Price (ASP), the third is the expected lifespan of the product, and the fourth column is a calculation of the end user’s “spending per year” on the product.

    The fifth column is an estimate of the revenues from Apple's Services and "Other" groups from post-sale revenues attached to the product. This Services revenue includes AppleCare, iCloud, Music, App Store, other stores, Beats, accessories, iAd, and Made for i (MFI) licensing. It also includes Google traffic acquisition revenues and other licensing.

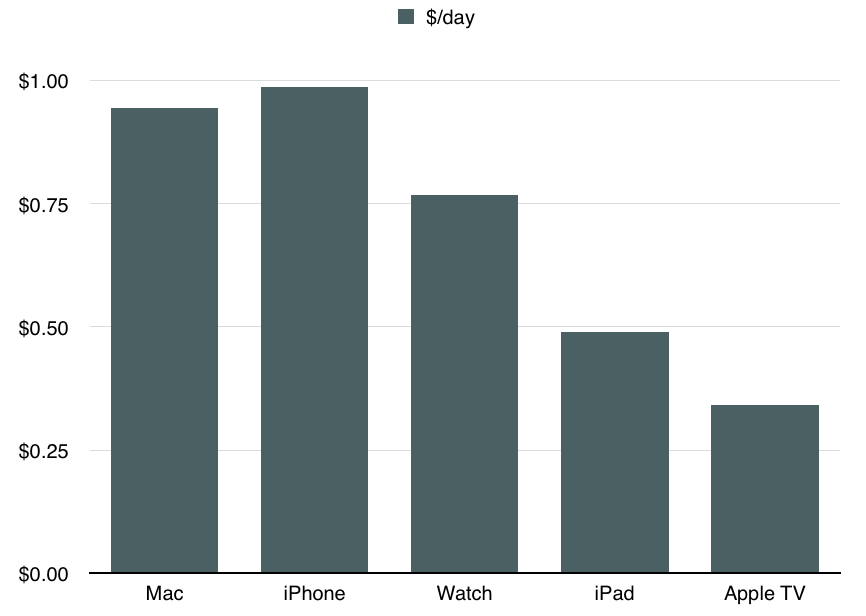
    The sixth column is an estimate of the consumer "spend per day" on Apple's product lines taking into consideration Services.

    The seventh column is an estimate of the number of active devices in the hands of users. Note that these are expected to change over time.

    The eighth column is a calculation of Services/Other income on a per-product allocation. This is a test of the Services+Other estimate and is meant to sum to nearly what Apple currently reports as Services+Other revenues.

    The ninth column is a test of overall revenues on a per-product allocation. This should add up to total revenues (estimated for next year.) ((Naturally, the active devices estimate is the most sensitive but it should be tweaked to create a reasonable forecast for next year.))

    The bottom line is the following graph which shows the revenue per device per day inclusive of Services and Other income (The sixth column).

    Screen Shot 2015-09-15 at 5.22.23 AM

    This is, in my opinion, a reasonable way to approach valuation of Apple as a business. It's also a way to inspect its strategy.

    As a valuation we can easily obtain the net present value. The model gives us sales and by estimating a net margin (which is remarkably steady around 22%) we can get the free cash flow.Iterate into perpetuity with a discount rate, and you can get the net present value of the company. With a modest growth rate leading to a billion active devices in use and a normalized revenue per device of $0.92 you can easily see cash flows equivalent to $1 trillion in present value.

    But much more interesting than this value is the notion that Apple is in business to deliver a product/service mix to loyal customers and to preserve their loyalty through constant improvement and innovation. You can see strategic intent in increasing the attach rate of services per device. You can see a strategic intent in building loyalty and the right customer base which is likely to be loyal. You can see strategic intent in the iteration of the product in a way that extends loyalty and expands the solid base but also increases the $/day rate. This analysis correctly informs almost all decisions the company makes.

    What we just saw in the launch of a new Apple TV and a new iPad is consistent with this strategy. Apple TV will have a higher service attach rate with apps while keeping pricing well below consoles thus expanding the user base. The iPad is increasing in price and getting more accessories. The developers are encouraged to build richer and more valuable apps that are uniquely enabled by the new device.

    The fact that Apple has just launched a subscription service for the iPhone  makes what was clearly their strategy all along plain to see however it has been a strategy in effect for decades.

    It isn't a difficult idea to embrace. It always surprises me that it's not more commonly held. The reason may be that Apple is mis-categorized.

    Or perhaps the entire categorization of industries and sectors is obsolete in what is a new post-industrial age. Some have figured this out already. Others will take longer.


  4. The billion dollar hobby

    Research · 67 comments

    During the latest shareholder meeting Tim Cook revealed that Apple TV sales were above $1 billion in the last fiscal year (ending September 2013). The company later clarified that this figure includes device and content sales.

    This poses a problem. In previous statements the company cited device (unit) shipments rather than value. The statements made to date suggested that cumulative volume of 3rd (current) generation Apple TV totaled 6 million units as of January 1, 2013.

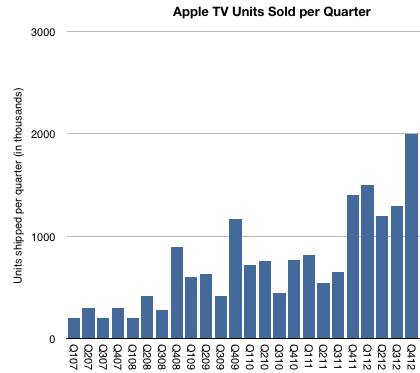
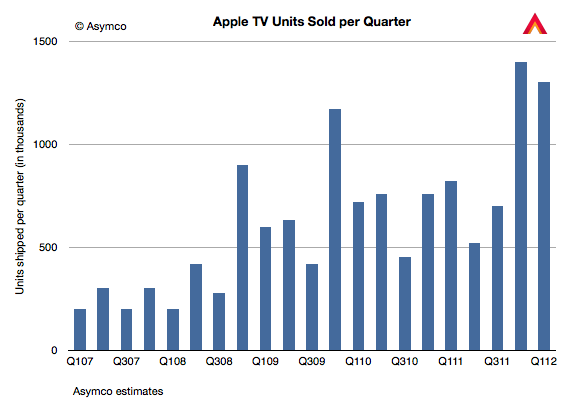
    The following graph includes an estimate of quarterly Apple TV sales based on comments made to date.

    Screen Shot 2014-03-02 at 3-2-8.07.43 PM

    As there were no additional comments during 2013, the "Billion Dollar" quote is all we have to go with for the year.  The problem with trying to separate content from hardware is complicated by several factors:

    • How are we to attach content revenues to Apple TV? For example, what if I purchase a series of shows on iTunes or an iPhone and decide to watch them on my Apple TV. Do these purchases count as being "attached" to Apple TV? Do we attach the full transaction value or do we attach the portion that Apple keeps (as in agency accounting)?
    • How does Apple account for channel placement on Apple TV? Do the channels prominently displayed on its user interface pay for this access (even though the user needs a cable subscription?) Is this the primary source of content revenue that is attributed to Apple TV?
    • What about Netflix, YouTube, etc? What is the content licensing deal with these channels? Does the Netflix channel actually cause an Apple TV purchase or does the Apple TV purchase cause a Netflix subscription?
    • Without content, one might think that the $1 billion revenue would yield total device shipments approximately 10 million units in fiscal 2013 (assuming $99 unit pricing). This is not quite right however as Apple's revenue per unit is unlikely to be $99 unless all units are sold through its own retail stores (including online). Sales through other retailers probably allow for some retailer margin so Apple's average selling price will be below $99.
    • Another question is the fiscal year accounting. We have visibility into the fourth quarter of 2012 (about 2 million units est.) so we only need to fill in the first three calendar quarters of 2013 to understand the Billion Dollar volume.
    • Finally, I already estimate separately the overall video market (in my iTunes Business Report) which, based on historic data and other inferences suggests a total video content gross (contributing to iTunes revenues) of $1.8 billion for the fiscal quarter. If a significant portion (50%) of this were allocated to Apple TV it would imply that the hardware business contracted sharply in 2013. Put another way, if I add what we know about C2012 units (6 million and an ASP of $89) to what I estimate video content revenues to have been in 2012 ($1.6 billion) I get a $2.1 billion business. This would be a "two billion dollar" business in 2012.

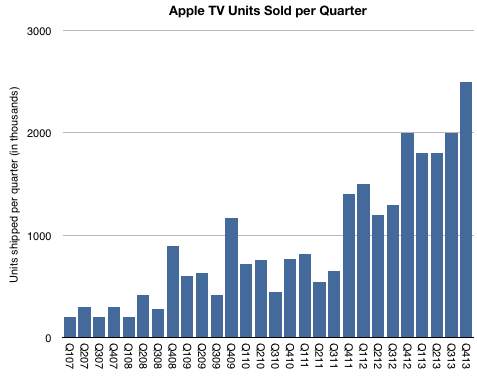
    All this makes the Billion Dollar Hobby a puzzle. The way I can make it square with existing assumptions is by saying that "Apple TV content revenues" are mostly, if not entirely, distribution revenues from channel placement rather than iTunes purchases. ((This revenue will end up in licensing/other revenues in iTunes/Software/Services segment and separate from Apple TV (which is a part of Accessories).))  As a result, my best guess now is that there were about 7.6 million Apple TVs sold in fiscal 2013, with a bit over 8 million for calendar 2013.

    If I'm right, the complete history of the shipments would be similar to this graph:

    Screen Shot 2014-03-02 at 3-2-9.08.24 PM

    By Apple standards this is indeed a modest story. The total units sold would add up to more than 25 million units with healthy growth. But it would not be in the same magnitude as other iOS devices which have so far sold 800 million units.

    More important than this picture however, or the Billion Dollar Business threshold, would be a better understanding of how Apple sees Apple TV as a business. We already knew that it was a low value hardware business. I even suggested that it's "Apple's equivalent of the Kindle": Hardware sold at low margins as a gateway for a high volume content business (iTunes). The problem with that model is that selling other people's content is never a good margin business. If it were to be sustained, Kindle may ultimately have to become an Amazon Prime salesman.

    So that leaves the Apple TV as a product without a satisfactory business model. Unsatisfactory, at least, to Apple's standards; hence the hobby label. But what if the model is turning out to be a platform for discovery of content and therefore the equivalent of (dare I say it?) a portal! ((Exclamation point.)) The TV UI certainly limits search or traditional browsing interaction but it enables eye candy for a few choice placed offers. It is a low interaction model. Think of how the prevailing UI for TV for decades has been that of pressing one button repeatedly, also known as channel surfing.

    If so , the business of Apple TV may be the auctioning of the real estate on the landing page. In some ways this is how iTunes is already behaving by "featuring" exclusive music content.

    There are all sorts of implications, which I will leave as an exercise to the reader.

  5. Electric Shadow 1: Bicycle for the Mind

    Research · 3 comments

    Horace Dediu and Guy English discuss the future of TV, how we consume media, and the fate of console-style devices. From Apple to Nintendo and beyond, is there one box to rule them all, or can there be?

    Interview segment: Cinematographer Barry Braverman talks about working with director Wes Anderson (uncut version to be posted as Screen Time #54)

    via 1: Bicycle for the Mind.

  6. iTunes Update

    Research · 29 comments

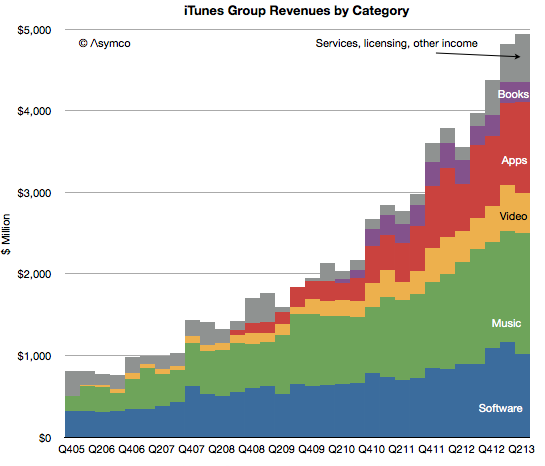
    In the latest quarter the iTunes group top line grew by 25%.

    Additional newly reported items:

    • Quarterly revenues dipped slightly to $4 billion (second highest after $4.1 billion last quarter).
    • iTunes Stores billings (i.e. gross content revenues) were $4.3 billion
    • Reached the best month and best week ever for App Store billings at the end of the quarter.
    • iTunes billings translated to quarterly revenue of $2.4 billion, up 29% from the year ago but flat q/q. Company reports “strong growth in revenue in both content and apps.”
    • New content added includes HBO GO and WatchESPN available on Apple TV. Apple TV catalog now includes over 60,000 movies and over 230,000 TV episodes.
    • Users have downloaded more than 1 billion TV episodes and 390 million movies from iTunes to-date. They are purchasing over 800,000 TV episodes and over 350,000 movies per day.
    • iOS developers have now created more than 900,000 iOS apps including 375,000 apps made for iPad. Apps created grew by 50,000 overall and 25,000 iPad apps.
    • Cumulative app downloads have surpassed 50 billion.
    • App developers are being paid at the rate of $1 billion per quarter.
    • App developers have been paid over $11 billion for their sales through the App Store (half of which was earned in the last four quarters.)
    • There are now over 320 million iCloud accounts
    • There are 240 million Game Center accounts
    • Almost 900 billion iMessages have been sent
    • Over a 125 billion photos have been uploaded and over 8 trillion notifications were sent.

    Some observations and estimates:

    • Music revenue growth remains at around 15% while video revenue growth remains around 25%
    • Apps continue to accelerate with a near doubling of revenues
    • Book revenues are contracting as pricing pressure is being felt
    • The software group grew moderately at 15% as Apple’s apps are reaching saturation within the iOS user base and as Mac sales stagnate.

    As a reminder, you can order the iTunes Business Review from the Asymco Store.


    Screen Shot 2013-08-05 at 8-5-4.21.54 PM
  7. The beloved hobbies of Google and Amazon

    Podcast · 40 comments

    Tim Cook speaking about the Apple TV product:

    For Q4 we sold 1.3 million. That is up over a 100% year-on-year. We sold more than 5 million Apple TVs during the fiscal year, which is almost double the previous year, when we sold 2.8 million. So the business continues to do very well, but if you look at the size of revenue of this business versus our other businesses, it’s quite small and so it still has the hobby label, however it’s a beloved hobby and we continue to focus on it and continue to believe there is something more there and continue to pull the string to see where it takes us.

    Five million Apple TVs per year is a half-billion dollar hobby. As such it quintupled from the first year (calendar 2007).

    The value for hardware is, of course, only a part of the story. It is accounted for as part of peripherals revenue and amounts to 18% of total peripherals revenues. Last May I estimated that the installed base of Apple TVs was 10 million. I'd estimate current total to be closer to 12 million. Assuming $10/month in content sales per Apple TV results in $1.4 billion of which 30% might be retained by Apple as revenue (agency fee).

    The yearly revenue thus could be as high as $900 million. Therefore it seems plausible that Apple TV is on the verge of being a billion dollar business.

    It may be a hobby to Apple but I've noted before on my podcast that Apple TV is a mirror image of the Kindle business model: Sell hardware at low margins and experiment with content sales as a profit model. The "hobby" moniker means that it's not a big business but how big is Kindle or Nexus 7 for their respective owners?

    Kindle may sell up to 10 million units at nearly break-even but is the average revenue per user much higher than Apple TV? What about the Nexus franchise? Is the loss on hardware leading to revenue to Google+OEMs above $10/month? I doubt it.

    I can't be precise or absolute about it since we don't have data from Amazon or Google about units or from any of the platforms' margins or attach rates for content, but I'm doubtful that they qualify for more than hobby status according to Apple's definition. At least in terms of profitability, Apple TV could be bigger than either Kindle or Nexus tablets.

  8. Apple's Growth Scorecard for third quarter 2012

    Research · 70 comments

    In the parlance of developers Apple keeps "throwing exceptions." This quarter the iPad surprised with a significant decline in sales growth. I placed a table showing the sales growth for this quarter as well as the previous 22 quarters at the bottom of this post.

    Here is a quick review of each line:

    1. The iPhone returned to a more customary growth rate (which I rate as Very Good--above 50%). The quarter was bound to be quirky due to it being both a transition quarter and a launch quarter. The launch of the iPhone 5 came quite late but not too late to make a contribution. It was also widely rumored and anticipated so there was slowing of the previous generation product. I expect growth to accelerate further in the last quarter of the year.
    2. The Mac turned in a commendable 6% revenue growth (1% unit growth) on the back of the new 15" Retina screen MacBook. The average sales price increased sequentially and the mix of portables to desktops reached a new high of above 80%. More about the Mac will be written in a future post.
    3. The iPod continued its decline. The 26% sales decline was in-line with other non-launch quarters. The company tipped its hand and let us know that iPod touch now makes up 60% of iPod volumes. At 3.2 million iPod touch units, it's a significant iOS contributor but still a declining number.
    4. The iPad was painfully underperforming. With only 9% revenue growth, it was a complete reversal of the torrid growth of the last two years. Management blamed both anticipation of a new product and a reduction of inventory ahead of refresh of the larger screen retina. The only silver lining was that the average price decline was moderate (down about $3/unit). Overall, I'm very disappointed with the pause in the product but the new mini could change the character of the product dramatically in a way similar to how the iPod mini turbo-charged the iPod line.
    5. iTunes had a very good quarter. It's the perennial growth engine with the most consistent performance throughout the time period shown. It was the second fastest growing line item firmly in the "High" growth bracket.
    6. Peripherals, including Apple TV had a moderate quarter. Management revealed that about 5 million Apple TV units shipped in the fiscal year. That adds up to a half-billion dollar revenue business. Peripherals had $2.8 billion over the same time frame so Apple TV was about 18% on a yearly basis. This does not include content revenues.
    7. Software had a modest growth of 22% but has come to be the high end of the range. Since changing the way it prices OS X updates, the era of Apple software windfalls is over. Still, at nearly $1 billion per quarter it's nice pocket change, especially as it's nearly all margin.
    8. The overall top line (net sales) was a bit improved sequentially (+4 points of percent) but still in the "transition quarter" range of moderate growth. The company may be shifting its launch cycles and as a result we're seeing a break in pattern. As pricing for iPhone and iPad did not change very much the slowing of top line growth is entirely due to a unit shipment reduction. Again, the primary cause is transitions in multiple lines simultaneously.
    9. The bottom line (earnings) followed the same pattern as top line (slight sequential increase in growth). There was a slight attenuation of margins (gross margins are down to 40%).

    Overall, the quarter was not up to the recent level of performance for Apple. Growth was overall "moderate".

  9. Beneath contempt: The Apple TV business model

    Research · 98 comments

    Last year we sold ... 2.8 million Apple TVs. This year, just in the first six months of our year we've sold 2.7.

    Tim Cook at D10 1:45.

    I note the "our" in "our year". This implies fiscal year (that and the fact that he spoke in the past tense before six months had passed in the calendar year.)

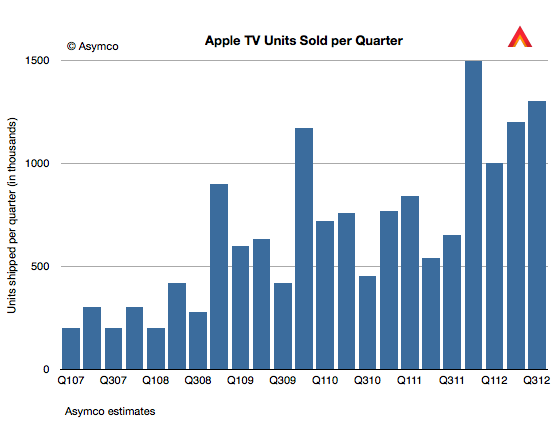
    Given the public information we have so far, it's now possible to estimate with some confidence the sales history of Apple TV. The following chart is my estimate. It includes all the known data so far with some interpolations to fill in the gaps.

    Assuming average revenues per device of $100, we can get an estimate of about $344 million in Apple TV hardware revenues for calendar 2011. This is not a large amount relative to Apple's other lines of business. It is, for example, only 14% of the overall Peripherals revenues and only 5% of the iPod.

    However hardware revenues are not the whole story. The business model for the device is in many ways the polar opposite of the business model of the iPhone. Whereas the iPhone employs "break-even" iTunes App Store (and the Music and Video and Book stores) in order to sustain its high hardware margins, the Apple TV business has low hardware margins that sustain content.

    The complete picture therefore has to include an assessment of the content attach rates and the agency fees that Apple gets for that content.

    Let's assume that each Apple TV is used to generate $10/month in content sales. This is not a lot. It's equivalent to 5 TV shows or one movie purchased or two movie rentals per month. The model I have shows that the installed base of Apple TVs was about 10 million by the end of 2011. That means that the run rate is $1.2 billion in content sales for the Apple TVs in use.

    Now Apple does not book all that. They book only about 30% as revenues as their agency fee. That means that Apple TV could be generating revenues at a run rate of $360 million (to Apple.)

    If we add that to the $344 million in hardware revenues we get about $704 million for 2011. This is still not a huge business. It is about equal to the revenue from iPad Smart Covers[1]

    Looking forward, if Apple TV units sell at double the rate of last year and we increase the footprint accordingly, we could see a revenue rate of $1.2 billion for 2012.

    Now this is not a high margin business. The margin on the content may be less than 50%--depending on transaction costs and hosting/traffic fees. The margin on the hardware is also likely to be below 40%. So the business is not wildly profitable. But it probably is profitable. Which means it makes sense to keep it running while waiting for other pieces to fall into place.

    As Tim Cook repeated, they are very interested in this space. However, any discussion of the future must include an analysis of the business model and the sustainability in terms of profit that keeps long term development focused on getting the product to be good enough for the right jobs to be done.

    What we should think about however is this "polar opposite" business model. Apple is running this as a "hobby" or as an internal experiment. Sales are (relatively) tiny but it generates some profit. Volumes are small but they are growing. It's taking a heck of a long time. It's asymmetric to the prevailing model the company relies upon. It's beneath contempt from all observers. Sounds familiar?

    ---

    Notes:

    1. In 2011 there were about 40.5 million iPads sold. If we assume half of those purchases also resulted in a Smart Cover purchase and if the average revenue per Smart Cover was $35 then total Smart Cover revenues were $709 million.
  10. Discerning Apple's international product positioning through the big Mac index

    Research · 31 comments

    Thanks to all those who contributed to the big Mac index there is a substantial amount of pricing data available in one location.

    The analysis that I hoped to perform on the data was to see if Apple was pricing specific products differently in international markets. It was prompted by some apparently anomalous pricing of the iPhone 4S in Brazil.

    To summarize, the idea is to calculate the "expected" price of an Apple product by taking the untaxed US price and adding duties and tariffs and taxes to determine what that product "should" cost in another country. Then taking the difference between this "expected" price and the actual price to determine if Apple is using pricing to signal in a particular market.

    The analysis basically eliminates the effect of government on price and leaves currency and actual pricing signals from Apple as variables.

    The analysis is not simple because there are many obscure tax rules. Some products are taxed differently in the same country. I have not completed the country-level analysis but have been able to see some averages over the countries reported (total of 45 reports.)

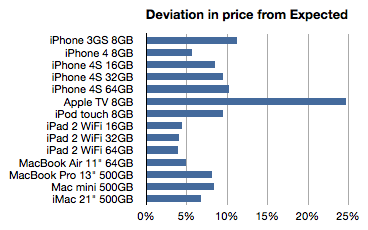
    The following chart shows the average deviation from "Expected" as a percent:

    Here are some potential interpretations of this data:

    • The more a product deviates from expectation (e.g. the Apple TV) the more it's likely to be targeted to the US or potentially has advantages of scale in the US
    • The less of a deviation (nearer to zero, e.g. iPads) the more the international market is interesting to Apple. They are essentially signaling that those products are targeted at wide distribution.

    If we take this train of thought it takes us to these conclusions:

    1. The Apple TV is being "subsidized" in the US. The price is so low there probably because it is benefiting from content sales. This is a compelling argument and it might suggest a strategy for Apple TV closer to that of Amazon's Kindle than to any of the telecom or computing products Apple sells. This may have significant implications in the pricing of any future "TV" product from Apple.
    2. The iPhone 3GS seems to be a US-targeted product. Anecdotal  evidence shows that the product is not particularly strong selling in international markets. Apple is seemingly not trying to stoke demand with discounting.
    3. The iPhone as a brand is not tuned to compete on price globally. Indeed, the iPhone 4S is the most "overpriced" product and seems to be premium priced vs. iPhone 4. The iPod touch is also something of a prima donna when it comes to pricing.
    4. In contrast to the iPhone, the iPad is being positioned through pricing for broad global distribution. This is undoubtedly due to their unlocked nature but there might be some other penetration tactics at play here.
    5. Macs in general are not priced aggressively internationally. However the Air does seem to be positioned for volume growth (while the mini is not.)

    Admittedly, these are quite aggressive conclusions given the limited data. What gives me some confidence in these conclusions is additional circumstantial data. The demand for some products is clearly higher outside the US than others. I believe and this data seems to support the notion that the overall strategy for the iPhone, iPad, Mac and iPod is being tuned for the international markets with some precision.