Asymco

Asymmetric Intelligence

cash

  1. Who Solved the Capitalist's Dilemma?

    Research · 14 comments

    In The Capitalist's Dilemma, Clayton Christensen and Derek van Bever introduce a powerful new theory which explains the relative paucity of growth in developed economies. They draw a causal relationship between the mis-application of capital in pursuit of innovation and the failure to grow. ((and, indirectly, in the increase in inequality and hence the destabilization of socio-political institutions))

    In particular, they observe that capital is allocated toward the type of innovations which increase efficiency or performance and not toward those which create markets (and hence long term growth and jobs.) This itself is caused by a prioritization and rewarding of performance ratios rather than cash flows and that itself is due  to a perversion of the purpose of the firm. ((That being the creation of customers not shareholder returns))

    For this statement of causality to be confirmed we need to observe whether it predicts measurable phenomena. For instance, we need to see whether companies which create markets apply capital toward market-creating innovations and whether companies which create value through efficiencies or performance improvements hoard abundant capital.

    Over the entire global economy, the pattern of capital over-abundance is easy to see. The amount of cash or securities on balance sheets is extraordinary and unprecedented (estimated at $7 Trillion, doubling over a decade). However, growing cash is not a perfect indicator of inactivity. Cash is the by-product of earnings after investment. So if operating profits are growing and investment is growing, but not as fast, then it's possible to grow cash while still growing investment.

    The better measure is investment in capital equipment or, more specifically, purchases of plant, property and equipment. ((Operating expenditures can also be measured but they cannot grow inorganically due to most of the costs being related to skilled employment which has supply constraints.)) Indeed, on a global scale, capital expenditure as a percent of sales is at a 22-year low.

    CapEx is a good proxy for non-financial "investment". It's also a measure that can be easily obtained as companies report this activity in their Cash Flow Statements.

    So the best method for assessing the theory's predictive power is to look at market creators and measure their investment in PP&E. At the same time we need to look at market sustainers and measure their (probable) lack of investment in PP&E.

    So here is my first attempt:
    Screen Shot 2014-05-27 at 5-27-3.25.43 PM

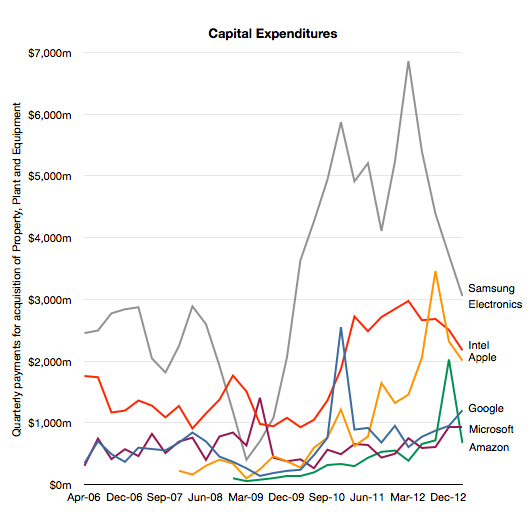
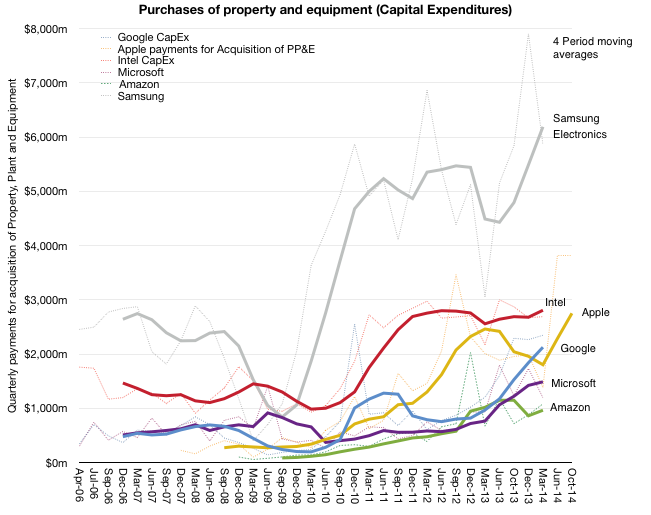
    It's an admittedly small sample of companies that are not that dissimilar. But within this group, over the time frame of about 9 years, we can see how capital expenditures are growing. ((Note that Apple's data extends to the end of their fiscal year and reflects their forecast given last October in the 10-K filing)) This sample shows that for a few companies, the amount spent on capital equipment grew dramatically. Especially since they are in businesses that might be thought of as not capital intensive.

    Consider Amazon: an Internet company if there ever was one. Their purchasing of capital equipment (in which they also classify software) went from 373 million in 2009 to $3.8 billion in last four quarters! The average spending was $84 million in the four quarters ending September 2009 and $964 million in the year ending March 2014. Amazon is investing in data centers and distribution centers and they are growing that asset base with an eye toward future growth.

    In contrast, consider Intel. Intel is in the most capital-intensive corner of the technology industry: semiconductors. They still manufacture their own so their investment in "fabs" continues. But Intel failed to create a market for mobile devices. The number of ARM processors shipped in 2013 was about 10 billion units while the number of Intel processors shipped was around 400 million.

    So despite being an innovator, Intel did not create a market. They still increased their CapEx but only by a factor of 2. Is this because Intel did not invest in market-creating innovations? Had they invested in market-creation, would they be increasing CapEx accordingly?

    Now look at Samsung. Samsung has grown CapEx by a similar factor to Intel (from pre-recession $2.5B/quarter to average of $5.5 during the last three years). Did Samsung create markets? Much of the expenditure went toward supplying components to itself and Apple (and others). In that regard, they did not create the market but filled it and optimized it.

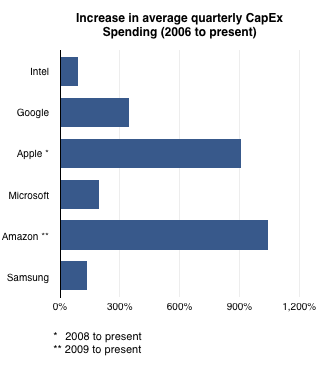
    Then there's Google. Google increased CapEx from an average of $476 million/quarter in 2006 to $2.125 billion in the last four quarters. That's an increase of 347%. Google spends almost all CapEx on data centers and we can see a pattern where CapEx growth anticipates service growth. However, the growth is not as pronounced as Amazon's.

    Microsoft also grew CapEx. Their investment mirrors that of Google: data centers. Microsoft increased from an average of $508 million/quarter (very similar to Google) in 2006 to $1.5 billion today. That increase is about 200%, slower than Google but in the same trend. Did Microsoft create a market since 2006? In terms of cloud computing and software as a services, yes. Their spending growth reflects infrastructure that supports a new business model.

    Finally there's Apple. In this time frame Apple did create the iPhone and iPad and their growth went from less than $200 million/quarter in CapEx to over $2.5 billion/quarter. The increase is nearly 10x over 25 quarters.

    To summarize, the following graph shows the increase in average quarterly spending (over a four quarter period) between 2006 and the present for these companies.
    Screen Shot 2014-05-27 at 5-27-3.10.40 PM

    The degree of "market creation" may be visible to the naked eye: Apple and Amazon did clearly create markets and they show highest CapEx growth while Intel and Samsung did not and they show the slowest CapEx growth. Google is continuing the expansion of a new market as is Microsoft and their CapEx growth is roughly proportional to these efforts.

    At least from this small sample the theory seems to hold. CapEx and market creation are at least correlated.  Much more analysis needs to be done, especially to discover the anomalies, but from the perspective of some of the most valuable and rapidly growing large companies, their commitment to capital expenditures is evident.
     

  2. How many years does Apple have?

    Research · 167 comments

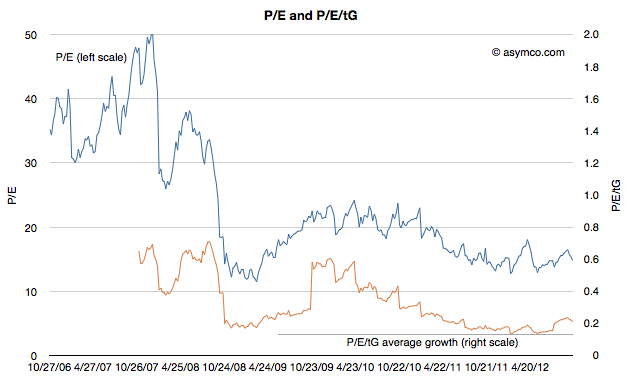
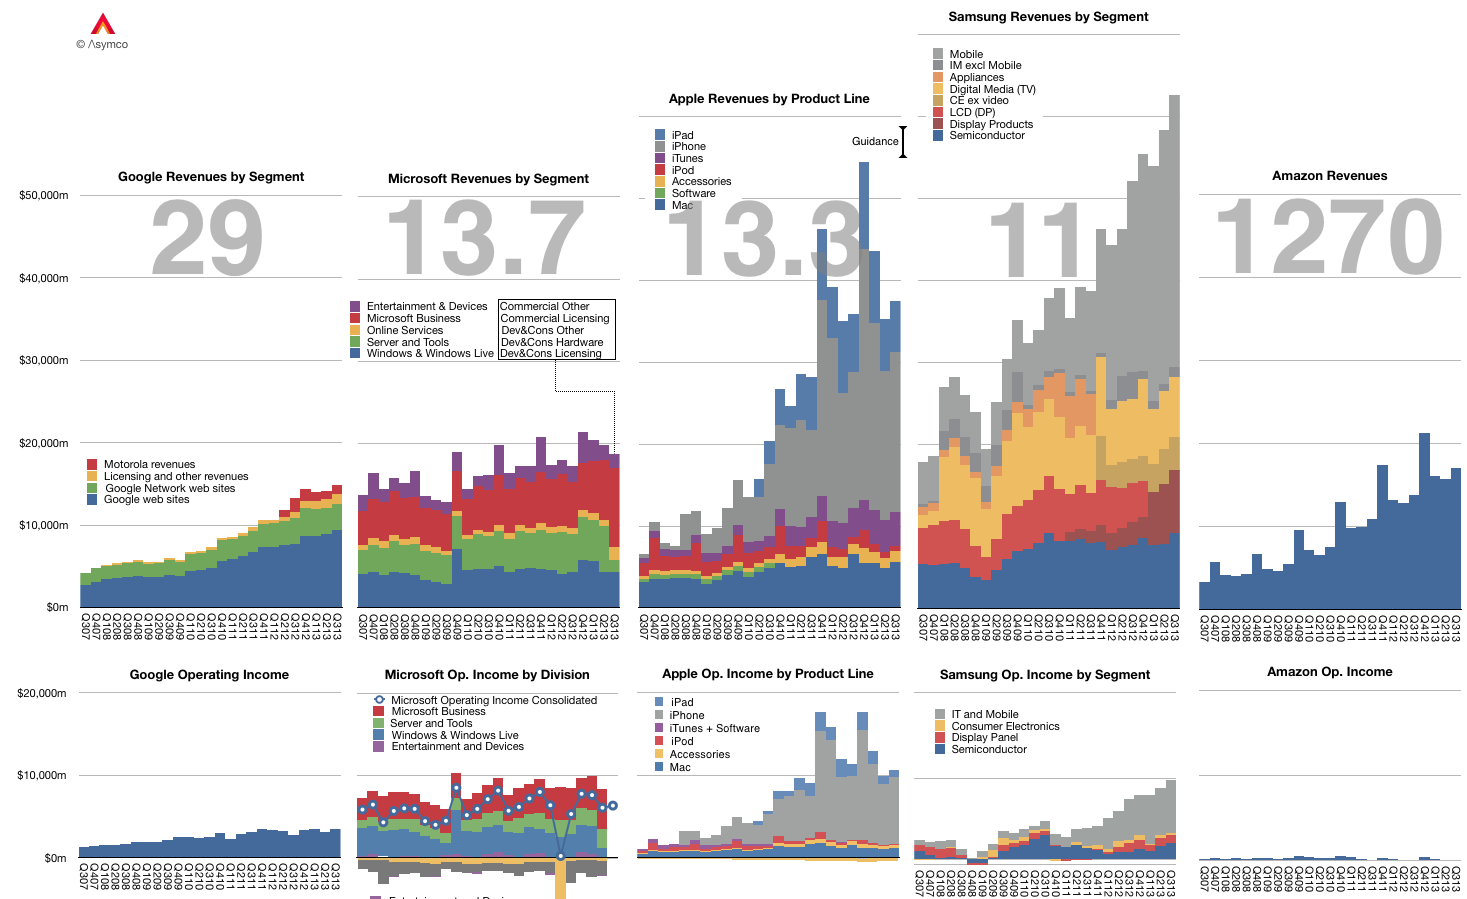
    The graph below shows the Revenue and Operating Income for a select group of companies. The large numbers represent the share price to earnings (trailing twelve months) ratio (P/E or PE ratio).

    Screen Shot 2013-11-06 at 11-6-2.56.25 PM

    Of course the P/E ratio hides a lot of subtlety. It mostly fails to account for the fact that earnings are largely a matter of opinion. A company can defer income (as Apple and Microsoft do), it can invest earnings (as Amazon does) and can otherwise avoid declaring it since it's taxable.

    A better measure is the Enterprise Value to Free Cash Flow ratio (EV/FCF). It reflects a "harder" measure of performance in the form of free cash flow. It is not a matter of opinion but a fact. Enterprise Value also excludes cash which is a measure of past performance.

    Nominally both P/E and EV/FCF measure the valuation of a company. They give what amounts to the number of years that current performance can be expected to last. For example a P/E or EV/FCF of 10 can be read as "If I purchase a share today, I should expect the company to pay me back in earnings in 10 years." Any earnings after 10 years are essentially "profit" for the investor.

    Inverted these ratios are a measure of Yield or how much of the total investment is paid back in a given year. In the example above, the Yield would be 10% or "If I purchase a share today, the company will pay me back 10% a year in earnings."

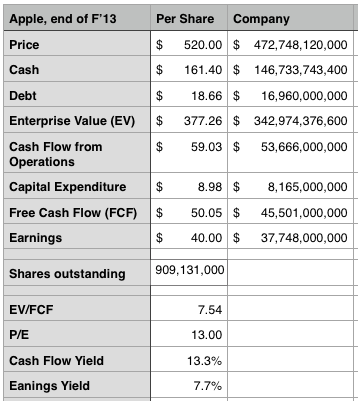
    Relying on P/E is troublesome since, as mentioned above, it's deceptive. We get into difficulty when P/E and EV/FCF differ greatly. If a company has minimal cash and declares all free cash flow as earnings then the ratios are the same. However, consider how different these two ratios are for Apple:

    Screen Shot 2013-11-06 at 11-6-3.11.50 PM

    The P/E ratio is 13 while the EV/FCF is 7.5. ((It would be very interesting to have both ratios available for all the companies in the graph above.))

    This means the investment horizon is nearly half of what P/E suggests. (The cash flow yield should give pause). Put another way, the market suggests that Apple has 7 more years of current profitability and not 13. Note that the P/E ratio for the S&P 500 is above 19.

    As Apple's deferrals are increasing investors should look again at what the company's worth. We had similar confusion when the company was deferring most of its iPhone revenue.

  3. Apple’s 3Q FY13 Review (Padcast)

    Research · 16 comments

    Preview 3Q-13 screenshot

    Using interactive graphics and narration, this latest Apple Earnings Review discusses Apple's performance in relation of its historic performance as well as to expectations (published in the Preview) on the following topics:

    1. Guidance vs Actual performance: Now that Apple changed the way it provides guidance, are we seeing a new degree of precision in their signaling. We look at the history of earnings guidance and how effective (or not) the current method is in helping predict performance.
    2. Gross and Operating Margins analysis: What is the pattern of margins and how important are margins to the perception of competitiveness?
    3. Margins by product. How are margins allocated by product?
    4. Average selling prices for each product. Any surprises in Pricing? What was the magnitude, cause and significance of iPhone ASP drop.
    5. iOS product shipments. Comparison with expectations, trends and explanations. Overall iOS growth story.
    6. Cash balance and the effect on cash of share re-purchase.
    7. Sales growth and Earnings growth, a long term retrospective.

    Duration is about 1hr.

    As a reminder, the Padcast can be reviewed interactively users can access to the underlying data.

    It's available for download on the iPad for $19.99. Those who already bought the Preview will be receiving an updated version soon that includes the Review at no extra charge.

  4. In the weeds

    Research · 55 comments

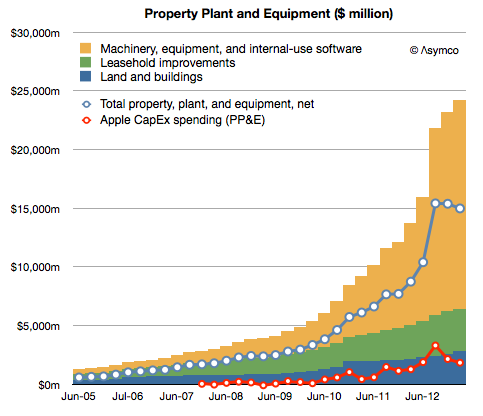
    Although discussions related to how Apple will "use its cash" center on acquisitions of companies, Apple's has been busy acquiring, just not companies. It has been buying capital equipment. Capital meaning (in the original sense of the word[1]) the means of production.

    Since the launch of the iPhone Apple has spent $21.1 billion on the acquisition of property, plant and equipment. The company has already stated that they will spend another $10 billion or so for the current fiscal year. This has been mostly machinery and equipment used in manufacturing.

    The result in asset value is shown below:

    Screen Shot 2013-05-30 at 5-30-6.29.53 PM

    [The Net value, shown as a blue line, is after accumulated depreciation. The red line represents spending as reported on the cash flow statement.)

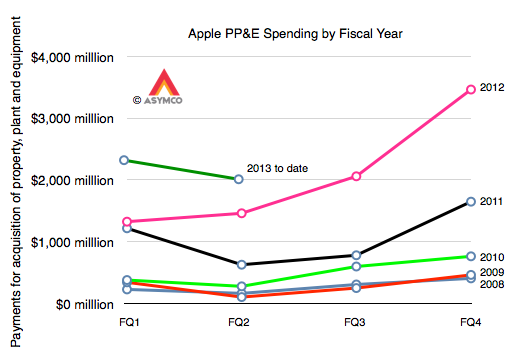
    The change in spending year/year (fiscal) is shown in the following graph:

    Screen Shot 2013-05-30 at 5-30-6.31.27 PM

    So these are very large numbers, even compared to other capital-intensive semiconductor manufacturers:

    Screen Shot 2013-05-30 at 5-30-6.48.22 PM

    Given this enormous spending one could imagine it's the subject of intense scrutiny. However the only question on the subject that I've ever seen was from Steve Milunovich of UBS to which Peter Oppenheimer, CFO offered an explanation:

    Steve Milunovich - UBS
    …second question would be on CapEx, you spent almost as much Intel does. I think you guys have said you’re not going to become vertically integrated per se but in a sense you are since [you buy] equipment for your partners, could you talk about the strategy here and how much of a differentiator this gives Apple in terms of your ability to ramp new products over time? And maybe a little bit more about how deep you will go in terms of semiconductor components for you, etc.?

    Peter Oppenheimer - Chief Financial Officer
    Sure. Steve it’s Peter. We expect to spend about $10 billion in CapEx this fiscal year that will be up little under $2 billion year-over-year. We expect to spend a little bit under $1 billion in the retail stores. And the other $9 billion is spent in a variety of areas. We are buying equipment that we will own that we will put in partners’ facilities. Our primary motivation there is for supply, but we get other benefits as well. We are also adding to our datacenter capabilities to support all the services that Tim spoke about in answering Ben’s question and in facilities and in infrastructure. So, that’s where the capital is going.

    I would say that this is not a very satisfying answer, which is why I thought it merits further questioning[2].

    Alas, no.

    Whereas there is a constant clamoring for Apple's to use its cash to "acquire" or "buy" something, anything, maybe people not looking hard enough. If you need the satisfaction that comes from knowing that money is being spent, a glance at the Cash Flow statement and Balance Sheet shows that Apple buys the equivalent of one Yahoo! every three years[3].

    The main difference with this type of acquisition is that there is less value destruction. Using the capital to ensure access to capacity, differentiation and hence a high margin is better than writing off the goodwill after a few years.

    --

    1. The term capitalism, in its modern sense, comes from the writings of Karl Marx
    2. I am prepared to be alone in this quest as it seems to merit no mention from others
    3. or 10 Tumblrs every year
  5. How much do maps cost and what are they worth?

    Research · 68 comments

    How much does it cost to have the world's best maps?

    The answer may seem simple: $8.1 billion.

    That was the cost to Nokia in cash for buying Navteq in October 2007. It would seem that buying that asset (or another one like it) is a cut-and-dried solution to anyone needing a mapping "solution". But it's not an answer that is either complete or explanatory of how mapping solutions are valued.

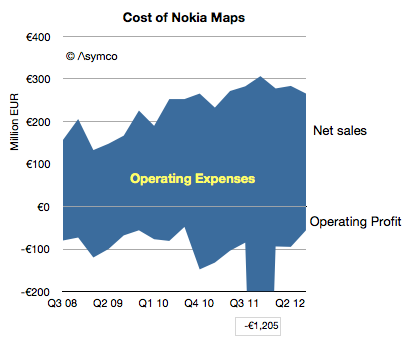
    Navteq was not priced as a database for an app. It was a business which was expected to create licensing revenues and profits[1]. The actual price for this business net of cash was $7.7 billion but the following graph shows the net sales and operating profits since Nokia began reporting its performance:

    Screen Shot 2012-12-18 at 12-18-3.13.12 PM

    The blue area represents the difference between sales and costs and hence the operating expenses--the payments needed to "keep the lights on".

    These total expenses over the 4.25 year time frame totals €6.5 billion. The total operating losses equal €2.6 billion. Therefore, as far as Nokia's shareholders are concerned, they paid $11 billion for Nokia maps, to date.

    What do they have to show for it?

    Nothing. The entire company is now worth only about $15 billion. It's hard to imagine maps being worth 73% of Nokia. What Nokia hoped to get for the product was some value in its devices. As other issues intruded, that value has not been realized. Nor has any external licensing revenue been realized. Net external licensing revenues are actually decreasing.

    The situation looks even even uglier when the maps asset can be seen as costing €1.5 billion every year. Why would anyone want to be in this business?

    I bring this up because, apparently, everyone wants to be in this business.

    Via Twitter I received a suggestion (rumor?) that Google spends about $1 billion every year for maintaining their maps. (Using a conversion from Euros to Dollars yields a Nokia maps burn rate of nearly $2 billion/yr.) Furthermore, there seems to be a burning desire for Apple to also burn this money.

    If so, then Apple might have to start spending $1 to $2 billion/yr to merely maintain a data set. That would be a minimum of an additional 7% in operating expenses.

    Why would they do that?

    If Apple cannot buy or license quality data, there may be no choice. Maps have become a hygiene factor for a platform. Not having them makes a platform repulsive but having them offers no attraction.

    Another way of looking at the maps asset is like a component in a phone. A vendor needs a certain class of processor, memory or screen or battery. Not having a minimum level of functionality makes the product uncompetitive but having it does not guarantee success.

    What's worse, the market may have been cornered—there may be no suppliers. Unlike hardware components, the maps component is not a commodity with a market of suppliers. The work needed to maintain the maps is a commodity but the aggregation and consolidation of the data is valuable and those who have gained control over the data and they are not likely to license it to any competitors for strategic (i.e. political) reasons.

    So we have a perverse situation of a very costly, unprofitable asset requiring duplication of maintenance effort by politically motivated actors imprisoned by their own strategic interests.

    If so then it fits perfectly with the mobile telecom industry. Like mobile networks, maps are very expensive and worth very little.

    ---

    Notes:

    1. The revenues that Navteq was obtaining during the 2008/2009 time frame included that from customers such as Verizon, Garmin, Advertising, Traffic services, Microsoft Windows Live services. For the six months ended on December 31, 2008, Europe accounted for 44% of NAVTEQ’s net sales, North America 43%, Middle East & Africa 8 %, Asia-Pacific 2 %, Latin America 2% and Greater China 1%.

    —

    If you want to learn more about how to analyze technology industries and the evolution of value chains, consider participating in Asymconf.

  6. ReCapEx: The curious case of Apple's 2012 and 2013 Capital Expenditures

    Research · 114 comments

    The latest yearly report from Apple includes, as it has in the past, the forecast of Capital Expenditures. I've been tracking this data as an indicator of both strategic intent and potential forecasting tool for iOS device production.

    Before exploring Apple's own forecast, we should look at how they met expectations for fiscal 2012.

    In October 2011 the company forecast was as follows:

    The Company anticipates utilizing approximately $8.0 billion for capital expenditures during 2012, including approximately $900 million for retail store facilities and approximately $7.1 billion for product tooling and manufacturing process equipment

    In October 2012 it reported:

    The Company’s capital expenditures were $10.3 billion during 2012, consisting of $865 million for retail store facilities and $9.5 billion for other capital expenditures, including product tooling and manufacturing process equipment, and other corporate facilities and infrastructure. The Company’s actual cash payments for capital expenditures during 2012 were $8.3 billion.

    There are two points that need to be highlighted:

    1. Expenditures overall were $2.3 billion higher than forecast. Nearly all of the over-spending was for "product tooling, manufacturing process equipment and infrastructure". Retail was planned at $900 million and actual was $865 (an under-spend of $35 million). As no major real estate assets were acquired (change in those assets was $380 million, less than 2011 or 2010) the "deficit" in budgeted expenditures can be attributed entirely to product tooling and manufacturing process equipment.[1] The $2.3 billion spending over expectations amounts to 34% of forecast.
    2. The cash payments for capex were $2 billion lower than expenditures. This is a curious situation which was not highlighted in previous 10 K reports. What this implies is that much of the "over-spend" was not paid for though cash and since no new debt was booked it's likely to have been paid for through some form of vendor financing. I'll explore some explanations below.

    So it's important to note that the company spent a great deal more (one third more) than expected and paid for some of the acquisitions through uncharacteristic or unorthodox means.

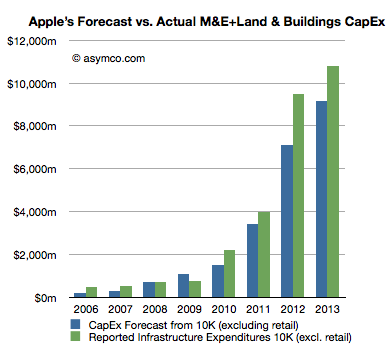
    The historic budgeting for Machinery & Equipment (+Land & Buildings) is shown in the following graph:


    I included the forecast for 2013 ($9.15 billion) and added 18% to estimate 2013 actual spend.

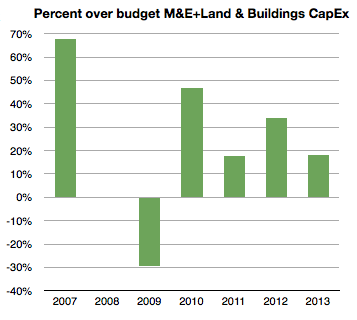
    The percent over/under budget (percent difference between green and blue bars above) is shown below:

    [Again, note that I took the liberty of forecasting 2013 over-spending at 18% or $10.8 billion.]

    Note that 2008 and 2009 were either on target or below target. The recession of 2008/2009 might have had something to do with that. The under-spending situation of 2009 was made up for during 2010 with over 45% extra spending. 2011 came in at 18% over and 2012, as already noted, was 34% over budget. I then suggest that 2013 will be at 18%, same as in 2011.

    When seen in this historic context, the increase of 2012 is even more dramatic. Apple overspent in 2012 more than it spent overall two years earlier. 2012 spending on M&E (and Land) was up 138% sequentially and nearly seven times the level of three years ago.

    With this splurge in mind it's necessary to think about that second noteworthy point above. There is evidence that at least some of the $2.3 billion over-budget was unanticipated and came late in the year. We saw the surge in spending in FQ4 from the gross asset value change data. The question is what was it spent on and why did it not go through the cash flow statement?

    Circumstantial[2] evidence points to the asset being production equipment (or even a whole plant) previously owned by Sharp. Sharp is a key supplier of screens to Apple but is also in financial distress. Sharp has also been the object of an intended investment by Foxconn [Hon Hai]. That deal fell through as Sharp's finances deteriorated. My guess is that these attempts to shore up Sharp are directed by Apple to ensure both continuity of supply and a balanced supplier base (offsetting Samsung, another supplier.) If Sharp were to enter into some form of bankruptcy, the key plant(s) used in producing screens for Apple might be "up for grabs" by creditors and they might be taken off-line, jeopardizing Apple's production capacity, irrespective of contractual obligations. I believe that Apple's late and unprecedented expenditure was to secure this asset. I further believe that the financing for this deal was done through a swap of "pre-orders". Stepping even further into the hypothesis, I believe Apple arranged to move a Sharp screen production line onto its books and "paid" for it through a pre-payment of components. This being a pre-payment it would be in the form of an "off balance sheet" commitment. Apple reported that "As of September 29, 2012, the Company had outstanding off-balance sheet third-party manufacturing commitments and component purchase commitments of $21.1 billion" [my emphasis]. This is a significant increase from earlier years and allows for a huge "slush fund" to cover asset swaps.

    If we take the timing of this expenditure into consideration, I consider it reasonable to assume that 2013 spending is lower by this amount. In other words, I think that about $2 billion, including the Sharp plant, may have been "brought forward" by a few months from 2013. If the company had spent more on schedule and on budget (i.e. with an over-spend of 15% rather than 34%) it would have spent about $8.2 billion. Therefore, as next year's forecast is for $9.15 billion and as I would also expect an over-spend of 18% or $10.8 billion total, adding the brought-forward $2 billion would imply sequential growth from $8.2 to $12.8 or 56%.

    This is in contrast to the indicated change of $9.5 billion (actual) to $9.15 billion (forecast), or decrease of 4%.

    So, recapping the CapEx story, the company over-spent far more in 2012 than anticipated. It did so late in the year. It did it while a supplier was in distress and another's supplier's efforts in rescue failed. Furthermore, it indicated a modest and thus uncharacteristic increase in the next year's CapEx budget. My take is that the trajectory of investment is not being altered dramatically but it's had an adjustment in timing, a kink in the line. The overall story remains that Apple is still injecting vast and growing amounts of capital into production and placing those assets on its own balance sheet.

    ---

    Notes:

    1. I track this spending through asset value changes in the balance sheet. That change in value excludes depreciation which turned to to be substantial in 2012: $2.44 billion.
    2. What follows is strictly hypothetical and based only on pieces of evidence that have become public hinting at an explanation but there is no proof.
  7. What is Apple's Realized P/E ratio?

    Research · 78 comments

    The Price/Earnings ratio is a very simple measure of the "value" a company has. The Price is the current share price and the Earnings is usually the sum of the last 12 months' earnings per share. In other words it measures how many of the last year's earnings are built into the share price. Put yet another way it's the answer to the question "If earnings don't change, how many years will I have to wait before I'm paid back for my share purchase with retained earnings."

    So a company with a P/E of 10 implies that if nothing changes, in 10 years a share owner would "earn" back the price they paid for the share. Any earnings after 10 years would be "profit" for the share owner. You can imagine it even more simply as buying not shares but an actual small business of your own. You pay up front for it and then wait until it pays you back. After getting paid back for the initial purchase you then make money that you can set aside.

    Obviously this figure of P/E is very sensitive to growth in earnings. Consider paying $100 for a share of a company having just earned $10/share last year. It would have a P/E of 10. If earnings stayed at $10/yr for 10 years, you'd "get your money back" in 10 years. However if earnings grow at 20% then next year the earnings would be $12 then 14.4 then 17.3 then 20.7 etc. Adding these up means you'd get your $100 back in five years, not 10.

    So with a company growing at 20% the "realized P/E" is 5. You realized the price of $100 in five years' worth of earnings. In the scenario above you paid expecting to wait 10 years but you got paid in five. If that's your retirement plan then you can retire five years early. Not bad.

    Let's then look at what Apple gave investors as "realized P/E."

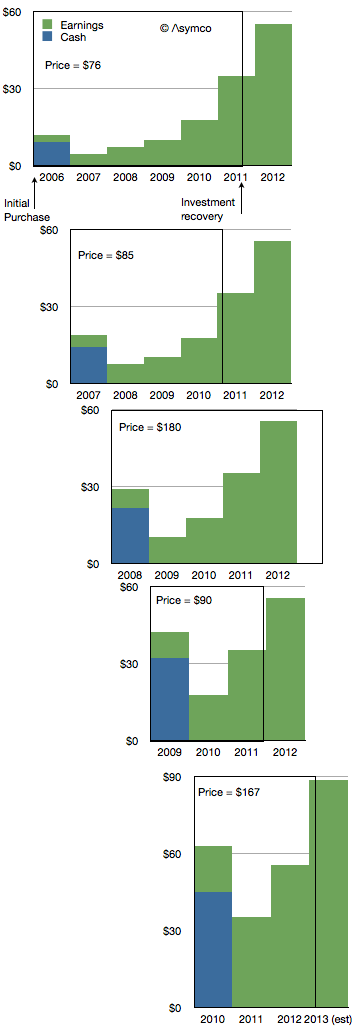
    If you bought shares in the first Friday of 2006 you would have paid $76.3/share. At the time the company had $9.36 in cash so you actually paid $66.94 for any future earnings. The P/E ratio at the time was around 35.

    The company went on to earn $2.78 in 2006. Another $4.63 in 2007,  $7.47 in 2008 and 10.24 in 2009 and 17.91 in 2010. Then in 2011 it earned $35.11.

    If you add these values up you realize that Apple reached your price about two thirds of the way into 2011. So the company earned your purchase price in 5.7 years. That becomes the realized P/E if you bought in early 2006. The following diagram shows the time period as a box encompassing the earnings (and cash) for a share purchase in early 2006.

    I repeated this for purchase in early 2007. The result is a Realized P/E of 4.9. I did it for 2008 as well[1] and got 5.4 then 2009 yielded an astonishing 2.9. 2010 was not much different with 3.2.

    Investing in Apple between 2006 to 2010 meant obtaining a payback period of less than 4.5 years, on average. In other words, regardless of what the trailing or forward P/Es getting quoted at the time (trailing is illustrated below), buyers actually paid for only about 4.5 years of earnings. In other words they actually bought Apple for a P/E of about 4.5.

    Using our small business analogy, buying Apple in the past few years has meant getting paid back in less than five years. That makes it a very low risk opportunity.

    I could try to repeat the process for years 2010 onward but it would require making forecasts beyond 2013, something I leave as an exercise to the reader.

    ---

    Notes:

    1. I had to make assumptions about full year 2012 and 2013 earnings. I used $55.4 earnings for full calendar year 2012 and 60% growth for 2013.
  8. Estimates for Apple's fourth fiscal 2012 quarter [Updated]

    Research · 74 comments

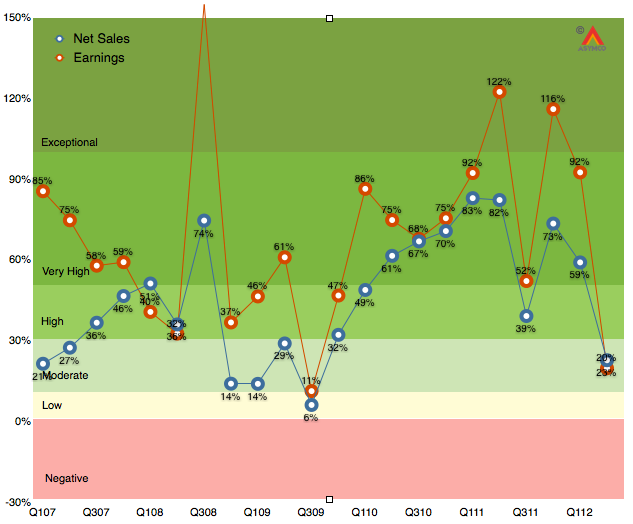
    As the chart below shows, the last quarter (second calendar 2012, third fiscal 2012) was disappointingly moderate with 20% earnings growth and 23% net sales growth.

    It was the first quarter since the iPhone launched that earnings growth has fallen into moderate (below 30%) territory. Much of that disappointment (to me) was the relatively low performance of the iPad following a launch quarter. The iPhone was weak as well, though that was expected.  As I said last quarter, the iPhone is still the most important component but the iPad is becoming increasingly decisive in overall performance. In fact, I’m projecting that the iPad will have the same revenues as the iPhone had one year earlier.

    The iPhone is going to be extremely difficult to project. On one hand we have the launch of the i5 which will account for about 10 million units in the quarter, on the other, chances are that sales were very weak prior to the launch as purchases were being deferred even more than during the last quarter.

    So with these very meager clues, here are my estimates for the quarter (with y/y growth in parentheses):

    • iPhone units: 27.8 million (62%)
    • Macs: 5.6 million (15%)
    • iPads: 18.8 million (69%)
    • iPods: 5.6 million (-15%)
    • Music (incl. app) rev. growth: 40%
    • Peripherals rev. growth: 10%
    • Software rev. growth: 15%
    • Total revenues: $39.5 billion (40%)
    • GM: 42%
    • EPS: $9.75 (38%)

    This earnings value would imply a trailing twelve months’ EPS of about $45.2. At the current price of $697/share the P/E would be 15.4. Cash and equivalents will probably increase to $125 billion or $131/share. Excluding cash, the P/E would be 12.5.

    [Update. The EPS figure above includes a tax rate estimate of 30%. Company guidance was 25.5%. Using the company's guidance yields an EPS of 10.43. TTM EPS becomes $45.9/share and at $697 the PE is 15.2. At time of this update the share price has fallen to $665 and thus the pro-forma trailing P/E ratio is 14.5).]

  9. Padcast: Reviewing Apple's Third Fiscal Quarter 2012

    Research · 59 comments

    Here is the second Perspective "padcast" where I discuss:

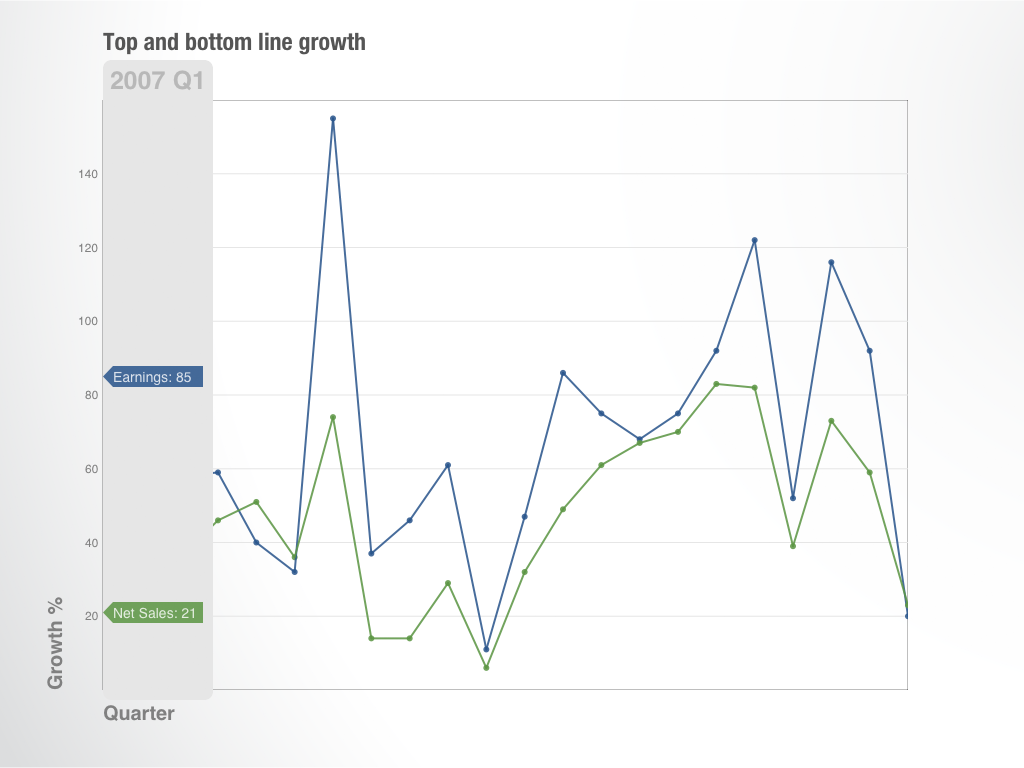
    1. Top and bottom line growth
    2. iPhone, iPad, iPod and Mac revenue growth
    3. iPad vs. Mac
    4. iOS product mix
    5. Other product line growth
    6. Gross Margins by product
    7. Pricing and revenue per unit by product
    8. Cash and cash growth
    9. Guidance and whether results were a surprise to management

    The discussion is an audio presentation with animated, interactive motion charts which can be manipulated by the user.

    It's available as an in-app purchase for $0.99 on the iTunes app store via the Perspective iPad app.

  10. From bad to worse and from good to great

    Research · 128 comments

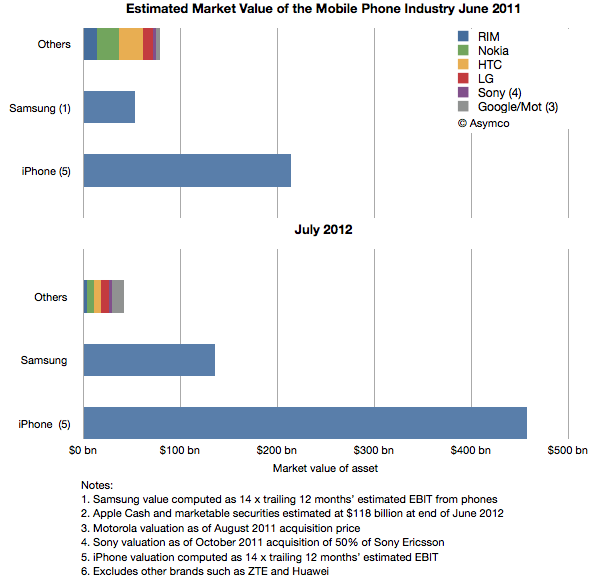
    A year ago I noted that Apple could buy most of the mobile phone industry with cash on hand (excluding Samsung's operations).

    Since then Apple's cash has grown significantly and the value of all phone vendors except Samsung has gone down significantly. The following chart shows the year ago and present day estimated market value of the industry participants.

    Phone brands other than Samsung and iPhone have seen a reduction in market value of a combined 47%. That's actually being quite generous since I'm valuing Motorola and Sony's businesses at their acquisition prices. The operations of both those companies have continued to stagnate.

    Based on the same multiple of estimated earnings Samsung grew its value by 157% and iPhone by 114% (note this excludes iPad).

    In absolute terms the iPhone franchise created $244 billion in value while Samsung created $83 billion. The others destroyed $37 billion.

    The good news is that the industry has had net value creation--always a healthy sign that innovation is being valued and absorbed.

    The bad news is that there is vast income inequality. The rich are getting richer and the poor are getting destitute. This is an unhealthy sign. The concentration of power and wealth may indicate a peaking of experimentation and discovery of new opportunities.

    Also noteworthy is that almost all the value from the Android ecosystem is concentrated in Samsung. I did not include Google in this analysis since its mobile is so small as to be not visible in its accounting. A separate analysis of Android economics shows that Google's benefit from the platform is modest. In contrast, Samsung, and Samsung alone, is benefitting greatly. It could even be said that today Samsung is the only Android profit engine.

  11. What will happen to Nokia?

    Research · 42 comments

    There is no shortage of information about what happens to companies in distress. The cause of distress varies widely and is often not well understood but the actions and symptoms of distress are very consistent. We can look at examples in each industry, even in each product category for a rich set of distressed company data.

    For over a year I've been chronicling the decline of incumbents in the mobile phone industry. However, decline cannot continue indefinitely. At some point a company "exits" the industry. Either through a sale or divestiture or, rarely bankruptcy. The list of exits is already long. The length and the correlation between exit and the lack of recovery implies that Nokia will also exit.

    But how, exactly?

    Will Nokia be acquired? If so, then by whom? What other options exist? How can we analyze this?

    The easiest way to guess is to look at what happened to other companies in similar circumstances. The clearest and easiest comparison to apply is Motorola. Motorola was at one time the largest phone vendor and it went through a violent decline. Like Nokia, it was diversified into networks and a few other businesses. Unlike Motorola it's not an American company. This matters because American companies are more comfortable targets for corporate raiders. The legal and boardroom mechanics are not "better" or "easier" in the US than in Europe but they are more familiar to those who might engage in it.

    So one avenue that Motorola traveled on was the intervention of activist investors who forced management change, affected strategy and pushed some tactical initiatives. This external pressure was successful in the case of Motorola. The company was split up, it was re-purposed and re-focused and, with a bit of good luck, was acquired.

    The process however still took two years. In that time the company languished but stayed alive. Its headcount was reduced by nearly two thirds. It was in a precarious situation throughout. Its story is not over but ownership did change hands and those who took a risk with it while in distress managed to get a reward.

    This example (and Sony's acquisition of Sony Ericsson and HP's acquisition of Palm) cannot apply to Nokia.  An activist investor is unlikely and the company has not yet made itself attractive to a buyer. So what would Nokia need to do to  be acquired?

    The first step toward an acquisition will be divestiture of its Nokia Siemens venture. The second will be a spinoff or sale of its non-smart phone division. The third might be the allocation of its IP across these separate entities or in a separate holding.

    As the company is broken up, value can be released. Investors will be able to value it better and make appropriate assessments of risk. Only at this point would an acquirer perhaps buy the "rump" Nokia smartphones group.

    However, even this scenario is not without huge risks. By the time the split is completed, the operating companies could have deteriorated to such a degree that they are no longer viable. Timing is critical.

    So if the smartphone group is isolated and made available, who could buy it? Microsoft is always cited as the primary buyer. I've been skeptical of this as Microsoft has found it difficult to make hardware work. It acquired Danger leading to Kin which failed. It has struggled with Xbox for a decade and has yet to recover all its costs for the effort. It has failed embarassingly with Zune. It also has shown no particular success with its original Surface table computer.

    But management has re-committed itself to a new hardware effort with the new Surface. This renewed potential opens up the possibility of entering into the integration of a phone again into their business, and Nokia would be remarkably well positioned to help.

    At this time, the possibility still seems remote. The company has dismissed speculation of building phones again and again. Unlike PCs, the phone platform is not yet mature and volumes and distribution are very different.

    However, there is one other option.

    Microsoft has historically "rescued" technology companies in distress with cash infusions for minority equity stakes. It injected some cash into Apple, Barnes & Noble and even Facebook. It did so not because they wanted to own these companies but because they wanted them to survive or thrive. The move acts as a signal to the industry, partners and developers. So what I see more likely than an acquisition is Microsoft capitalizing a spun-off Nokia Smartphones company in exchange for a small equity stake.

    The valuation of this stake will be huge as I expect billions of dollars for single digit share ownership. However, Microsoft would not be doing it to get a return from those shares. It would probably later sell them at a loss. But it would be buying a strategic option whose value may be far greater.