Asymco

Asymmetric Intelligence

cash

  1. The highway to hell

    Research · 57 comments

    A glance at Nokia and RIM's market values today shows that they are both valued below book. With respect to RIM,

    The company's share price has collapsed in the past year, and it is now only valued at about $5.4 billion, down from $84 billion at its peak in 2008. Excluding its cash and the estimated value of its patents, RIM's device business and its 78 million subscribers around the world are in aggregate worth less than $1 billion to investors.

    Analysis: RIM's new woes seen speeding loss of BlackBerry users - Yahoo! Finance

    With respect to Nokia,

    MKM: We are downgrading Nokia to Sell from Neutral following our U.S. retail Lumia model checks. We assume no value for the handset business and no value for the roughly four billion euros [about $5 billion] in net cash.

    Nokia Suffers From Hang-Ups - Barrons.com

    Three years ago the situation was dramatically different. RIM's share price was six times higher and Nokia's about four times higher. Here's what the market looked like in Q1 2010:
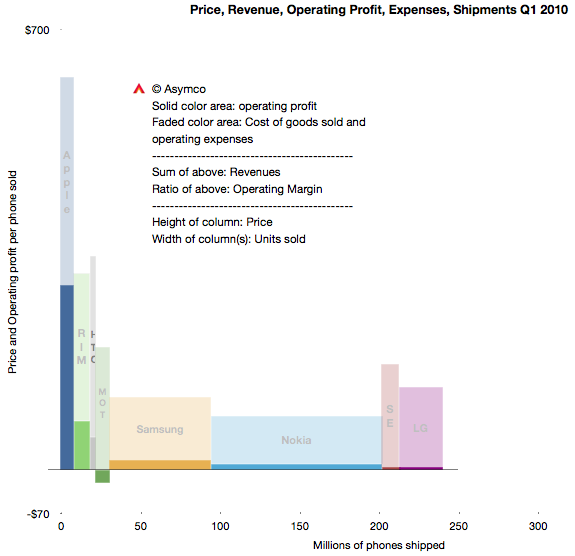
    This summary view shows individual competitors in the phone market as well as their combined total volumes. The profitability/volumes/pricing can be visualized as well as margins and revenues.

    The same visual summary is presented for the first quarters of 2011 and 2012 below:
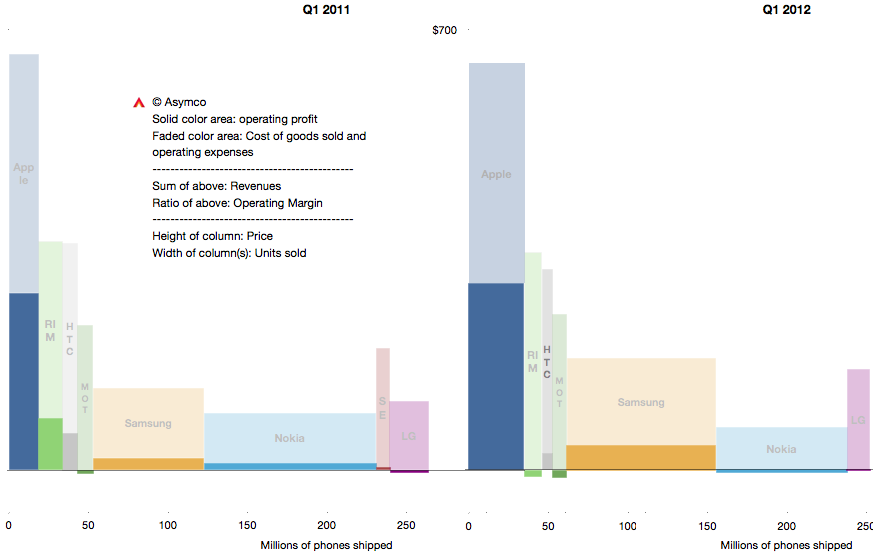
    The change may be subtle to the untrained eye, but it can be summarized as contraction for most vendors and expansion for Apple and Samsung. RIM and Nokia not only contracted in terms of revenues and volumes but also, crucially, lose money.

    I've written about this before (many times.) But it's important to repeat again that this is a very short time span. Only three years separate the top chart from the bottom right. The "shape" of the market participants has not changed much but a tipping point has been crossed. This is the point where some participants are disrupted enough that they cannot recover.

    Did it happen in 2010, 2011 or 2012? We're only looking at data which results from hundreds of decisions and thousands of actions. It's improbable that there was a single moment when the shift occurred or a single decision that caused it. But it's equally improbable that the disrupted could have countered any of the actions that got them to this point.

    The cause (and remedy) for disruption is never found in a single act. It's a process and a way of operating and thinking. Is management to blame? That's always the answer. But how did management go from being smart to foolish so quickly and why did all managers in a firm, even an industry, conspire to become foolish at the same time?

    If you study the decisions on a day-to-day basis, management consistently applies all the lessons they learned that led to success in the past. But these lessons lead to decisions that end up with exactly the worst result possible.

    The crux of this dilemma is that doing the "right thing" leads to the wrong result. In a comment I questioned the possibility of management in a public company solving the dilemma.

    Some have argued that public companies with professional managers entrusted with fiduciary responsibility are inherently incapable of solving the innovator's dilemma and are thus doomed to be disrupted. I'm starting to believe the argument. Whenever you as a manager try to work out the solution to the dilemma, you encounter a value destroying obstacle that cannot be surmounted while maintaining your position in the company. [As you attempt to solve it, you lose your position] Your successor won't make the same mistake and [thus] the whole enterprise collapses.

    There are counter-examples however. The reason Apple should be studied is that it gives hope that they have cracked this problem.
  2. Back to the balance sheet

    Research · 116 comments

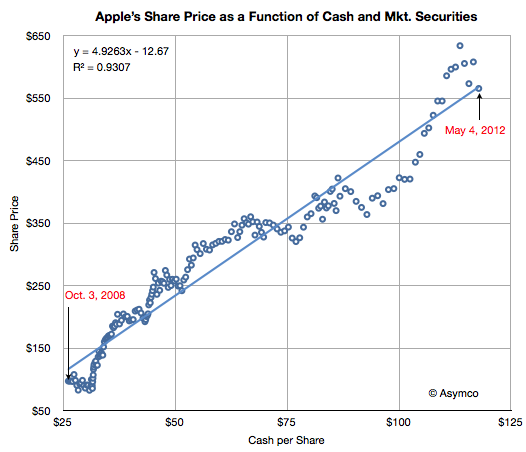
    I first noted a correlation between Apple's share price and its balance sheet a year ago. In February, when I last checked, Apple's share price was priced nearly at 4.6 times its cash value. The stock has had a brief rally but has returned to the trend line it's had since late 2008.

    I should emphasize that this correlation between cash and price is abnormal. It should not be happening. Share prices for growing companies should be tracking its future potential, not its assets. I'm only presenting this data to highlight this abnormality. There is no fundamental basis for this happening. In fact, there is a basis for this not happening.

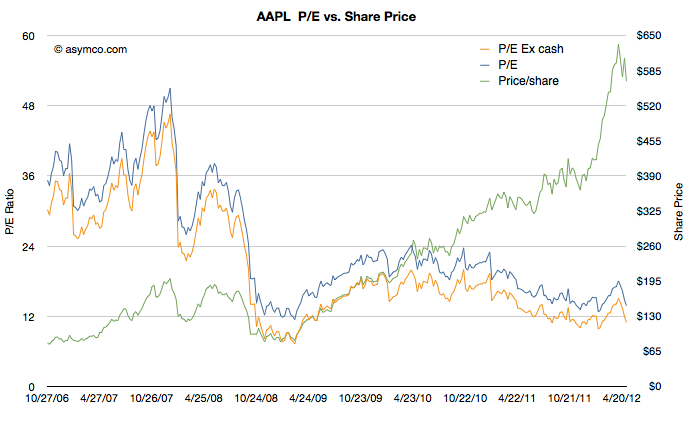
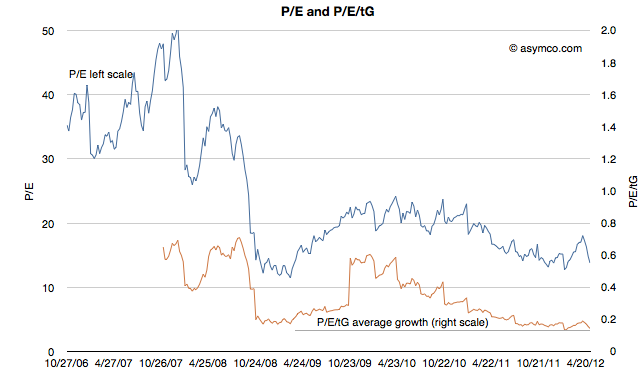
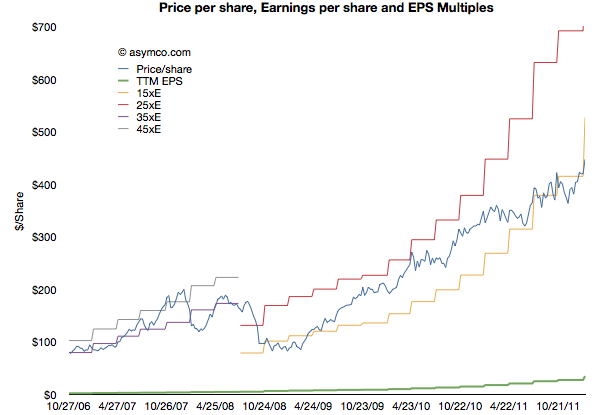
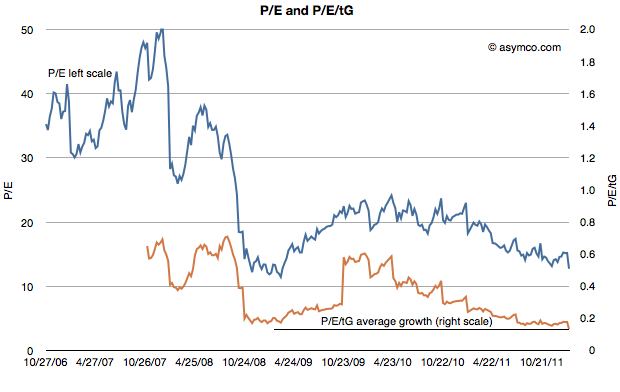
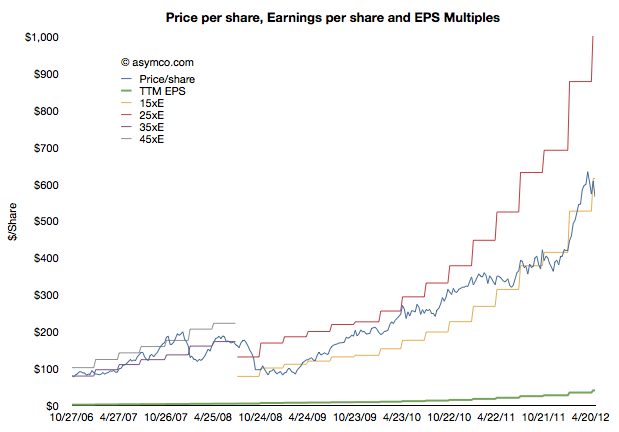
    The relationship above is a symptom of another pattern called multiple compression that can be seen in the following charts: 

    The last chart in particular shows how as a function of earnings and growth, Apple is priced near a low. Certainly lower than during the depths of the 2009 recession.

    Given this disconnect from the income statement, the pricing by balance sheet multiple seems to be a symptom of something deeper. Reasons vary with the seasons, but the company is not perceived to have sustainable growth.

  3. Did the dividend decision affect Apple's share price?

    Research · 23 comments

    One of the arguments made for the cause of the increase in Apple's share price of late has been that dividends would attract more institutional investors and provide more liquidity to Apple's shares. Can we test this argument?

    We're not dealing with speculation. The decision to start paying dividends was made three weeks ago. It makes sense to assume that this new information has been absorbed by the  markets and market participants have adjusted their positions. Funds that were previously restricted in their investment in Apple due to its lack of dividend policy, could now go ahead.

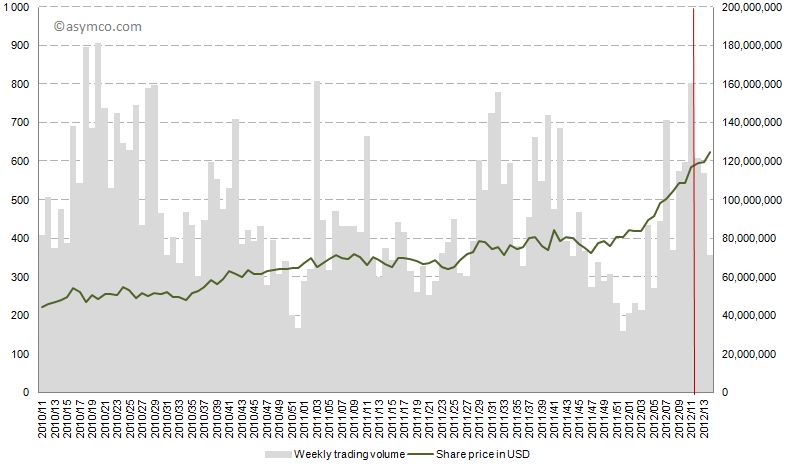
    However, as the following chart shows, the share price climbed continuously before and after the dividend declaration of March 19th (shown in red). Trading patterns did not show unusual highs or lows. In fact, after March 19th the trading volume decreased on a weekly basis.

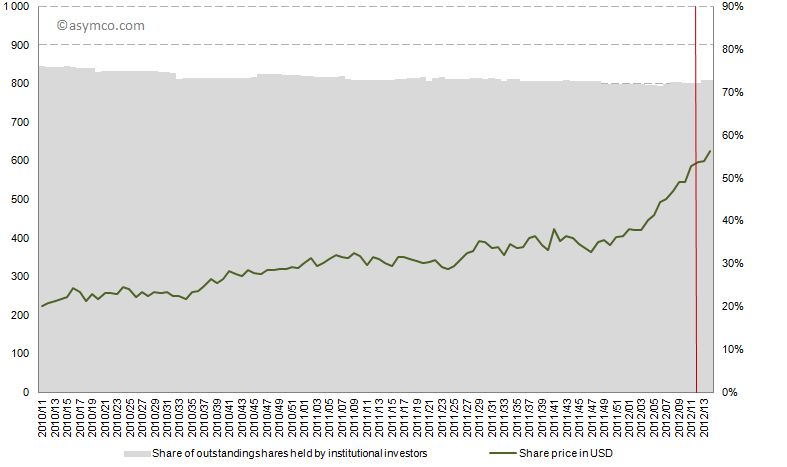
    The other indicator is institutional holdings. The share of institutional investors as percentage of all outstanding shares did not increase significantly, and has been in an overall decline since late 2010.

    But this lack of visible response to the decision should not be surprising.

    Dividends are a tool to adjust capital structure based on optimal investment decisions. Dividends do not add value. The value of a company reflects the perceived net present value of all free, future cash flows. Whether the cash is in or out of the company is immaterial to its value. In either case the cash belongs to shareholders.

    What the market is reflecting is fundamentals, not any change in liquidity due to "more buyers" available. For a long time the fundamentals were not accepted as sustainable. The best explanation for the rise in the share price is therefore that the company's future is now becoming clearer and a cloud of doubt is being lifted.

  4. Take the money and run

    Research · 26 comments

    In August 2007, during the HD format wars between HD-DVD and Blu-ray format, Toshiba offered Paramount and Dreamworks $150 million to produce HD versions of their movies exclusively as HD-DVD.[1]

    This type of deal is equivalent to an "advance" offered to a book author. The DVD manufacturer pays studios up-front cash for the right to make its DVDs. From an accounting point of view this is treated as an advance that the manufacturer recovers by selling the DVDs back to the studio's video division in the same way a publisher earns back the advance it gives an author.

    In this case, the payment was so large and the sales of HD-DVDs so small that Toshiba was unlikely to earn back the entire advance. The way the deal made any sense for Toshiba was that it was exclusive: the studios could not continue to release their movies in Blu-ray. The deal was done explicitly to hobble a competitor and create "critical mass" of content for its own format.

    But then in March 2008, Toshiba threw in the towel and abandoned the HD-DVD format. The way the deal worked, the studios got to keep almost all of the $150 million. They then re-released all their movies in the Blu-ray format. The only "cost" to the $150 million windfall was that there was a nine month delay in the eventual release to Blu-ray--a small price to pay for an emergent format without a large install base.[2]

    Platform owners go to great lengths to ensure "content" for their platform. They will, essentially, finance an ecosystem when there are barriers to entry or when competing ecosystems are far more lucrative.

    This scenario for movies is being played again with Netflix, Hulu and other distributors who need to fill their pipelines. Netflix's content acquisition costs are exploding and putting the whole company's future in doubt.

    But this scenario is also being played out with app developers. Most recently, news broke that developers are receiving payments from Microsoft for Windows Phone ports of popular apps. In mobile platforms, apps are the new content and developers are the new studios.  It's also a practice that is not without precedent[3].

    This is as it should be. The value of the platform lies mainly in what is built on top of it just like a foundation is not much use without a house on it. However, the practice of "priming the pump" with cash payments for porting is not ideal. Like spiffs, those who receive payments may become used to it and withhold development if there is no payment. Also, those who did not get payment offers may feel shunned and retaliate in kind. Those who receive payment may become cynical about it and may not put in the extra effort (or, more probably, outsource) to make the work spectacular.

    Or, like Paramount, they may just take the money and run if/when the platform fails.

    ---

    Notes:

    1. Source: The Hollywood Economist 2.0: The Hidden Financial Reality Behind the Movies by Edward Jay Epstein.
    2. Paramount made $250 million more from three "replication output" deals: $50 million from Toshiba for agreeing to release Titanic on DVD in time for Christmas sales, $150 million from Panasonic for agreeing to allow them to take over video replication from Thompson, and $50 million from the law firm Ziffrin, Brittenham and Circuit City stores for agreeing to support the DIVX format. Paramount got to keep the money even though DIVX never launched.
    3. Although it's never been reported that Apple pays developers for building iOS apps, some developers do benefit from promotional placement and visibility during launch events and from early access to devices or SDKs under development.
  5. The role of capital [1]

    Research · 19 comments

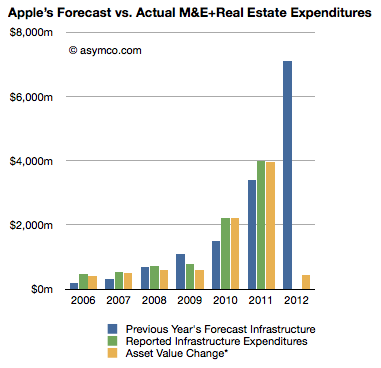
    At the end of 2011 Apple's net property, plant and equipment (PP&E) was $7.8 billion. This reflects $12.34 billion gross PP&E net accumulated depreciation and amortization of $4.5 billion. The depreciation and amortization increased by a total of $533 million and the gross PP&E increased by only $572 million. I say "only" because in the previous quarter PP&E increased by $1.42 billion. If we assume that this growth is equivalent to capital expenditures for the quarter, it's also a very small amount given the company's stated intentions to spend $7.1 billion during the fiscal year.

    The gap is illustrated in the following chart:

    The blue bar in the 2012 year represents the company's stated intentions (from the 10K). The Yellow bar in 2012 is what has been spent so far as measured by the change in reported asset values. Given that the company has been exceeding their targets lately, one should expect the yellow bar to reach as high as $8 billion after another three quarters.

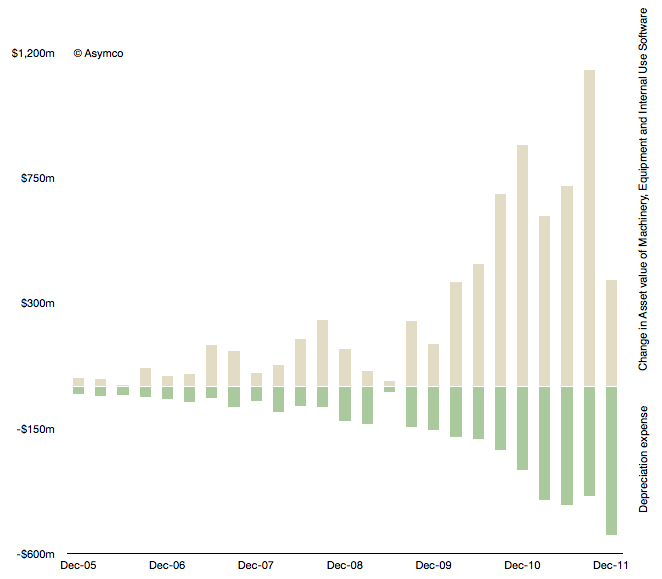
    Another view into this data is provided by the following chart.

    The beige bars represent the quarterly change in asset value and the green bars are the depreciation expenses for the same quarter. This view also shows a significant slowing in spending.

    In the past I showed that CapEx, especially spending on machinery, equipment and internal-use software correlates with iOS device production during the next quarter. It's not a relationship that helps much in quarterly predictions due to the elastic nature of product transitions. There were quarters when spending and output were de-coupled, for example spending in March and June 09 quarters was far lower than one would expect for the 3GS launch quarters that followed.

    We will have to keep an eye on the change in asset value to be reported for CQ1 to see how the spending ramps up during the year. At this time the company needs to spend at least $6.5 billion in three quarters or over $2 billion per quarter to meet its target for the fiscal year (ending October this year). We have to see whether and why Q1 (fiscal) was too low.

    This discussion is also affected by the discussion on Apple's other balance sheet item: cash and cash equivalents. The magnitude of its assets is staggering: $100 billion in cash, $7.8 billion in PP&E, $3.47 billion in acquired intangible assets (mainly patents), and $896 in Goodwill (acquisitions). With this much "capital" the company does not make use of any debt facilities.

    In this regard Apple is also an apparent anomaly. As it gets subtracted out of indexes because it weighs too much or skews "reality" so Apple and its balance sheet is causing a warp in "time-space" of capital markets. The traditional relationship between financiers and operating companies assumed some form of symbiosis but as the credit crisis has shown some have not kept their part of the implied bargain.

    So we have to ask yet another unsettling question: what is the value of capital markets when their products are commoditized by relatively unsophisticated CFOs?

    ---

    Notes:

    1. This is the material accompanying the third case discussion at Asymconf. Participants are encouraged to read it at the material linked before the show.
  6. Tim Cook's latest promise to Apple's employees

    Research · 46 comments

    In the recent event discussing Apple's cash plans, Tim Cook stated that the primary objective of the stock repurchase program is to reduce dilution from the ongoing distribution of shares to Apple's employees and executives as part of their future compensation.

    The amount allocated to this is $10 billion over a three year period.

    This sets up an interesting analysis. The company is saying that they will continue to pay employees with newly issued shares (in addition to wages) but that a portion of those shares will be purchased back from the market to reduce dilution.

    To understand the impact, it would make sense to look back and observe how many shares were issued in this way historically and consider how much $10 billion buys.

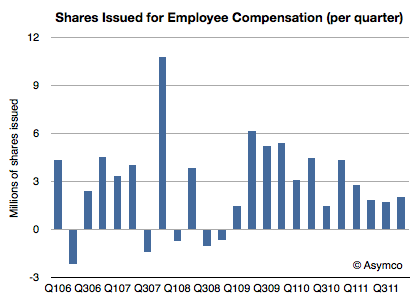
    The following chart shows the quarterly change in shares outstanding.

    The absolute number of shares outstanding grew from 874.2 million in Q4 2005 to 941.6 million last quarter. That's a net increase of 67 million shares over a six year period. The rate of growth has been accelerating. Over the last three years  40 million shares were issued.

    These issuances have an effect for shareholders. They "dilute" the total shares outstanding and thus spread the earnings more thinly. You can get an instant feel for this as the EPS figure must be re-computed each quarter with a different denominator. This is a real cost.

    Here is how to compute it. Last quarter there were two million shares issued at a "cost" of about $400/share. That means that shareholders lost the equivalent of $800 million (2 million x $400/share average price in Q4) of value.

    Now what Apple has just promised is that they would buy back the equivalent of $833 million per quarter ($10 billion/(3 years x 4 quarters/yr)) for the next three years. Note how close this figure is to the one calculated above.

    What we can also obtain is a ratio between stock-based compensation and wage-based compensation. Since we can estimate the total Apple employee wages at $3.2 billion per quarter (average R&D and SG&A over the last year), the stock compensation of $800 million amounts to a 25% bonus.

    In other words, on average an employee is likely to get compensation of $X in wages and 0.25X in stock grants.

    Therefore Apple's $10 billion dollar pledge is not only a commitment to shareholders that the dilution will be eliminated. It's also a signal to employees: for at least three years, Apple will continue to offer shares as compensation and will do so in a ratio of 1:4 of wages.

    This seems like a good use of cash.

  7. Apple's dividend and share re-purchase plan: the impact on cash growth

    Research · 134 comments

    Today Apple announced both a dividend and a share re-purchase plan which, when combined, will consume 45% of Apple's current US cash reserves.

    The dividend will be $2.65/share/quarter and the buyback will cost $10 billion over three years. The dividend will therefore cost about $2.5 billion per quarter (starting next quarter) and the re-purchase will cost about $833 million per quarter (starting next fiscal year).

    However, note that Apple's cash has been growing far more quickly. It increased by $16 billion last quarter or $37 billion over the last year. This rate of increase is itself increasing.

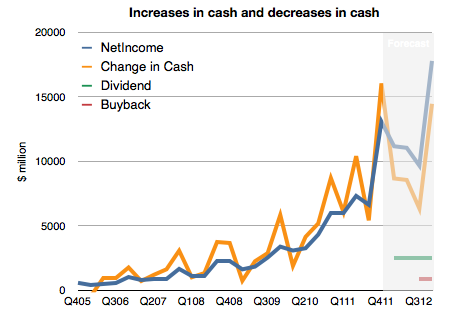
    To illustrate, I prepared the following chart. It shows historic net income, change in cash and a forecast of the costs of the new uses of cash and future net income (based on my estimates).

    I made an assumption that future cash growth will equal net earnings minus costs for the new dividend and share re-purchase. What we should see is that the previously tight coupling between increase in cash and earnings will remain but that there will be a negative offset by $3.333 billion each quarter. In other words, cash will increase but at a slower rate.

    This means Apple's total cash should still grow by more than $35 billion this year.

    That would result in the following, more subdued, total cash trajectory (for simplicity, I assumed all added cash would be in cash and cash equivalent accounts)

  8. [Updated] Following up: When will Apple's share price reach $500

    Research · 71 comments

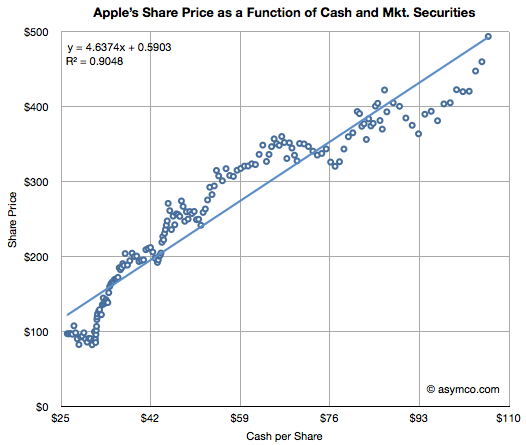
    Apple's valuation since October 2008 has been very highly correlated to its cash (R-squared of 0.91). This tight relationship to Apple's value is shown in the chart below:

    (The chart shows weekly, ending each Friday, share price (vertical axis) vs. interpolated weekly cash per share (horizontal axis) assuming linear growth between quarterly announcements. Share price data is current as of last Friday (Feb. 10) though cash per share is based on announcement date and hence delayed by about three weeks.)

    I noted this relationship in May 2011 and followed up in September 2011.  With current cash per share reaching $95 to $100 $103.66 it seems that the share price should be around $500 any time now.

  9. Pricing Paradox

    Research · 148 comments

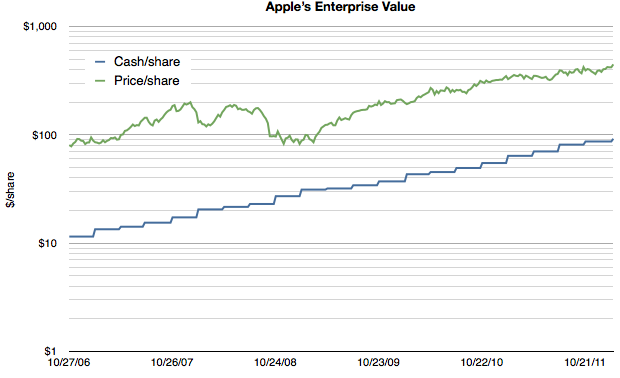
    As Apple's extraordinarily low valuation is being more widely noted, explanatory hypotheses are proliferating. Everyone seems to have an opinion. Some explanations come in and out of fashion. Others are reliable old clichés. We've seen liquidity issues with large funds forced to sell, "too much cash", management transitions, an impending loss of mojo, share price too high to afford, "law of large numbers", and that old chestnut, competition. None of these satisfy. They don't explain why reliable growth is not valuable. And reliability is indeed what Apple offers in spades. Consider the following chart:

    Note that the scale is logarithmic so that the growth patterns can be seen clearly.

    It shows Apple's cash/share vs its price per share. First, it should be noted that the company's cash has been growing reliably on a log scale, increasing by a factor of 10 in five years. As a proxy for retained earnings, the cash trajectory shows exceptionally predictable earnings.

    Second, although the share price has grown it has not grown either as reliably or as quickly. It's as if the reward for reliable earnings is a significant dissent.

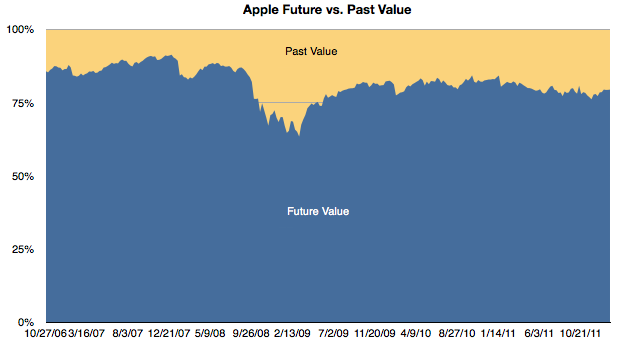
    Third, if we subtract the cash/share from the price/share we obtain the enterprise value (EV) per share. The EV reflects the future value built into the price. It reflects the expectation of more earnings. In the chart above one can see the shrinking of the gap as a multiple of the cash value. To bring that gap into focus, I prepared this chart showing the percent of the share price allocated to past value (cash) and future value (EV).

    One can see the gradual erosion of emphasis of future value. With the exception of the credit crisis induced equities crash, future value as a percent of total value is at a new low. In late 2006 the future was was about 86% of the share price. At the end of last week it had dropped to 79%.

    Another way to interpret this is that in 2007 when the iPhone was born nearly 90% of the business value was thought to be in its future. Today only 80% is future value.

    To clarify further, if a company reaches a price where 100% of its value is cash then it's seen as having no future value. Having any significant portion of the price attached to the past is extremely rare for a growing company and I would say unheard of in a company growing as rapidly as Apple is.

    This preoccupation with the past and discomfort with the future is, I believe, the key to understanding the valuation paradox for Apple. I have gone over the conventional metrics of P/E and P/E/G(trailing) that illustrate absurd pricing (updated below). But they don't help explain the mis-pricing.

    A disruptive company is inherently unpredictable. Success and growth are unrewarded because there no understanding of the underlying causes of these phenomena and therefore there is no expectation of repetition.

    In other words, a five year dead-straight line of logarithmic growth is not a sign of anything resembling reliability if the underlying causes are not understood. Today Apple is still a mystery wrapped in an enigma and without a causal understanding of its suceess its pricing will remain paradoxical.

  10. Apple added $38 billion in cash last year

    Research · 107 comments

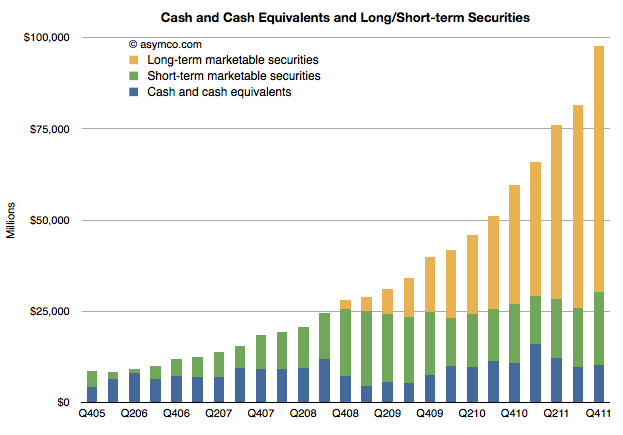
    Last year I suggested that Apple could reach $100 billion for 2011. That was based on the addition of about $20 billion during 2010. Apple added $38 billion to reach $97.6 billion at the end of 2011.

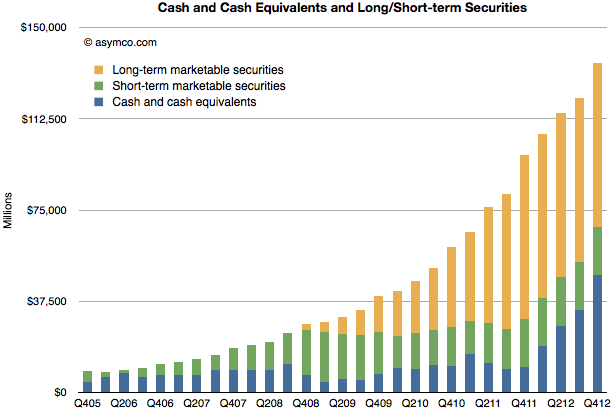
    The following chart shows the composition and scale of Apple's cash holdings.

    At the closing price, Apple's market value is equivalent to 4.3 times the value of their cash.

  11. Apple's commoditization discount

    Research · 81 comments

    When asked where Apple's growth will come from, most analysts or observers will cite new products. As long as there are new products, then there is growth. Conversely, if there are no new products, then there will be no growth. This is such a commonly held belief that it's axiomatic: Apple is being valued based on short-term foreseeable growth.

    To be more precise, analysts value the wave of growth of every new product and heavily discount the post-growth phase assuming commoditization. There is no value assigned to Apple for extending market reach to the mass market.

    Consider: Analysts currently forecast an operating income (or EBIT) of $43.3bn for 2012 and $49.7bn for 2013. That implies growth of 28% in 2012 and 15% in 2013. These growth rates are modest in light of Apple's recent historic growth and especially 84% in 2011 on EBIT level. Much of this growth has been due to iPhone which quickly captured 4% market share in four years. To suggest 15% growth in 2013 is to suggest that Apple will not increase its phone market share by an appreciable amount. The implicit assumption in that growth figure alone is that Apple will remain a niche player.

    Bear in mind that 15% growth is so low as to be half the the growth in the Mac business and below the likely growth in the overall phone market. Considering the risk premium on equities, this growth forecast assumes essentially a no growth scenario. But even with no growth, Apple's cash flows are huge and thus they should add up to some significant present value. Since we know the value as reflected in the current price, we can work backwards to determine the discount rate being applied to those future flows. In other words, we can calculate how risky Apple's existing product cash flows are seen to be.

    Based on  assumptions originating from analysts' consensus, we can construct a simple model that will approximate the discount the stock market puts on Apple's future cash flows. Let's have a look at an adjusted Gordon or dividend discount valuation model on EBIT basis:

    Shares are valued based on the projected future cash flows of a company. Discounting EBIT with Weighted Average Cost of Capital and subtracting growth will yield enterprise value (= market capitalization - cash).

    Applying analysts’ assumption of close to zero growth to Apple's post 2012 EBIT means EBIT stays constant for 2013 and beyond. Let’s solve for the implied capital costs. Right away we can eliminate growth (g) as it equals zero. EBIT reflects operating cash flow since in a zero growth scenario CapEx will equal deprecation and there are no changes in net working capital. As Apple has no debt but a cash surplus, WACC will be equal to cost of equity[1].

    Solving for capital cost (WACC) with available analysts' EBIT estimates reveals a discount rate of 15%.

    But let’s remember that analysts have consistently and by a large margin missed Apple's financial performance. So let’s dial in a more aggressive estimate of around $56bn of EBIT for the fiscal year 2012. The discount rate goes up to 19% and implies an EBIT multiple of 5.3x.

    In other words, Apple's cash flows for a zero growth scenario are being discounted at a rate of 15% to 19%. This places the company in an extremely risky category of investment. It is certainly not something that can be categorized as a value stock.

    The discussions on this blog regarding Apple’s valuation have been insightful, but only danced around the triangle of price, earnings and growth. When the growth forecasts are considered vis-a-vis current pricing, the assumptions built into 'consensus' forecasts for Apple are condemnations of the company.

    They present a view of a company that is extremely vulnerable and can neither preserve its current cash flows nor find new sources of growth. It is, quite plainly, a company doomed to commoditization.

    ---

    Notes:

    1. Or one can even assume that cash has a positive effect lowering costs of equity (less indirect bankruptcy costs).