Asymco

Asymmetric Intelligence

comScore

  1. Winning Against Non-consumption

    Research · 17 comments

    In the fourth quarter of 2013, mobile phone sales in mature regions fell due to weaker demand."Mature markets face limited growth potentialis the markets are saturated with smartphone sales, leaving little room for growth with declining feature phone market and a longer replacement cycle," said Anshul Gupta, principal research analyst at Gartner. "Lack of compelling hardware innovation has further exacerbated replacement cycles for high-end smartphones in 2013 because consumers don't find enough reasons to upgrade." - Gartner

    Anshul Gupta's assertion of market saturation was not the first. IDC also cited "a number of mature markets nearing smartphone saturation" in late 2013.

    Shortchanging the smartphone market is nothing new. It was happening very early in the market's formation when initial growth was not as rapid as expected. I recall Nokia managers disappointed with sales growth losing faith in smartphones in 2004.  Eleven years later, the market is still growing.

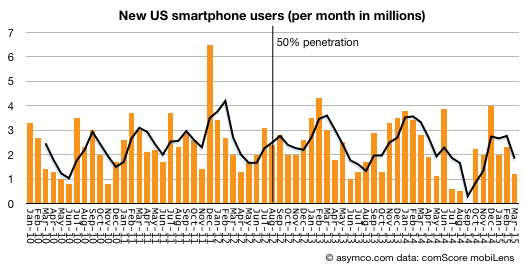
    comScore reported that during the first quarter of 2015 the US market was adding over two million new smartphone users every month. These are not two million units sold every month but two million new users who began using smartphones for the first time ever, every month.
    Screen Shot 2015-05-11 at 5-11-2.33.07 PM


    Since the end of 2013 when both IDC and Gartner declared the onset of saturation in "mature regions" ((The US is the most mature by penetration data)) 31.5 million new-to-smartphones Americans adopted the product. That's an addition of 11% of the sampled market.

    And the sampled market is just a subset of the addressable market. comScore only counts 'primary phones' in use and excludes company-purchased devices and any users below age 13.

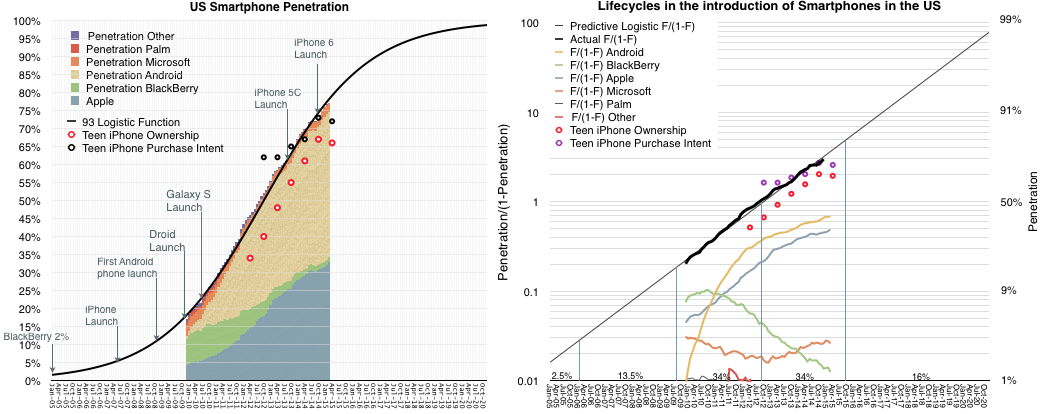
    So according to comScore's data, the US market is at 77% smartphone usage. My assumption is that saturation would come at the earliest at 90% and could be 100%. ((Of the market comScore measures)) The fact that conversion to smartphones is still proceeding at roughly the same rate it has been for five years, makes this assumption pretty safe.

    The pattern of growth fits a diffusion S curve (Logistic curve) as closely as ever: 
    Screen Shot 2015-05-11 at 5-11-2.45.29 PM

    Note that the curve continues to rise even into 2020, and that this is the US only.

    The US is the most highly penetrated market but it's not the biggest. That would be China. So it's not surprising that two years after declaring US growth was over, IDC claims "China's smartphone market has reached saturation".

    Chinese penetration is far below the US. It was estimated at 43% by the end of 2014. If we assume Chinese users are no less hungry for information than US consumers, then why should Chinese stop adopting the technology at less than half of US levels of use?

    That would be risky.

    This understanding of the maximum potential of a market — its highest level of user adoption — is crucial for product development. Paying attention to short term sales trends blinds you to the power of the job your product is hired to do. Your product's purpose is not to be sold, but to be hired. If your product is powerful enough, it can be hired for universal jobs and it should be desired by all consumers, not just the fickle.

    Being patient for growth means that you can release features when the majority of users can absorb them, not just when early adopters choose to play with them. Often, early adopters offer feedback which is off-putting to later, mainstream adopters. In engineering and design one has to always make compromises. The right balance at the right time avoids overshooting a market or under-performing against competitors.

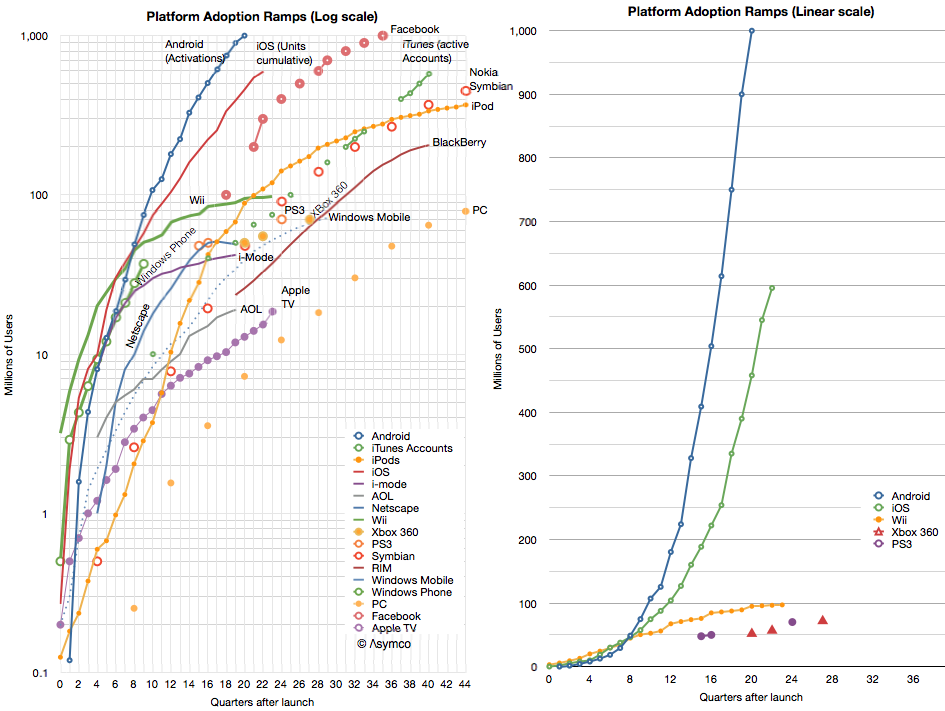
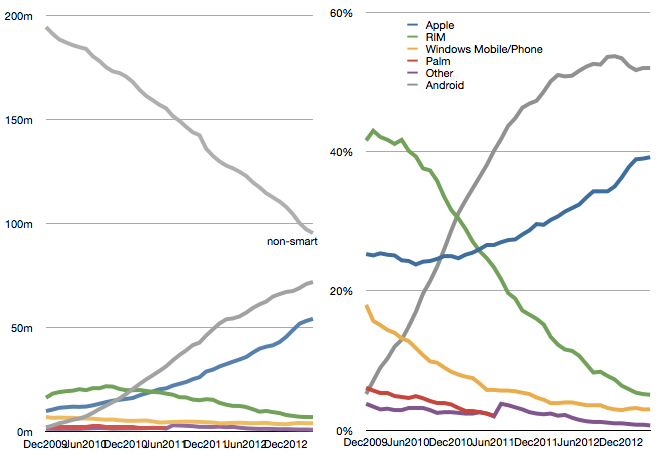
    There are plenty of examples of getting it wrong (see the graph on the right above).

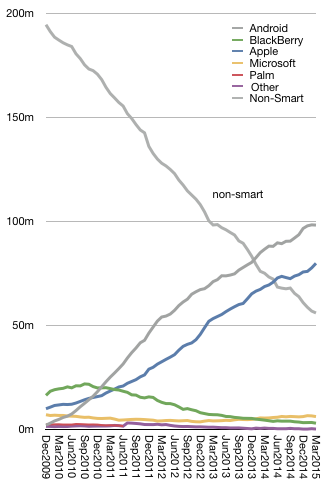
    At this stage in the US market, the iPhone has more than 80 million (sampled) users.  Android has about 100 million. It's still a growing market so apart from BlackBerry, ((Three million BlackBerry users in the US remain.)) the churn between the smartphone platforms is still minimal. The two main platforms are still harvesting non-consumers.
    Screen Shot 2015-05-11 at 5-11-3.18.07 PM

    This will change of course. And when it does, the competition will shift from winning against non-consumption to winning against other-consumption or over-consumption. That post-saturation competition will be decided by brand loyalty as much as anything else.

    ---

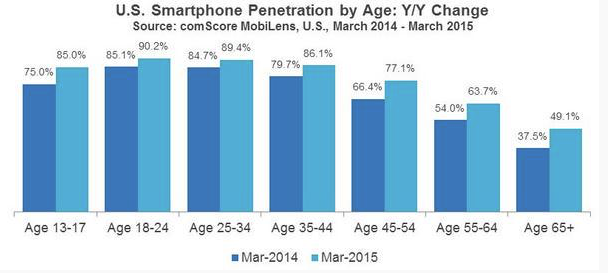
    Update: comScore just published US Smartphone penetration by Age which offers some clues where smartphone hiring is still going on.  (Note: <13 ages are not shown).
    Screen Shot 2015-05-11 at 5-11-4.18.27 PM
  2. How close to saturation is the smartphone?

    Research · 6 comments

    The US is not the market where penetration is highest. However, it is the largest market where we have reliable penetration data (from at least two sources) and the one where penetration is near the top of the range.

    The graph showing the US ranked against others as of a year ago is here. The US was cited at 56.4% at the time. I keep track of comScore's data and it showed 58.2% at the end of March and 55.3% at the end of January, making the figure very believable.

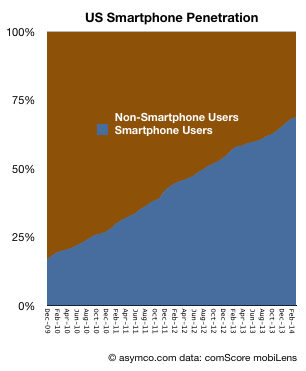
    The most recent data from comScore shows penetration at 68.8%. In order to understand what the limits of that growth could be it's important to see the longer-term pattern. It would show whether there is a clear point of inflection and thus a predictable "saturation" around an asymptotic value.

    The following graph shows the percentage of smartphone users/non-users since late 2009.

    Screen Shot 2014-05-08 at 5-8-6.13.29 PM

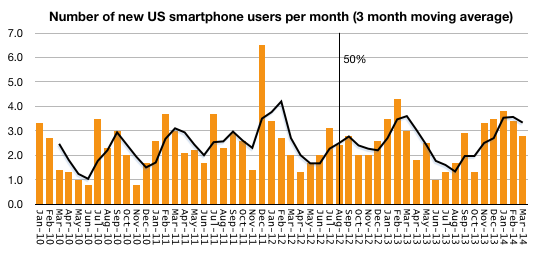
    The following graph shows the rate at which users are being added to the smartphone ranks (measured as new users per month.)

    Screen Shot 2014-05-08 at 5-8-6.14.01 PM


    To summarize, the conversion of users from non-smart to smartphone usage is fairly constant. The March '14 period saw 2.8 million new-to-smartphone users. the March '13 period saw 3.0 million, the March '12 period saw 2.0 million and March '11 saw 3.0 million. There is no discernible slowing of adoption.

    Note that I added a trailing three period average in new users which fluctuates somewhat predictably due to seasonality. Finally, note that the figure of 50% penetration was reached almost two years ago and no noticeable change of adoption has happened since. Cellular phone ownership in the US is still rising (though very slowly) and it now about 90%.

    The only conclusion is that even at the current 68.8% penetration, we are not anywhere near "saturation" of smartphone users in the US, and the US is a leader among "developed markets" so there is little to suggest that saturation has happened anywhere with significant populations.

  3. Inventive Teens

    Research · 23 comments

    Philip Elmer-DeWitt cited Piper Jaffray's latest Teen Survey on Device Ownership where ~7,500 teens in the US are asked about their device ownership. This type of data is similar to the method comScore uses to measure penetration smartphones in the US making the two data sets comparable.

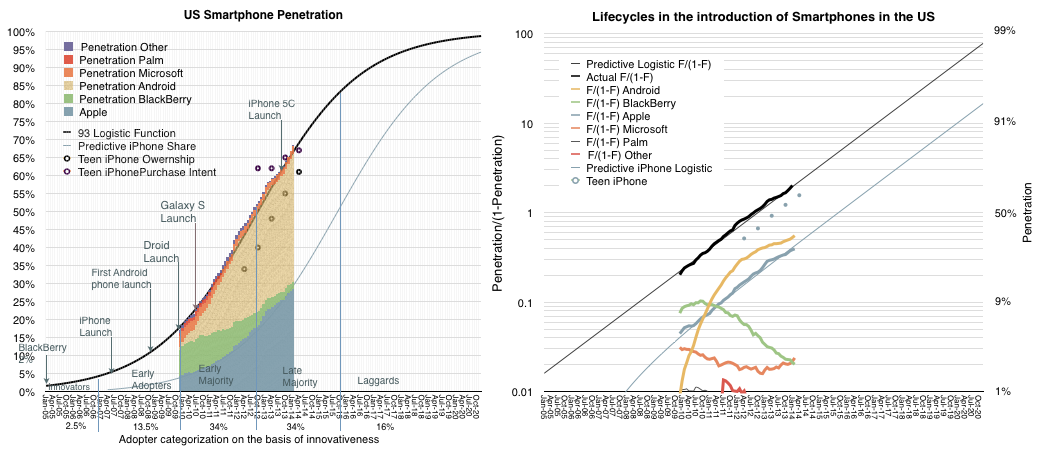
    The combined data is shown the following graphs.

    Screen Shot 2014-04-10 at 4-10-3.07.04 PM

    One graph is the penetration data and the other is the ratio of penetration to unpenetrated on a log scale. The PJC Teen Survey data is shown as dots on both graphs. In the spring of 2012 the difference between teen iPhone ownership and overall population iPhone ownership was 20 percentage points. In the fall 2012 it was 22 points. In spring 2013 it was 25 points. The spread increased to 30 points in the fall of 2013.

    This implies that the latest sample (April 2014) should have at least a 31 point lead on what comScore will report in another two months. ((comScore reports data during the first week of a month for a period ending one month earlier. So the April release covers a sampling period ending February)) In other words current iPhone penetration in the US is probably 30%. This assumes of course that the relationship between teens and overall population has not changed. But there is consistency in the pattern of iPhone growth for over 50 months.

    In addition, the purchase intent data is showing that there is growing interest and that interest reflects demand which has been largely met by a purchase decision.

    Teens are leading adoption in this particular sector because the device is very well suited to the jobs that they need to do, mainly social interaction. It's no coincidence that the audiences for the fastest-rising services (SnapChat, WhatsApp, Vine, YouTube, Instagram) consist mainly of teens. They also lead adoption in FaceBook, iTunes, MySpace, etc. In that regard teens are an early indicator of mainstream behavior.

    Teens taught the world new habits throughout the 20th century ((An entertaining review of the contribution (and invention) of teenagers in the 20th century can be enjoyed in James May's 20th Century Episode 5)) and they certainly seem to be teaching us in the present.

  4. When will the European Union Five reach smartphone saturation?

    Research · 46 comments

    Thanks to Symbian, the EU5 countries (France, Germany, Italy, Spain and the UK) had an earlier start in the conversion of phone usage from non-smart to smart devices. According to published comScore data, in July 2010 the EU5 were at 26.6% penetration of smartphones and the US was at 22.8% ((The population is defined as adults using phones for themselves. Meaning it excludes children and phones purchased by companies.)).

    However, with the aid of mobile operator subsidies, by the beginning of this year, the US caught up. According to comScore EU5 reached 57% penetration in March 2013 while the equivalent figure for the US was 58%.

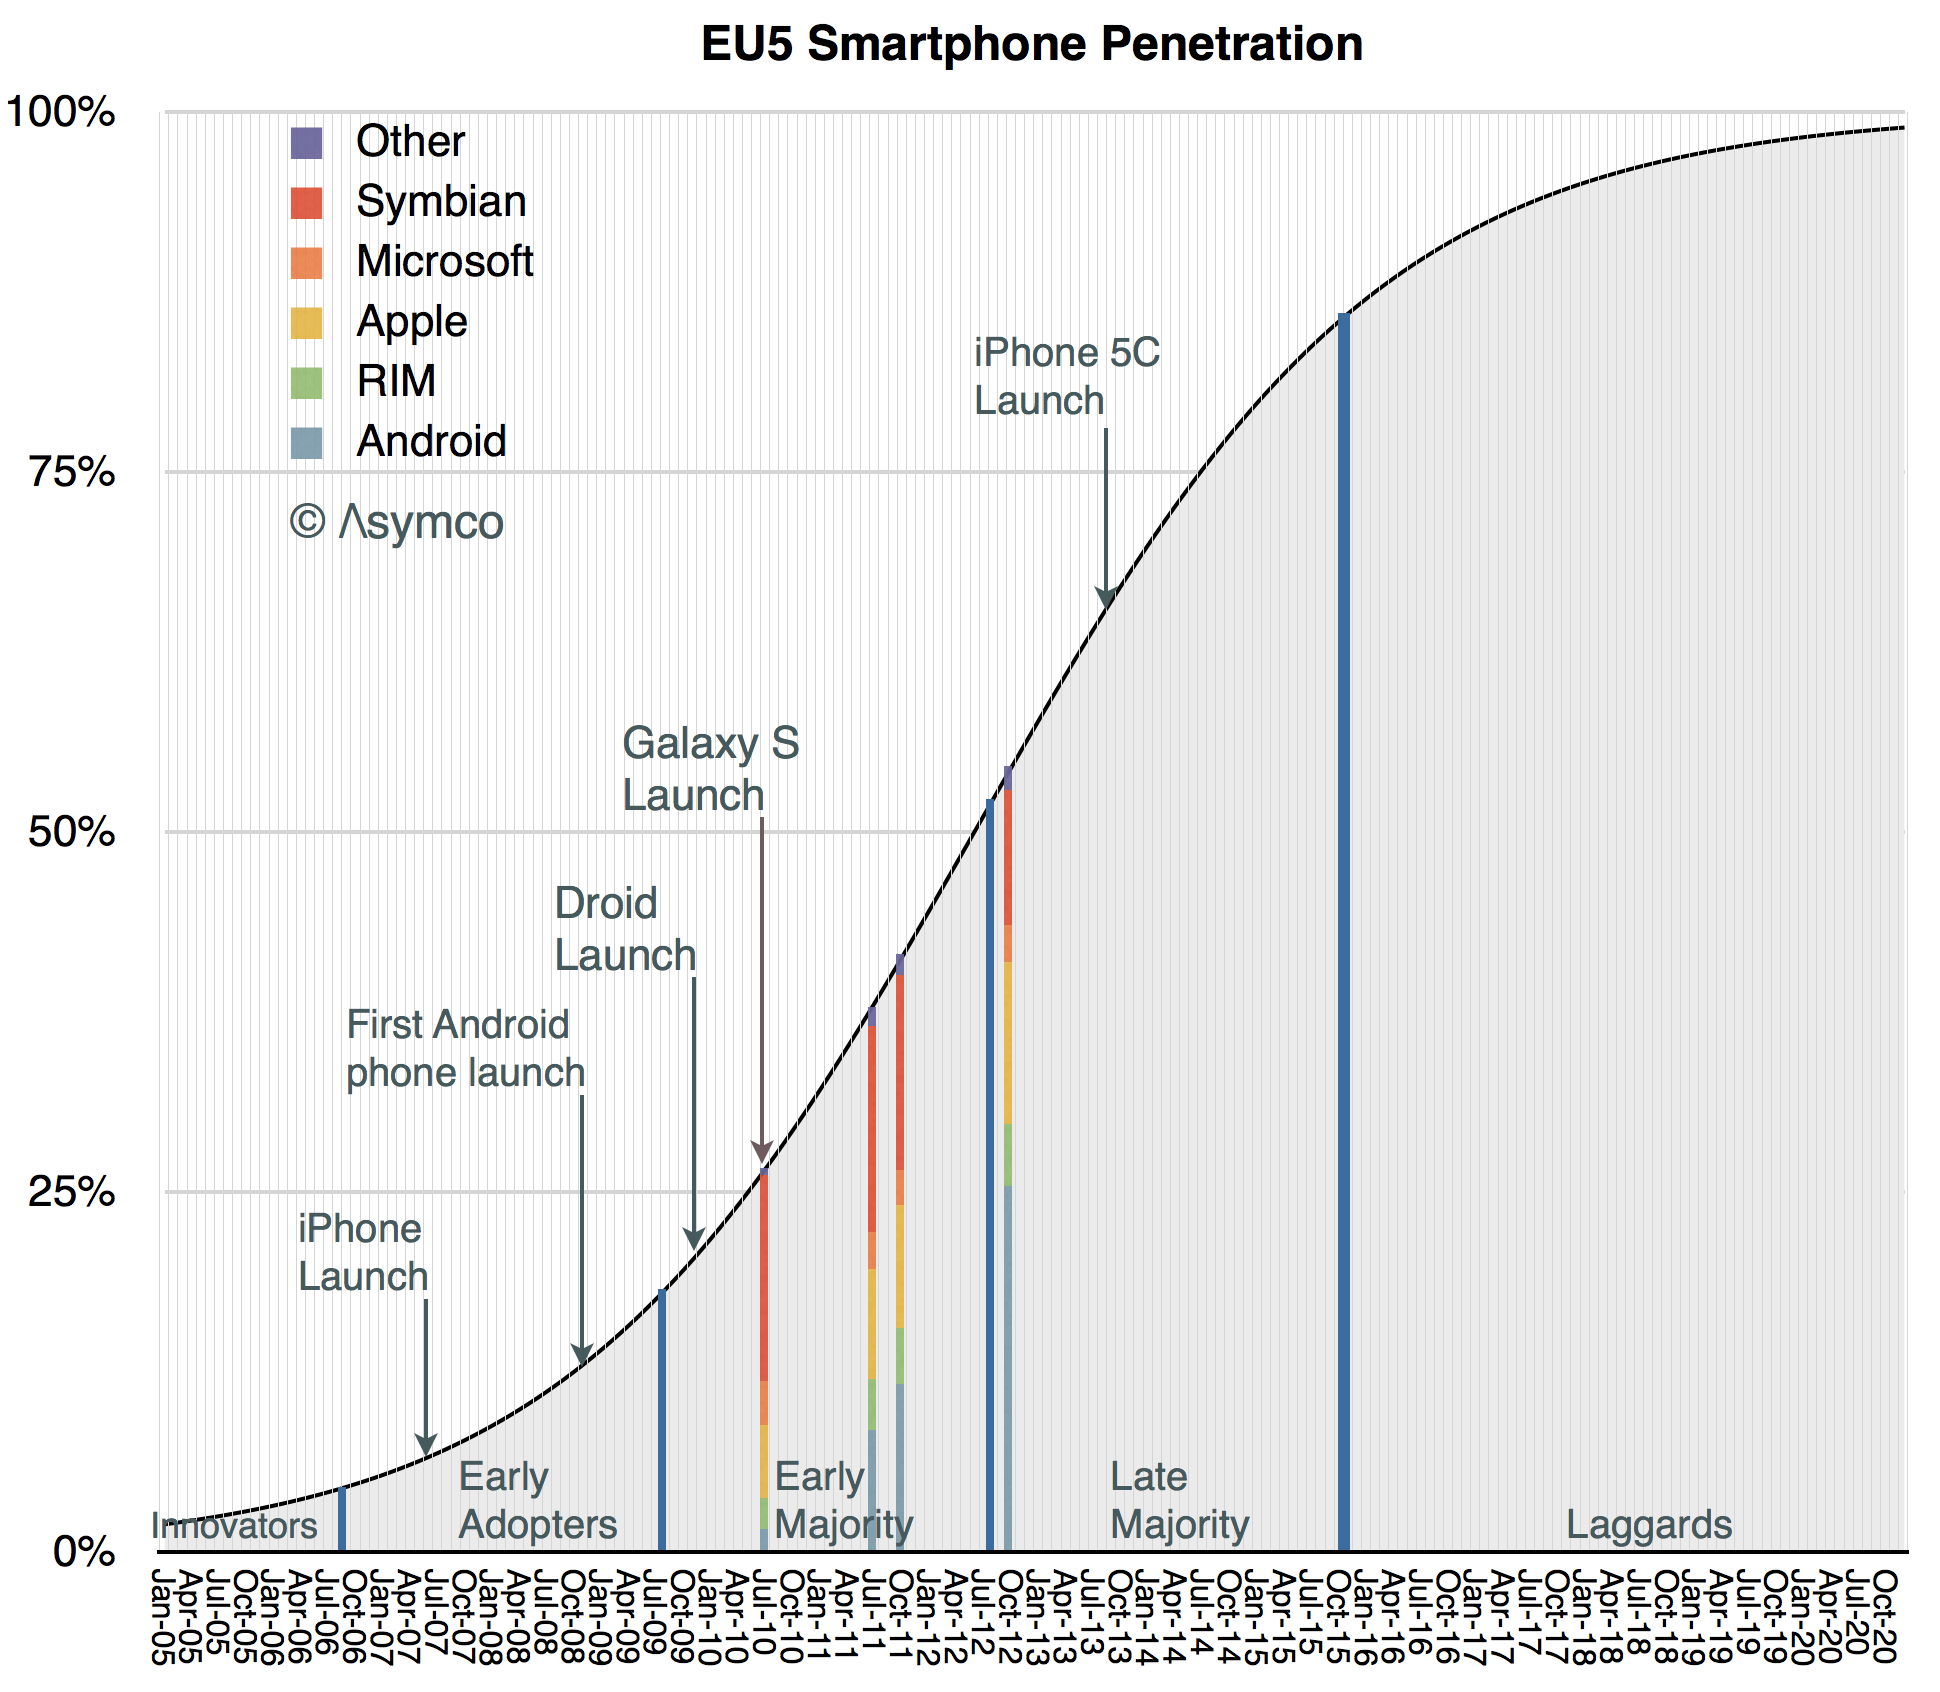
    Using the logistic curve model introduced last week, it's possible to get an approximate categorization of the adopters of the technology:

    Screen Shot 2013-10-16 at 10-16-2.02.44 PM

    As with the previous analysis, the graph identifies the following dates:

    • The Innovators' period ended in the EU5 approximately in September 2006. (The equivalent period ended in the US in February 2007.)
    • The Early Adoption period ended in the EU5 in August 2009. (US: December 2009).
    • The Early Majority period ended in the EU5 in August 2012. (US: September 2012)
    • Late Majority will end in the EU5 in November 2015 (US: November 2015)

    Therefore if we want to suggest that saturation happens near 100% then the answer to the question in the headline is "the end of 2020." If we want to suggest that saturation is the end of the Late Majority then the answer is "two years from now."

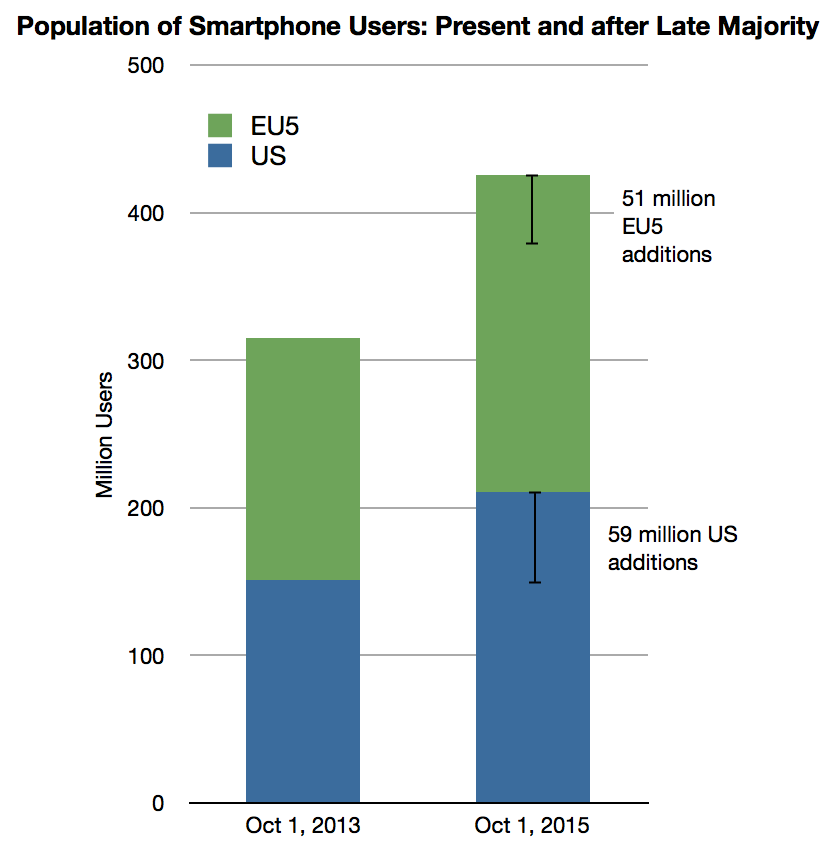
    One final observation: the two markets appear to be converging thus placing the analyst in the comfortable position of forecasting the adoption of smartphones for a total population of 425 million people ((see previous note)).

    Screen Shot 2013-10-16 at 10-16-2.01.07 PM

    If we define saturation as the end of the "Late Majority" period then the number of new-to-smartphone users remaining for the combined EU5 + USA markets is 110 million of which 59 million will adopt in the US and 51 million in Europe. They will all join ecosystems in the next two years.

    Plan accordingly.

  5. Third to a billion

    Research · 168 comments

    Android is the third platform to reach a billion users ((Although activations are not users, I'm assuming that usage is not far behind and the cumulative sales figures I gather are roughly comparable.)) .  The first was Windows and the second was Facebook. Apple sold around 650 to 700 million iOS and is expected to be the fourth to a billion sometime next year. ((Separately, iTunes reports 575 million account holders.))

    If we define the Race To a Billion to be bounded by a time limit of 10 years, then Windows does not qualify and Android is actually second. The race is shown in the following graphs (the one on the left is logarithmic scaled, the one to the right includes only a few contenders for illustrative reasons).

    Screen Shot 2013-09-06 at 9-6-4.06.29 PM

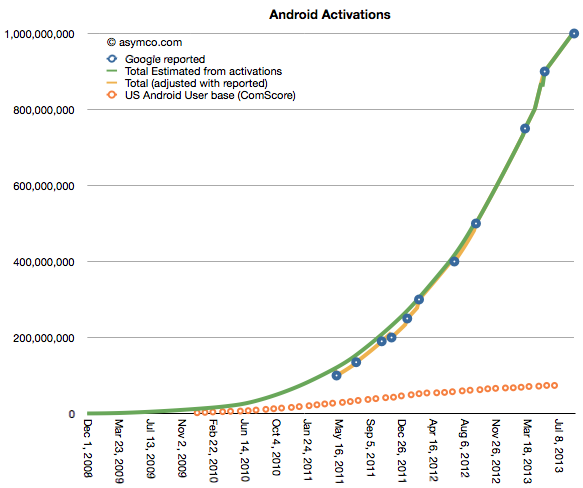
    Android's activations as reported are shown in the following graph:

    Screen Shot 2013-09-04 at 9-4-1.15.38 PM

    Without qualification, Android has been a viral success story. It reached one billion activations in about five years, almost half the time it took FaceBook and far faster than Windows.

    However, Android growth can be qualified. I added another set of data which is the number of US Android phone users as deduced from measurements by ComScore. ((ComScore surveys users on their primary phone. Survey includes only those aged over 13 years and excludes phones issued by businesses.))

    One way to read the two graphs is: Between March and August, of the 250 million Android devices activated, 4 million were to new Android consumers in the US. In other words, In the last six months, 1.6% of Android activations went toward new usage in the US. The equivalent figure for iOS is about 6%. Note that these are new users, not included are upgrades. It's likely that more of the US buying goes toward upgrades because iOS has been in use longer.

    So whereas Android is growing very rapidly, there is a question of reliability of that audience. Engagement is one thing, but in the market which shows highest penetration (and deepest distribution of an alternative) Android is peaking.


  6. Signs of US Android net user decline

    Research · 257 comments

    ComScore's latest survey  for US smartphone users showed that Android had 52% share of about 142 million users. That amounts to 73.84 million Android devices in use.

    ComScore's previous such survey showed that Android had 52.4% of about 141 million users. This amounts to 73.88 million Android devices in use. It also means that Android usage in the US went down for the first time.

    Screen Shot 2013-08-08 at 8-8-10.10.39 AM

    The difference is surely within a margin of error so it's not something to declare definitively, but the pattern of Android "peaking" has been evident for some time.

    Screen Shot 2013-08-08 at 8-8-10.11.44 AM

    Even though share stopped growing about a year ago, Android continued to gain users as overall smartphone consumption increased. The last few months however have shown a slowing of new smartphone users and therefore we have this first instance of Android appearing to lose usage.

    Screen Shot 2013-08-08 at 8-8-10.12.35 AM

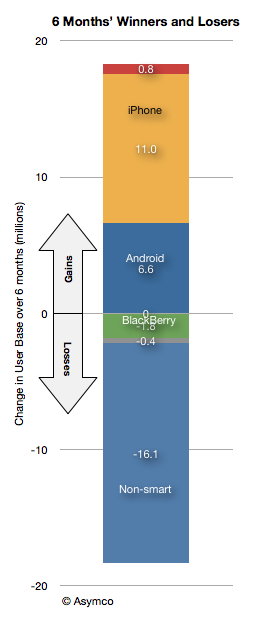
    Note that this has not been the case for iPhone as usage over the last six months is up by 11 million users vs. 6.6 million for Android.

    Screen Shot 2013-08-08 at 8-8-10.13.07 AM

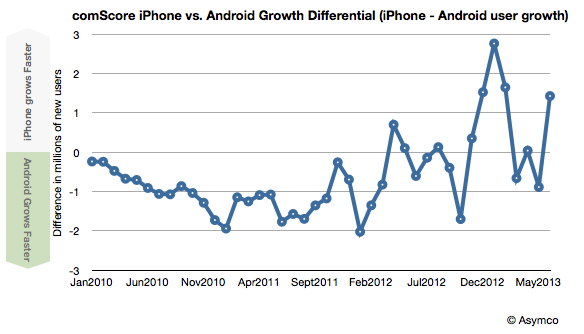
    Indeed, iPhone gained more users than Android for the last 6 out of 8 months.

    Screen Shot 2013-08-08 at 8-8-10.16.36 AM
  7. Measuring US Mobile Platform Shares: Kantar vs. comScore

    Research · 34 comments

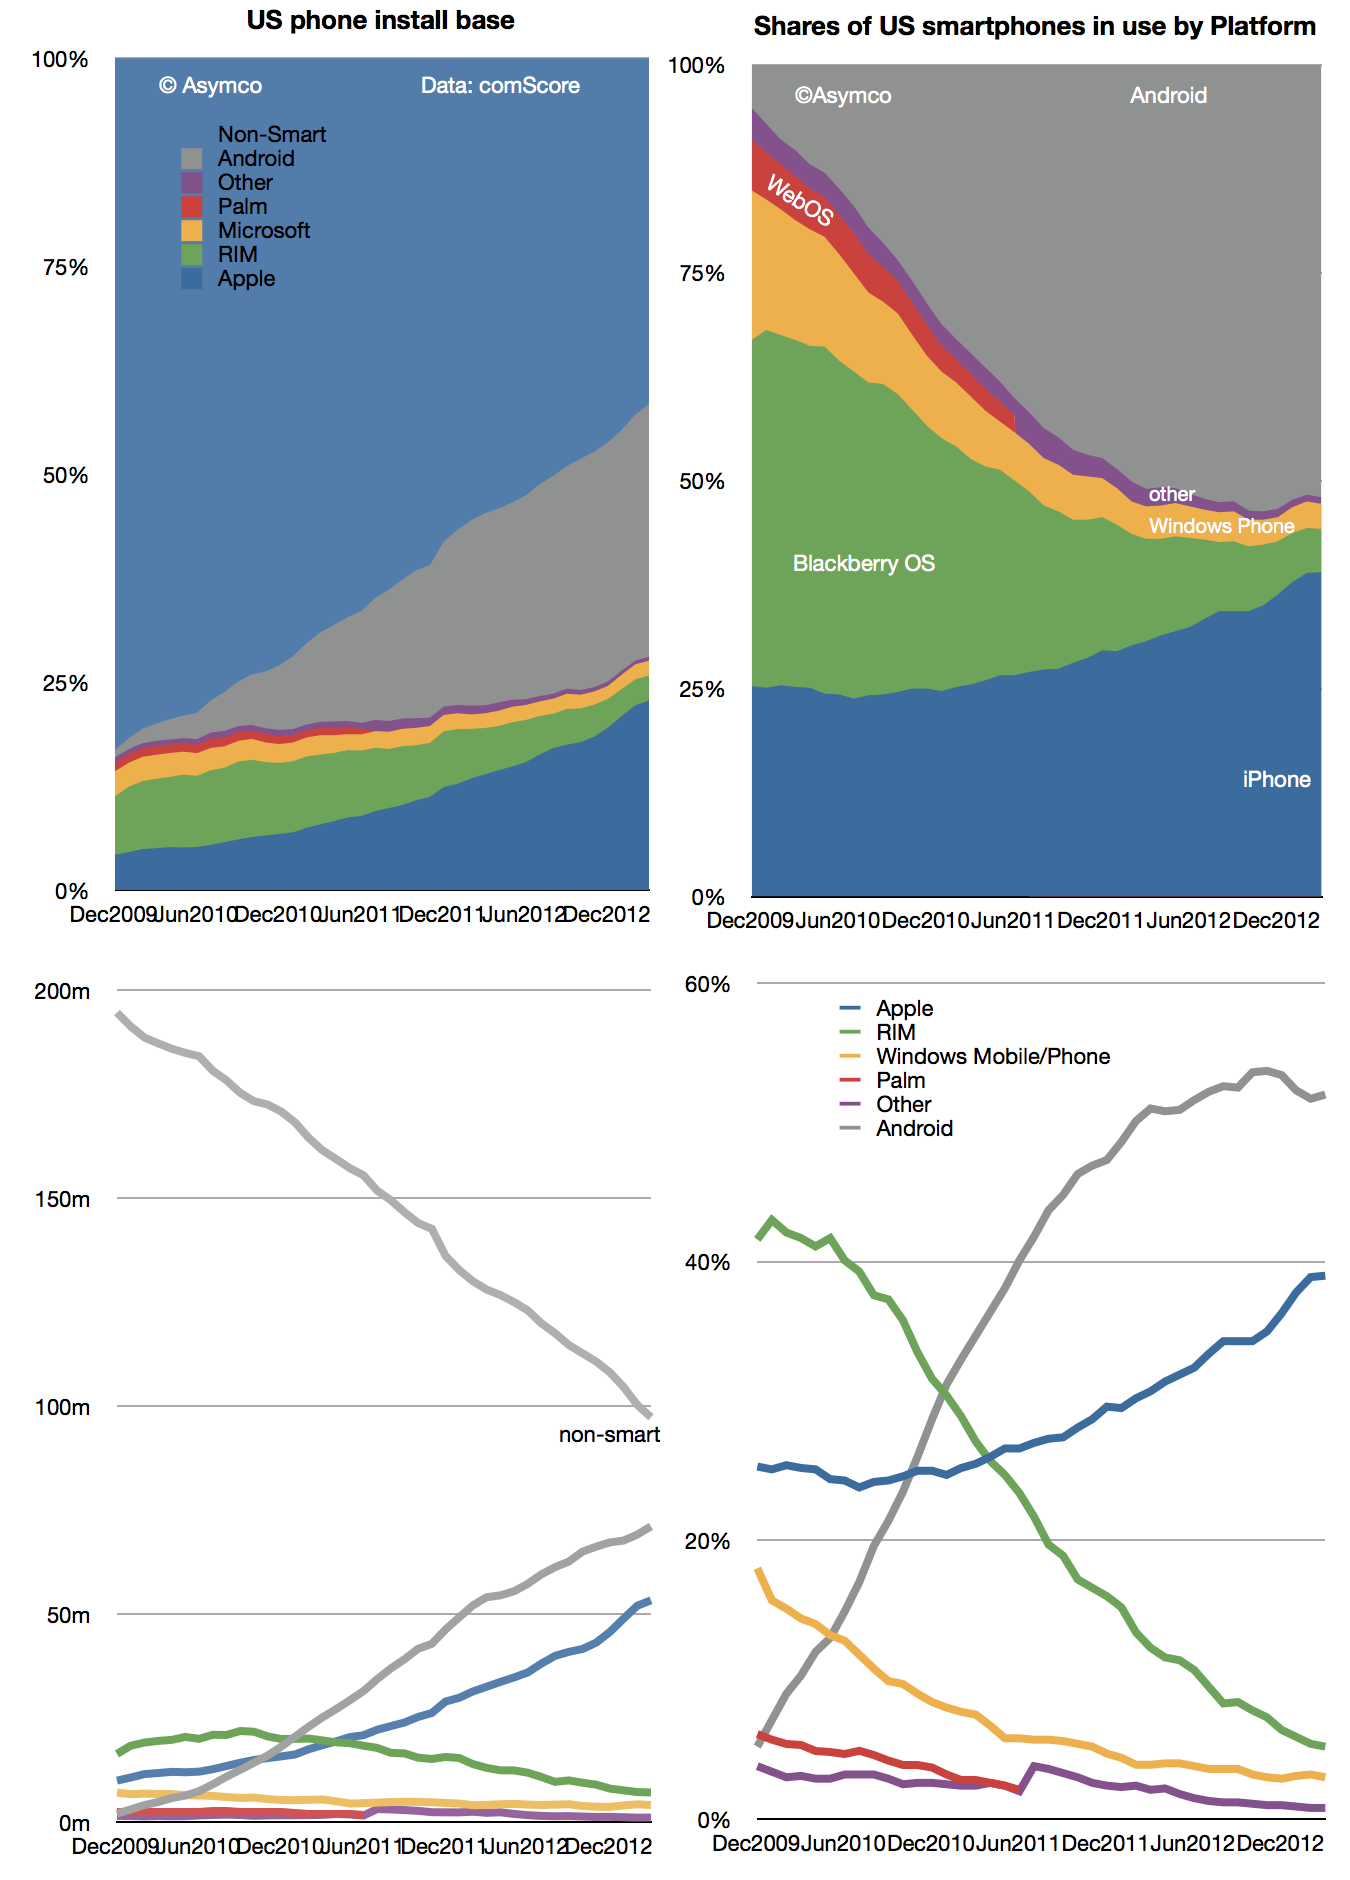
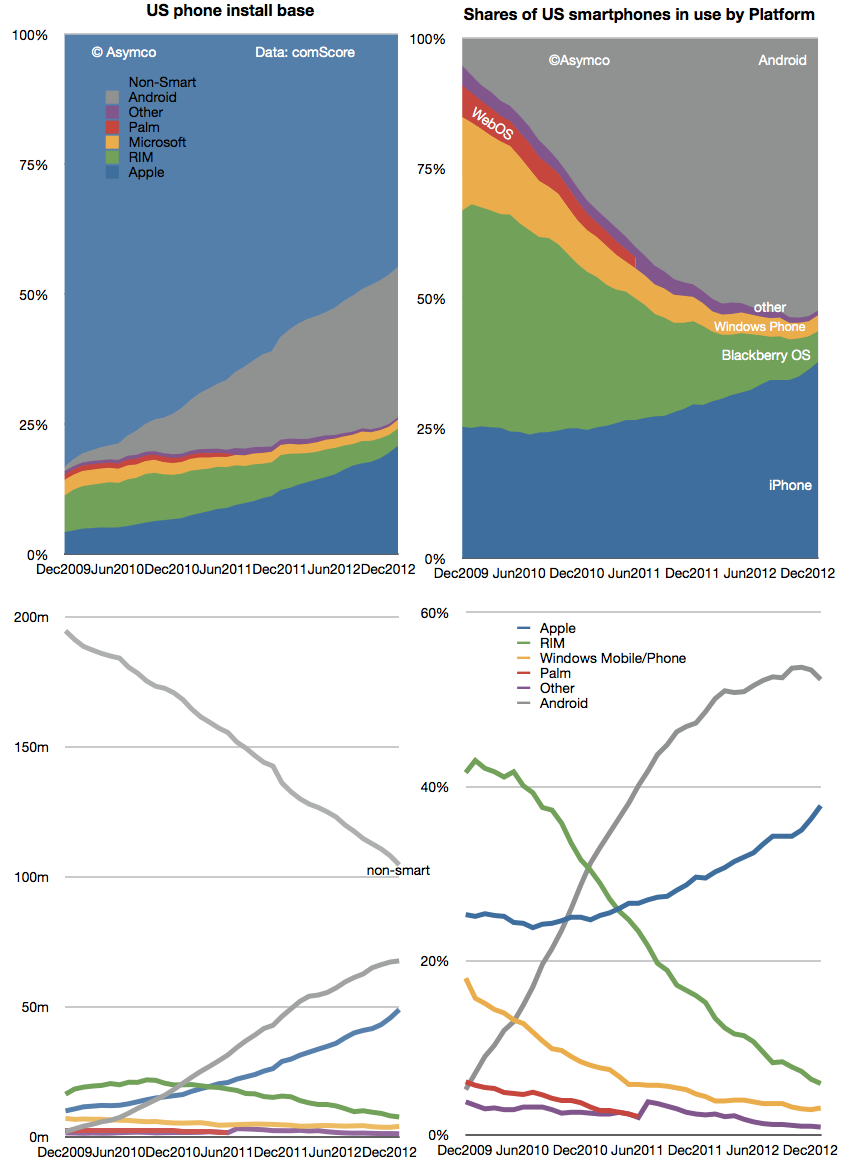
    The latest comScore US smartphone install base data is in and there are few surprises. iPhone has reached a new record high penetration (39.2%) and user base (54.3 million). Android has reached a new high in user base (72 million) but share at 52% is below the peak reached in November 2012.

    Screen Shot 2013-06-05 at 6-5-3.48.35 PM

    This pattern of gradual iPhone share gain in the US has been consistent for over two years even while Android has catapulted into an overall lead. The surprising thing is how Android seems to have peaked in share. There are still 95 million non-smartphone users and there seems to be headroom for growth even though the other platforms have been tapped out. But it does not seem that Android phones have any particular advantage over iPhone. My hypothesis remains that as price is taken out as a differentiation, the adoption of iOS is slightly higher than Android.

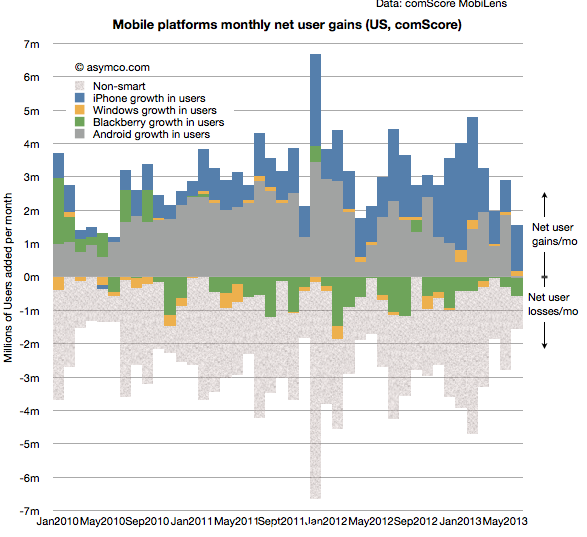
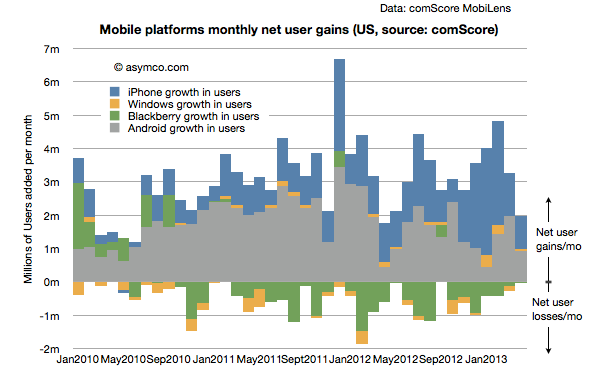
    Another measure of market performance is the implied net platform user gains which is shown below:

    Screen Shot 2013-06-05 at 6-5-3.23.55 PM

    It shows that iOS added more users in the last few months than Android.

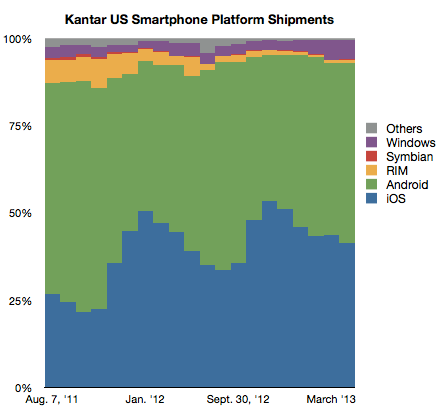
    The problem is that Kantar Worldpanel measures shipments and their share data shows a seemingly different picture.

    Screen Shot 2013-06-05 at 6-5-3.22.23 PM

    In their data Android is shown as selling more units during January through April while Apple sold more during October through December. Of course we don't have the absolute number of units so can't see the effect of higher holiday overall sales volume. Nevertheless, the balance of growth seems to be disproportionately in favor of Android relative to the data from comScore.

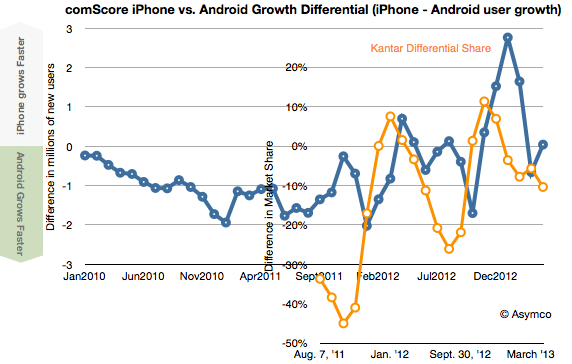
    To look at the situation more closely I measured the differential in user adds for comScore and the differential in market share for Kantar's data. Then I overlaid the two differentials so that months are matching, as shown below:

    Screen Shot 2013-06-05 at 6-5-3.51.57 PM

    There is a similarity to the frequency of oscillation with comScore data showing a delay (as would be expected since their data is sampling over a three month period). However, we are still facing a vertical offset where there is apparently more growth bias for iPhone in the comScore data.

    Possible factors which might be explanatory:

    • Methodologies used. comScore data excludes ages below 13 and non-personal devices (business expensed phones.) 
    • Replacement sales are invisible in comScore data since the user base does not change when phones are replaced (and old ones are discarded.)
    • Missing data from Kantar. Given their survey methods it's possible that their panels miss some market segments.
  8. Measuring Platform Churn

    Research · 33 comments

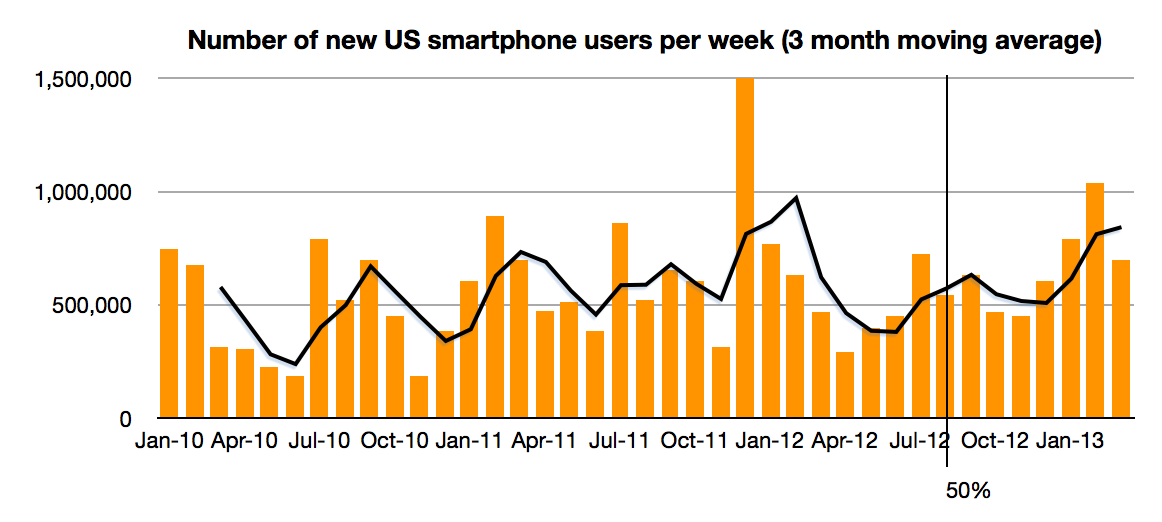
    The latest comScore data shows consistent growth in US smartphone penetration. The rate is now 58.4% of adult consumers who own phones. This is up from 20% only three years ago. The rate of growth remains a remarkable 1.2% per month. That's 700,000 new-to-smartphone users every week. The historic average over 3 years has been 1.07%/month This after having crossed over 50% on schedule in August 2012. There appears to be no slowing.

    Screen Shot 2013-05-06 at 5-6-5.42.50 AM

    The next milestone I have pencilled in is the 80% mark which I extrapolate to be achieved by October 2014. 80% could be considered "saturation" which would signify a rapid slowing of new user addition. However, that might still not happen until 100%, depending on the availability (or lack thereof) of non-smartphones to buy.

    This time frame is important because it would imply that essentially all mobile users in the US (some 234 million) would be a part of one ecosystem in about 2 more years. That's less than the life cycle of the typical mobile contract (and thus the life of one phone). Put another way, by the time a new buyer today is ready to buy the replacement to their phone the market will be saturated.

    This implies the mode of competition will be changing to smartphone replacement rather than smartphone adoption. To some degree this is already happening but as the net user gains data shows only BlackBerry and Windows platforms have had any net user declines in the last two years. "Platform churn" is still a relatively rare phenomenon.

    How that will change post-saturation will be a crucial determinant to platform growth. The data today points to a higher degree of loyalty for iOS users and potential erosion in the Android user base as a result. There are ways of forecasting this on the basis of survey data as Carl Howe did. However, the data from comScore has already begun to show that Android may have peaked around 54% share. Android share is now at the same level it was in July while iPhone share has grown by more than 6 points since then.

    Screen Shot 2013-05-06 at 5-6-5.40.28 AM

    There is a pattern of higher growth into the end of the year and an iPhone plateau into the first quarter, undoubtedly due to holiday buying favoring the iPhone. I don't want to discount the possibility of some change in this pattern but so far there seems to be a plausible reason for it: with iPhone pricing and availability in the US offering no advantages to alternatives, Apple's product is the most popular. Nearly more popular even than all the other competitors combined.

  9. Where are the Android users?

    Research · 172 comments

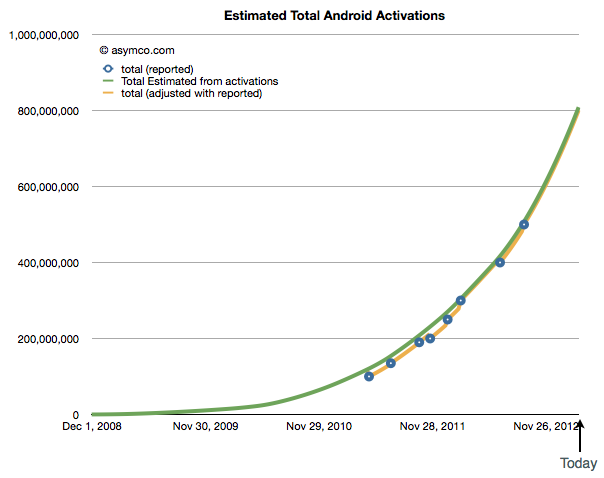
    Google occasionally reports data regarding Android. Very occasionally. The last time we had some data was in September 2012 when we learned that activations were running at 1.3 million per day and that a total of 500 million total activations had taken place.

    As of today, being March 2013, the time between updates has reached five months. It's the longest gap so far. Benedict Evans also notes that it's been five months since the data regarding screen size stats has been updated on the Android developer site.

    But we have to live with what we get and, in the absence of an update, the pattern of growth in Android, if sustained, looks like this:

    Screen Shot 2013-03-10 at 3-10-11.05.14 PM

    It implies that 800 million Android activations have taken place to date and the rate is about 2 million per day. One billion activations could thus happen by June.

    There is however another set of data regarding Android which is updated more frequently. The comScore mobiLens survey covers the US and provides updates on a monthly basis. That data shows that Android users in the US reached about 68 million as of the end of January. See the updated data below:

    Screen Shot 2013-03-11 at 3-11-10.26.01 AM

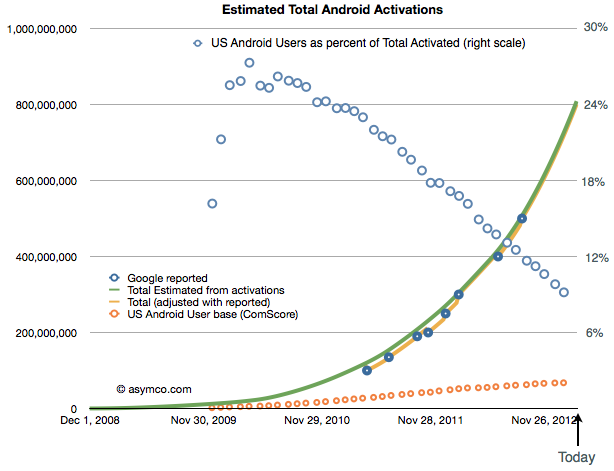
    I included the install base and share of total users as reported. Combining the comScore data with Google's activations gives the following picture of US as a percent of global Android (orange circles represent US base and blue circles the precent of total activations that the US might represent)[1].

    Screen Shot 2013-03-10 at 3-10-11.44.34 PM

    The data implies about 9% of Android usage is in the US. The more startling thing is the difference in growth: it implies that with a US growth rate of only about 13.3k/day, global growth is 150 times faster than US growth. In other words, that 0.6% of new users are in the US and that 99.4% of Android growth is outside the US.

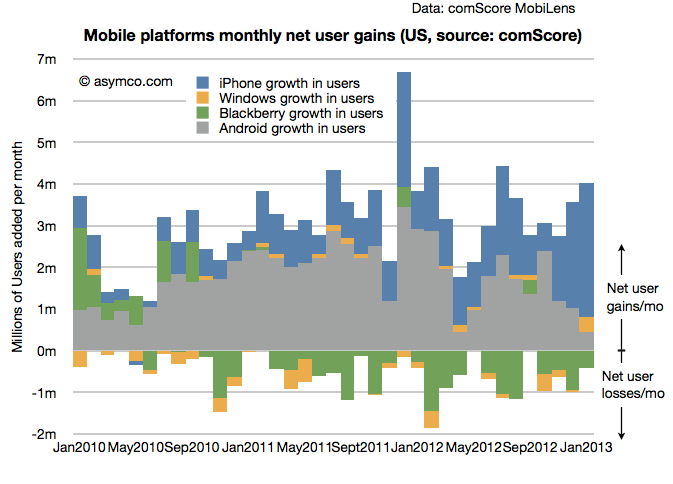
    That's an interesting story. But it's even more interesting that this is not the case with the iPhone. The iPhone is growing considerably faster in the US than Android. One can see this more easily with a graph of the US mobile platform net user gain rate as shown below:

    Screen Shot 2013-03-11 at 3-11-10.32.23 AM


    Looking at the the same contrast between global and US, from Apple's financial reports, in the fourth quarter the global "activation rate" (i.e. sales rate) for iPhone was 525k/day (nearly one quarter of the extrapolated Android rate). The comScore data suggests the US gains are running at 106k/day. Therefore we can calculate that about 20% of iPhone growth is in the US and 80% is outside the US.

    Even accounting for some potential error in the Android estimates, the contrast is quite stunning: 1% vs. 20% share of growth suggests something is very different about the US with respect to the two platforms.

    My suspicion is that it has something to do with the fact that the US is one of the few (but largest) market where the iPhone is available as a "low end" offering. At a minimum price of $0 (with a contract) many consumers are finding the iPhone attractive relative to a $0 (with a contract) Android phone. This price parity (illusory as it may be) allows iPhone to grow even faster than Android in this particular market.

    One wonders what would happen if such price parity were present globally.

    ---

    Notes:

    1. Android activation data as reported by Google includes tablets but excludes many unofficial Android builds e.g. Amazon Kindle and many Chinese phones and tablets that don't register with Google services. comScore data includes only primary devices used by consumers and excludes corporate purchases and devices whose primary users are younger than 13 years.
  10. The Android engagement paradox

    Research · 180 comments

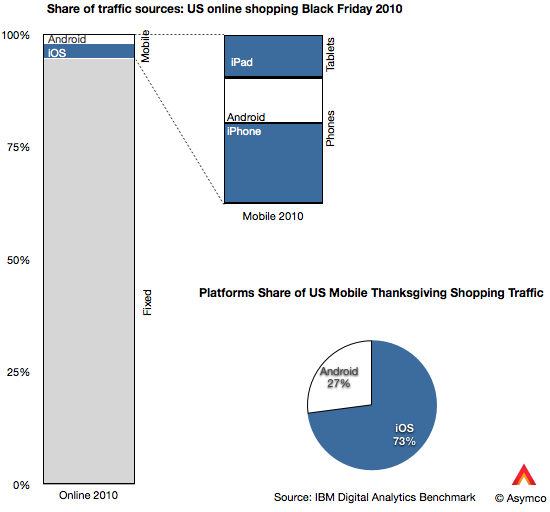
    IBM's Digital Analytics Benchmark reported US Black Friday sales and the news is reasonably good. Overall online sales grew by 17.4% while mobile grew to make up 24% of traffic.

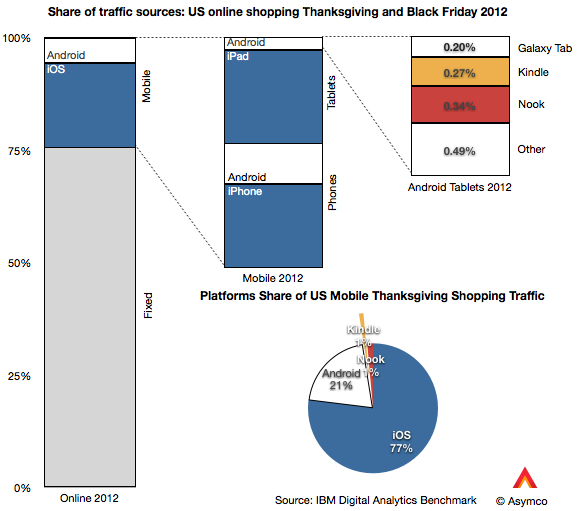
    The data goes further to show the split between device types. I illustrate this split with the following graphs:

    Of the 24% of traffic made up by mobile devices, phones contributed 13% and tablets 11% (or 54% and 46% of mobile respectively). Of the phone traffic, iOS devices were about two thirds of traffic and Android one third. Of tablet traffic, iPad was 88%, Kindle and Nook were 5.5% Galaxy Tab was 1.8% and other tablets were 4.4%.

    Overall, iOS was 77% generated mobile traffic and Android (excl. Kindle, Nook) was 23%.

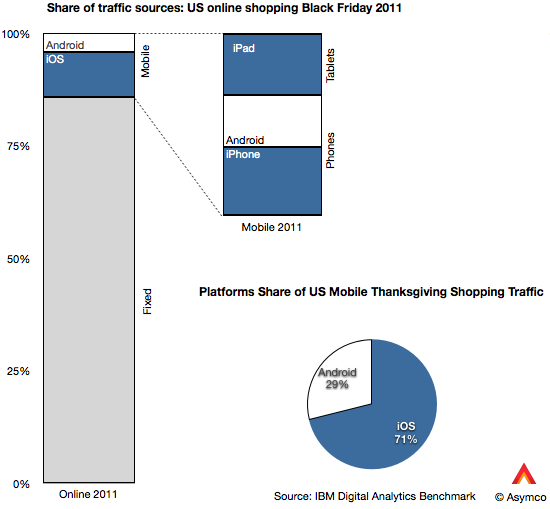
    That's an interesting snapshot of the consumption of mobile devices, but is there a pattern here? I also took a look at the same data from 2011 and 2010.

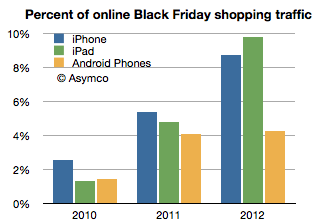
    Besides the pattern of significant mobile growth (from 5.2% to 24% of online in two years) there is the curious effect of iOS growth outpacing Android growth. Android went from 1.43% of Black Friday shopping traffic in 2010 to 4.92% in 2012. In same time iOS went from 3.85% to 18.46%. In other words, while Android is up by a factor of 3.4, iOS is up by a factor of 4.8.

    The reason is evident in the graphs above: the iPad is now the predominant mobile shopping device. You can observe the pattern in the following graph:

    Two years ago the iPad was trailing Android usage but this year it was more than twice Android usage. Curiously, the iPhone seems to also be pulling ahead of Android.

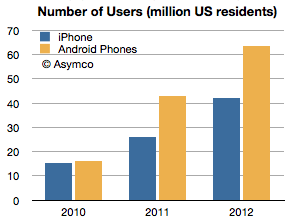
    Curiously because the number of Android users in the US has gone the other way. That data is available from ComScore, though only for phones. (ComScore data for periods ending November each year, Nov 2012 is my estimate):

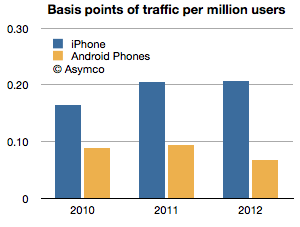
    Having the number of users and the traffic allows us to measure consumption per capita, so to speak. That is, the percent of traffic per device user:

    The ratio shown is basis points of usage (1/100 of 1% of shopping traffic) per million users of smartphones. iPhone users are about three times more engaged in shopping with their devices than Android users. Two years ago the ratio was two to one.

    Overall iPad is changing shopping habits, but it has a near monopoly in its form factor at this point. The bigger question is what is causing phone users to behave differently based on the devices they own. The phone market is more mature and has had several years of competition to be able to discern differences in platforms. The pattern is pretty clear with respect to Android: engagement is down as ownership is up. This pattern has not exhibited itself with iPhone, even though it has had a longer time in market.

    Of course, one would expect that later adopters would engage less, but I find it surprising that US Android users would behave so differently only two years after the platform began to be widely adopted. That pattern is not happening with iOS even after five years and certainly not with the iPad which is about as old as most Android brands.

    This I consider to be a paradox: Why is Android attracting late adopters (or at least late adopter behavior) when the market is still emergent? We've become accustomed to thinking that platforms that look similar are used in a similar fashion. But this is clearly not the case. The shopping data is only one proxy but there are others: developers and publishers have been reporting distinct differences in consumption on iOS vs. Android and, although anecdotal, the examples continue to pile up.

    And engagement is not a frivolous platform attribute. It is highly causal to success because it correlates with all cash flows associated with ecosystem value creation. Especially when a platform like Android depends more on engagement than "monetizing hardware."

    I'm not satisfied with the explanation that Android users are demographically different because the Android user pool is now so vast and because the most popular devices are not exactly cheap. There is something else at play. It might be explained by design considerations or by user experience flaws or integration but something is different.

    ---

    If you'd like to learn more about the Asymco method, come to Asymconf. The next Asymconf will be at the end of January near San Jose. Not only will you learn about how mobile is disrupting computing, you will also get to hobnob with the likes of Om Malik, Jean-Louis Gassée and Michael Lopp.

  11. The Crucible of the Phone Market

    Research · 36 comments

    [The following was originally published on LinkedIn.]

    The US is in the forefront of smartphone usage. This has not always been the case. Five years ago only 3 percent of US phone users were using a smartphone, lower than the global average. At the time Palm and BlackBerry were the prominent devices in the US while in Europe Nokia's push with Symbian and Microsoft's licensing of Windows Mobile led to a smartphone adoption rate of about 7%.

    All that changed with the iPhone. After 2007 the US began to rapidly catch up and eventually overtook all other regions in terms of smartphone adoption. The latest data from comScore Mobilens shows that the US is now effectively 50% penetrated. The following chart shows just how quickly this happened.

    Image (media01.linkedin.com)

    In December 2009 only 17% of Americans used a smartphone as their primary phone. As of August the total reached 49.8%. By today the US is effectively a majority smartphone usage country and it looks like there is no slowing. We might very well see the US reach saturation with 80% smartphone usage in another two years.

    Of course, the US is not the first country to reach this threshold. Some northern European countries were there earlier, but North America is the first major region to get there. That means over 115 million smartphone users in one market. As a result, the US has become the crucible of the whole smartphone market. It's where platforms are most concentrated in use and therefore the most sensitive to the effects of that usage. That leads to more innovation, more discovery of new use cases and more ecosystem growth. Quite simply, it's where competition is most heated.

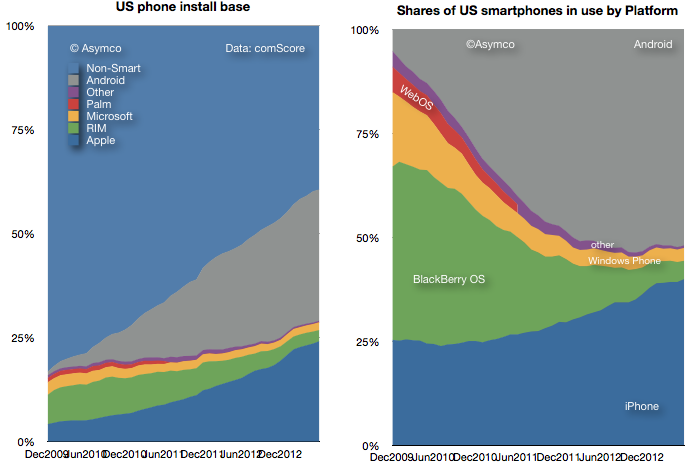
    This prominent position implies that the US could now be seen as a leading indicator of global trends. It might allow a keen observer to predict what will happen from US data. So what does the mobile platform rivalry look like in the US?  We are fortunate because the data is finely grained in the US. We have montly updates from comScore and we get specific platform penetration data. The following graph shows the shares of the major platforms since late 2009.

    Image (media01.linkedin.com)

    It becomes immediately evident that BlackBerry has lost a huge part of its user base to Android and iOS. In 2.5 years share when from about 42% to 8%. In raw numbers that's 11 million users that switched to another smartphone.

    Looking closer you can also see a consistent growth in share for the iPhone since mid 2010 with a slightly higher rate of increase of share than Android in the last few months. The problem is that this pattern of rapid decline in RIM and moderating growth in Android is not necessarily mirrored globally.

    RIM just reported an increase in total users during the last quarter (from 78 to 80 million subscribers.) Google also recently reported 500 million Android activations globally with no apparently letup in growth.

    So there seems to once again be a disparity between the US and global platforms. Do we take the US market to be anomalous or is it a pre-cursor to global trends?

    Certainly the US market is in many ways unique with a very low rate of pre-paid usage and a relatively high ARPU and average device pricing due to subsidies. However, the global trend has been to increasingly mirror the US not vice-versa. The iPhone has radiated out of the US in terms of usage and so has Android. Attempts by other platforms to make inroads in the US have been unsuccessful. Symbian failed to gain a foothold and it seems Windows Phone is stumbling as well. Both of these platforms have had more success outside the US. The US operator subsidy model has also been "exported" more than pre-paid has been "imported". By 2007 Europe was moving away from subsidies as prices of feature phones were coming down and 3G was still in its infancy. That was reversed as the large screen smartphones became the device of choice. In addition to device and operator trends, most apps originate in the US and the major social media platforms are all American-based. In other words, the modes of usage are being conceived in the US.

    On the other hand, the US is still a tiny percent of total consumption. It represents only about 6% of all phone users. Chances are that prices for devices in the US (especially the iPhone) can't be sustained for 5 billion consumers. Then there are "cultural" considerations where regions cling to their own usage habits and perceptions of value.

    So it's still an open question of whether the US is the leading indicator for how platforms might change globally but I would watch this data very carefully. When it comes to mobile platforms, it might be that if it plays in the US it will play globally.