Asymco

Asymmetric Intelligence

comScore

  1. How many Lumia phones were sold in the US?

    Research · 159 comments

    Nielsen and comScore survey US consumers through different methodologies, however they both try to paint a picture of the smartphone patterns of ownership and consumption.

    I regularly report on comScore's data as it's published on a monthly basis. Nielsen offers updates on a quarterly basis but there is more detail.

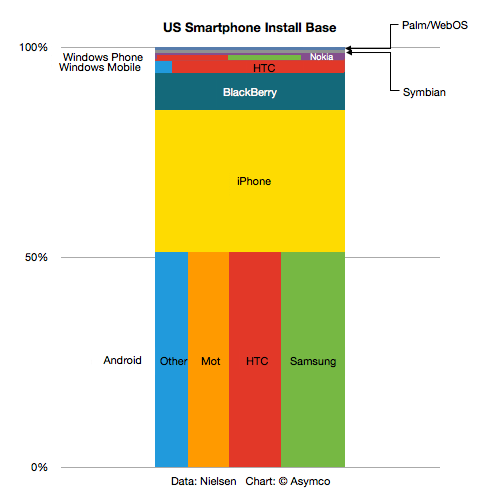
    The latest report (for Q2) shows smartphone shares by both platform and vendor. The following graph is a treemap built with the Nielsen data:


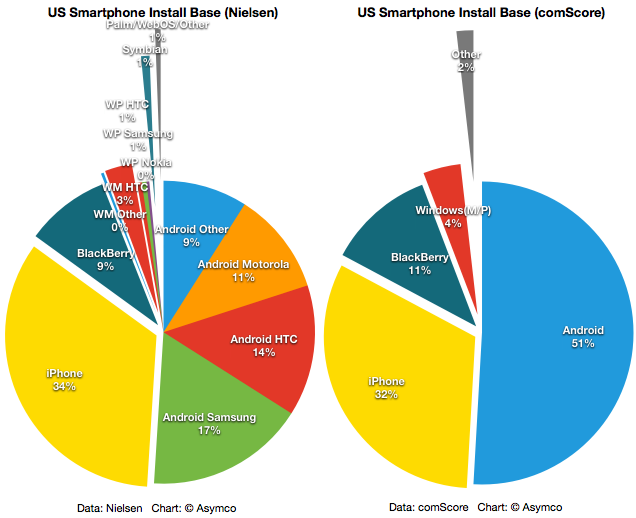
    The same data is also plotted below as a pie chart:

    I also added the latest comScore mobiLens data in the pie chart to the right.

    Note that both surveys agree in the main on the largest platforms. The difference seems to be within a reasonable margin of error. The details available in the Nielsen data are perhaps also interesting. The various Android OEM shares as well as the division between Windows Mobile base and Windows Phone (7) base could provide some insight. Nielsen's total Windows base adds up to 4.5% while comScore reckons on 4%. Within that total, Nielsen breaks out 3.2% for Windows Mobile and 1.3% for Windows Phone. Within the Windows Phone total, HTC and Samsung are shown as having 0.5% and Nokia 0.3%.

    If we then use comScore's figure for total smartphone users (110 million) then the data would suggest that there are 330k Lumias in use in the US. This would have been accummulated over a sales period of about four months.

  2. Half of US iPhones are repeat purchases

    Research · 46 comments

    Canaccord Genuity analyst Mike Walkley writes in a note to clients today. “In fact, we believe iPhones are outselling all other smartphones combined at Sprint and AT&T and selling at roughly equal volume to all Android smartphones at Verizon.”

    via iPhone Tops Sales Charts at Each of Its U.S. Carriers - John Paczkowski - Mobile - AllThingsD.

    That's useful data. Mainly because we can use it in combination with comScore data that tracks a different market measure. comScore's MobiLens service tracks US mobile installed base. By measuring the difference between their stats one month to the next, one can measure the gain in a particular platform.

    Comparing that gain with the sell-through rate in the same period can yield a figure for the number of units sold as upgrades vs. those sold to new users.

    The latest comScore data (period ending February) shows that Android added 2.87 million users to its base while iPhone added 1.52 million. If we assume that Android sold a minimal number of replacements (due to the limited time in use of bulk of units) and round up to 3 million for February, and if we assume that Apple sells as many iPhones as Android (which is what Walkley suggests) then we can conclude that in the US roughly half the iPhones are bought as replacements for existing iPhones.

    Extrapolating this to global markets may be risky but already we can begin to form a picture of how the iPhone franchise is becoming an annuity-based business.

    Apple likes to point out that "half of Mac buyers are first time buyers." In the case of the iPhone perhaps they could also say "half of iPhone buyers are repeat customers." At this stage in the platform, that's a powerful statement. If the repeat customer rate is high then it suggests strong loyalty but it also may suggest poor competitive position vs. non-consumption or alternate platforms. If the repeat customer rate is very low it may suggest competition vs. non-consumption but it may also suggest low loyalty. It all depends on the overall growth in the market and size of installed base.

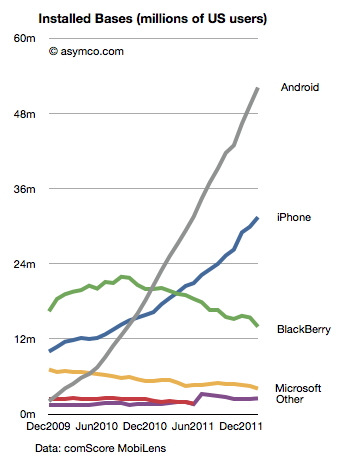
    The following chart shows the overall market growth and the position of the various platforms within that growth.

    Note the time scale is slightly more than two years. This suggests that the vast bulk of Android units in use (grey area) consists of first use units. New purchases are going to first time buyers. In contrast, the shrinking RIM total implies extremely low sales as the age of the base is far older than the time scale. iPhone base is both growing and being upgraded.

    As we reach 50% penetration of smartphones, platform churn will become a significant component of market performance. The loyalty and "stickiness" of Android will begin to be tested. Current surveys show reasonably good satisfaction ratings for Android phones (around 60%) while iPhone's are even higher. But let's keep in mind that RIM's satisfaction and the loyalty of their customers was exceptionally high a few years ago. The rate of evaporation of goodwill toward the brand is breathtaking.

    The longer term test of mobile platform performance will be in the recurring purchase rates. Loyalty must be earned and preserved. I.e. "You come for the product, you stay for the ecosystem."

    So far, the iPhone seems to be getting a passing grade while Android has yet to face the test.

  3. The unrelenting trends in the US smartphone market

    Research · 27 comments

    The latest comScore US mobile subscriber monthly data is in: comScore Reports January 2012 U.S. Mobile Subscriber Market Share - comScore, Inc.

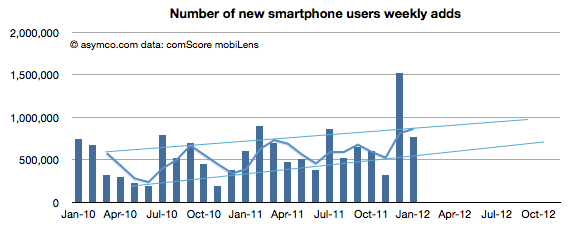
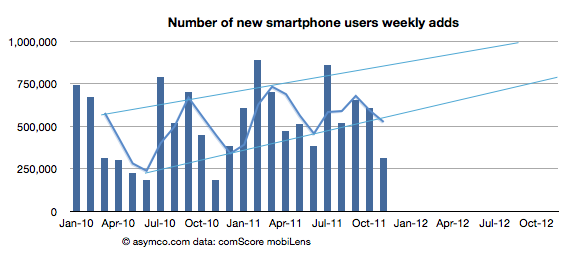
    January saw a return to trend line growth in US smartphone add rates. The 767k/week rate is within the band after November's below- and December's above-the-line outliers. The weekly add rates are shown (with projection of trend) below:

    The pattern shows a likely 1 million new smartphone users per week being added consistently by the fourth quarter of this year.

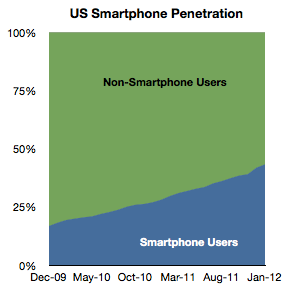
    Overall, penetration of the sampled population (above age of 13, primary phone and excluding business purchases in the US) reached 43.3% in January. The increase was 1.45 points from December.

    A significant 35 million US users  switched to smartphones in the last 12 months, equivalent to 15% of the user population. My current forecast is that 50% of the user base would be smartphone users by June 28th.

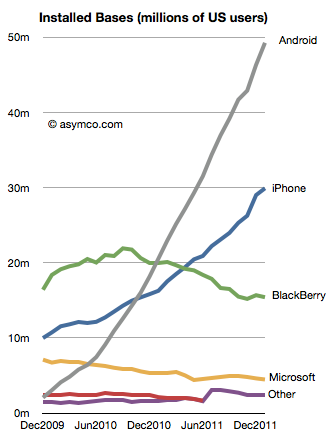
    The platform data shows a continuing pattern. In terms of absolute users Android has reached nearly 50 million users, iPhone 30 million, BlackBerry 15 million and Microsoft (Windows Phone and Windows Mobile combined) 4.5 million.

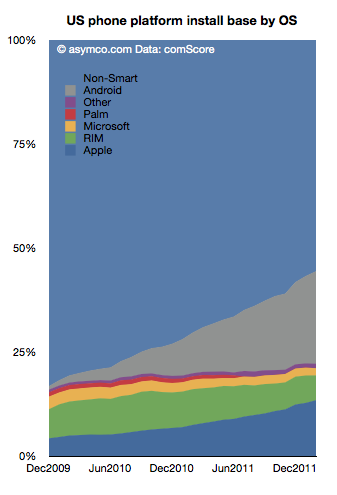
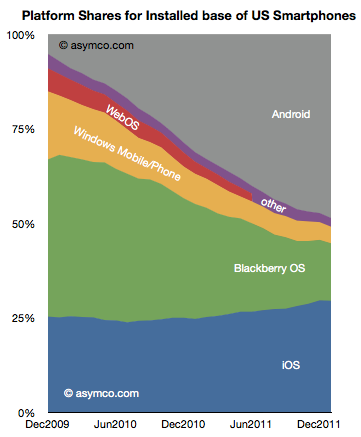
    In terms of market share of the smartphone population, the various platforms stack up as follows:

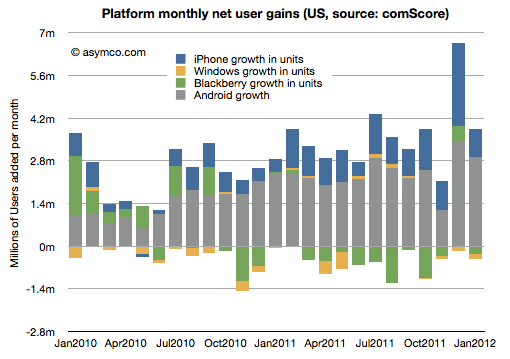
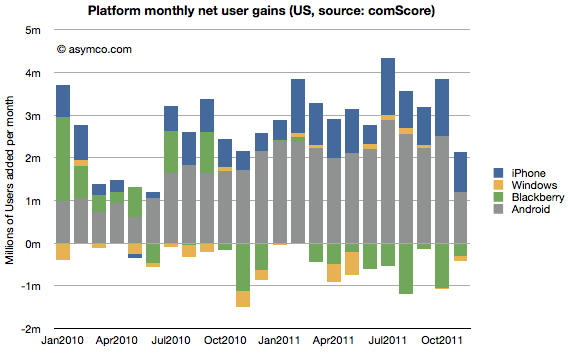
    The net gains for each platform by month are shown in the following diagram:

    RIM and Microsoft have continued to lose users while Google and Apple have continued to gain.

    The two trends that continue are that overall penetration is nearing saturation and that two platforms seem to be increasing their share of that base. The "comeback story" for any of the hopefuls will depend either on switching users away from their current platforms of trying to engage with late adopters. The first option is daunting due to latent network effects related to platforms and the second sounds to be symmetric to existing incumbent strategies.

    Without an asymmetric approach, the challengers are unlikely to succeed.

  4. The curious case of slowing US growth for Android

    Research · 158 comments

    The latest data from comScore MobiLens is showing an uncharacteristic slowing in smartphone growth. In the survey period ending November, the number of smartphone users in the US was 91.4 million. This is equivalent to 39.1% penetration, an increase of 0.6% (i.e. up from 38.5% in the last period.)

    The growth is equivalent to 1.4 million new smartphone users (i.e. users who switched from a non-smart device for the first time.) The problem is that this is half the growth of the previous period. The following chart shows the growth as the weekly add rate.

    As you can see, the growth has fallen to a level not seen since 2010. The cause may be seasonal as last November was also a slow month. I added a three month moving average which shows that although there seems to be seasonality, the last period did not show the peak of previous periods.

    To better understand what happened, I looked at the performance by platform. The following chart shows the net user gains by platform.

    What appears immediately is that Android growth was the primary cause of a change in the pattern. The iPhone grew slightly more slowly sequentially but the difference between November and previous periods is not great (941k adds vs. an average of 904k over the previous 12 months.) BlackBerry moderated its losses and Windows is quite a small influence on the market.

    Android gain was 1.2 million vs a trailing twelve months' average of 2.24 million. Android's slowing in the US is significant.

    We also have access to additional data from Google themselves. We had an update that showed that by late November there were 200 million Android devices activated. We also had an update from mid October of 190 million activations. That makes the increase in activations of at least 10 million during the same period that comScore was measuring the US.

    comScore's increase in Android users of 1.2 million then becomes even more interesting. It implies that the US consumers were responsible for no more than 12% of Android activations in the November time frame.

    Furthermore we can derive from comScore's data the total devices in use in the US by platform: the figure for Android is 42.9 million (46.9% of 91.4 million smartphones in use). By the end of November, the total activations from Android adds up to about 204 million. Excluding some devices which may be out of use, we can estimate that about 20% of all active Android phones are in use in the US. Conversely 80% of Android devices are in use outside the US.

    This means that the US share of Android activations is decreasing. From a cumulative average of 20% to a recent 12%.

    So the mystery of what caused the slowing in Android (and hence in all smartphones) in the US remains. Seasonal effects would affect all platforms equally and that is not the case. I'm not comfortable ascribing a cause until we hear more evidence and the pattern is more established. But something does seem to be happening.

    [Update: The source data is available here. Note:  multiple tabs.]

  5. How many iPhones are being discarded in the US?

    Research · 83 comments

    In the recently posted US Smartphone Landscape I used comScore's data to paint a picture of the growth of smartphones in general and the shape of the mobile platforms in the US. The source was survey data measuring the installed base. If we compare the installed base sequentially, we can get the increase (or decrease) of a particular platform. Comscore reports monthly but we can also summarize the data at a quarter-by-quarter basis.

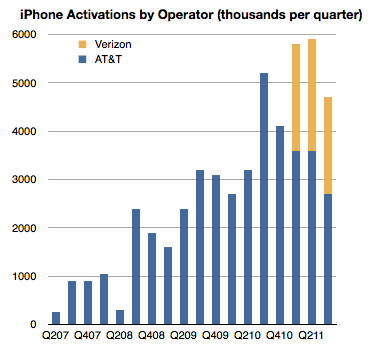
    There is another source however for the US market, at least for the iPhone: operator activations. They report iPhone activations, shown below.

    Can we use activations together with installed base data to learn something about the market? Yes, with some caveats.

    First, it should be noted that install base should account for all sorts of devices. They could be new, old or hand-me-downs or purchased used. Changes in install base would come from addition of new devices but also from devices being discarded and users leaving the platform. Activations on the other hand include units new units but also those which have been re-activated after initial sale because they were either sold or given to other users. As far as I know operators do not report "net" activations so lost users are not included.

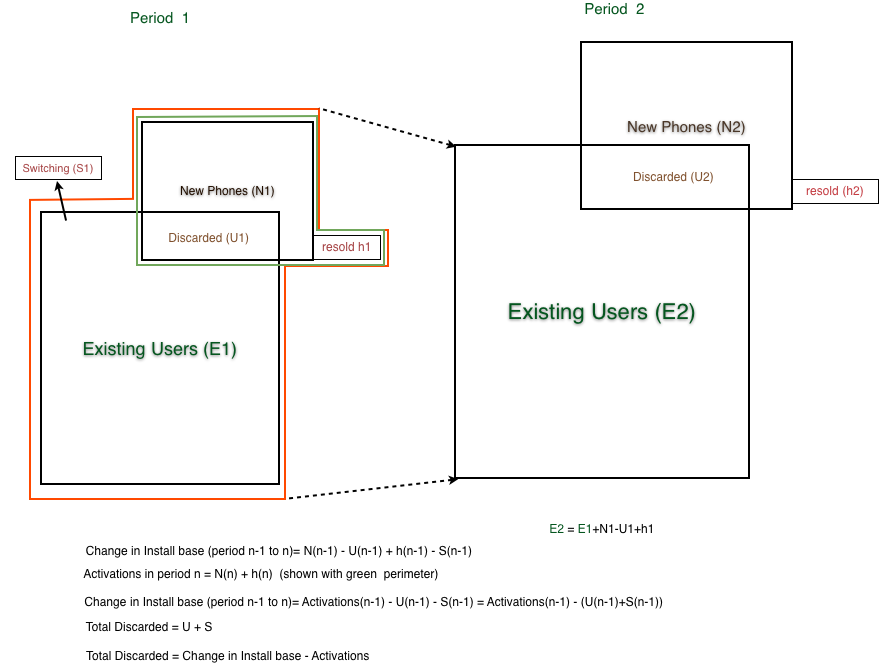
    When the formulas are combined[1], what we get is the change in installed base is equal to Activations minus "discarded" iPhone, where "discarded" are both iPhones put aside in favor of a new iPhone or put aside in favor of another phone.

    Since we have installed base change data and we have activation data we should be thus able to derive the number of iPhones being "discarded" or put out of use every quarter as the difference between activations and change in installed base.

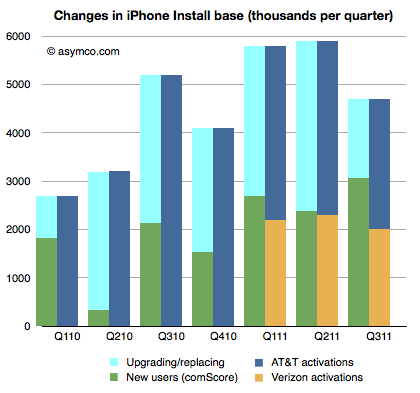
    That allows the following chart to be built:

    The green, dark blue and orange areas are given inputs and the light blue area representing discarded phones is derived.

    This is an interesting (new) piece of information. What it suggests is that at least in the US the discard rate, i.e. number of phones being discarded over number of new phones is about 50% (56% on average over seven quarters.)

    It's a rate I find surprising because I expected more of the phones to be re-used. But more surprising is that it leads to some surprising and possibly implausible behavior at AT&T.

    If you look at the last three quarters, you can see that Verizon activations are very nearly equal to the increase in install base. As all Verizon users are new, they are certainly not replacing iPhones, so the green bars next to the yellow bars imply that all those new users are Verizon users. But that means that all the activations through AT&T were to replace existing phones and that AT&T only added a bit more than one million iPhone users in nine months.

    In quarters prior to Verizon's launch, the AT&T discard rate was a modest 60% on average and after Verizon launch it went to 81%.

    What does it mean?

    ---

    Note:

    1. The following diagram shows the derivation of "discarded" units.


  6. Biggest mobile loser? The non-smart phone

    Research · 19 comments

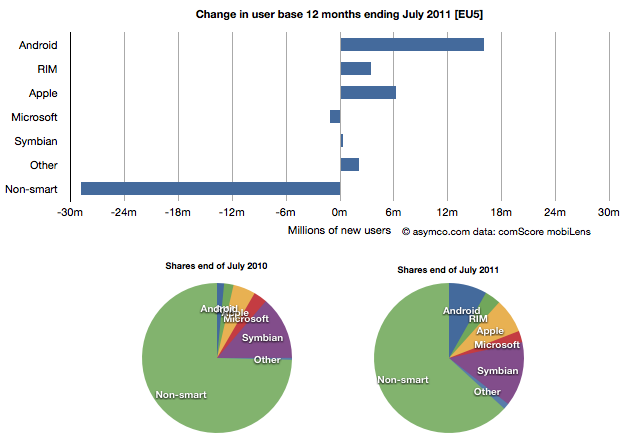
    Yesterday comScore published survey results for EU5 (France, Germany, Italy, Spain, UK) on smartphone use and installed base. The headline is very similar to what would be written about the US: Android had phenomenal growth over the last twelve months. I also noted that the apparent growth of Google (16.2% share change) seemed to be matched by an apparent decline of Symbian (-16.1% share change.) However the reading of the data is not so simple.

    In order to understand what has happened to usage, it's much more valuable to look at consumption and the actual number of users rather than change in share of a subset of the market. Consider the following charts:

    The bar chart shows that three platforms gained users in the last year (ending July) and that there were negligible losses in users by others. Negligible except for non-smart phones. A remarkable 29 million users moved from non-smart phones to smartphones. Those switchers switched into Android (16 million), iPhones (6.3 million) and RIM (3.4 million). Symbian even gained about 330k users. Microsoft lost about 1 million but its platform has not been actively promoted in that time.

    When seen as a pie chart, you can see how the usage shifted from non-smart to smart even more clearly. It does not appear that Android took share from Symbian at all. Android took share from non-smartphones. The table in the link from comScore leads one to conclude otherwise.

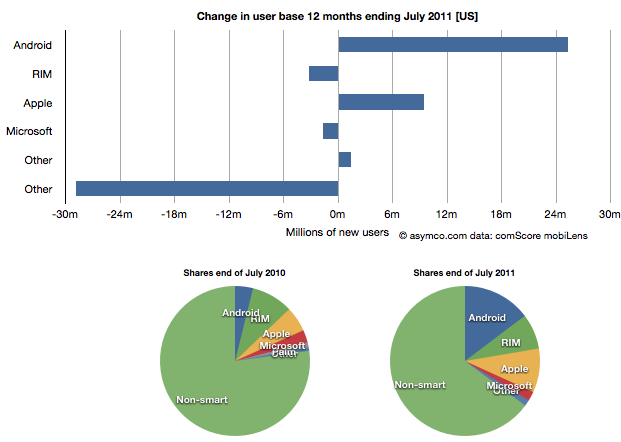
    I took the same approach to look at the US data (also from comScore). It shows a similar pattern.

    In the US, RIM was a net usage loser but its losses also paled to the losses of non-smart devices. In comparing with EU5 the pattern is very similar.

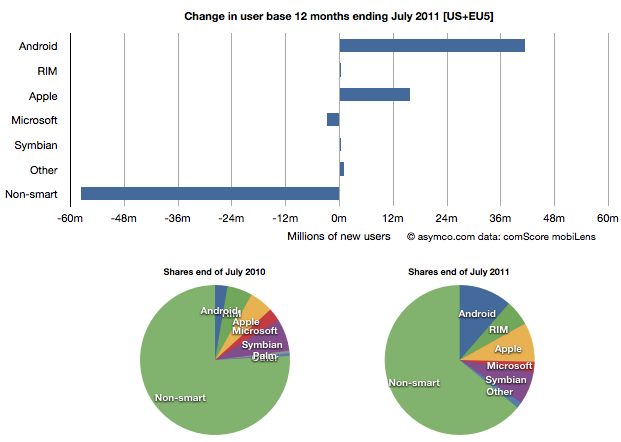
    I then combined the EU5 and US data and provided a view into the combined markets (note scale change from previous two charts.)

    This shows the change in platform phones more or less being from non-smart to Android and iPhones. The total population is 470 million people--not insignificant. The total number of non-smart devices abandoned is nearly 60 million in one year, which equals the total number of new smartphone users. That's 12% of most of the developed world switching in one year. If this keeps up, the "tipping point" when smartphones will outnumber non-smart phones in use in these large markets will be in another year.

    In terms of sales rate, the tipping point has already happened. Sales of smartphones crossed over in the US and Europe several quarters ago (November 2010 in EU5) and the trend is accelerating. Furthermore, if patterns of mobile technology adoption repeat as they have for the last two decades, emerging markets will follow in two to three years.

    This tipping point observation has been repeated on this site a number of times when reflecting on the data in the US. Now it's becoming clear that the same pattern has been underway in Europe as well.

    The big picture from the survey data is just how vast the demand for smartphones is. Some platforms are benefiting more than others in terms of share of growth, but the biggest mobile loser is clearly the non-smart phone. Not only is it an unprofitable product for almost every vendor, it is also being increasingly shunned by buyers.

    At the same time, at 450 million users we're still only looking at less than 10% of the market. As this pattern spreads globally the platform install bases will be measured in the billions of users.

  7. Verizon back at bat: Revisiting the last inning

    Research · 69 comments

    A month ago I wrote an exposé on the problems I felt Verizon was facing with their smartphone strategy: Verizon Strikes Out in Smartphones [Updated]

    Given new information on subscriber growth and the relationship between Verizon and Apple, it's time to look back and assess how the conclusions are standing up.

    The conclusions I drew were that Verizon had three strikes against them:

    1. The iPhone has stolen their growth
    2. They are facing the prospect of a single OS platform supplier
    3. Android is not competitive vs. iOS

    Did iPhone really hurt Verizon?

    I pointed out that based on retail sampling data from ITG and what we know from AT&T own sales data, that iPhone at AT&T was outselling Android at Verizon by a ratio of 2.5 to 1.

    The latest comScore data closely matches the assumed units of Android shipped by Verizon. Here's why: The comScore data shows the number of active users of each platform. So, for example, as the number of Android users at Verizon grew, it follows that the new users had to buy new Android phones. However, you can also sell more phones than just those for new users. Some phones are going to go to replace those of existing users.

    When it comes to Android however, all the Verizon Android devices are pretty new, having been purchased less than a year ago. Replacements would only be sold for damaged or lost devices not covered by warranty.

    So from comScore the change in subs at Verizon comes out to about 2.2 million and my original estimate was about 2 million. That's pretty close.

    On the other hand, if you look at the chart, you'll notice that the number of iPhone users at AT&T grew by a similar amount (about 2 million). However, AT&T activated over 5 million. That means that about 3 million devices were upgrades. This makes a lot of sense since we know that iPhone is the bulk of AT&T smartphone users.

    This is highly supportive evidence that iPhone at AT&T did indeed outsell Verizon Android by at least a factor of 2. Each of those phones came with a 2 year lock-in so indeed AT&T did manage to "steal" growth from Verizon.

    Another data point in support of this conclusion was provided by Turley Muller in a comment.  AT&T smartphones make up a significantly higher proportion of contract subs at 44% vs Verizon at 23%. Effectively, as a result of their sweetheart deal with Apple, AT&T got double the penetration of smartphones than Verizon since these devices are targeted only to contract subscribers. Those are high ARPU customers that either moved from regular voice plans or switched from other carriers.

    So far, the first conclusion seems to be holding up pretty well.

    Was Android a strategic constraint to Verizon?

    Verizon revealed that they had been negotiating with Apple at least since 2008 and that they were testing the phone for a year. This is not as big a surprise as it may seem. Deals of this kind easily gestate for years. The commitment may not be made until the last minute.

    Nevertheless, my point was about the fact that Android was making up to 75% of Verizon's smartphone volume in Q3. This might be a strategic constraint. But "so what?" you may say: AT&T's dependance on iPhone was even greater.

    That's precisely my point though. As we've seen with the shift by Apple to multi-carrier distribution, AT&T is now facing serious constraints on growth and the share price is suffering. Although Verizon did not deal with Google as a direct supplier, they were at risk of having much of the IP on their network at least orchestrated by a company that was not always aligned with their strategic goals. Much the same predicament AT&T is facing now.

    The tale of AT&T and iPhone does lend support to the premise that Verizon felt a bit too constrained by Android hegemony on its network.

    Is Android Competitive with iOS?

    This last point was supported by the data showing a widening higher sell-through rate for iOS vs. Android on comparable addressable markets. Although the data has been confirmed with survey data, there are issues with this interpretation. First, because the addressable base for iPhone is higher at AT&T with the post-paid contracts being more popular there, iPhone had an easier time getting sold. Second, because 3/5 of the phones were upgrades.

    The jury is still out but the apparent pent-up demand (admittedly anecdotal) for iPhone on Verizon does seem to show that given similar pricing, and a similar demographic/geographic addressable market, people do prefer the iPhone.
  8. For every AT&T Android user there are 15 iPhone users: What will be the ratio at Verizon?

    Research · 103 comments

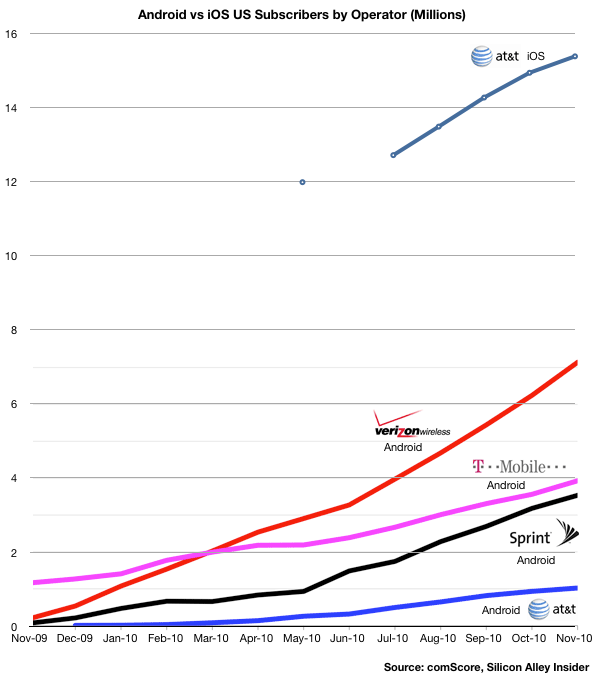
    The following chart uses comScore data to show the relative consumption of Android vs. iOS by the subscribers of the four major US operators. I modified an original chart published by Silicon Alley Insider.

    A few observations:

    • As of November, the ratio of iOS to Android users was more than 15 to 1 at AT&T.
    • iOS at AT&T has twice the users as Android at Verizon
    • Although T-Mobile had the Android franchise to itself for all of 2009, it was overtaken by Verizon within four months
    • T-Mobile Android consumption has also been nearly matched by Sprint within a year

    The rapid eclipse of T-Mobile smartphone penetration makes one wonder how effective Android is as a differentiator for carrier and device vendor alike. It also explains their new pricing model.

    The data also gives clues to how iOS at Verizon will grow.

    Since Verizon and AT&T have nearly the same number of subscribers, excluding RIM ,which is common to both, AT&T has a far larger penetration of smartphones (16.5 million vs. 7 million.) Is the cause iOS itself or the delay with the timing of Android launch at Verizon?

    Other data from comScore shows that much of the gains for Android at Verizon have been at the cost of RIM, so Android has not been entirely additive. Will there be a similar platform switching going on or will iOS be additive to the Android base?

    On one hand, the potential exists for a similar number of touch smartphone users at Verizon as at AT&T (15 million as of November). On the other, Verizon is "half-penetrated" with Android. How many will switch (as they did with RIM) and how many will be new users?

    I'm not going to make any predictions yet but I would not be surprised if Android at Verizon will flatline if not drop while iOS at Verizon will jump quickly to make the sum of both equal to AT&T iOS in about twelve months. That would imply about 10 million new Verizon iOS users by 2012.

    If Verizon users start to switch from Android to iOS, iOS could add as much as 15 million users. It seems that 10 to 13 is a reasonable estimate.

  9. Nearly 75% of iPhones are in use outside the US

    Research · 29 comments

    comScore reported that 15.4 million iPhones were in use in the US as of November. (25% share of 61.5 million total smartphones.)

    We also know that about 75 million iPhones were sold by November since the product launched. With about 17 million units older than two years, and assuming that half of those might still be in use and that all the iPhones less than 2 years old are still in use, we get an upper bound of 66.5 million iPhones in use globally.

    That means 23% of all iPhones are in use in the US and that 77% are in use outside the US.

    Can this be verified?

    The sell-through data we have supports a slightly lower figure.

    October 2010: 63 percent of iPhones were sold outside the US in Q3

    April 2010: Non-US iPhone sales approaching 70% of volumes

    This might indicate that comScore surveys under-represent the iPhone or that device attrition/retirement is significant. However, the data does seem to imply that the US is no more than one third and perhaps as little as one quarter of the iPhone's user base. Perhaps with Verizon, that figure will grow. But at the same time, new international markets (like China) may continue to outgrow the US.

    The 4:1 split could continue. After all, the US represents only 234 million out of about 5 billion mobile phone users globally--a mere 4.7%.

  10. Half of US population to use smartphones by end of 2011: Update

    Research · 10 comments

    Half of US population to use smartphones by end of 2011 | asymco.

    A month ago ComScore reported that in October 2010 25% of Americans above the age of 13 used smartphones. The latest report shows that share to have risen to 26.3%.

    That means there are 24 percentage points of penetration to go until the majority of Americans are smartphone users. In absolute numbers this implies about 56 million additional users (and hence units sold).

    The rate of penetration growth was 1.3 percentage points per month. Assuming no acceleration in this figure and assuming we rely on ComScore (vs. Nielsen which reports higher figures) then majority share is 18 months away, or mid-2012.

    However, assuming some acceleration and a different sampling method, I still believe that we could see this figure by end of this year.

    In either case the tipping point is near.

  11. Half of US population to use smartphones by end of 2011

    Research · 35 comments

    60.7 million people in the U.S. owned smartphones during the three months ending in October, up 14 percent from the preceding three month period, representing 1 out of every 4 mobile subscribers.[...] Despite losing share to Android, most smartphone platforms continue to gain subscribers as the smartphone market overall continues to grow.

    via comScore Reports October 2010 U.S. Mobile Subscriber Market Share - comScore, Inc.

    Separately, Nielsen reports on the same market:

    29.7 percent of U.S. mobile subscribers now own smartphones that run full operating systems.

    The most popular smartphones are the Apple iPhone and RIM Blackberry, which are caught in a statistical dead heat with 27 percent of smartphone market share in the U.S. Twenty-two percent of smartphone owners have devices with the Android operating system.

    via U.S. Smartphone Battle Heats Up: Which is the “Most Desired” Operating System? | Nielsen Wire.

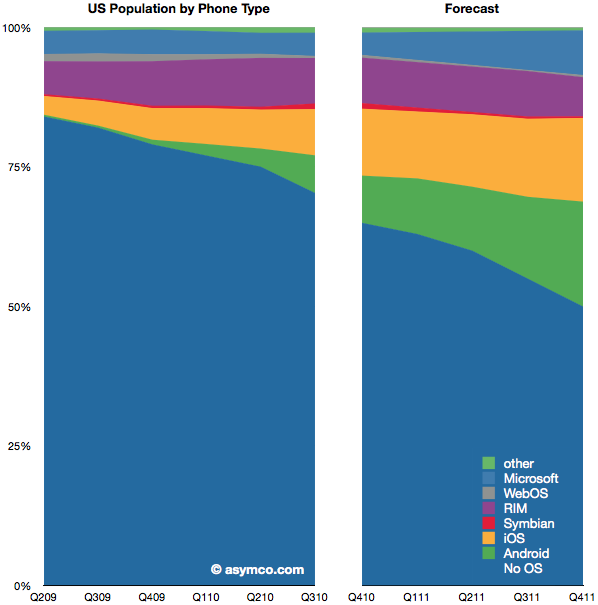
    I've been tracking the Nielsen data and using it as a basis for forecasting the penetration of smartphones. While most coverage of this data focuses on splits between current OS platforms, I will look at competition with non-consumption and the impact on operator services.

    The chart on the left shows the historic penetration of smartphones since mid-2009 based on Nielsen's reports. The chart on the right is my forecast. This is an update from the last quarter's chart here. My forecast was fairly accurate with respect to platform shares in the last quarter so I've had to make only small adjustments and extended the forecast one quarter further out. [1]

    If my forecast is correct, smartphones will make up 50% of all phones in use by the end of 2011. That's up from nearly 30% today and 18% a year ago.

    One in three of all phones in use will be either iOS or Android. That adds up to about 80 million users; up from 35 million today. Overall, 120 million Americans will be using smartphones.

    Now consider the consequences for how services are delivered by operators. The most popular product operators will be selling will be unlimited data plans. One year hence, by 2012, unlimited data plans may become the largest service revenue generator for mobile operators in the US. Pricing and competition will inevitably be in a state of extreme flux. I leave the consequences to the imagination of the reader.

    ---

    [1] Note that the charts show share of phones in use, not phones sold in a particular point in time. In other words, this is measuring platform consumption, not units sold.