Asymco

Asymmetric Intelligence

consensus

  1. Apple management answers questions on the market performance of Apple Watch

    Research · 10 comments

    Katy Huberty (Analyst - Morgan Stanley): You've said in the past that the watch may take longer to ramp given the new category and new interface to customers. Is that, in fact, playing out? Is the watch ramping slower than past product categories?

    Tim Cook (CEO): Katy, when you use the word ramp, do you mean from a -- I assume you're talking about supply?

    Katy Huberty (Analyst - Morgan Stanley): Yes. Pre-orders and first week in sales and any other data points that you track in terms of interest versus, say, when the iPad launched in 2010?

    Tim Cook (CEO): Let me talk about supply and demand and sort of separate those two. Right now demand is greater than supply. And so we are working hard to remedy that. ((This is still true today, three months later))

    We've made progress over the last week or so and we're able to deliver more customers an Apple Watch over the weekend than we had initially anticipated. We're going to keep doing that. […] So I'm generally happy that the -- that we're moving on with the ramp.

    It is a new product for us, and with any kind of new product, you wind up taking some time to fully ramp.

    Having said that, I think we're in a good position. And by some time in late June, we currently anticipate being in a position that we could begin to sell the Apple Watch in additional countries. And so that's our current plan. ((This has been achieved according to plan.))

    From a demand point of view, it's hard to gauge when you don't have product in stores and so forth. And so we're filling orders completely online at the moment.

    The customer response from people that have gotten theirs over the weekend have been overwhelmingly positive. And we're far ahead of where we expected to be from an application point of view.

    To give you a comparison, when we launched the iPhone we had about 500 apps that were ready. When we launched iPad, we had about 1,000. And so our internal goal was to be able to beat the 1,000 level and we felt -- we thought it would be great if we were able to do that by a little bit.

    And as I've mentioned before, we now have over 3,500 apps in the App Store for the Watch. And so we couldn't be happier about how things are going from that point of view.

    We are learning quickly about customer preferences between the different configurations. There's a much larger breadth of possibilities here for customers than in our other products. And in some cases, we called that well and some cases we're making adjustments to get in line with demand.

    But I'm really confident that this is something we really understand how to do and will do. And so I'm really happy where we are currently and happy enough that we're looking forward to expanding into more countries in late June.

    […]

    Gene Munster (Analyst - Piper Jaffray and Co.):  …question for Luca, in terms of any thoughts on what the margin impact from the Watch as that ramps over the next couple of years?

    Luca Maestri (CFO): Apple Watch is, not only a new product, but it's a brand new category with a lot of new features, a lot of new innovative technologies. And Apple Watch margins will be lower than the Company average.

    […]

    Toni Sacconaghi (Analyst - Bernstein): I just wanted to revisit the watch.

    Tim, I think you said when you were talking about your new products, you said we're, quote, very happy with the reception. And in response to a previous answer you said, relative to demand, it's hard to gauge with no product in the stores.

    I would say relative to other product launches where your commentary around demand was characterized by superlative after superlative, that assessment feels very modest. And part of the reason that I ask is, A, are we reading you right in terms of that? But if we look at consensus, consensus is expecting that Apple will ship more watches in its first two quarters than it did iPads, despite, as you said, very limited distribution in terms of only selling through your stores.

    So I'm wondering if you can talk a little bit about putting those demand comments in context, given that they do seem different from how you've characterized product demand for other products. And how, if at all, we should think about the modeling demand in the context perhaps of the iPad, which was your most recent significant new category? And then I have a follow-up, please.

    Tim Cook (CEO): I'm thrilled with it, Toni. So I don't want you to read anything I'm saying any way other than that. So I'm not sure how to say that any clearer than that.

    And in any situation, whether it's the watch or in the past on iPad or on iPhone, when demand is much greater than supply, it's difficult to gauge exactly what it is. And so, as you know, we don't make long term forecasts on here. We maybe forecasts for the current quarter. And so I don't want to make any comment about the consensus numbers.

    Honestly, I haven't even studied those. We've got enough to think about here.

    I feel really great about it. The customer response, literally from what I've seen, is close to 100% positive. And so it's hard to imagine it being better.

    -------

    Excerpts from Apple Earnings Report: Q2 2015 Conference Call Transcript, April 27, 2015.

  2. Apple's commoditization discount

    Research · 81 comments

    When asked where Apple's growth will come from, most analysts or observers will cite new products. As long as there are new products, then there is growth. Conversely, if there are no new products, then there will be no growth. This is such a commonly held belief that it's axiomatic: Apple is being valued based on short-term foreseeable growth.

    To be more precise, analysts value the wave of growth of every new product and heavily discount the post-growth phase assuming commoditization. There is no value assigned to Apple for extending market reach to the mass market.

    Consider: Analysts currently forecast an operating income (or EBIT) of $43.3bn for 2012 and $49.7bn for 2013. That implies growth of 28% in 2012 and 15% in 2013. These growth rates are modest in light of Apple's recent historic growth and especially 84% in 2011 on EBIT level. Much of this growth has been due to iPhone which quickly captured 4% market share in four years. To suggest 15% growth in 2013 is to suggest that Apple will not increase its phone market share by an appreciable amount. The implicit assumption in that growth figure alone is that Apple will remain a niche player.

    Bear in mind that 15% growth is so low as to be half the the growth in the Mac business and below the likely growth in the overall phone market. Considering the risk premium on equities, this growth forecast assumes essentially a no growth scenario. But even with no growth, Apple's cash flows are huge and thus they should add up to some significant present value. Since we know the value as reflected in the current price, we can work backwards to determine the discount rate being applied to those future flows. In other words, we can calculate how risky Apple's existing product cash flows are seen to be.

    Based on  assumptions originating from analysts' consensus, we can construct a simple model that will approximate the discount the stock market puts on Apple's future cash flows. Let's have a look at an adjusted Gordon or dividend discount valuation model on EBIT basis:

    Shares are valued based on the projected future cash flows of a company. Discounting EBIT with Weighted Average Cost of Capital and subtracting growth will yield enterprise value (= market capitalization - cash).

    Applying analysts’ assumption of close to zero growth to Apple's post 2012 EBIT means EBIT stays constant for 2013 and beyond. Let’s solve for the implied capital costs. Right away we can eliminate growth (g) as it equals zero. EBIT reflects operating cash flow since in a zero growth scenario CapEx will equal deprecation and there are no changes in net working capital. As Apple has no debt but a cash surplus, WACC will be equal to cost of equity[1].

    Solving for capital cost (WACC) with available analysts' EBIT estimates reveals a discount rate of 15%.

    But let’s remember that analysts have consistently and by a large margin missed Apple's financial performance. So let’s dial in a more aggressive estimate of around $56bn of EBIT for the fiscal year 2012. The discount rate goes up to 19% and implies an EBIT multiple of 5.3x.

    In other words, Apple's cash flows for a zero growth scenario are being discounted at a rate of 15% to 19%. This places the company in an extremely risky category of investment. It is certainly not something that can be categorized as a value stock.

    The discussions on this blog regarding Apple’s valuation have been insightful, but only danced around the triangle of price, earnings and growth. When the growth forecasts are considered vis-a-vis current pricing, the assumptions built into 'consensus' forecasts for Apple are condemnations of the company.

    They present a view of a company that is extremely vulnerable and can neither preserve its current cash flows nor find new sources of growth. It is, quite plainly, a company doomed to commoditization.

    ---

    Notes:

    1. Or one can even assume that cash has a positive effect lowering costs of equity (less indirect bankruptcy costs).
  3. Who is being reasonable now?

    Research · 49 comments

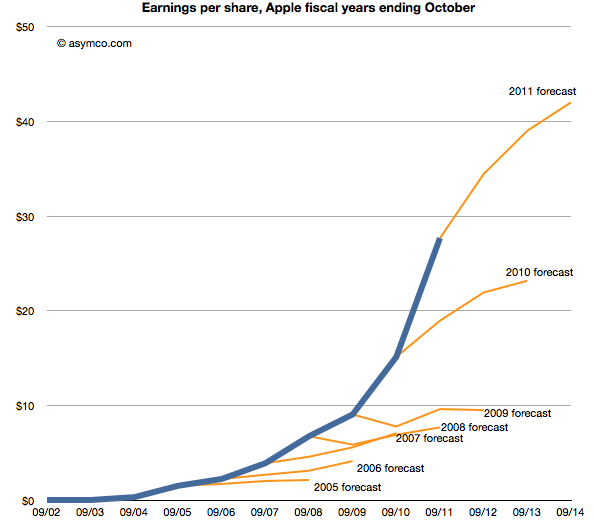
    Last week Horace wrote about the apparent "reasonableness" of analyst Apple estimates. He explained how the consensus for Apple's growth was always deeply pessimistic because its performance could be argued to be anomalous. It was just too good to be true. We reproduce the chart here:

    The estimates look like characteristic "tell-tales" of a company running strong into the wind.

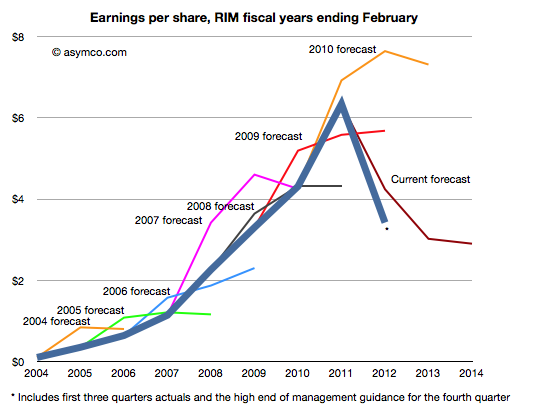
    This conservatism in the face of rapid growth sounds "reasonable" but is it always practiced? And what about the ability of this conservative strategy to predict dramatic changes in growth? To test, we started to look at the predictions for RIM. RIM has also enjoyed strong growth over a similar time frame as Apple. How did analysts predict its performance? The following chart was prepared using the same technique as the one for Apple[1].

    Surprisingly, the "tell-tales" look very different.[2] For every year we looked at the first year estimates were over-optimistic with a decline expected after one or two years. This pattern is remarkably consistent within the RIM data and remarkably inconsistent when compared to Apple.

    It's as if there was nothing in common with the methods used. This is perhaps appropriate, but the "quality" of predictions are not much better. With RIM they were too optimistic in the short term and too pessimistic in the medium term. With Apple they were far too pessimistic consistently.

    More worrisome, the 2010 forecast did not offer any hint of the dramatic decline which followed only a few months later. And after three quarters of really bad news, the consensus is still higher than what will likely happen (ensuring an uninterrupted string "misses").

    The study of these two companies' forecasts is a study in contrasts. We can say that the forecasting is disturbingly consistently inaccurate but we can also say that there seems to have been a bias of pessimism for Apple and optimism for RIM. We can only guess at the cause, but the consistency of bias points to something institutional.

    ---

    Notes:

    1. The three year forecast consensus (sourced from Bloomberg) was sampled one month following the end of each fiscal year. This should offer the analyst enough time digest the year passed and deeply contemplate the future.
    2. If we may stretch the analogy, these are indicative of an imminent stall.


  4. Why Apple is cheap

    Research · 186 comments

    Imagine it's late 2005. Apple's fiscal year just ended and they reported their performance. You're an analyst whose job includes forecasting the company's performance for next year. This is a weighty responsibility.  Your forecast will be blended with those of your peers and used as a "consensus" average. That consensus for the next year will be used to measure the current value of the shares in a ratio called the forward PEG or Price/Earnings/annual earnings Growth. You are supplying the earnings and hence growth forecast while the market offers a price.  As a stock is meant to measure future earnings, your forecast is a crucial and frequently cited figure about whether a stock is priced fairly.

    There is some comfort in knowing that there will be many others who will offer such a forecast and your contribution is thus not the only way investors can calibrate the price. However, you should think hard about what you are predicting as it also will reflect your skill in predicting such a visible company.

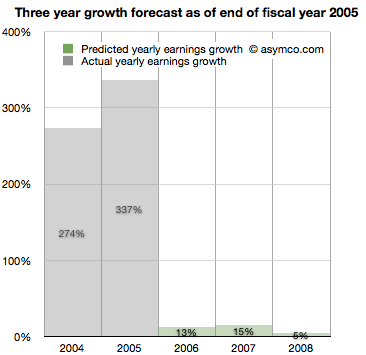
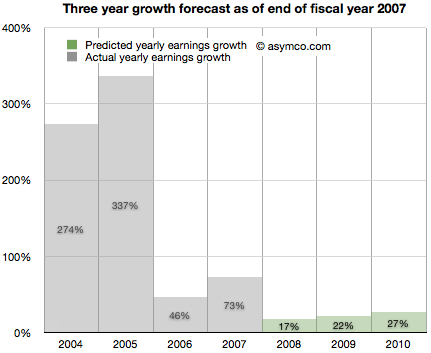
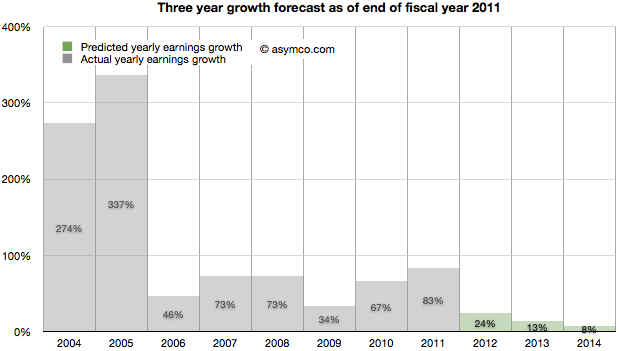
    Apple just had a tremendous two years. 2004 and 2005 saw EPS grow at 274% and 337%. This is largely due to the runaway hit iPod. Given all that is known about the company, what will you put forward? While you're at it can you also forecast two years forward, namely provide a growth forecast for 2006, 2007 and 2008?

    Here is what you and your cohorts publish as a consensus:

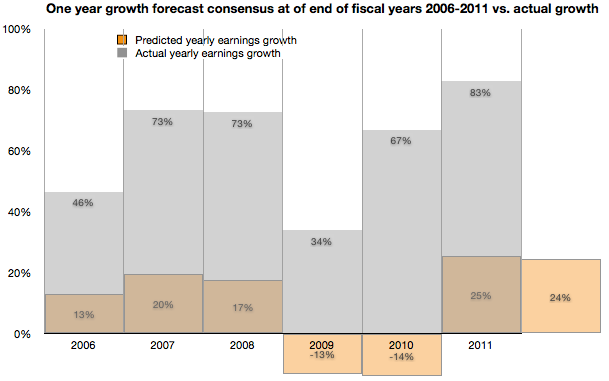
    You go with a 13% growth for 2006,  15% for 2007 and 5% for 2008. The chances are, you reason, that the iPod will not carry the company's growth much longer. The competition is sprouting all over and Microsoft is rumored to be launching its own music player.

    It makes sense to be conservative and offer a modest growth of 13%. At the same time you can rate the stock a buy as it is still growing. The stock just doubled in the last 12 months and the law of large numbers says that growth cannot last at the same rate as we've just seen.


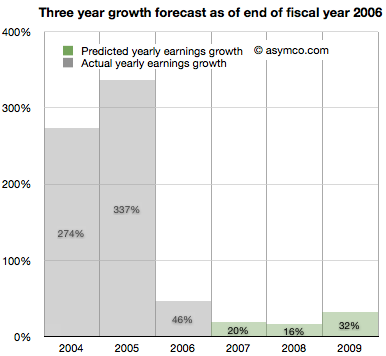
    It's now late 2006. Apple just closed out another big year. Contrary to your forecast last year, the company grew at a rate of 46%, more than three times faster than you expected.

    It turns out the iPod still has some legs and the company's Mac business seems to be growing. Looking forward you take your 15% growth for 2007 and increase it to 20% and suggest 16% for 2008 and 32% for 2009.

    There are rumors of Apple getting into the phone business.


    It's now late 2007. Apple just launched the iPhone and even though it was available in limited numbers on one carrier for one full quarter, the company still turned in an amazing 73%. Again more than three times faster growth than you forecast. What do you do about 2008?

    It might make sense to increase the previous 16% estimate to 17% but since there is a real estate bubble brewing, the 32% growth for 2009 should come down to 22% and defer that growth out to 2010, dialing in 27%.

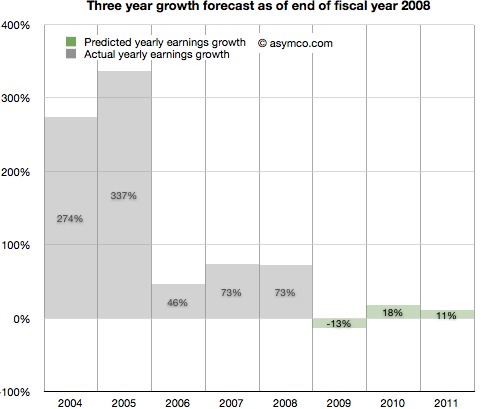
    It's now late 2008. Apple closed out another huge year. 73% growth was once again more than triple your forecast of 17% growth. It's clear that the iPhone is a huge hit.

    However, there is a credit crunch and talk of a huge recession, even depression looming. Apple is a luxury/premium brand and it is unlikely that those expensive products will sell well into these "macro headwinds". You predict a decline in the earnings of 13% in 2009, inline with many other tech stocks. You are optimistic however that 2010 will be a year of recovery and predict 18% increase from recession lows followed by a more reasonable 11% growth in 2011.

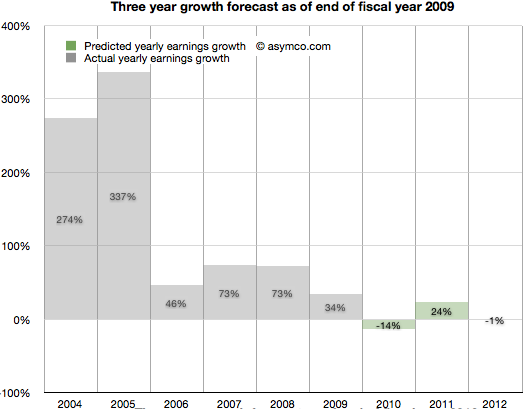
    It's now late 2009. To everyone's surprise, Apple grew through the credit crisis. It turned in 34% growth (vs. your predicted 13% decline). The success is hard to believe but the iPhone had a lot to do with that. There are new competitors coming and the recession has proven resilient. With unemployment still high you predict 2010 will still be a tough year. You go with -14% growth for 2010 and postpone recovery out to 2011 with 24% "bounce". Longer term you see 2012 as a flat year, with Apple earnings shrinking slightly by 1%.

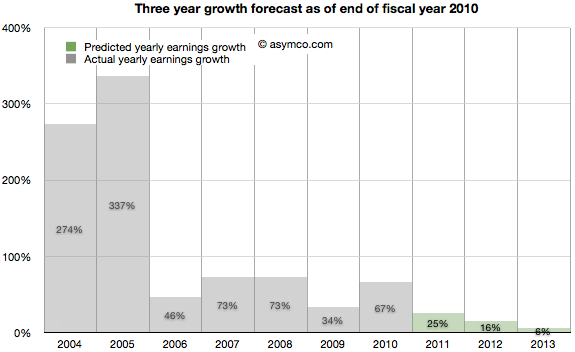
    2010 ends with Apple achieving 67% growth. Shocking relative to a -14% growth forecast. But then again, Apple launched the iPad and who could have thought that was a hit? Apple achieved growth throughout the recession and it looks like it might keep going. Your 2011 forecast of 24% looks weak so you increase it to 25%. The 2012 decline thesis is abandoned in favor of 16% growth and, given the likely competition in smartphones, you tone down growth in 2013 to 6%.

    It's November 2011. The company turned in 83% growth. It's  more than three times faster than your forecast. Some people are suggesting that Apple may have a lot of headroom with the iPhone and iPad but the law of large numbers is what it is. The company became the largest by market cap in the world and Android is gaining huge market share. However, in deference to their strong recent performance you increase the 2012 forecast from 16% growth to 24% growth. 2013 goes from 6% to more than double: 13% and 2014 is when growth begins to slacken, though still a healthy 8%.

    As the following chart shows, look ahead one year accuracy has not been all that great, but you are at least consistent. In any case, everything you based your decisions on showed remarkable consistency with consensus. You're just reflecting common sense.

    Note:

    • Though the numbers are all real, the narrative is fictitious. I suspect however that the truth is actually stranger than this fiction.
  5. More media tablet hype

    Research · 66 comments

    The iPad is still only slightly more than a year and a half old. Forecasting unit volumes has proven very difficult. But more than that it's proven very difficult to appreciate the impact on the market it's disrupting, PCs.

    For some people this is obvious, but what if you don't live and breathe disruptive theory? What if you don't watch every data source like a hawk for hints of change? What if you are not even a technologist. How would you form an opinion on the effect of the iPad on PCs?

    There are many industries and sectors about which I know nothing. If you asked me to analyze a market like industrial lubricants, I'd probably start by reading the consensus opinion put forward by the leading market analyst, an expert in that particular sector. That would form the baseline.

    In the PC sector, that opinion is formed by Gartner (and IDC and Forrester perhaps). Gartner will get a lot of citations and its stats and opinion forms the baseline view. It may not be right, but we can expect it to be the "consensus". This is because Gartner surveys a lot of data and interacts with a lot of insiders in the industry. They collect and weigh these inputs and put out what is likely to balance them all.

    If Gartner says that the iPad is a "media tablet" that is not a PC they may be wrong. But they are also repeating what the PC industry is saying. So I value Gartner as a reflection of the consensus. If there is a significant gap between Gartner and what I conclude to be reality then there is an interesting opportunity as well as evidence of incumbent ignorance.

    Let's then look back on how Gartner has been reporting the iPad's rise and the PC's decline.[1]

    Q2 2010

    "The consumer PC market registered double-digit shipment growth, but consumer mobile shipment growth slowed. This was due in part to slower growth of mini-notebooks," Ms. Kitagawa said. "Surging popularity of Apple's iPad temporarily cannibalized mini-notebooks, as well as consumer notebook sales to some degree. It is not certain at this stage if the cannibalization will continue with the current price point of media tablets."

    Q3 2010

    "Media tablet hype around devices such as the iPad has also affected consumer notebook growth by delaying some PC purchases, especially in the U.S. consumer market. Media tablets don't replace primary PCs, but they affect PC purchases in many ways," Ms. Kitagawa said. "At this stage, hype around media tablets has led consumers and the channels to take a 'wait and see' approach to buying a new device."

    Q4 2010

    “U.S. holiday sales were not fantastic for most PC vendors, but the professional market did show healthy growth during the quarter,” Ms. Kitagawa said. “Media tablets undoubtedly intensified the competition in the consumer market. These devices do not replace primary PCs, but they are viewed as good enough devices for these who want to have a second and third connected device for content consumption usage. Mini-notebook shipments were hit the most by the success of media tablets.”

    Q1 2011

    "Weak demand for consumer PCs was the biggest inhibitor of growth," said Mikako Kitagawa, principal analyst at Gartner. "Low prices for consumer PCs, which had long stimulated growth, no longer attracted buyers. Instead, consumers turned their attention to media tablets and other consumer electronics. With the launch of the iPad 2 in February, more consumers either switched to buying an alternative device, or simply held back from buying PCs. We're investigating whether this trend is likely to have a long-term effect on the PC market."

    Q2 2011

    Overall shipments of media tablets took place late this quarter and volumes remained low, minimizing any impact of the media tablets for PC substitutions in the second quarter of 2011

    Q3 2011

    "The main contributor to the weak consumer PC market in the U.S. was intensified competition for consumers' money," Kitagawa said "Media tablets and smartphones took center stage in the U.S. retail sector, and the expectation is for continuing demand for these devices throughout the holiday season."

    I've added emphasis for the key words describing the impact of the iPad (referred to as "media tablets").

    Note how the message changed over time. At first the effect was thought to be temporary (presumably due to "hype"). Three months later the "hype" was leading to "hesitation" in the channel. Three more months and there was "a hit" on Mini-notebooks but only for those needing a second or third device for "consumption". In the fourth report it seems that "consumers" (vs. business users) are really interested in this. The fifth report suggests that the effect is "minimal". The latest report suggests that this is a "localized effect".

    An external observer (or paying customer) reading this must conclude that five quarters in, these media tablets are having some effect but most probably a transient one. By keeping tablets separate from PC's Gartner is implicitly stating that the two products do not compete. If they have an effect it's on the discretionary spending by consumers. Similar to the effect game consoles or consumer electronics may be having on PCs.

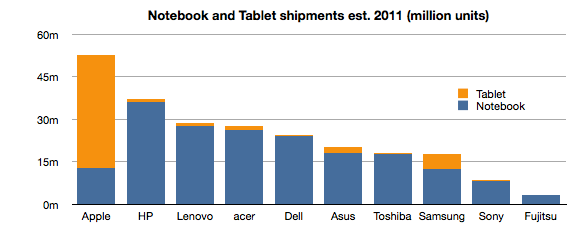
    However, if tablets were added to notebook totals the chart for 2011 would look like this:[2]


    Notes:

    1. The quotes are from periodic reports (every quarter) from the same analyst at the same firm using a consistent set of measurements about the market. In order to ensure the same context, I've selected the comments from press releases published using the same template.
    2. Source: Digitimes Research, compiled by Digitimes, October 2011
  6. How many iPhones will be upgraded next year?

    Research · 70 comments

    Last week I proposed that there were two significant markets for the new iPhone: 1) the existing iPhone user base 2) smartphone "non-consumers". Today I want to dig a bit deeper into the first market to get an idea of what it amounts to.

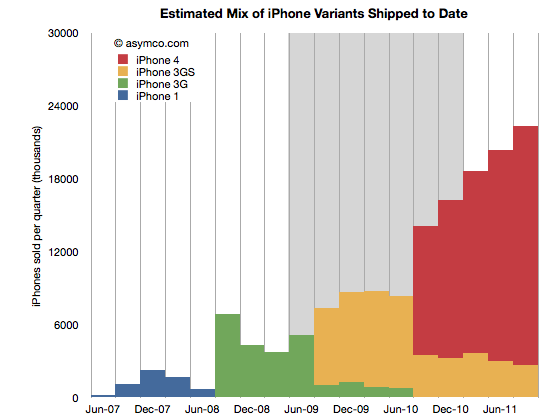
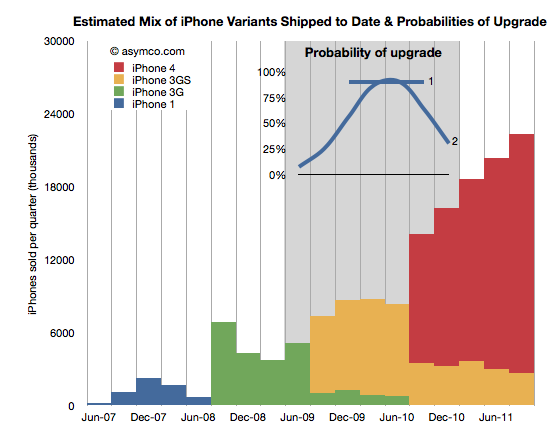
    The following chart shows the total iPhone shipments over time with an estimate for the mix of models during the last two years.

    The way I calibrated the mix is by taking into account the statement that Tim Cook made that half of all iPhones shipped were iPhone 4. I first estimated that this past quarter (ending September) included about 22.3 million units. That makes the total iPhones to end of Sept 151.3 million. Half would be about 75 million. Therefore the red area needs to add up to that total. The remainder must therefore be the yellow, 3GS volume.

    This mix implies that the following shipments by variant (through end of Sept 2011):

    • iPhone 1: 6.1 million
    • iPhone 3G: 24.4 million
    • iPhone 3GS: 45.4 million
    • iPhone 4: 75.4 million

    I also highlighted in grey the most likely target market for upgrades during the next 12 months. What I'm assuming is that recent buyers will not be likely to upgrade but those having purchased an iPhone two years hence will probably be looking to replace it. The naive approach is to assume all the iPhones beyond a certain age will be automatically upgraded. That would give almost 70 million units. However, not all those phones are in use and many of those phones may have already been upgraded to iPhone 4s. 70 million is a theoretical maximum. We have to be more specific.

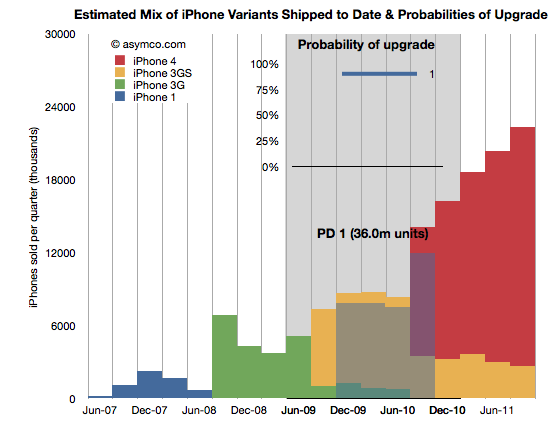
    In order to get a better figure for this I created a probability distribution (PD) which suggests the likelihood that the phones purchased in that quarter get upgraded in the next 12 months. I created two such PDs illustrated in the inset chart below:

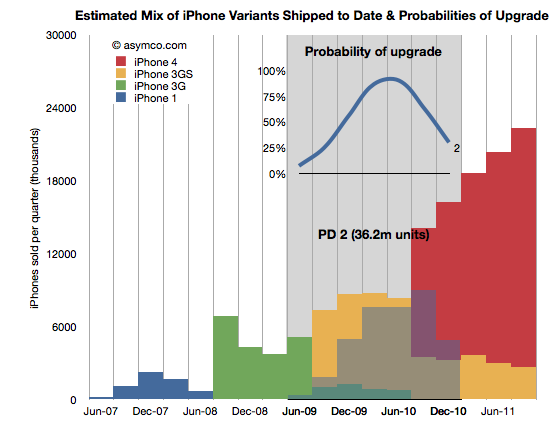
    PD 1 is the simplest. It assumes that 90% of two year old iPhones will always be upgraded. PD 2 is a bit more nuanced where it assumes that there is a range of probabilities over a wider period, but with a peak in the 2 year old zone. These PDs are guesses but consider them starting points for debate.

    By multiplying the probability in the line chart (PD1) with the area below it (the units it covers) we get get the shaded area indicating which phones (and variant) will be upgraded next year.

    The areas not shaded are either left un-upgraded or represent phones which were already upgraded to iPhone 4's last year. The PD1 assumption yields 36 million units.

    Doing the same with PD2 yields a different upgrade set shown below:

    This assumption leads to about 36.2 million units upgraded in the next 12 months. Very similar to PD1 but approached from a different angle. Are these figures credible? I don't know. The real PD may be quite different but I think these are pretty conservative figures. They are about half of the theoretical maximum.

    Why is this Interesting?

    This is interesting because of two reasons.

    Firstly, it lets us calibrate our forecast for iPhone sales next few quarters. My own estimate stood at 140 million prior to this analysis. Is it reasonable? Remember that the target market includes non-consumption or non-iPhone, non-Smartphone users. Given the "guaranteed" market above at least 36 million, it makes the non-consumption target about 104 million. Does it sound reasonable?[1]

    Yes. Primarily because most iPhones sold during the last 12 months were sold to non-consumers. And there were 76 million of them. Apple's distribution has increased since and will continue to increase[2]. That means that Apple does not need to stretch much more than it already has to get the additional growth from un-penetrated markets. We know that this market is still measured in the billions of users. The demand is there.

    Secondly, this is interesting from a competitive point of view. When competitors like Microsoft claim that Apple left open an opportunity by not launching a new iPhone "5" they are not looking at the world through the lenses shown above. From their point of view each new phone sold must come from their installed base or non-consumption.

    But they don't have any installed bases over 2 years old looking to upgrade. There are few Galaxy users who are yearning to upgrade since they just bought their first units. There are no Windows Phone users (and no Windows Mobile users) who are ready to upgrade to Mango. Since they don't don't see the world through upgrade "lenses" they see their marginal buyer as somebody who might have bought an iPhone 5 because it was the latest and the greatest in terms of specs or novelty.

    However they cannot be hopeful that any existing iPhone buyer will switch because they know the satisfaction scores are above 90%. They also know the legendary Apple brand loyalty that keeps Mac and iPad and iPod users glued to their devices. They are also aware of the moats of iTunes, iCloud, hundreds of installed Apps and iMessage all designed to preserve Apple's customer base.

    Competitors have none of these things. They don't have upgraders, or switchers to target. They can only target non-consumers. There their odds are better but Apple's are at least as good.

    ---

    Notes:

    1. The 140 million target for next 12 months is probably well above consensus. It assumes a growth rate of 84%. I've seen a few estimates where the growth is forecast at less than 30%. If we are to believe the analysis above, the consensus begins to appear catastrophic.
    2. Apple's distribution measured as number of carriers and countries covered is still about half that of RIM and about a third that of Nokia or Samsung.
  7. Deagol: Fiscal 4Q '10 actual results vs. estimates

    Research · 9 comments

    Comprehensive and thoughtful review of the performance of the analyst cohorts in predicting Apple's quarter:

    Deagol's AAPL Model: Fiscal 4Q '10 actual results vs. estimates.

    By Daniel Tello's ranking I was first in Q2 but 8th (out of 38) in Q3. Overall, bloggers beat Pros but by a lower margin than in the past.

    I have been ok at estimating product line performance and top line sales but not so good in guessing margins. Last quarter I went for a high iPhone number (13 million vs 14.1 actual and 11.39 Pro/12.07 Blogger consensus) and middle-of-pack on iPads (5 million vs. 4.2 actual and 4.79 Pro/5.52 Blogger consensus). The total iOS units I forecast was 18 million and Apple sold 18.3 so I was fine on units and pricing.

    My guess on the cause of my estimate failure on margins was iPhone 4 rollout ramp. I had to take iPhone margin down to below 50% (about 49%) to make the reported total GM. iPhone has been, on average, running at 52% over the life of the product.

    PED's rankings are here.

  8. Correlating Innovation and Share Prices

    Research · 12 comments

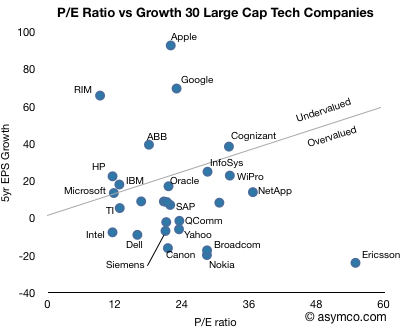
    In the last article on the P/E ratio vs. Growth for some of the largest companies, the question of PEG came up. PEG is the P/E over Growth and it's a good way to index valuation relative to growth. Usually Growth is measured as the forward twelve months consensus and a PEG of 1 is, as a rule of thumb, considered "fair value". However, forward growth is based on possibly inaccurate analyst consensus. If we instead look at historic growth, we have some actual performance to evaluate. Let's call this PEhG for P/E over historic Growth.

    The following chart shows 30 large cap technology companies[1] and their five-year compound EPS growth vs. their current P/E multiples. If we draw a line at the PEhG of 1, i.e. when the P/E ratio is equal to the historic growth rate and split the pack into PEhG > 1 (overvalued)[2] and PehG < 1 (undervalued), we have the following split:

    The chart makes for an interesting point of view over what the best positioned companies in the sector are doing and how business model innovation shows up as investment opportunity[2].

    Apple, RIM, Google stand out for their business model innovation. Ericsson, Nokia, Yahoo and Dell show poor value for their lack of innovation. Microsoft, IBM, HP, TI and Oracle show in-line value for in-line or sustaining innovation.

    [1] I omitted Baidu from the chart as it's off the scale: Growth is 151, P/E is 108. It would classify as undervalued. These are also not a complete set of all large caps. It's meant to be indicative.
    [2] Notions of value are completely subjective. This does not constitute financial advice.