Apple stock price today: AAPL climbs at the open as $315 target meets earnings week TechStock
JPMorgan analyst Samik Chatterjee bumped his Apple price target to $315 from $305, according to MarketScreener. Keep in mind, a price target reflects where an analyst expects a stock to land within a year—it’s not a guarantee.
Jefferies analyst Edison Lee remained cautious, maintaining a Neutral rating while cutting his price target to $276.47 from $283.36. These mixed calls highlight just how close the debate is ahead of earnings.
Consensus estimates Apple to post about $138.4 billion in revenue and both GAAP and non-GAAP earnings per share (EPS) of around $2.67 for the December quarter. The numbers highlight at least an 11% year-over-year growth in EPS and revenue, but analysts are now tightening their margin forecasts despite favourable iPhone sales and AI roadmap.
In a note, Morgan Stanley analyst Erik Woodring reiterated an Overweight rating and an unchanged price target of $315, but cautioned investors that Apple stock could “trade sideways to modestly lower after earnings.”
The firm expects Apple to beat expectations, driven by stronger, more persistent iPhone demand. Woodring expects December-quarter revenue of about $80 billion, around 4% above consensus, and March-quarter revenue of $55.4 billion, about 8% above consensus, citing supply-chain checks and shipment data.
He said iPhone 17’s “strength remains underappreciated by the Street.”
Morgan Stanley sees cost assumptions as overly optimistic. The firm forecasts March-quarter operating expenses about 7% above consensus and a gross margin forecast 30 basis points below consensus, driven by rising memory costs.
As a result, Woodring sees limited scope for positive EPS revisions for Apple, even with a revenue beat.
Morgan Stanley also flagged potential downside risk to June quarter earnings, estimating EPS of $1.62 versus the consensus of $1.71, citing intensifying memory-related cost pressures. The firm also notes that Apple has historically underperformed the S&P 500 more in Q1 than in any other period.
Looking ahead to 2026
All things considered, Morgan Stanley believes Apple is positioned to outperform in 2026 as a wave of new products and AI-driven catalysts is set to shape the company’s growth trajectory. The firm particularly highlighted the relaunch of Siri in February and Apple Intelligence in June at Apple’s Worldwide Developers’ Conference (WWDC). Some notable introductions expected include its most “innovative iPhone in 10+ years (Foldable)“, plus the first smartphone powered by 2-nanometer chips, part of the iPhone 18 family.
The firm sees greater benefits from share gains and higher average selling prices, with Morgan Stanley underscoring an EPS of $9.77 for FY2027, roughly 7% above Wall Street consensus.
Earnings will be above consensus. All eyes will be on how margin guidance due to pressure from memory pricing. Every year it's another thing that is cause for drama. It never matters.
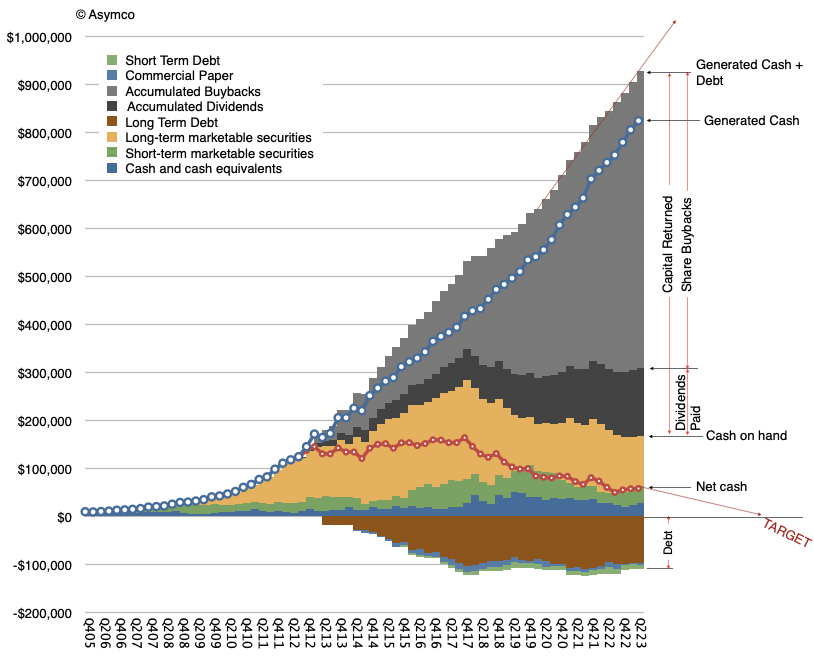
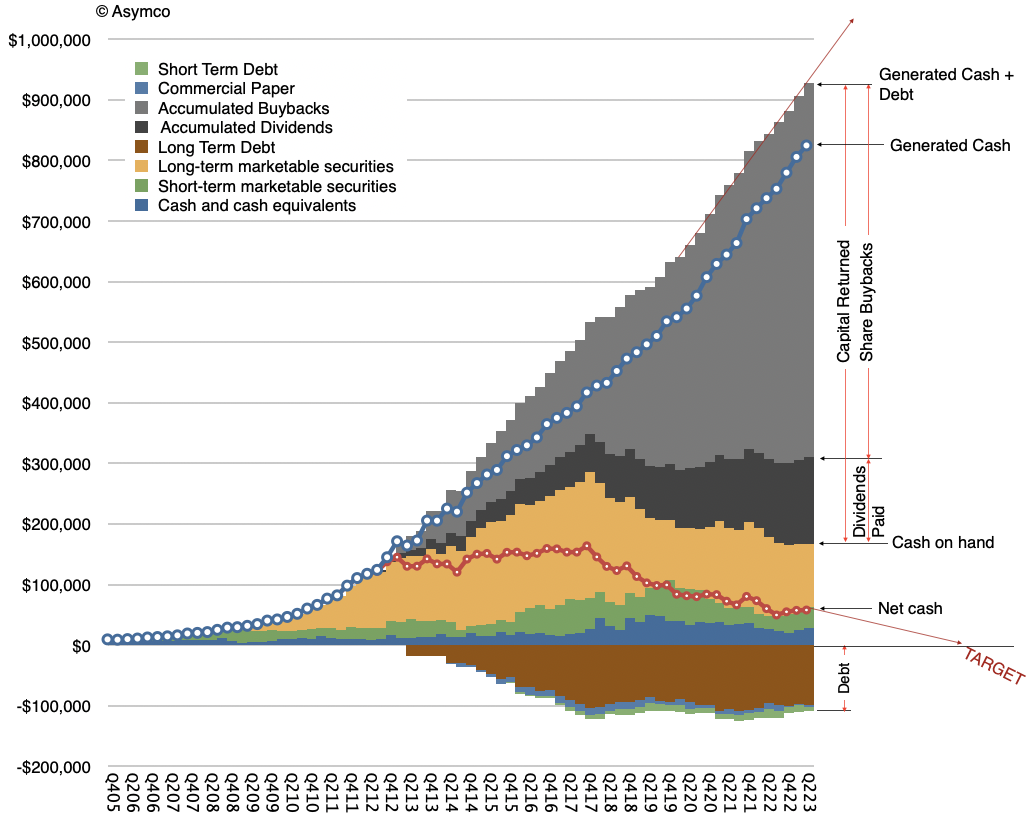
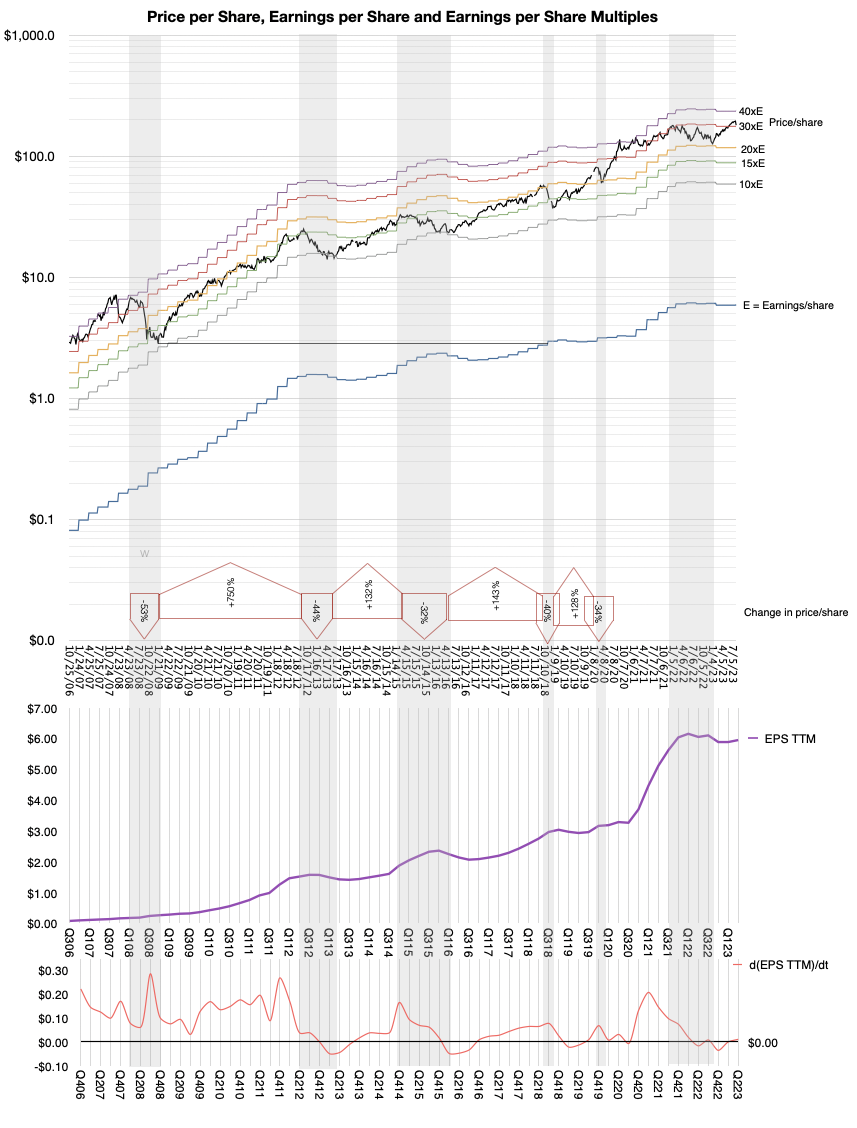
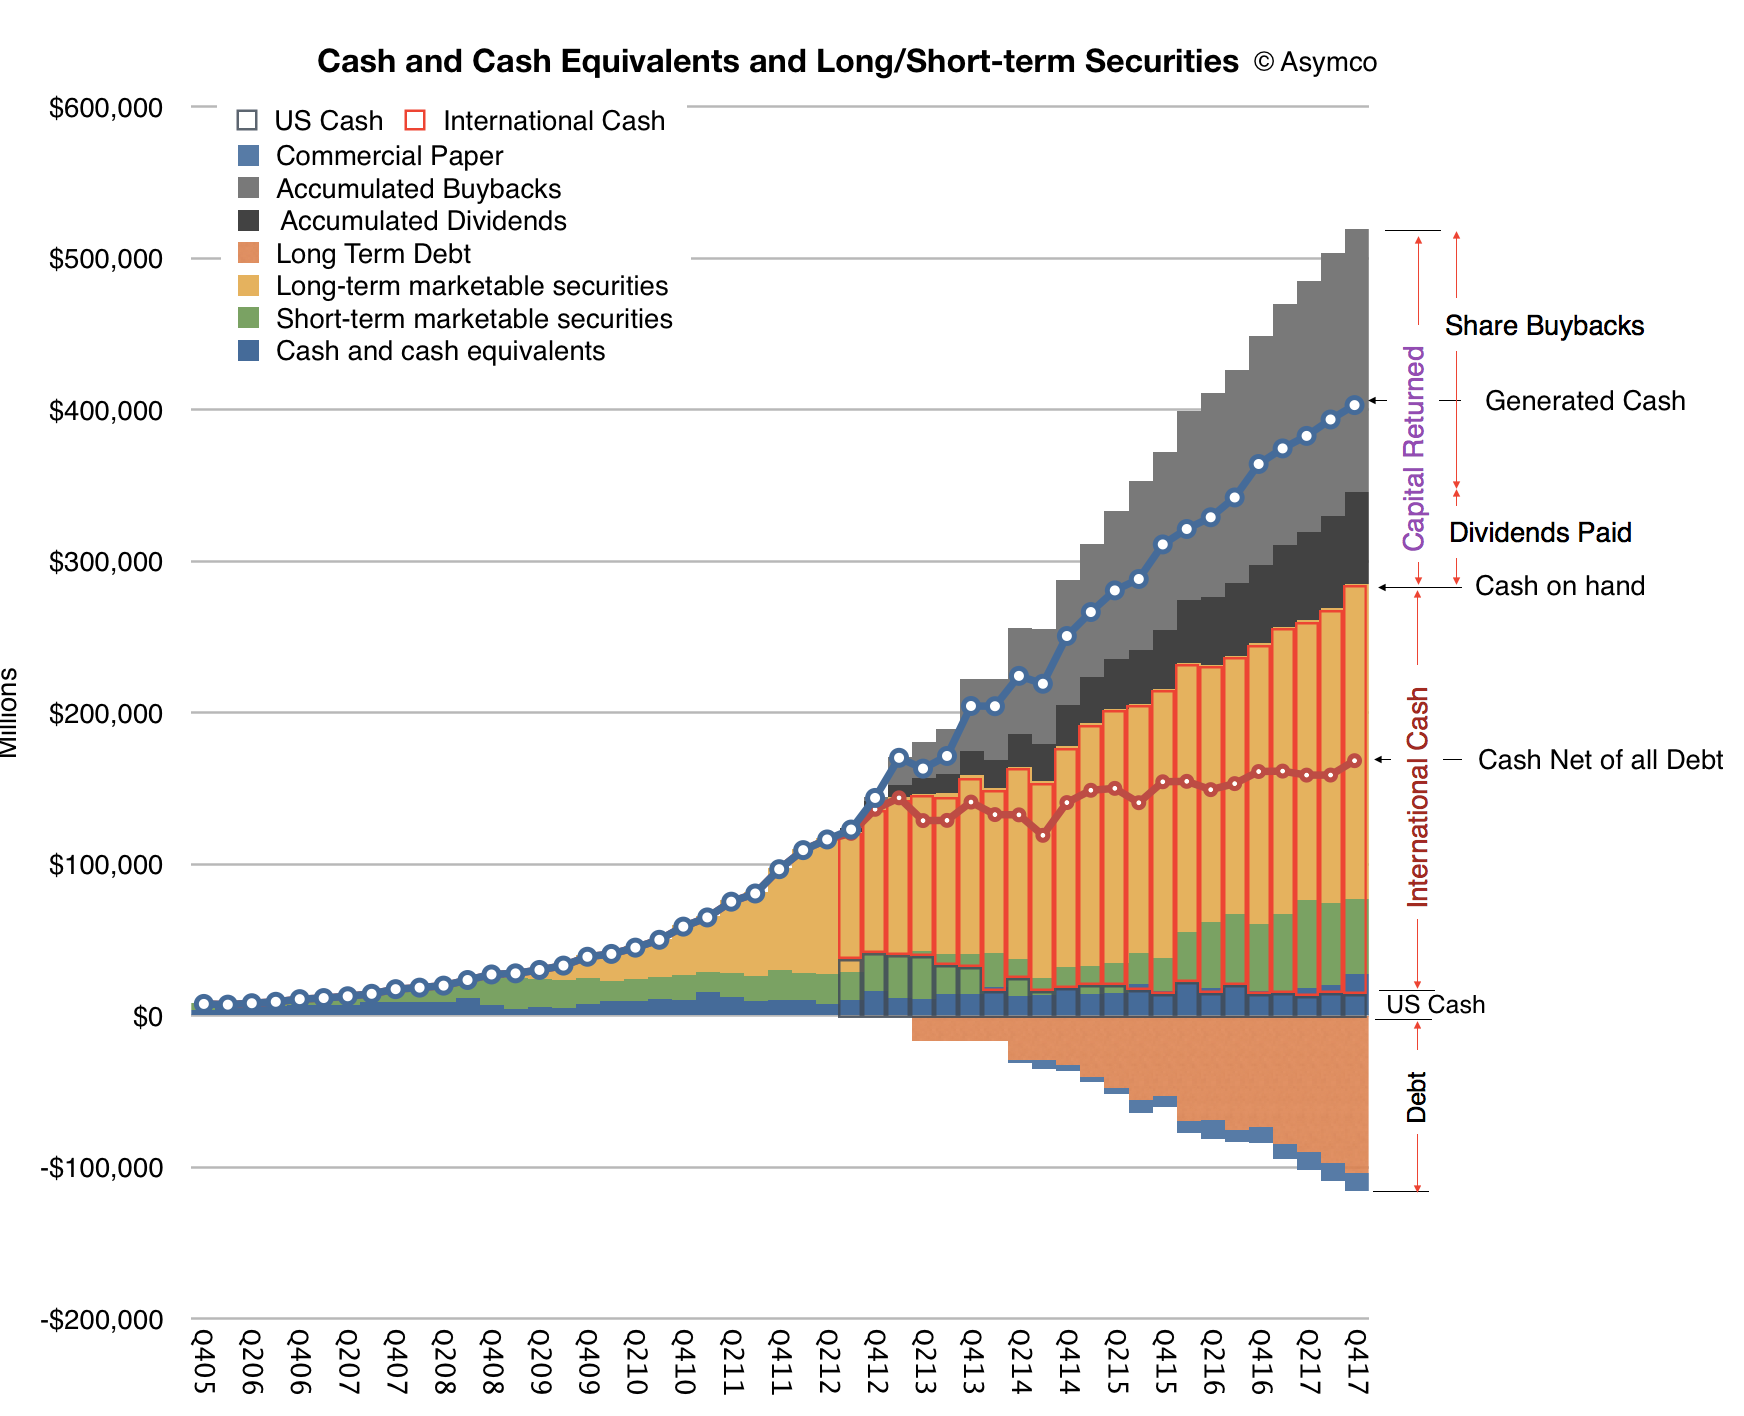
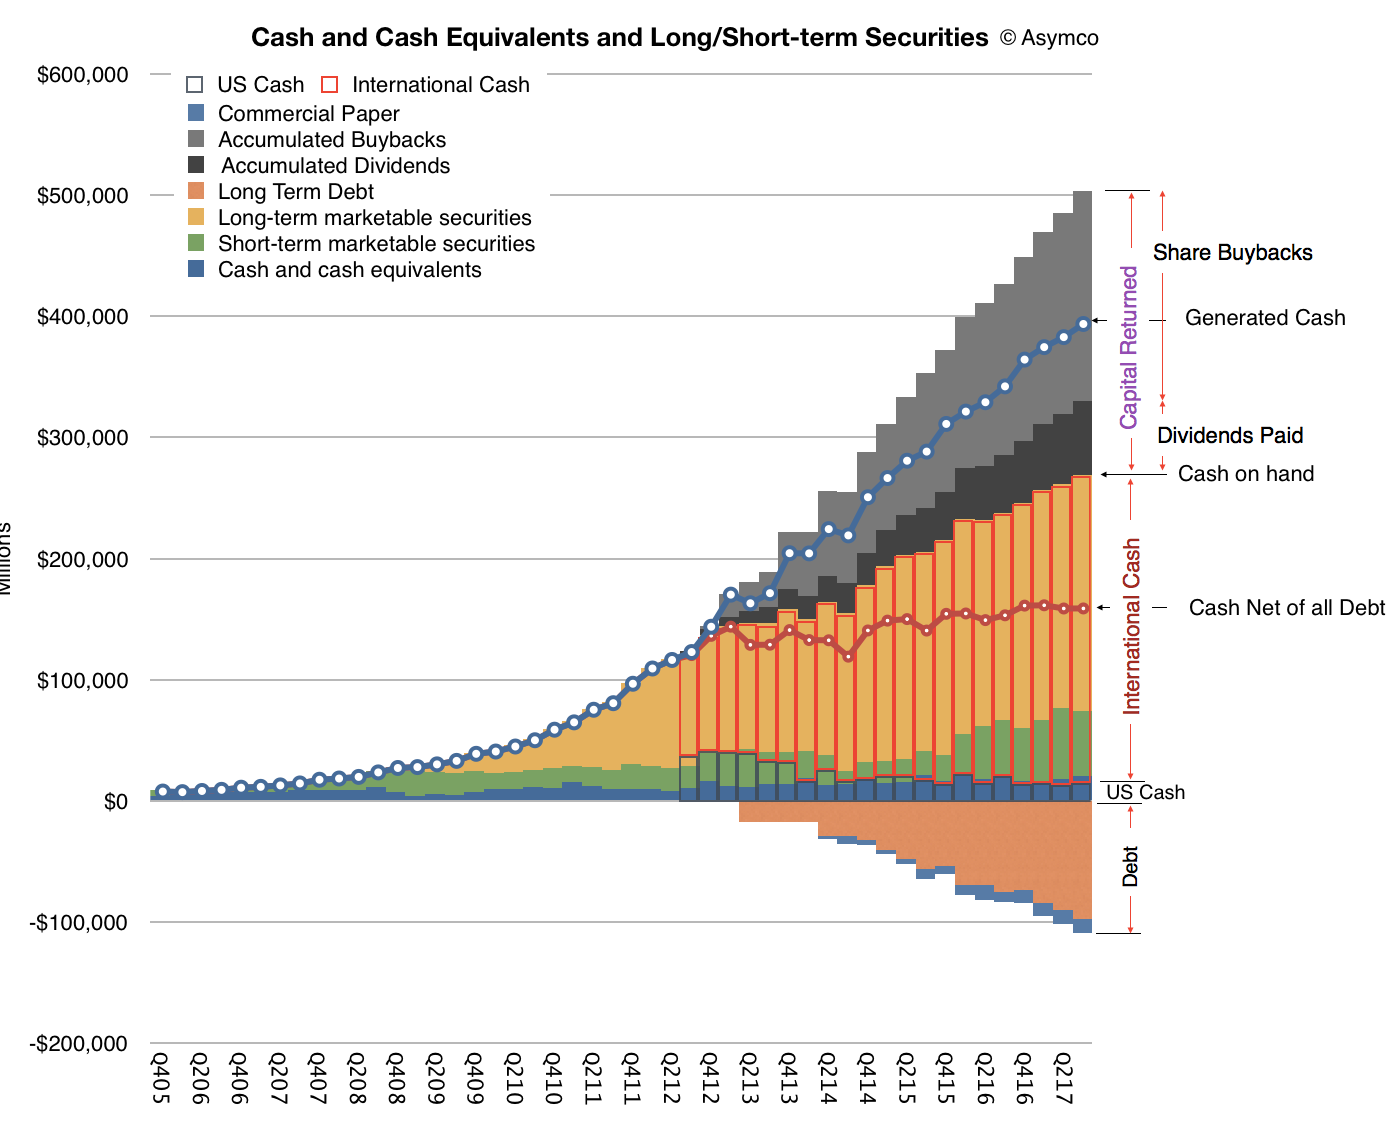
Apple has so far returned $761.5 billion to shareholders. 143.3 billion in accumulated dividends and $618.2 billion in share buybacks. These are the gray areas in the graph above. The question that often comes up is: isn't this capital return program a misallocation? In particular isn't buying back shares and retiring them a waste of money?
By definition, it cannot be. The mechanism of buying shares and retiring them is a process of returning retained capital to shareholders. The other ways this can be done are through dividends (periodic or one-time) or the sale of the company (liquidation). Ignoring the liquidation option which does not make sense for viable companies, the decision between dividends and buybacks comes down to a tax efficiency question.
The result is, however, roughly the same: retained earnings, which are stored by the company as cash typically (net value for Apple today is $57.2 billion), are an asset balanced by a liability to the shareholder called Total Shareholder Equity (valued today as $60.3 billion.) As such, the retained earnings belong to the shareholders. It's why they own the company. It's what their cash share of the value in the company is.
It's also surplus to the company's needs. Had the company needed this cash, it would have spent it on building the products and services it sells or operations that maintain or grow the business. Those expenses appear in cost of sales (COS) or cost of goods sold (COGS) or in operating expenses Sales, General and Administrative (SG&A) or Research and Development (R&D). If it's not spent this way then it drops to the net income line and, crucially, is subject to taxation (about 12% to 15% for Apple). After taxation, once returned, it's taxed again as either capital gains (in the case of buybacks) or dividend income. These rates vary on the jurisdiction of the owner and the current tax policy.
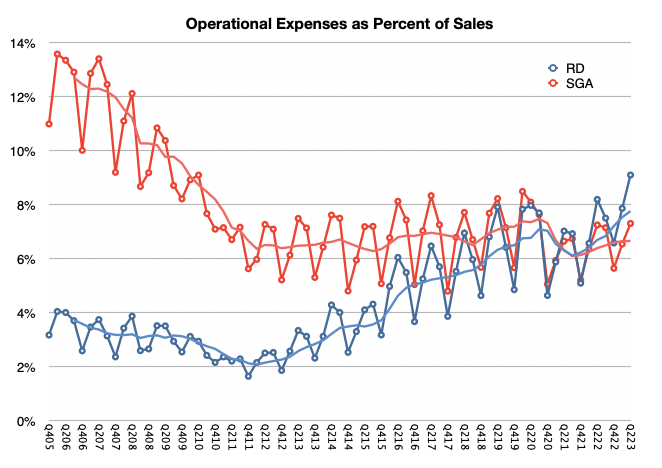
Note that the spending on R&D includes development of future projects which are not directly related to current products. Engineering of current products is expensed against COGS. R&D for Apple ($29.4 billion in last 12 months) is significant, having grown to 9% of sales, as the graph below shows.
For the company to decide to return capital it really does mean that it has no good ideas on how to spend it given what the company knows it can and cannot do. It's a judicious decision and one which honors the relationship between owner and manager with fiduciary responsibility to the owner.
Still, doesn't that mean it's wasted?
No. Giving it to the shareholder means that the company says "It belongs to you, I don't know what to do with it on your behalf, so here, you figure out what to do with it." The shareholder can then make an allocation decision that suits their sense of what is valuable or useful. The return is a deferral of decision to the owner rather than their agent.
To the extent that once returned, the capital is misspent, that is on the spender, not on Apple.
Consider the alternatives. Instead of returning capital, what some managers decide to do is to re-allocate those retained earnings to acquire other companies with the promise of value creation through synergies. However these are often huge wastes of money. The new asset is recorded as "goodwill" on the balance sheet, offsetting the retained shareholder equity. As the synergies fail to materialize, the asset (goodwill) is written off, and shareholder equity decreases accordingly, and so, value evaporates or is transferred to the owners of the acquired company who cash out above market value.
Acquisitions are a process of picking the pocket of shareholders.
The alternative might be to spend heavily on R&D. That is more admirable but the amount involved is enormous and it's very difficult to find enough people and projects worth pursuing without turning R&D into an academic organization. Remember that with R&D at $7.4 billion per quarter, the company is spending 41 times more than it did in 2006.
And doubling or tripling R&D, even if possible, would impact margins to such an extent that Apple's profitability would show very poorly indeed. That would collapse share prices and decrease share-based compensation, limiting the possibility of recruiting talented engineers. It would bring quite a lot of negative consequences.
Another exercise to undertake would be to ask what would happen if the mechanism of share buybacks were made illegal. It was not always legal anyway. That is left as an exercise to the reader.
Before the iPhone launched in late 2007, Apple was trading consistently at a P/E ratio above 30. Here is a table for the P/E ratio on each Friday's closing price from May to August, 2007. The iPhone launched on June 29, 2007.
Apple's P/E ratio around the iPhone launch
Date
P/E Ratio
5/23/07
31.5
5/30/07
31.6
6/6/07
34.1
6/13/07
33.7
6/20/07
34.6
6/27/07
33.6 (2 days before iPhone launch)
7/11/07
37.2
7/18/07
34.6
7/25/07
34.3
8/1/07
33.3
8/8/07
34.2
8/15/07
30.2
Apple was not super powerful but it was not doomed either. It was a time when the iPod was dominant and the Mac was still alive. iTunes re-wrote the rules of the music industry and debate was raging whether Apple should be considered a media company. Platforms were not its strength but Steve Jobs showed he was still able to distort reality.
These good times did not last. The first year of the iPhone was a period of minimal contribution from the new category with Apple still largely valued on the basis of the iPod. The predictions of failure for the new communications product, especially given its high price, were legendary. It wasn't until 2008 that the iPhone began accelerating and making a meaningful contribution to the bottom line.
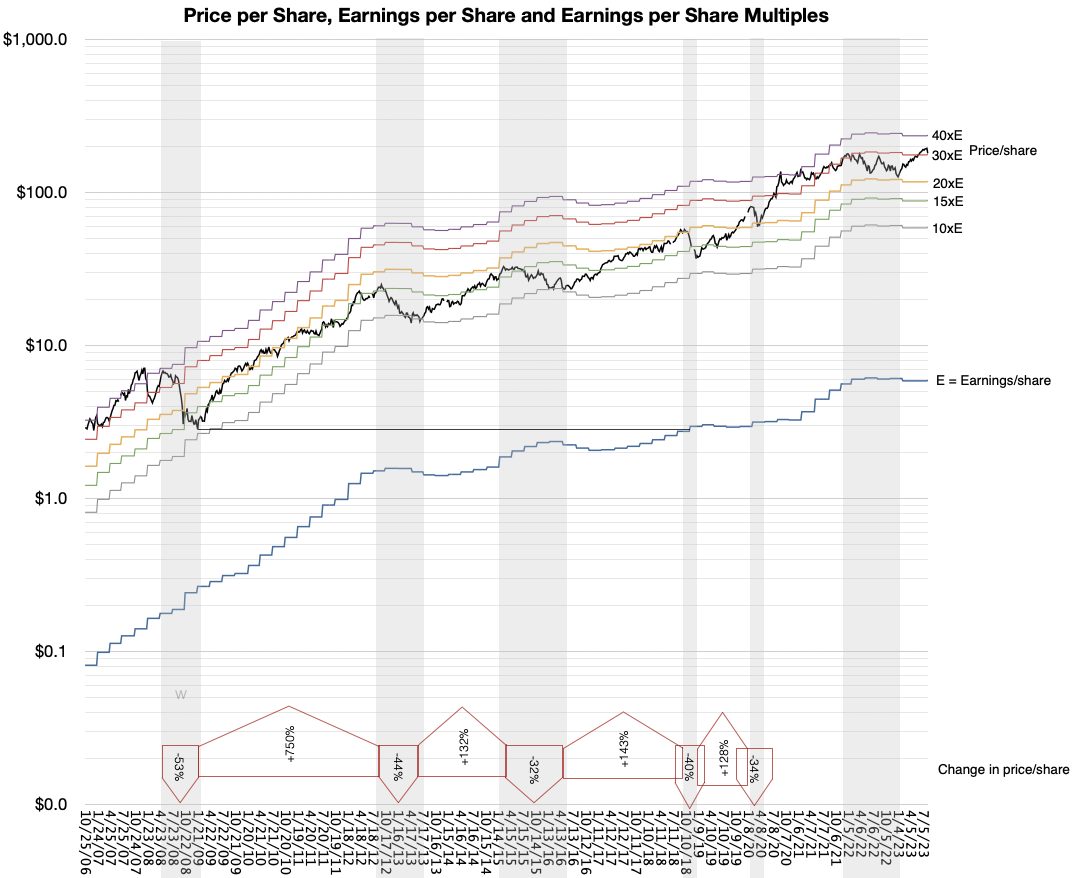
It was then, in late 2008, that Apple's valuation broke. The P/E ratio fell from above 30 to nearly 10. The following graph shows the catastrophic 53% share price collapse coupled to the triple digit surge in earnings which led to the P/E ratio tanking.
[The graph shows earnings per share for the trailing 12 months (blue line) and 10x, 15x, 20x, 30x and 40x that value (colored lines). The share price is the black line. The share prices are sampled every Friday. The graph is notably logarithmic. The grey shaded areas are periods of significant contraction. The percent drops/increases during these periods of contraction/expansion are shown in the annotation arrows near the bottom.]
The valuation remained broken for 12 years, between late 2008 and late 2020. This period being, arguably, the most remarkable wealth creation event in history of business. For evidence see the following graph showing the amount of retained earnings returned to shareholders building inexorably toward one trillion dollars. This is not share price appreciation but cash returns. [If you have evidence of a larger wealth-creation event do let me know.]
The creation of $800 billion of shareholder wealth at fire-sale share pricing.
As I explained throughout this period, motivation to dispose of shares which create immense wealth is explained by the fable The Goose That Laid the Golden Eggs but the question some are asking now is whether more wealth can still be created, and if so, can we expect Apple's valuation to collapse accordingly?
I should note that during the long, dark years of wealth creation, other technology companies such as FaceBook, Amazon and Netflix, Google (so-called FAANG) and Microsoft enjoyed far higher multiples than Apple, sometimes 3x higher. This was not seen as abnormal by analysts because those companies were always assumed to have higher growth potential, with a diverse portfolio of opportunities while Apple's growth was perpetually in its past, based on one product.
Paradoxically perhaps, since the Covid-19 pandemic Apple shares have enjoyed P/E ratio roughly equivalent to the other tech companies. For instance, peaking at 42 in January 2021, the P/E ratio has averaged about 27.5 since then. Simultaneously, diversified companies such as FaceBook (now Meta) and Netflix collapsed due to serious business model flaws (based on single sources of income) and Google (now Alphabet) and Amazon have slowed growth and are facing anti-trust scrutiny. Having lost any presence in mobile computing Microsoft has become entrenched in enterprise, finding new businesses in cloud and (possibly) generative AI. As a result of these reversals, the contrast between Apple and the mega-cap cohort has become fuzzy.
So back to the question: does it make sense to price Apple in the 30x P/E or should it go back in the gutter at 10 to 20?
I would argue that the big change in perception hasn't been the surge in earnings during Covid (see graph below). The big change is the realization that Apple is no longer about to go out of business.
How could Apple not be going out of business?
Remember that a P/E ratio in the teens is a clear signal from the market that the company is a questionable "going concern". This is parlance indicating doubt that the company will continue in its present form..
What has changed since 2020 is that even though there were a multitude of crises—from war to pestilence—the eggs kept coming. Perhaps, perhaps, Apple was not doomed after all. In that time it managed to create 1 billion customers. Perhaps having 1 billion customers was a positive outcome. Perhaps counting iPhones during a single quarter was not the only way to value the company. Perhaps having 1 billion satisfied customers made it viable. Perhaps having 1 billion satisfied and loyal customers returning every year was interesting. Perhaps having 1 billion satisfied wealthy customers meant the end is not around the corner. Perhaps having 2 billion active devices in use was sustainable. Perhaps providing services to 1 billion customers using 2 billion devices delivered through 1 billion subscriptions made some sense. Perhaps having all this data in a linear graph made it predictable?
Perhaps. Though Apple provided updates on these figures regularly, the questions everyone asked were still on unit shipments (which Apple stopped providing.) While Services grew at double digits and 70% margins the questions from analysts on conference calls persist on the iPhone and currency or production "headwinds". Perceptions take time to change. They are still changing.
Maybe at this point it's time to agree that Apple's end will not come through being easily replaced by the competition (first Windows then Android, etc.) but by having access to its markets restricted. Being the only American company to have cracked the China puzzle, it's surely vulnerable there. And please don't mention India.
Apple is no longer doomed because it's too weak. It's doomed because it's too strong.
It seems that it's not too hard to believe the end is still near.
It's common knowledge that sell-side analyst price targets for stocks are not taken seriously. The evidence is simply that no public accounting exists for their historic performance. It would be trivial to grade performance but it seems nobody bothers to do it.
It seems strange given the attention paid and repetition of these targets in financial media. When a "note" is published with an opinion and a target price the stock price can and does actually react. But why should it if there is no accountability?
Well, not quite zero accountability. Philip Elmer-DeWitt publishes analyst estimates (example) diligently. These estimates are presumed to be 12 month targets, meaning that at the time when the estimate is published the target price is assume to be reached 12 months hence. He does grade the performance of these same analysts (and more) in predicting quarterly earnings and revenue estimates for the just-ended quarter.
But an estimate for what *just* happened in the last 90 days is a lot easier than predicting how markets will react to all the information about a company 12 months into the future.
So how hard can it be to measure performance on price targets vs. just-ended quarterly estimates?
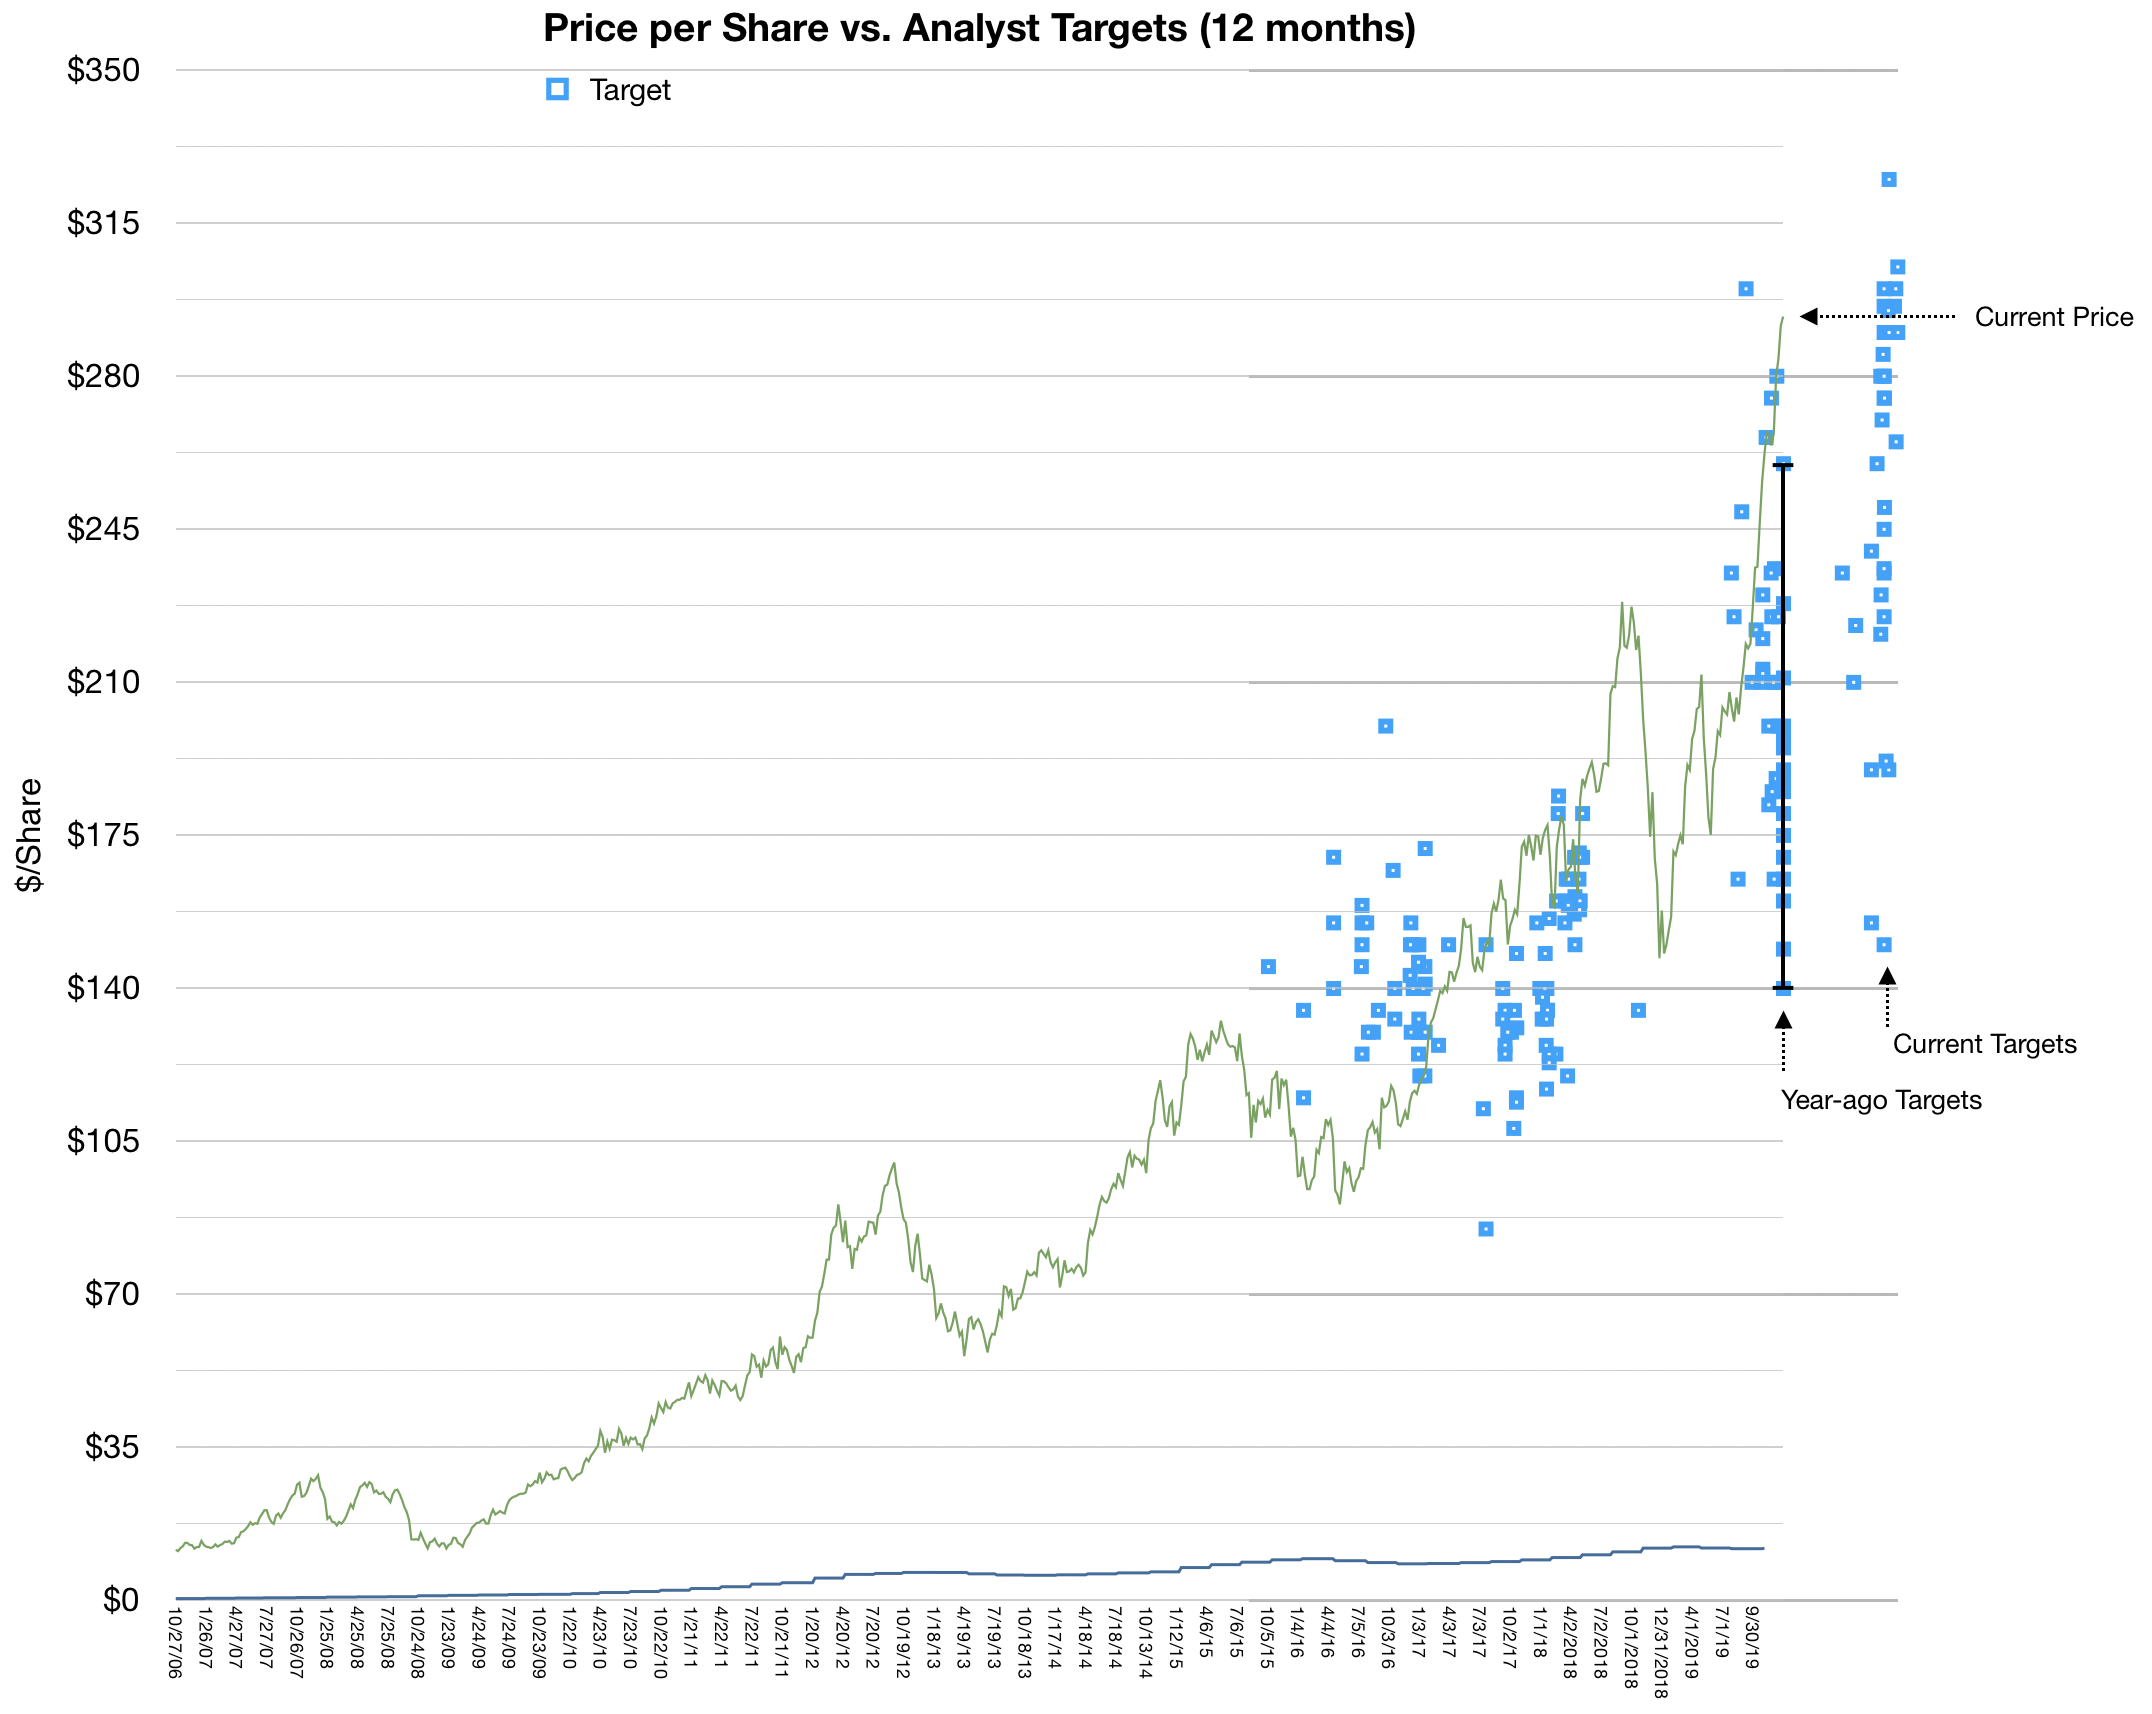
Here is my modest attempt: I note that Apple's share price today is trading around $298 per share. I also note that we can recover the estimates from analysts exactly a year ago. At that time Apple issued a rare warning that its own estimates for the fourth calendar quarter 2018, issued about 60 days earlier would be quite a bit different than what will be released (in 3 weeks).
This compelled all the analysts to re-set their targets at the same time. What we ended up is a whole batch of January 3rd 2019 estimates for, presumably, January 3rd 2020.
Well, January 3rd 2020 is tomorrow. How did the estimates hold up?
The following graph tells the story:
Apple Share Price vs. a sampling of Analyst Estimates, Past and Present.
The green line in the graph represents the closing share price at weekly intervals (from about October 2016 until last week.) The blue dots represent various estimates. Note that they are 12 months since their issuance and that since estimates can come at any time the are not easily clustered.
That is except last year and the "big reset" when the estimates all were issued on the same day. I highlighted the range with a vertical line. Note that the closing price last week was well above the highest estimate and that the lowest estimate ($140 is less than 50% of the current price).
This is quite a big fail. Errors of 50 for a 12 month time frame are egregious.
A few additional observations:
The spread or variance of estimates is enormous. Far wider than what was the case 3 or 4 years ago. (I look forward to getting more data to perform this variance analysis). It's peculiar to me that a larger, more stable business, as Apple is today, is more difficult to predict. To see even today a range in targets between $150 to $350 is bizarre.
Another observation is that very, very few targets were "accurate". That is anywhere near what actually happened. To find these rare successes, look for blue dots placed directly or near the green line. The chances of a correct target is less than what can be attributed to chance. Again, I look forward to a larger data set to see if there is any set of analysts that perform particularly well or particularly poorly.
Again, we're not describing here predictions about the stock market in general, or of macroeconomic indicators. We're talking about predicting one single company's stock price in a 12 month period. A company that receives a great deal of scrutiny and which publishes a surprisingly large amount of data about itself.
Now I don't want to suggest that there is a better way to predict share prices. I will not try to do so because although it might be easy to predict earnings based on overall company strategy, processes and team (all well known) the share price is that data multiplied by a random number called "sentiment". That sentiment can be summarized as the P/E ratio which wanders around aimlessly. I don't think I have any way to predict sentiment one second into the future, never mind one year.
But even if I don't think there is a method to the madness of sentiment, it seems dozens of people find it necessary to claim that there is one. But if you do, then analyze yourself. What did you learn from the mistakes? What is the theory you're employing?
And if you don't analyze yourself, then don't expect to be taken seriously.
For the last two years I've been studying the transportation economy and introducing the idea of Micromobility. Simply, Micromobility promises to have the same effect on mobility as microcomputing had on computing. Bringing transportation to many more and allowing them to travel further and faster. I use the term micromobility precisely because of the connotation with computing and the expansion of consumption but also because it focuses on the vehicle rather than the service. The vehicle is small, the service is vast. ((If you want to learn about the real future of transportation sooner rather than later, do consider coming to the Micromobility California conference.))
One of the elements of analysis for Micromobility is the notion of Unit Economics. The idea is that each vehicle can be seen as an independent business. It requires an investment, has a revenue attached, requires operating costs and fixed costs and finally, hopefully, generates earnings. A fleet's economics is therefore a multiplication of the unit economics by the fleet size. A similar partial construct exists for mobile network operators where the network revenue is defined by ARPU (average revenue per user). In consumer hardware we also have the idea of ASP (average sales price) and BOM (bill of materials) which describe the revenue and variable cost of each device.
In the case of Micromobility the unit economics is more broadly applied in being an entire P/L statement for each vehicle. One example for the e-scooter sharing company Bird is here. If the unit economics of Bird is consistent across geography and time then the entire business can be valued based on one "average unit". Measuring the health of the business can thus be summarized in BOM, Utilization, Lifespan, Attrition and Cost structure or one unit.
For some time now I've advocated a similar approach for Apple.
The idea is to look at each Apple device sold as a black box that requires investment, generates revenue and, given a certain cost rate, produces a profit. Indeed the company has suggested that this is how it measures itself and has now encouraged us to do the same by withholding measurements that misdirect us away from this method.
Unit sales for Apple are like unit production rate for micromobility. It's certainly important to know how many e-scooters or e-bikes can be manufactured and deployed but it's far more important to know how long each one lasts (lifespan) and how frequently it's used (utilization) and what pricing can be obtained for that use or a per-mile basis.
A restriction on unit production could slow the network's growth but it may not affect the demand measured in miles of distance that users need to cover. A lack of vehicles means users will hire cars or walk or transit or perhaps won't take the trip at all. But once supply is provided the choice of micromodes should compel users to use them.
In this view, the Apple business can be seen as a base of devices multiplied by the revenue per device subtracting the cost.
In the latest letter to investors Tim Cook wrote that the total number of active devices has increased by more than 100 million in the last twelve months. Given that the figure a year ago was 1.3 billion, the current total must be 1.4 billion. We can also estimate that Apple sold about 303 million devices in 2018. This implies 2 out of 3 were replacements and 1 out of 3 increased the base.
Services revenues were about $40 billion in 2018 (up 28%). Total revenues were $261.5 billion.
Thus for the whole of 2018:
$194 per active device of which...
$30 in service revenues per active device
We can repeat the process for costs and earnings.
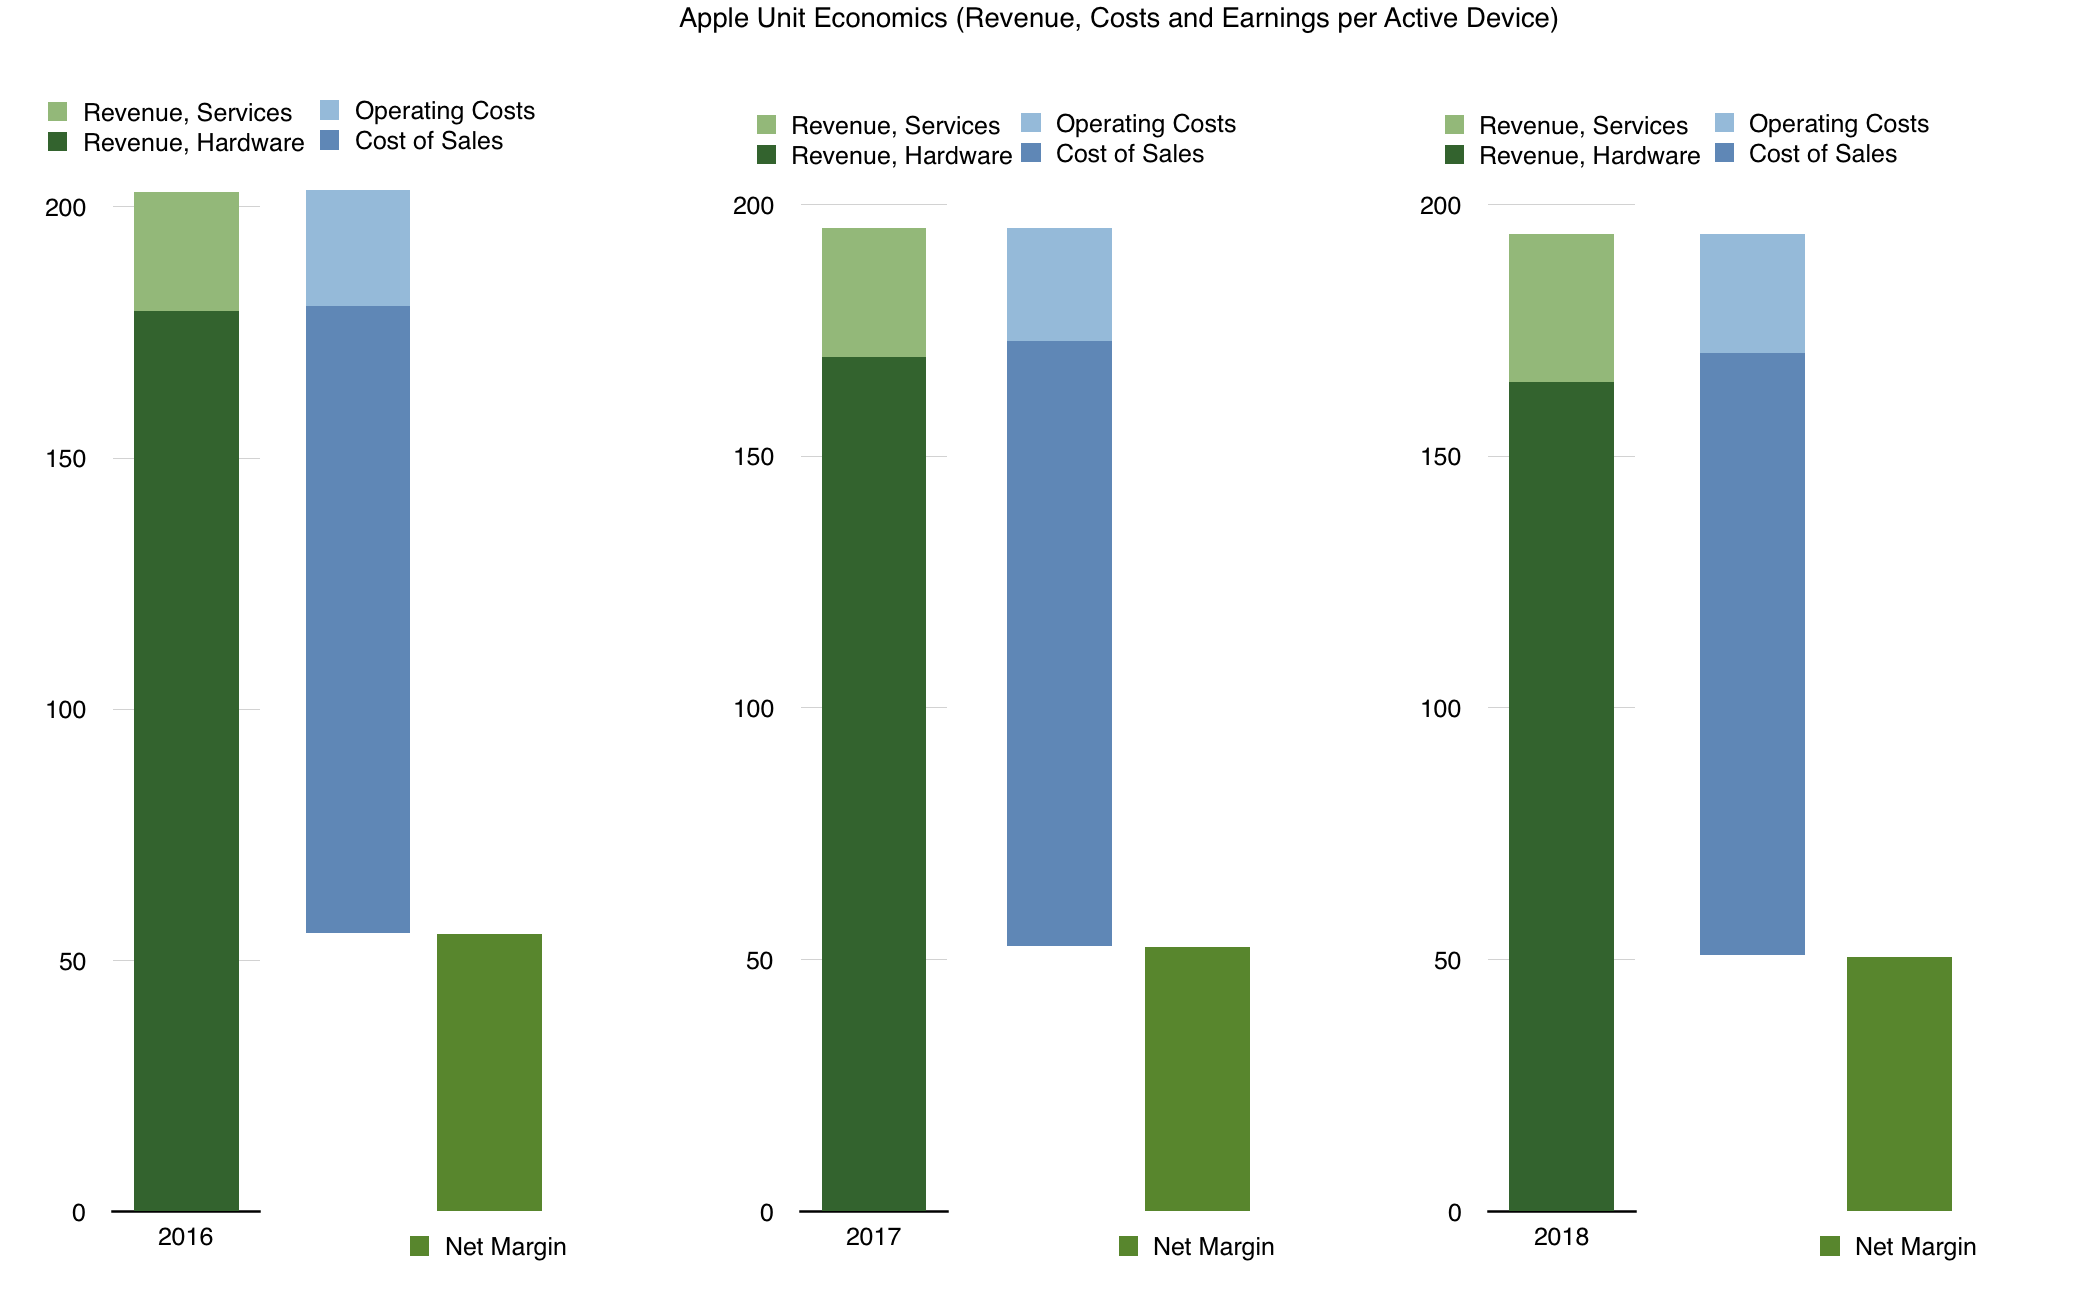
Through this lens, Apple's business over the last three years can be seen in the following graph:
A few observations:
The business is remarkably stable over the last three years.
The top line went from $179 to $165.
The bottom line (Net margin) per device went from $55 to $51.
This happened while the base multiplier went from 1.15 billion to 1.4 billion.
Service revenues are increasing (from $24 to nearly $30)
Seen this way the pattern of service growth at the expense of hardware is clearly evident. This is generally contrary to perception when looking at devices sold per quarter.
This is a three year snapshot but if we were to forecast longer term, the questions that arise:
How rapidly can the base multiplier rise? It had been rising at 150 million/yr for two years and 100 million for one year. What is the likely increase in the future? What is the saturation point? Is it 1.5 billion (which seems a year away) or is it 2 billion or more?
How are services ramping? The revenue per device is ramping in an accelerated rate (from $2/yr/yr to $3/yr/yr). How high can revenue per device rise? Is $50/yr possible? Higher?
Is the ASP increase reducing hardware revenues? This point is contentious and I will write about it separately.
It's going to take a while for this view of the company to prevail but it's clearly the way the company itself operates and how it sets its objectives.
Three months ago Apple provided the following guidance:
As we move ahead into the June quarter,[…] We expect revenue to be between $51.5 billion and $53.5 billion. We expect gross margin to be between 38% and 38.5%. We expect OpEx to be between $7.7 billion and $7.8 billion. We expect OI&E to be about $400 million. And we expect our tax rate to be about 14.5%.
If we aim for a revenue figure close to the upper end of the range ($53.2 billion) and insert all the other figures (split the difference for OpEx) then then the company's fiscal third quarter looks as follows:
Revenues: $53.2b iPhone (units): 43.2 million iPad (units): 11.6 million Mac (units): 4.3 million Services ($): 9.5 billion Other products ($): 3.5 billion Gross margin (%): 38.6%
EPS ($): $2.26
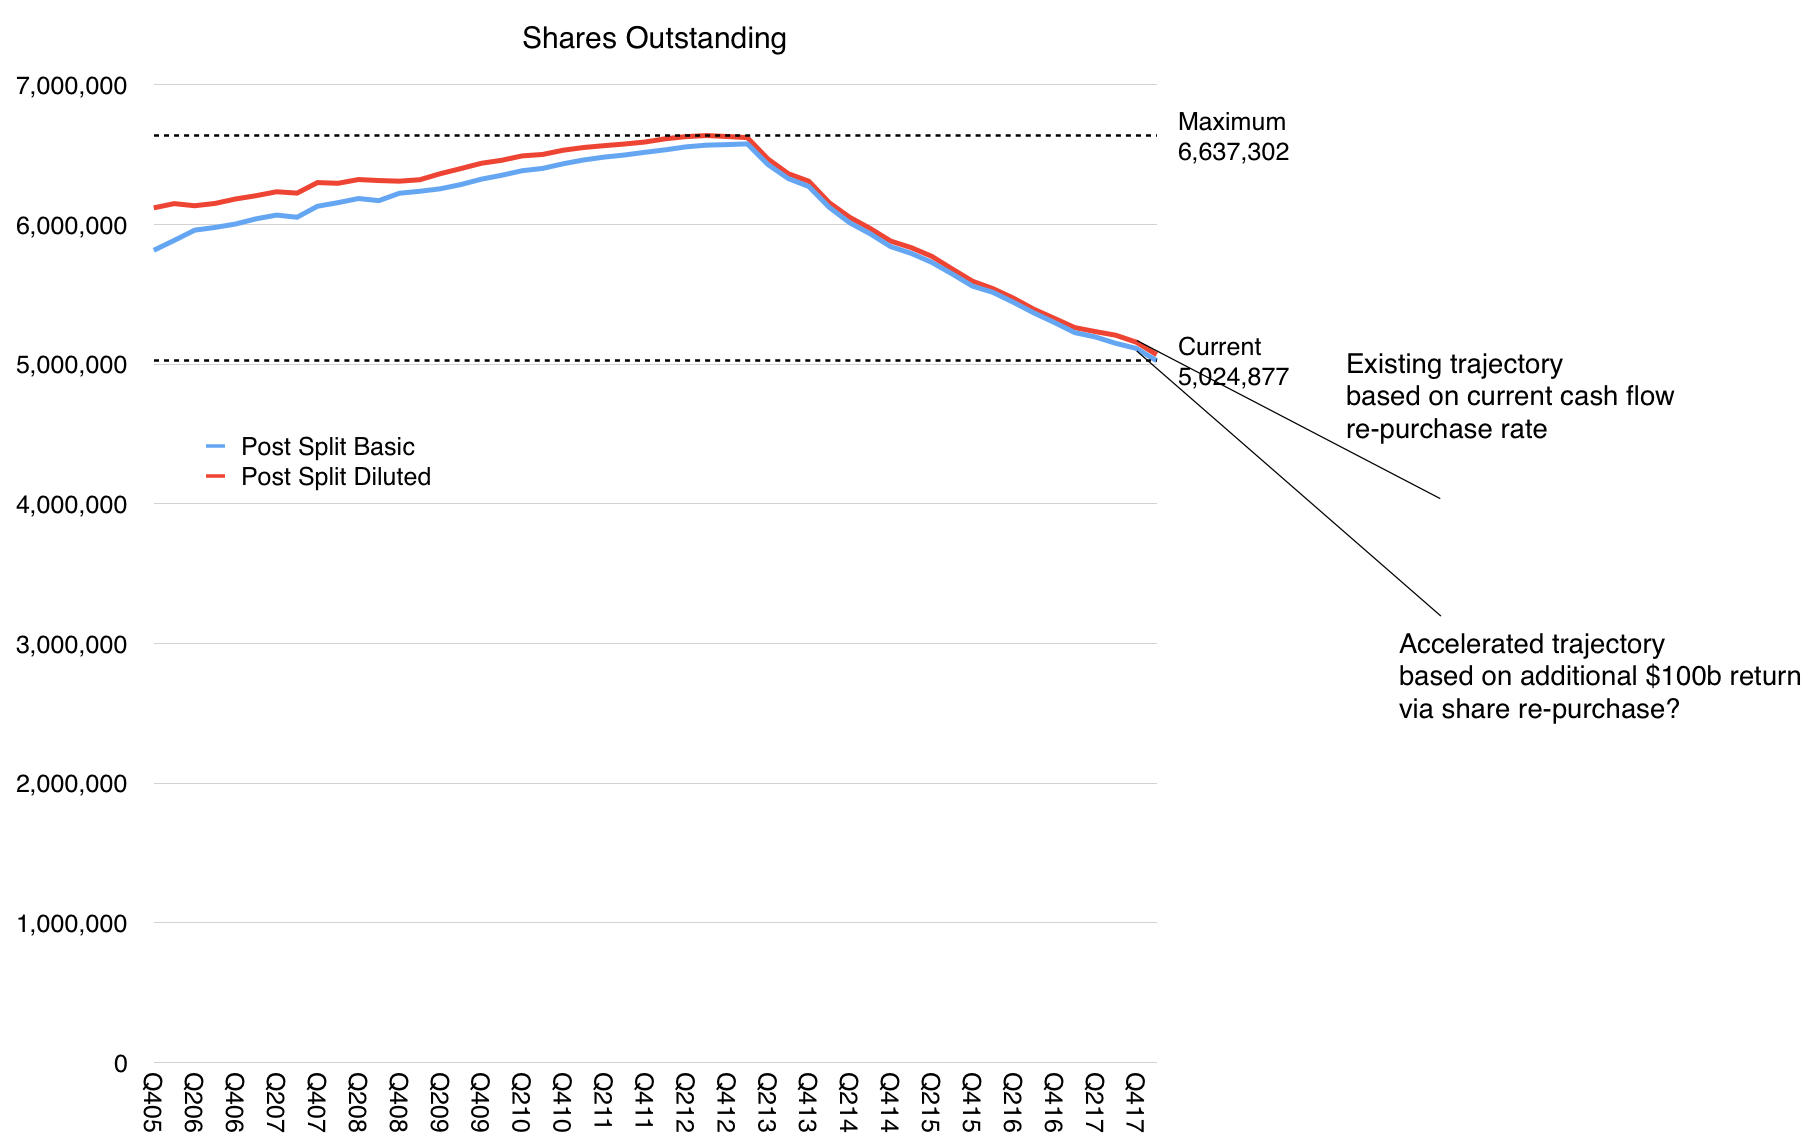
This last figure, the earnings per share, is the most speculative because it depends on another guidance that Apple gave: a new $100 billion share repurchase authorization and the fact that it has no time frame. For context, as of end of March the company had completed over $275 billion of its previous $300 billion capital return program and $10 billion remained for share re-purchases in the June quarter. It's unclear how much of the new authorization will be spent in the quarter.
That spending could indicate the share count but there are issues with this calculation as well. The $2.26 EPS I forecast is based on the assumption that the the same number of shares will be retired as in the previous quarter (about 89 million shares.) However the company spent $23.5 billion on repurchases of 137 million Apple shares through open market transactions (for an average price or $171.53, in-line with the quarter's trading average).
So why is the number of shares purchased (137 million) so different from the change in shares used to compute earnings per share (89 million)? I actually don't know.
The question of how many shares are available to calculating EPS is perhaps the last mystery in what is otherwise a very predictable business. The revenue growth and implied iPhone growth are pretty transparent. Incidentally, the EPS I'm forecasting is equivalent to growth of 35.8% y/y. The share price is trading at multiples about half of this growth rate so it's no wonder the company is spending most of the cash on re-purchases.
How quickly the $100 billion re-purchasing authorization will be used is another question. The effect in concentration of value per share could be profound as shown in the graph above which will have further implications on the "cash zero" direction for the company.
The following is a transcript of the comments from Tim Cook (CEO) and Luca Maestri (CFO) at Apple's Q1 2018 Earnings Conference Call February 1, 2018. I color coded my interpretation of the comments into four categories:
Grey: Background and promotional commentary
Red: Strategy and signals of what management considers important and may include data beyond the regularly reported numbers.
Green: Financial data
Black: Commentary.
Blue: My commentary, in brackets.
For a quick read of Apple's strategy, read the Red text. These comments are not repeated in financial reports. Highly recommended.
For a quick read of Apple's financial performance, read the green text (which are replicated in financial reports). Read this if you don't want to wade through the financial reports.
For marketing or product material, read the grey text.This is sometimes unique but also repeats product launch information.
---- Tim Cook: Thanks, Nancy and thanks everyone on the call, and welcome to everyone today. Before we dive into the quarter, I'd like to take a moment to talk about a significant milestone we recently crossed.
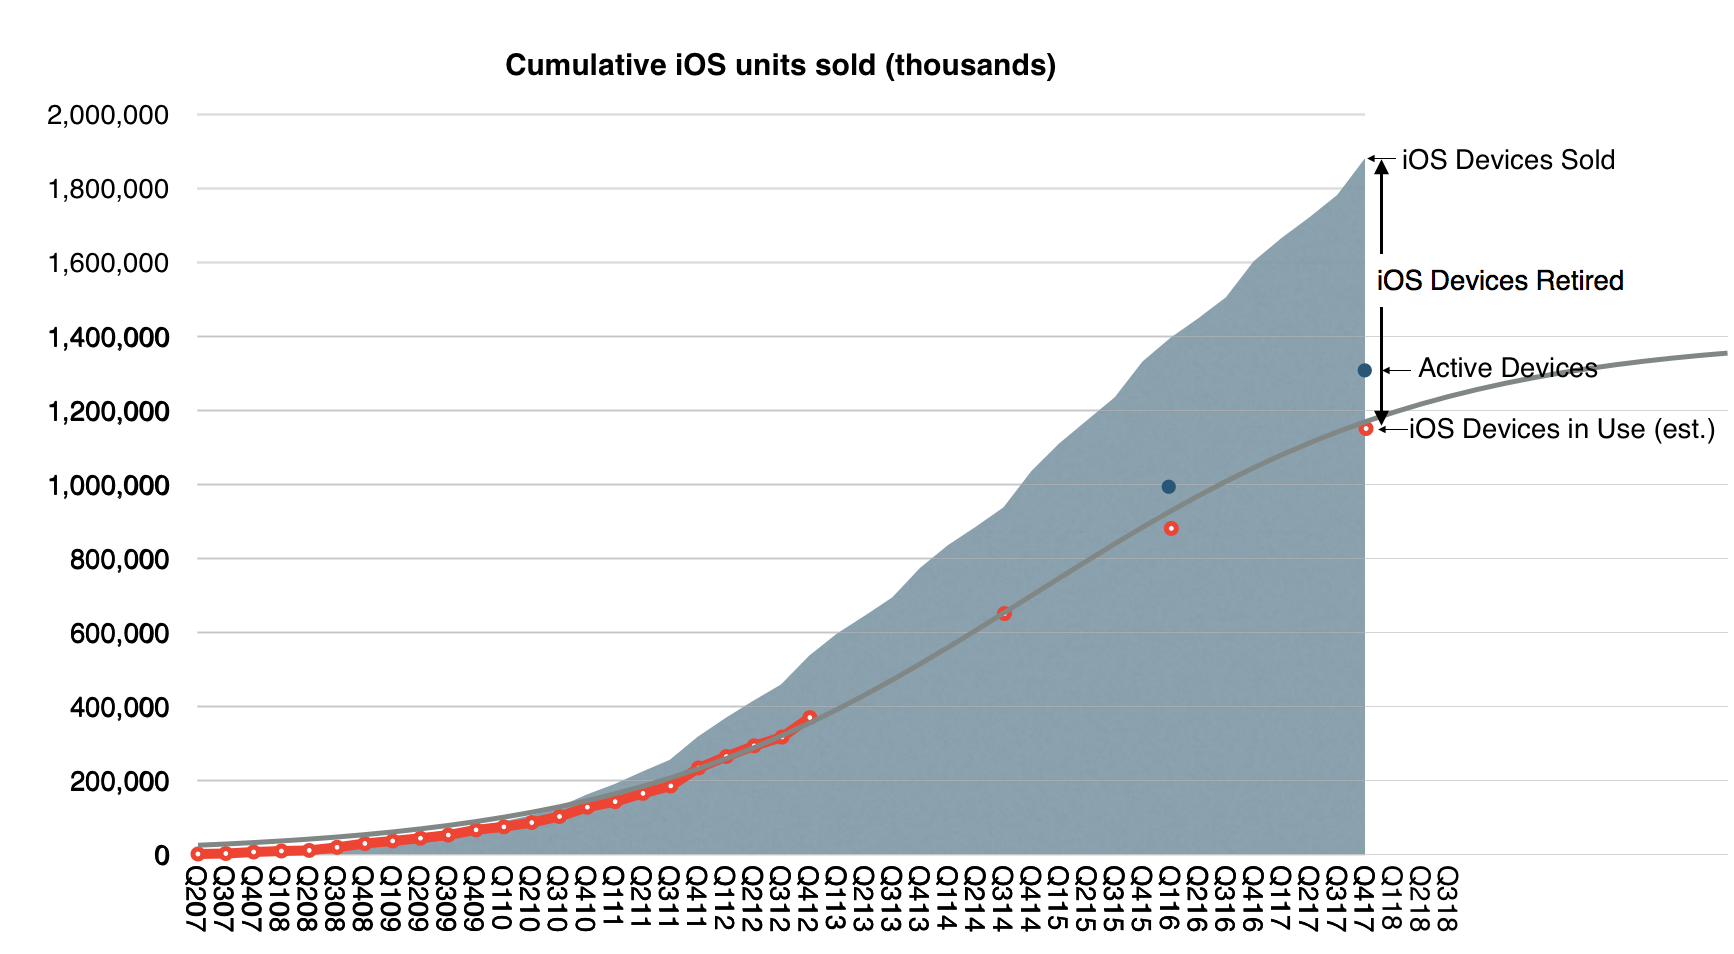
Apple's active installed base reached 1.3 billion devices in January and is at an all-time high for all of our major products. 1.3 billion devices represents an astonishing 30% growth in just two years. It speaks to the strength and reliability of our products and our ecosystem, as well as the loyalty, satisfaction and engagement of our customers. It's also fueling tremendous growth in our services business, which I’ll talk about a little later in the call. [This is probably Apple's most important number. For at least the next 20 years this is the key performance metric and it can be used to derive company's valuation. A summary of the history of active devices vs. units sold is shown in the graph below:]
Turning to the December quarter. We're thrilled to report Apple's biggest quarter ever, which set new all-time records in both revenue and earnings. We generated revenue of $88.3 billion, which is above the high-end of our guidance range, and it is up almost $10 billion or 13% over the previous all-time record we set a year ago.
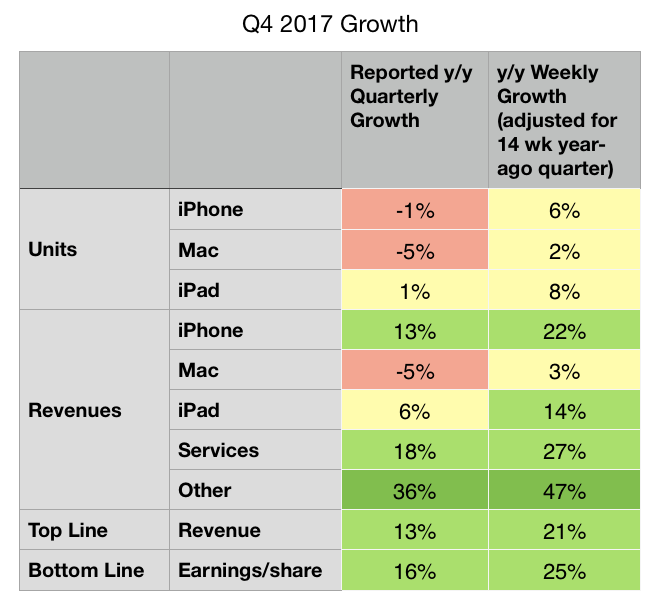
It's also our fifth consecutive quarter of accelerating revenue growth with double digit growth in each of our geographic segments around the world. What makes us even more remarkable is that the quarter we're reporting today was 13-weeks long, while the year ago quarter was 14-weeks. When we look at the average revenue per week in the December quarter this year compared to last year, our growth was a stunning 21%. [The 13-week vs. 14-week year-on-year comparison is repeated several times. The summary differences are shown in the table below:]
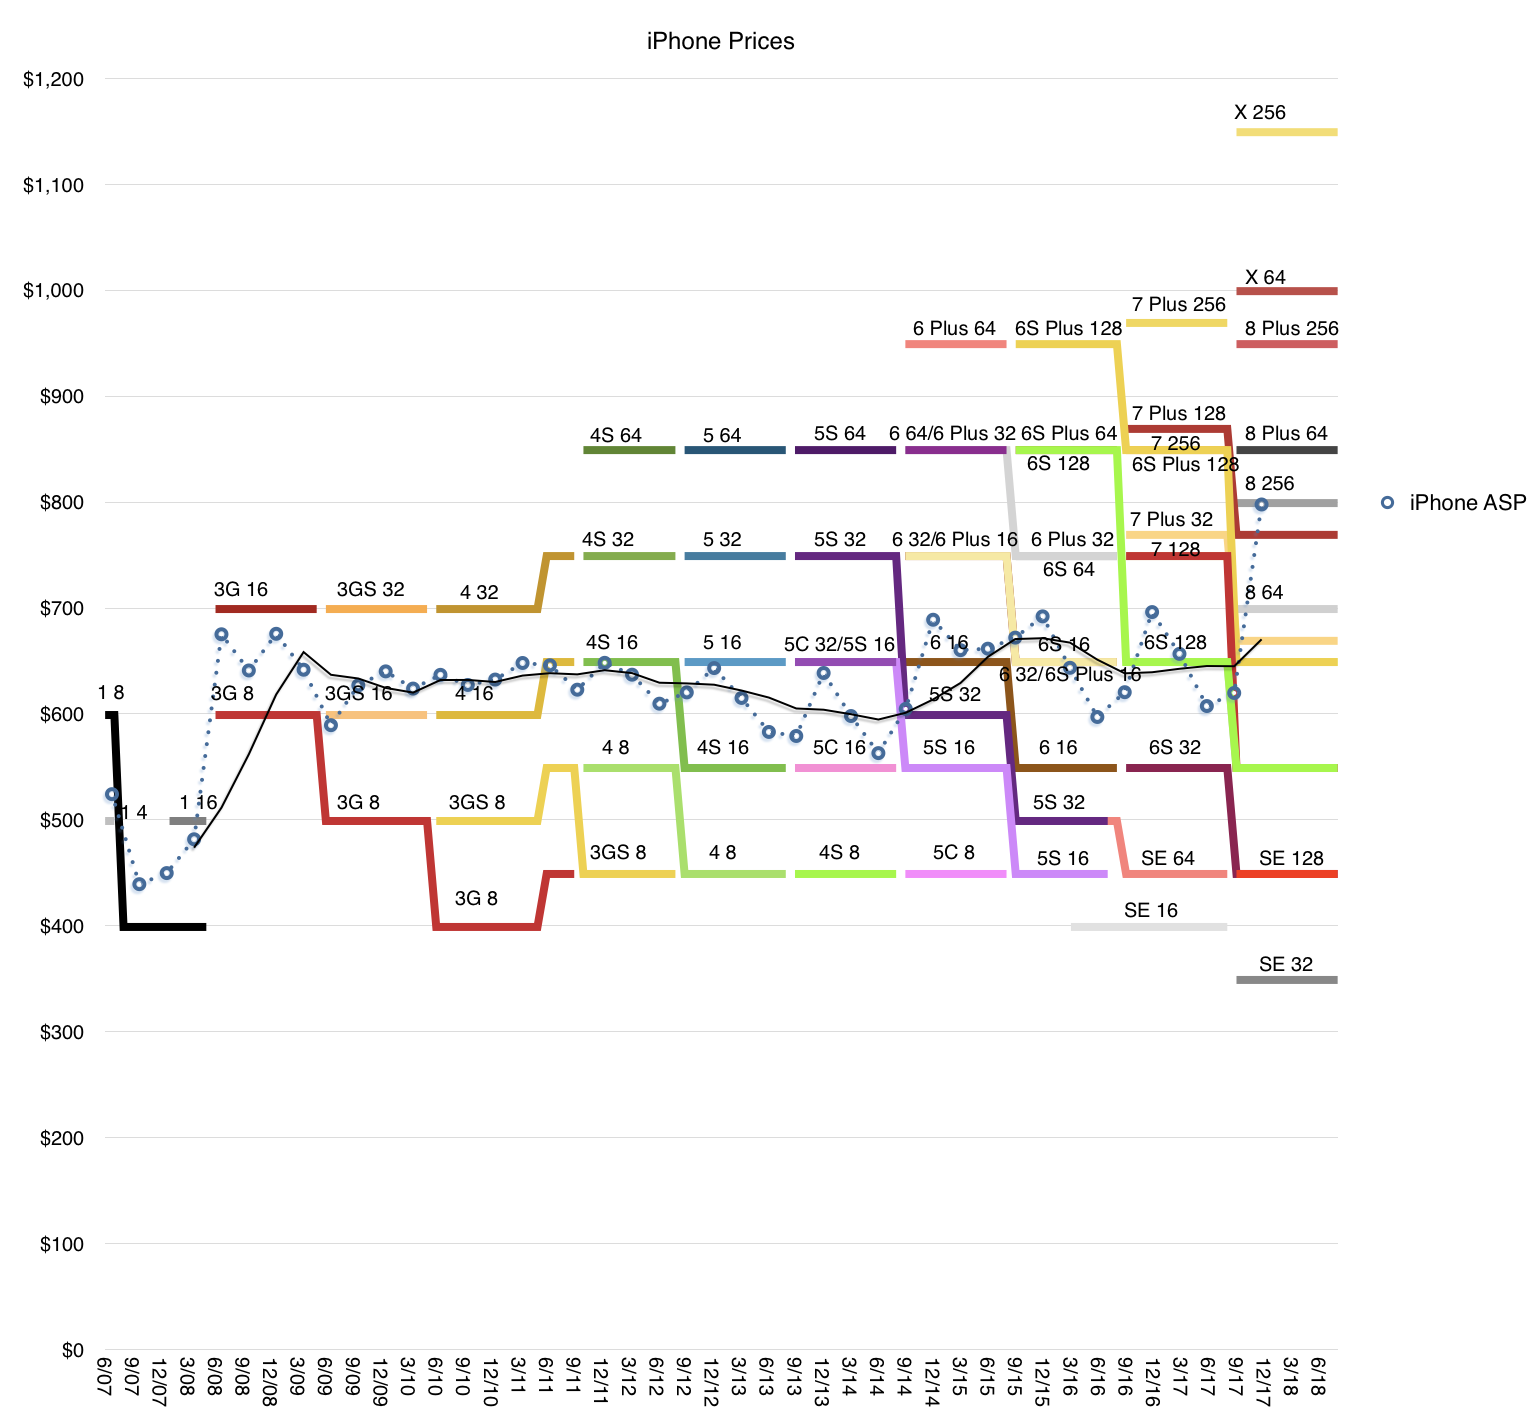
Our growth was broad-based and a key driver was iPhone, which generated its highest revenue ever. iPhone X was the best-selling smartphone in the world in the December quarter according to Canalys, and it has been our top selling phone every week since it launched. iPhone 8 and iPhone 8 Plus rounded out the top three iPhones in the quarter. In fact, revenue for our newly launched iPhones was the highest of any lineup in our history, driving total Apple revenue above our guidance range. [The iPhone X is a huge hit. It drove the average selling price $100 higher y/y. This is not only unprecedented for Apple but for the entire Industry. The average smartphone sells for less than $300 while iPhones sold for $800. The gap is widening. The following graph shows the product mix and the average resulting price.]
I want to take a moment to recognize the tremendous amount of work that went into creating iPhone 10. Our teams carried out an extremely complex launch from both an engineering and operations perspective, executing an outstanding product ramp that required years of research and development; one that introduced innovative features like an edge-to-edge Super Retina Display and the TrueDepth Camera, which enables face ID. Our customers love these new features and the new gestures like simply swiping up from the bottom, which make using iPhone even more intuitive and enjoyable.
Our team has put the technology of tomorrow in our customers’ hands today, set a standard for the next decade of smartphones and we are very proud of their achievements.
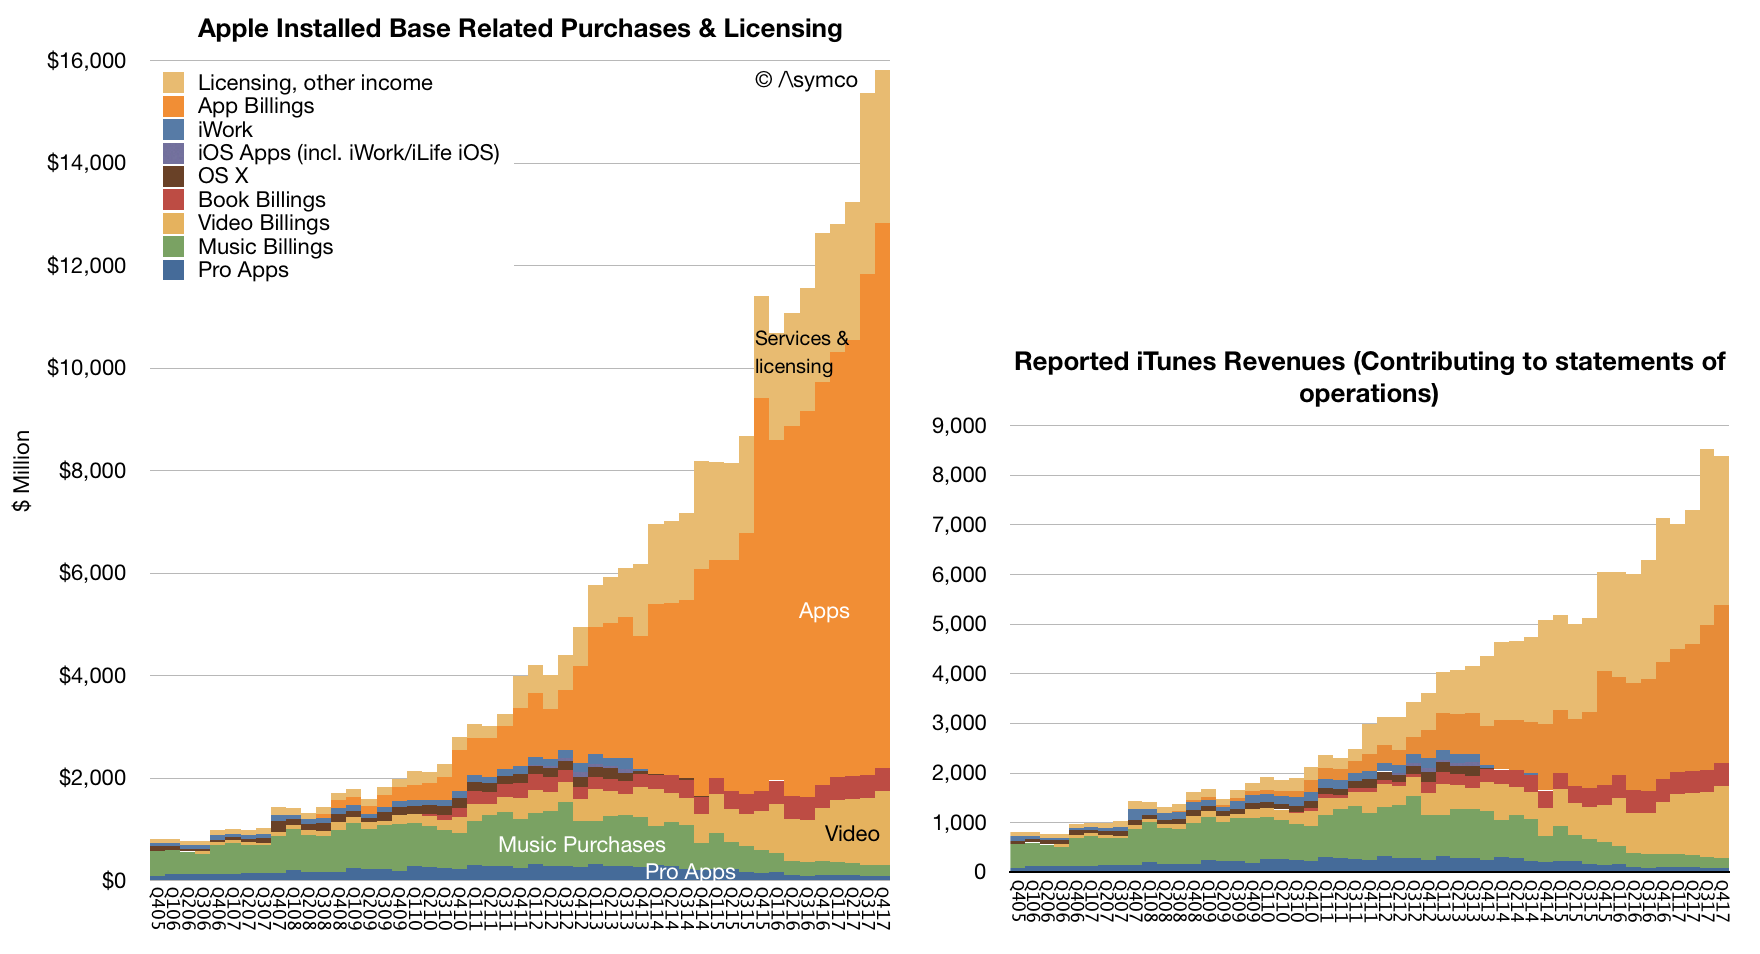
It was another very strong quarter for services with revenue of $8.5 billion, up 18% over last year, and we’re on pace to achieve our goal of doubling our 2016 services revenue by 2020. The number of paid subscriptions across our services offerings passed 240 million by the end of the December quarter, that’s an increase of 30 million in the last 90 days alone, which is the largest quarterly growth ever. [Services has been growing relentlessly for over a decade. This steadiness of growth makes is a juggernaut. Apple is increasingly speaking about subscriptions as the key metric and 240 million is reaching record territory. The rise of Services is shown below (both revenues and consumer spending.)]
We had an all-time record quarter for the App Store with our best holiday season ever. We’re seeing great excitement around augmented reality with customers now enjoying over 2,000 ARKit enabled app, spanning every category in the App Store. In December, when Pokémon GO released its new augmented reality features built with ARKit, it jumped the top of the App Store charts. Last week, on a stop in Toronto, I met developers who are hard at work on creative applications using ARKit from art appreciation to ecommerce, and I was very impressed with what I saw.
Just for months after ARKit launched to the public, we’ve already released ARKit 1.5 in beta to developers around the world, and the response has been tremendous. Augmented reality is going to revolutionize many of the experiences we have with mobile devices. And with ARKit, we’re giving developers the most advanced tools on the market to create apps for the most advanced operating system running on the most advanced hardware. This is something only Apple can do.
In addition to the App Store, several other services had their biggest quarter ever, including Apple Music, iCloud and Apple Pay, all of which saw growth in both active users and revenue.
Apple Pay has reached an important milestone in the U.S. As a result of 50% year-over-year growth in merchant adoption, it’s now accepted at more than half of all American retail locations, which includes more than two-thirds of the country’s top 100 retailers. Now available in 20 markets, global Apple Pay purchase volume more than tripled year-over-year and we’re delighted to be expanding to Brazil in the coming months. [There are no absolute data points on Apple Pay but we do have some scattered growth data. The US data is cited here but in my experience it's more popular in select countries like UK where users are using it habitually]
Today, you can use Apple Pay to take the subway in Guangzhou, China, see a concert at London’s Wembley Stadium or buy a souvenir in Yosemite National Park. In the U.S., we launched Apple Pay Cash in December, and it’s off to a terrific start. Millions of people are already using it to send and receive money with friends and family quickly, easily and securely; to split a bill, pay someone back, or send last minute gift right from the messages app.
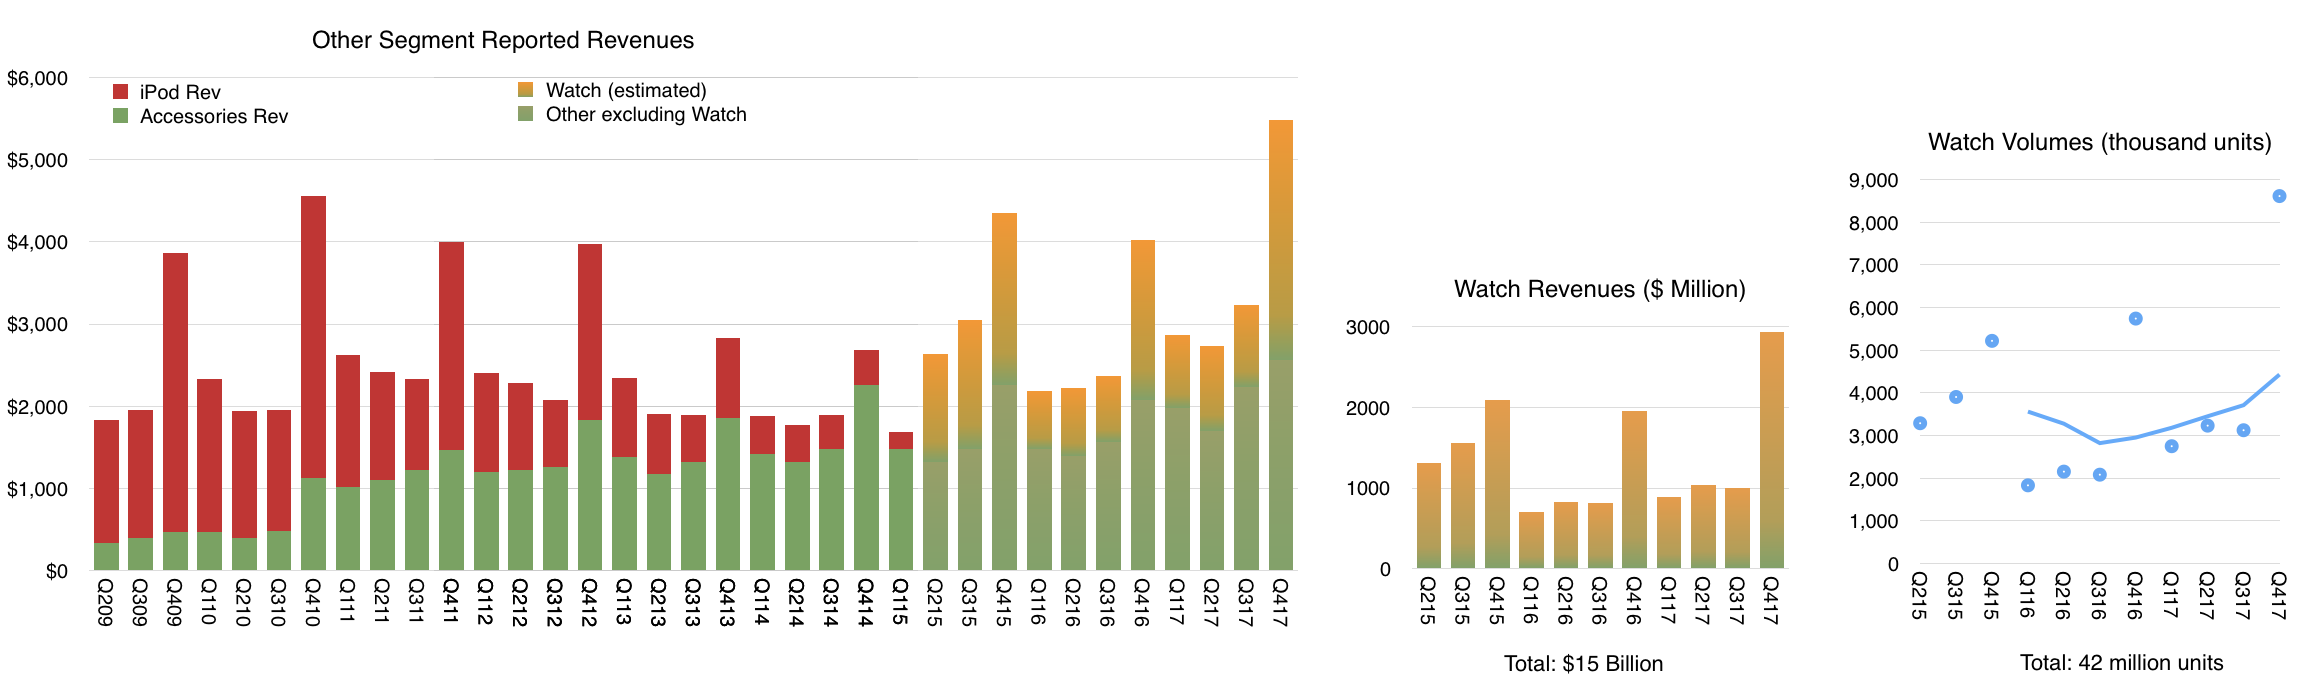
It was our best quarter ever for the Apple Watch with over 50% growth in revenue and units for the fourth quarter in a row and strong double-digit growth in every geographic segment. Sales of Apple Watch Series 3 models were also more than twice the volume of Series 2 a year ago. Apple Watch is the most popular, smart watch in the world and gained market share during the quarter based on the latest estimates from IDC. [Apple Watch is growing consistently. The following graph shows my estimates of volume (total 42 million to date) and revenues (total $15 billion) based on all available data and commentary from management.]
It was the third consecutive quarter of growth for iPad revenue, thanks to the strength of both iPad and iPad Pro. Based on the latest data from IDC, we gained share in nearly every market we track with strong outperformance in emerging markets.
Worldwide, almost half of our iPad sales were the first-time tablet buyers are those switching to Apple, and that’s true in some of our most developed markets, including Japan and France. In China, new and switching users made up over 70% of all iPad sales.
For Mac, we launched the all new, iMac Pro in mid-December. It’s an entirely new product line designed for our Pro users who love the all-in-one design of iMac and require workstation class performance. It's the fastest, most powerful Mac ever, delivering incredible computational power, for simulation and real time 3D rendering, immersive VR and complex photography audio and video projects. Worldwide, 60% of our Mac sales were the first time buyers and switchers and in China, that number was almost 90%.
We're looking forward to getting HomePod in customers’ hands beginning next week. HomePod is an innovative wireless speaker, which delivers stunning audio quality wherever its placed in the home, thanks to the advanced Apple engineered hardware and software.
Together with Apple Music, HomePod gives you instant access to one of the world's largest music catalogs. And with the intelligence of Siri, it’s a powerful assistant you control through natural voice interaction. We're very happy with the initial response from reviewers who've experienced HomePod ahead of its launch, and we think our customers are going to love this new product.
We believe one of the key issues of the 21st century is education. And because of that, we've strengthened our commitment and investment into initiatives like everyone can code. To find the innovators of the future, we need to nurture the students of today. Our App Development with Swift curriculum, which is available free on iBooks, has been downloaded more than 1.2 million times worldwide with almost half of those coming from here in the United States. It’s also being taught in dozens of community colleges across the country, putting practical skills in the hands of today’s jobs seekers.
I was in London two weeks ago as we announced that the program was expanding to more than 70 colleges and universities in Europe. Millions of students around the world will have the opportunity to add Swift to their coding vocabulary and gain skills that are essential for today’s economy.
This is an exciting time at Apple and with the best lineup of products and services we've ever had and a set of initiatives that show how business can be a force for good in the world. We could not be more excited about our future.
Now, for more details on the December quarter results, I'd like to turn over the call to Luca.
Luca Maestri: Thank you, Tim. Good afternoon, everyone. Our business and financial performance in the December quarter were exceptional, as we set new all-time records for revenue, operating income, net income and earnings per share.
Starting with revenue, we’re reporting an all-time record, $88.3 billion, up nearly $10 billion or 13% over the prior record set last year. It is our fifth consecutive quarter of accelerating revenue growth. As you know, the December quarter a year ago spanned 14-weeks compared to 13-weeks this year, which is important to consider as we have set the underlying performance of our business this year. When we look at average revenue per week, our growth rate was even higher at 21% with growth across all product categories for the third consecutive quarter.
Our results were terrific all around the world with double digit revenue growth in all our geographic segments, an all-time quarterly record in the vast majority of markets we track, including the U.S., Western Europe, Japan, Canada, Australia and Korea, as well as Mainland China, Latin America, The Middle East, Central and Eastern Europe, and India.
In Greater China, we were very happy to generate double digit revenue growth for the second quarter in a row and in emerging markets outside of Greater China, we saw 25% year-over-year growth.
Gross margin was 38.4% at the high end of our guidance range. Operating margin was 29.8% of revenue. Our net income was $20.1 billion an all-time record, and up $2.2 billion over the last year. Diluted earnings per share were $3.89 also an all-time record and cash flow from operations was very strong at $28.3 billion.
During the quarter, we sold 77.3 million iPhones, the highest number ever for a 13-week quarter. Average weekly iPhone sales were up 6% compared to December quarter last year with growth in every region of the world despite the staggered launch of iPhone 10. We established all-time iPhone revenue record in nearly every market we track with double-digit growth in all of our geographic segments. iPhone ASP increased to $796 from $695 a year ago, driven primarily by the launch of iPhone 10 and the success of iPhone 8 and 8 Plus.
We exited the December quarter towards the lower end of our target range of five to seven weeks of iPhone channel inventory with less than 1 million more iPhones in the channel compared to the December quarter a year ago, in line with our growth in average weekly unit sales. Customer interest and satisfaction with iPhone are very, very strong for both consumers and business users.
The latest data from 451 Research indicates U.S. customer satisfaction ratings of 96% or higher across iPhone models. In fact, combining iPhone 8, iPhone 8 Plus and iPhone 10, consumers reported an amazing 99% satisfaction rating. And among business customers planning to purchase smartphones in the next quarter, 77% planned to purchase iPhone. Our customers are also incredibly loyal with Kantar's latest U.S. research, reflecting a 96% iPhone loyalty rate, the highest ever measured. [Customer satisfaction is the second most important figure after active user base. Combining these two figures yields the recurring revenue value of the company. Remember what Deming said: the most important measurements for a company's value are the multipliers of a satisfied customer and a dissatisfied customer--these numbers never appear on any financial report but they are applied to all the numbers on every report].
Turning to services. We had a terrific quarter with revenue of $8.5 billion, up 18% year-over-year and up 27% in terms of average revenue per week; that is an acceleration to the 24% services growth run rate that we experienced in the September quarter.
The App Store set a new all-time revenue record. The Store’s all-new design is off to a fantastic start with quarterly store visitors, transacting accounts and paying accounts, reaching new all-time highs. During the week beginning December 24th, a record number of customers made purchases or downloaded Apps from the App Store, spending over $890 million in that seven-day period, followed by $300 million in purchases on New Year’s day alone.
And according to App Annie’s latest report, the App Store continues to be the preferred destination for customer purchases by a very wide margin, generating nearly twice the revenue of Google Play. Across all our services offerings, paid subscriptions reached $240 million with growth of 58% over last year and they were a major contributor to the overall strong growth in services revenue. [Apple has half the user base of Google Android. This is based on Google's May 2017 report of 2 billion active devices vs. the 1.3 billion that we just got from Apple. And yet these users collectively spend twice as much on apps. This ratio of "half the users, twice the spending" has been cropping up in individual developer anecdotes and can also be seen in other metrics of engagement and consumption. This should not be surprising as it conforms to the Pareto distribution of economic value.]
As Tim mentioned, it was our best quarter ever for Apple Watch. And when we add to this us from Beats and AirPods, our total revenue from wearables was up almost 70% year-over-year. In fact, wearables were the second largest contributor to revenue growth after iPhone, which is impressive for a business that started only three years ago. In total, our other products category set a new all-time record with quarterly revenue exceeding $5 billion for the first time. [Wearables now includes more than watches but watches are likely still the dominant product.]
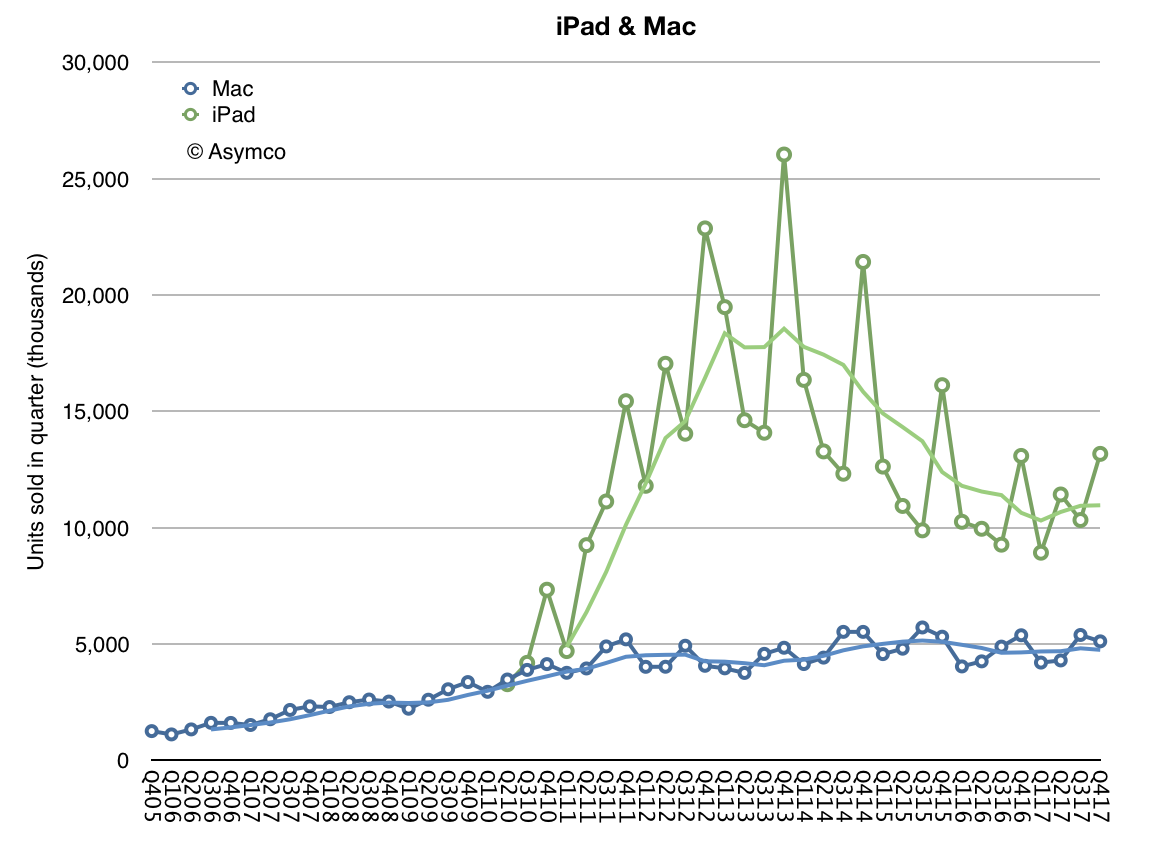
Next, I’d like to talk about the Mac. We sold 5.1 million Macs during the December quarter, which translates to a 2% year-over-year increase in average sales per week. Mac performance was particularly strong in emerging markets with unit sales up 13% year-over-year and with all-time records in Latin America, in India, Turkey and Central and Eastern Europe. On a worldwide basis, the active install base of Macs was up double-digits year-over-year to a new record.
It was also another growth quarter for iPad. We sold 13.2 million units with average iPad sales per week up 8% over last year’s December quarter. iPad sales grew strong double-digits in many emerging markets, including Latin America, the Middle East, Central and Eastern Europe and India, as well as developed markets, including Japan, Australia and Korea. The active install base of iPad has grown every quarter since its launch in 2010, and it reached a new all-time high in December, thanks to extremely high customer loyalty and large numbers of first-time iPad users. [iPad is clearly recovering from a long decline. ASPs are rising as it's being positioned as a PC alternative. Its low end functions are being absorbed by large screen iPhones.]
NPD indicates that iPad had 46% share of the U.S. tablet market in the December quarter, up from 36% share a year ago. And the most recent surveys from 451 Research found that among customers planning to purchase tablets within 90 days, 72% of consumers and 68% of business users planned to purchase iPads. Customer satisfaction is also very high with businesses reporting a 99% satisfaction rating for iPad.
We are seeing great traction in enterprise as businesses across industries and around the world standardize on iOS. For example, Intesa Sanpaolo, one of Europe’s leading banks, has chosen iOS as the mobile standard for its entire 70,000 employee base in Italy; choosing iOS for its security, user interface, accessibility and reliability, Intesa Sanpaolo will deploy native apps to improve employee productivity in customer support, human resources, and marketing across the company.
And LensCrafters, one of the largest optical retail brands in North America, will be using over 7,000 iPad Pros to enable digital eye exams and digital optical measurements in a personalized and interactive experience. We’re also rolling out a new initiative, called Apple AtWork to help businesses implement employee choice programs more easily and offer Apple products company-wide.
Resources from both Apple and our channel partners will enable enterprise IT and procurement teams to buy or lease Apple products more efficiently, streamline the setup of iPhone, iPad, and Mac, and deliver a seamless onboarding experience for employees. We launched the program with CDW in the U.S. last week, and we would be expanding to more channels and regions later this year.
The December quarter was extremely busy for our retail and online stores, which welcomed 538 million visitors. Traffic was particularly strong during the four-weeks following the launch of iPhone 10, up 46% over last year. And across the quarter, our stores conducted over 200,000 today at Apple sessions, covering topics including photography, music, gaming, and app development, and art and design. Just last weekend, we opened our first store in Seoul, Korea and we’re looking forward to opening our first store in Austria in a few weeks. These newest openings will mark the expansion of our retail store presence to 21 countries.
Let me now turn to our cash position. We ended the quarter with $285.1 billion in cash plus marketable securities, a sequential increase of $16.2 billion. $269 billion of this cash, or 94% of the total, was outside the United States. We issued $7 billion in debt during the quarter, bringing us to $110 billion in term-debt and $12 billion in commercial paper outstanding, for a total net cash position of $163 billion at the end of the quarter. We also returned $14.5 billion to investors during the quarter. We paid $3.3 billion in dividends and equivalents, and spent $5.1 billion on repurchases of 30.2 million Apple shares through open market transactions.
We launched a new $5 billion ASR program, resulting in initial delivery and retirement of 23.6 million shares and we retired 3.8 million shares upon the completion of our 12th ASR during the quarter. We’ve now completed over $248 billion of our $300 billion capital return program, including $176 billion in share repurchases against our announced $210 billion buyback program with $34 billion remaining under our current authorization. [An updated look at Apple's cash is shown below]
Turning to taxes. Due to the recently enacted legislation in the U.S., we estimate making a corporate income tax payment of approximately $38 billion to the U.S. government on our cumulative past foreign earnings. This amount is very similar to what we had been accruing on those earnings in our financial results through fiscal year 2017, including the $38 billion payment. We will have paid over $110 billion of corporate income tax on our total domestic and foreign earnings during the last 10 years for a cash tax rate of about 26%. [Apple has paid more tax than any company in history, and is about the make the largest single payment to the US Treasury.]
Our tax rate of 25.8% for the December quarter was close to our guidance of 25.5% as the lower U.S. statutory rate from the new legislation was effective offset by the remeasurement of deferred tax balances.
As we move ahead into the March quarter, I'd like to review our outlook, which includes the types of forward looking information that Nancy referred to at the beginning of the call; we expect revenue to be between $60 billion and $62 billion; we expect gross margin to be between 38% and 38.5%; we expect OpEx to be between $7.6 billion and $7.7 billion; we expect OI&E to be about $300 million; and we expect the tax rate to be about 15%.
Tax reform will allow us to pursue a more optimal capital structure for our company. Our current net cash position is $163 billion. And given the increased financial and operational flexibility from the access to our foreign cash, we are targeting to become approximately net cash neutral overtime. We will provide an update to our specific capital allocation plans when we report results for our second fiscal quarter, consistent with the timing of updates that we have provided in the past.
Finally, today our Board of Directors has declared a cash dividend of $0.63 per share of common stock, payable on February 15, 2018, to shareholders of record as of February 12, 2018.
To the nearest million, as of the end of September 2017, Apple's cash and investments totaled $268,895,000,000. Note that this includes investments in the form of short- and long-term marketable securities. Long-term marketable securities are not always accounted as "cash" because strictly cash is considered a liquid asset and some securities may not be sufficiently so. Nevertheless, most analysts would agree that Apple's securities are sufficiently liquid to qualify as cash. Note that for archaic reasons this cash is separated into US and non-US holdings with $17 billion located in the US.
Most businesses keep very little cash on their books. Why does Apple have so much cash?
Indeed Apple's cash is extraordinary. It amounts to about 30% of its market capitalization. One reason is that Apple has taken many loans, totaling about $100 billion.
Whoa! Why would Apple need to take out loans? Does it have problems with cash flow? ((Companies often borrow because they need to plug gaps in profitability, best measured as "free cash flow".))
Quite the contrary, Apple's operating cash flow is eye-watering. In the 2017 fiscal year (ending September) Apple generated $63,598,000,000 from operations. The loans are not needed to operate. They are used to pay shareholders.
Why does Apple need to pay shareholders?
Because it's their money.
Wait, I thought you said this was Apple's cash.
Apple is holding it for them but if it has more than it needs it's obligated to return it. You see, If you were to look for "cash" in financial statements you find it on the balance sheet as an asset. Since it is growing and since a balance sheet has to balance, there has to be a liability that grows in proportion to offset the cash asset. That liability is called Shareholder's Equity. This is a "debt" the company has to shareholders. If it pays out cash to shareholders then it zeros out an asset and a corresponding liability. The net is zero as far as Apple is concerned but shareholders get something in return for giving Apple money in the first place.
So hold on, it takes out loans to pay shareholders because it "owes them money" while it has too much money? This makes no sense.
Yes, welcome to tax laws. Although it generates more money than it can use, and that money should thus be returned to shareholders, some of the money is collected outside the US. US (and US only as far as I know) tax laws have a "repatriation tax" that is levied on money coming into the country. This has nothing to do with corporate taxes which are levied on earnings. So after paying shareholders with the cash it had in the US, Apple had to borrow money to pay shareholders money they had outside the US.
Why not just pay the repatriation tax?
Because then shareholders would get less than 70% of their money. They would probably complain and blame the managers for being incompetent. Such blame usually comes with a lawsuit attached.
What about the new tax law that lowered the repatriation tax rate?
Now Apple has no option but to pay the tax and repatriate the cash. It's still a tax. The amount will be about $38 billion or about 15%. Previous repatriation "holiday" levies were around 10%.
How exactly does the company give money to shareholders?
The payments are called "dividends" and shareholders must treat them as income--a form of double taxation because these funds are after the company paid earnings tax and possibly repatriation tax. Apple does pay dividends regularly but because of tax inefficiency (i.e. because government policy discourages dividends) the company mainly buys its own shares and retires them.
Huh?
Yes, it makes little sense but the math is simple. If the company buys its own shares and makes them disappear then existing shareholders will end up owning more of the company, making their shares more valuable. They can realize the gain if/when they sell the shares (and pay capital gains tax instead of dividend income tax on the already (double) taxed profits.)
Does that mean that it is going private?
No. The owners of the company remain the same: whoever owns shares owns the company and they can be traded in public exchanges. In theory they could reduce the share count to a single share and there would presumably be a single shareholder who would own the company, making it "closely held" but the company's managers are still required to report and act as if it was public. Going private usually means a set of shareholders agree not to allow the shares to float on the open market and thus to also keep the affairs of the company out of public eye. It reduces liquidity and is generally harder for shareholders to exit their investment. This has nothing to do with reducing the number of shares in circulation--which is what Apple is doing.
But buying shares does not seem to affect the share price so the shareholders are not benefiting from the repurchasing. Isn't this a waste of cash? Aren't the shareholders being robbed?
The share price is an argument between shareholders and potential shareholders on the value of the company. It should reflect reality but many times it doesn't. Over time however the math catches up with sentiment. In other words realization that there are fewer and fewer shares available compels people to not sell them, increasing the price. Short term investors tend not to pay attention to this but they are not the shareholders who Apple wishes to pay back anyway.
Why doesn't the company spend the money on other things? You said they return what they can't use. Why can't they use it?
Simply, because it's more than can be spent wisely. The company considers its mission to be very narrow: add value in specific areas where they can create tremendous value uniquely and under conditions (technologies and business models) they can control. Many such projects don't require capital. Manufacturing, data centers and Apple stores require capital but R&D and sales not so much. Creating products is very cash efficient. For example, the iPhone--the most successful product of all time--cost almost nothing to develop; certainly nothing that required Apple to dip into its cash. Funding for the type of product development Apple does comes from existing cash flows and mostly consists of salaries for their employees.
What about acquisitions? Why not buy other companies?
It buys companies but usually small ones which are essentially acquisitions of teams and their intellectual property. Apple does not buy "business models" or customers or cash flows which is what large companies are valued for. Operationally, it's also because Apple has a strong culture and it wishes to preserve it. Acquisitions dilute culture which is why integrations often fail. Statistically, large acquisitions are value destructive and the larger they are, the more likely they are to fail. Incidentally, when a company is acquired with cash that hole in the balance sheet is filled with something called "goodwill" which reflects some intangible value of the new asset. If and when the acquisition is deemed to have failed the goodwill is written off and so is shareholder equity. That's how shareholders are robbed.
What about keeping it? Doesn't having lots of cash make Apple more powerful?
As individuals we think that having lots of cash makes us rich. For companies it's the opposite. Cash is a liability. If you come across a company that is cash rich and has nothing else, its enterprise value will be zero. Companies are valued on their future cash flows, meaning their ability to generate cash, not how much they managed to keep. In other words, cash is a measure of past success and investors are interested only in future value. That future value comes from the intelligent allocation of resources toward a valuable goal. A company rich in cash but poor in vision is likely to be taken private or broken up and shut down. Cash is an IOU to shareholders with a thank-you note for the support through the years.
The last quarter of 2016 was Apple's biggest ever. $78.4 billion in revenues. 78.3 million iPhones. Both records. Earnings of $3.36 ((On shares priced at the time around $105 or 3.2% yield quarterly earnings)) and cash reached new highs. The growth was modest but Services is now not just the second largest revenue but also the fastest growing, on track to doubling in four years.
The reason for this is the vastness of Apple's user base coupled with the loyalty the brand engenders. The company reached one billion active devices more than a year ago and is quite likely to have nearly a billion users. Not just any billion either--the best billion most probably.
The realization that Apple benefits from extreme quantity and quality of customers has led some observers to defer the imminence of Apple's demise. Share prices have risen lately to new highs and the ratios between these prices and earnings have started to come closer to the average of other large companies.
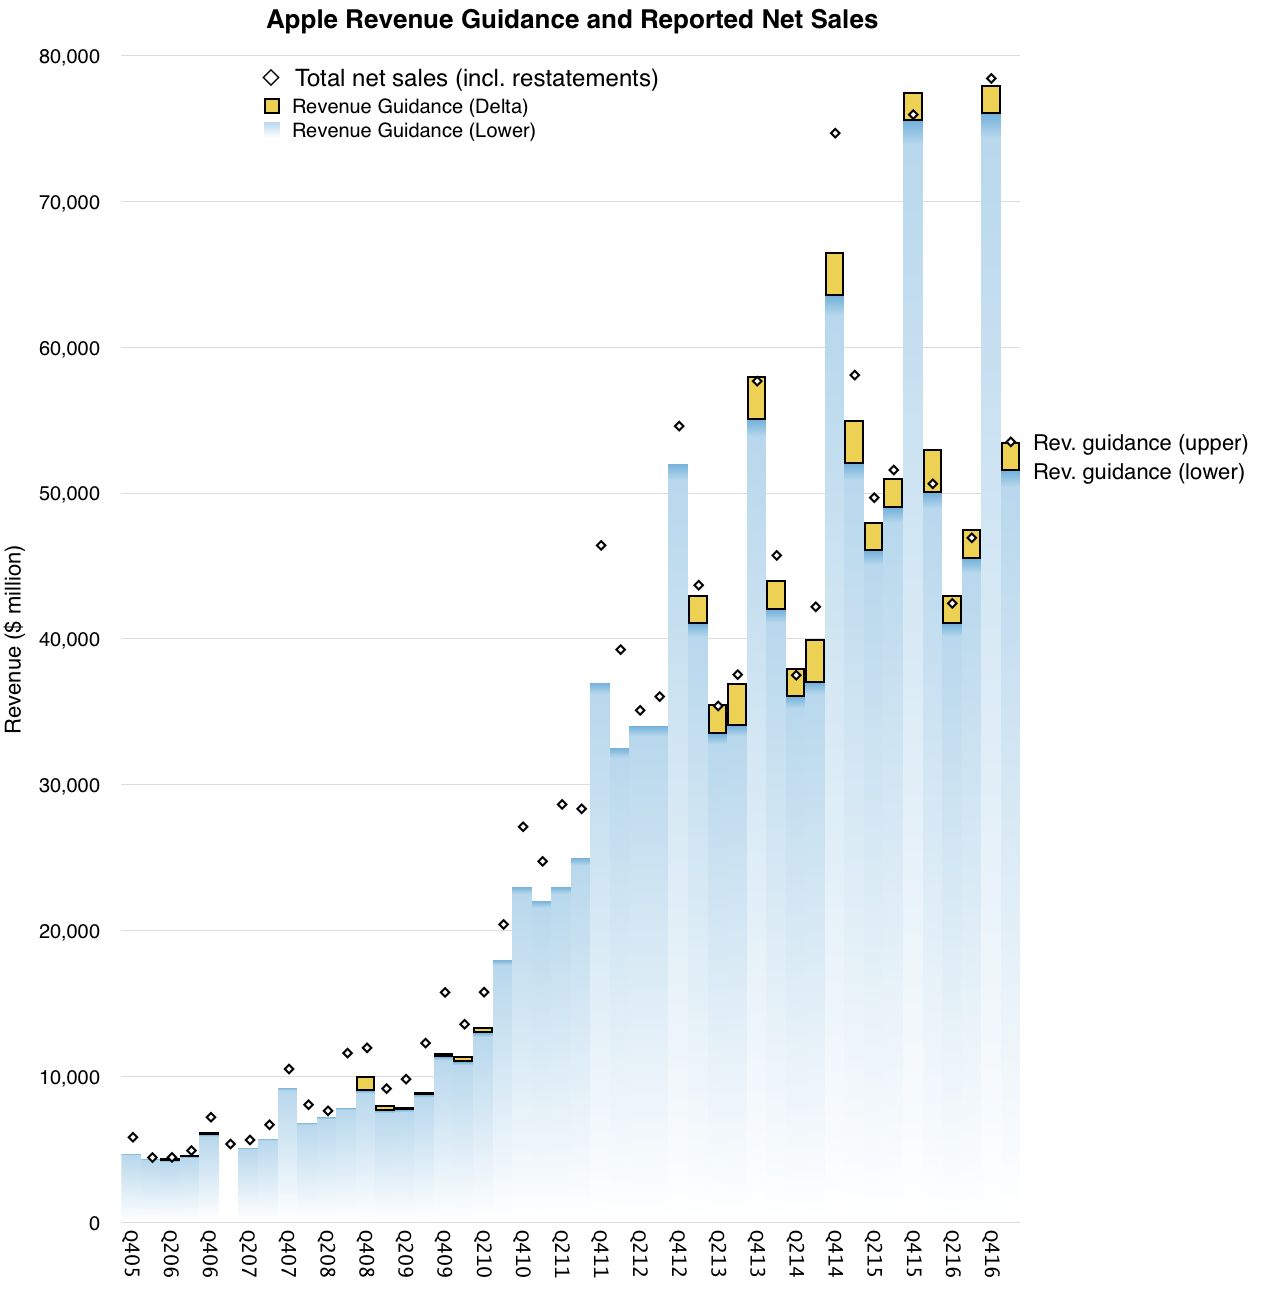
But enough with the reductio ad absurdum. Let's look at the next quarter. The company has been very precise with its own offered predictions (guidance) so it's a simple task to make an accurate forecast. The history of guidance vs. outcomes for revenues is shown below:
Placing the pipper on the upper edge of the guidance range was a safe targeting method for 11 of the last 17 quarters. We have never seen a drop below the bottom of the range but had a few overshoots, some huge. Doing this for the latest quarter and working backwards to the individual product contributions to revenue and using historical margin and cost patterns we can get the following core financial performance metrics:
I sent these estimates to Philip-Elmer DeWitt and I recommend looking at his survey of the other analyst estimates on his excellent Apple 3.0 blog.
Overall, the quarter is shaping up to offer slight growth y/y and indicating a plateau formed after the surge from the iPhone 6 surge in '15. All eyes are on the "super cycle" for the next iPhone.
The reason it's "super" is that the iPhone has a 2+ year cadence for form factor changes and the user base updates on a similar cycle. The demand is vast due to the user base and accumulated age of devices in use. Expectations are that supply will be offered to meet this demand.
If history is a guide then the next iPhone will be the best iPhone ever.
In this special "live" version of The Critical Path, Horace gets the numbers just minutes before Apples January 27th, 2015 earnings call and dissects them live. The show picks up just after the call finishes with a quick recap and discussion of yet another record quarter.