Revenue and EPS consensus, year-ago results and my expectations
Yahoo Finance
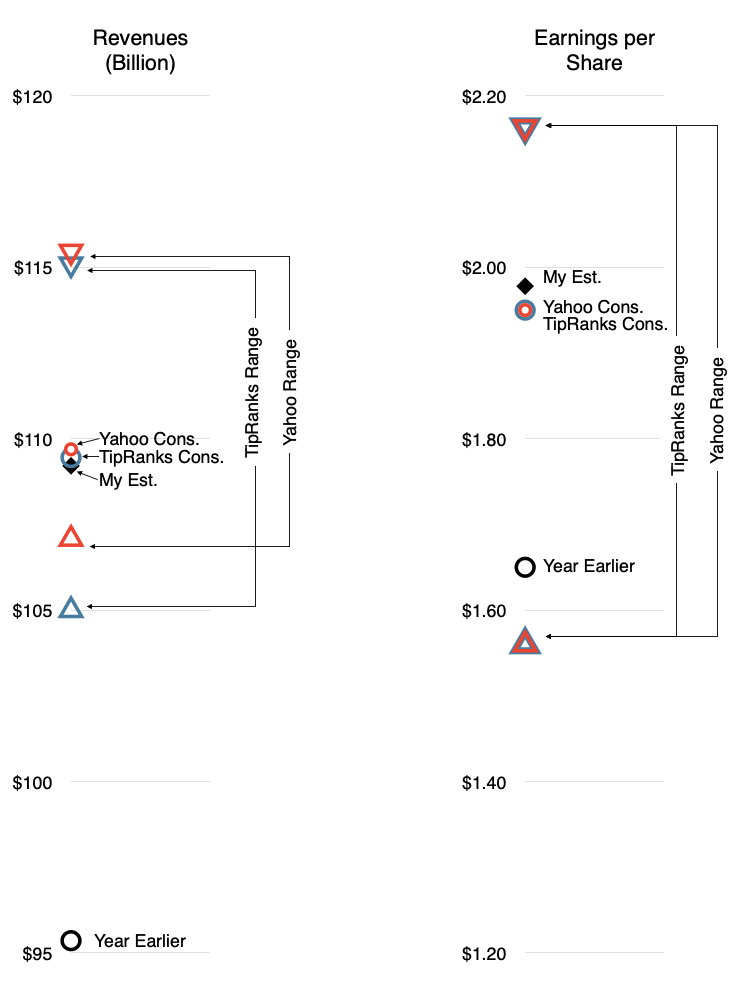
Yahoo Finance's revenue estimate for Apple in Q2 stems from 31 analysts. As of April 25, the average estimate is $109.69 billion, with a low of $107.08 billion and a high of $115.37 billion.
For the earnings per share estimate, 32 analysts put it at an average of $1.95. The low is $1.56 and the high is $2.16.
TipRanks
TipRanks also does its own analyst polling on Apple's quarter. In its forecast as of April 19, its consensus is for a revenue of $109.45 billion, with a high of $115 billion and a low of $105 billion.
On the earnings per share, the consensus is $1.95, with a high of $2.16 and a low of $1.56.
A summary of the expectations include year earlier results and my own estimates is shown the following graph:
Goldman Sachs is pushing back on negative sentiment surrounding Apple ahead of its second-quarter earnings, arguing that the stock's recent underperformance reflects fears that do not match the company's underlying position.
But analyst Michael Ng said, "concerns for Apple are overly pessimistic given its much stronger relative position."
Goldman Sachs forecasts fiscal second-quarter EPS of $2.00, above the Street consensus of $1.93, with outperformance expected across iPhone revenue, Mac revenue and gross margins.
Favorable foreign exchange and strong Services revenue growth are also expected to flatter results.
On Services, Goldman Sachs projects 14% year-on-year growth despite another slow App Store quarter, with iCloud+, AppleCare+, prior price increases on Apple TV+ and solid advertising performance cited as supporting drivers.
Looking ahead, the bank sees advertising inventory expansion in the App Store and Maps as further tailwinds.
Recent data points cited by Goldman Sachs include high-end smartphone outperformance flagged by TSMC on its latest earnings call, iPhone share gains in China, and reports that Apple is actively securing mobile DRAM supply while keeping pricing competitive.
The bank sees further catalysts ahead, including WWDC, where new AI Siri features are expected, and the fall iPhone lineup, which Goldman Sachs described as likely "the most innovative ever with the introduction of the iPhone Fold."
BofA raised the firm’s price target on Apple to $325 from $320 and keeps a Buy rating on the shares ahead of fiscal Q2 earnings due after market close on Thursday, April 30. The firm, which sees upside to Street estimates given continued strong sales of iPhone and double-digit growth in Services revenue, forecasts Q2 revenue and EPS of $113B and $2.00, respectively.
Cash flow is a fact, earnings are an opinion and share price is a dream.
A company's total worth is the number of outstanding shares multiplied by their value. This product is called the market capitalization or Market Cap.
That's a simplification. If you want to be more accurate, you should take the Market Cap and net out cash and debt--these are not part of the future flows of cash that can benefit shareholders.
More precisely, there is another measure called the Enterprise Value (EV) which is the total price tag of a company, representing what it would cost to buy the entire business and pay off its debts. EV = Market Cap + Total Debt + Preferred Stock + Minority Interest - Cash and Cash Equivalents.
This is the precise and complete measure of the firm's value but we use the shortcut of Market Cap since In most cases the Preferred stock and minority interest are negligible and if cash equals debt then the result is EV =~ Market Cap. it's easier to calculate anyways as the shares outstanding and share price are easily available. Not so for EV.
To get a sense of how much you're paying for the company it makes sense to divide the Market Cap by the company's Earnings so you get an idea of how many years it will take to get back your investment. When dividing both Market Cap and Earnings by the number of shares it becomes the famous P/E ratio or Price per share / Earnings per share.
But if you want to be fully precise, instead of using Market Cap you should use Enterprise Value. In that case the denominator should be Free Cash Flow or FCF[1]. The ratio becomes EV/FCF. Free Cash Flow is a better measure than earnings because it takes into consideration depreciation, change in working capital and capital expenditures. It measures the actual cash a company generates after paying for its operating and capital expenditures.
EV/FCF takes into consideration unusual situations such as huge amounts of cash or debt or capital expenditures which removes shareholder access to what the company "earns" on paper. This why the adage of "earnings are an opinion but cash flow is a fact" exists.
I used EV/FCF years ago to value Apple because at a time when it held huge amounts of cash. This was before it began aggressively reducing its cash through its capital return program. The P/E ratio at the time was very low but excluding the cash, it was even lower. It was a huge red flag indicating that the company was being priced for liquidation, or as some analyst put it, priced like a steel mill going out of business. If at that time you did not believe that its demise was imminent you would have surely been richly rewarded.
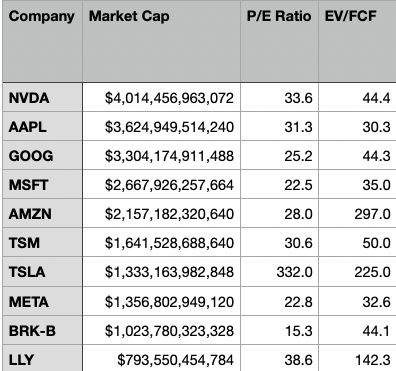
Today the anomaly that throws the P/E off is not Cash but CapEx. And it's not for Apple but for the other mega caps or AI "hyper scalers". Without worrying who is or isn't in the "Magnificent 7" I compiled the largest 10 market capitalization companies and looked at their P/E and EV/FCF ratios. At time of writing:
Company
Market Cap
P/E Ratio
EV/FCF
NVDA
$4,014,456,963,072
33.6
44.4
AAPL
$3,624,949,514,240
31.3
30.3
GOOG
$3,304,174,911,488
25.2
44.3
MSFT
$2,667,926,257,664
22.5
35.0
AMZN
$2,157,182,320,640
28.0
297.0
TSM
$1,641,528,688,640
30.6
50.0
TSLA
$1,333,163,982,848
332.0
225.0
META
$1,356,802,949,120
22.8
32.6
BRK-B
$1,023,780,323,328
15.3
44.1
LLY
$793,550,454,784
38.6
142.3
As recently as six months ago, there was a lot of talk about an AI bubble. Back then I looked at the data then and by looking at the P/E ratios convinced myself that the valuations were not "bubble" level. They were in the mid-thirties. These were not historical high especially when considering the growth these companies were experiencing (over 30%). Since then prices have come down significantly.
This is as the CapEx elephant in the room has been making itself known and there is renewed alarm at the scale of capital spending. This is reflected in the EV/FCF number but not in the P/E number.
The table above shows how much more elevated the EV/FCF ratio is relative to P/E for many of the companies. This "truer" measure of what you are paying as a share buyer is now reflecting in reduced share price and hence reduced P/E.
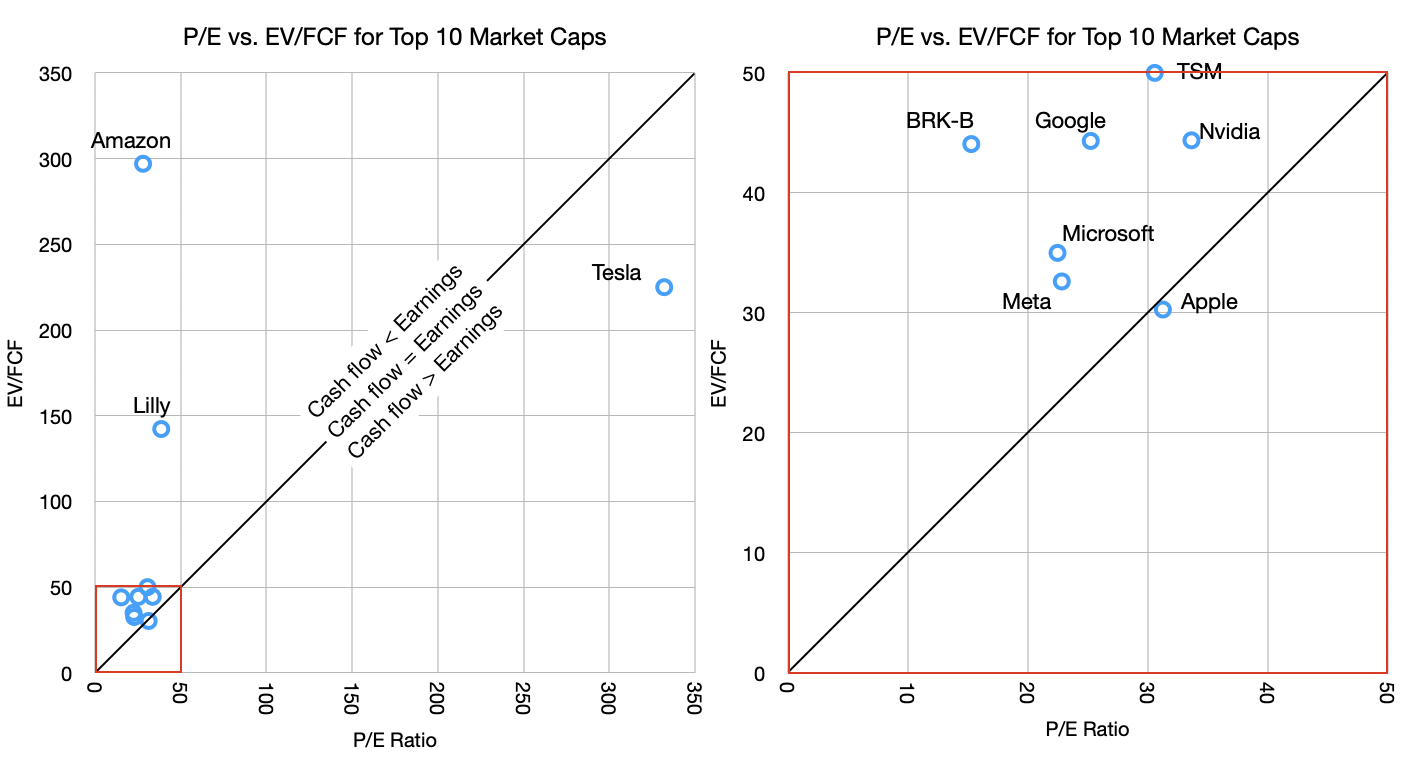
Of course, this is not true for Apple. Apple's P/E ratio and EV/FCF are nearly identical. To see this more clearly I put together these graphs.
The graph shows the P/E vs. EV/FCF for the companies in the table. The graphs are the same data but the one on the right is zoomed in on the lower left corner (note the red squares).
The reason for the zoom is that there are three outliers. Tesla, Amazon and Lilly. Tesla has absurd valuation on both P/E (300 to 400 range in last 6 months) and EV/FCF while Amazon has an outrageous EV/FCF value due to abnormal capital spending. Basically, Tesla has negligible earnings (and negative growth) while holding astronomical share price and Amazon is spending far above its median on CapEx. Amazon's 10-year EV/FCF is much lower, at approximately 55.
But let's ignore the outliers and concentrate on the other seven in the cluster. These are below 50 P/E and 50 EV/FCF thresholds.
Note that I drew a diagonal line representing the equation of P/E = EV/FCF. This should, under normal circumstances, hold for most stocks. Just like Market Cap should roughly equal Enterprise Value so Earnings should equal Free Cash Flow.
Most companies should not stray too far from this line. But what we are seeing, with the notable exception of Apple, is that most tech companies have cash flow far below earnings. This is again due to the CapEx elephant.
The argument goes that this is a temporary situation with that capital being wisely deployed for returns from AI. Presumably, these companies will swing to the other side of the line, where cash flows will exceed earnings, compensating for the capex that was denied to the shareholders.
This is where the old adage comes into play: Earnings are an opinion but cash flow is a fact. I added to that "and share price is a dream". Take the free cash flow and multiply it by a "dream" and you get the price the market sets. This dream is the multiple.
What makes the AI "bubble" interesting is how it's not fueled by debt[2] but by cash flow. Companies are turning over large portions (almost all and sometimes more) of their cash flows to investing in the dream of AI profits. All but one, of course.
There is something obviously contrarian in Apple's strategy. Perhaps it's not Apple that is odd but rather there is groupthink on behalf of the others. The question of who's right will rest on whether it turns out that AI is going to commoditize quickly or perhaps never, whether AI turns out to be modular or integrated, whether AI exhibits disruptive or sustaining competitive responses, whether it's an infrastructure subject to regulatory corrosion or whether it will migrate to the edge and iterate freely, whether it's a new experience or simply better existing experiences, whether it creates new markets or just makes existing ones more efficient.
These are not new questions. They have been applied to all software and hardware innovations of the last 40 years. We have a lot of history to inform us.
Not reading this article is probably a wise decision.
Shares could perform in line with the S&P 500's long-term average
Investors can follow a straightforward exercise to try and figure out where Apple's stock price will be in late March 2031. It's important to consider both the valuation and profit gains.
We just released a brand-new report with the full story and the company’s name.
Apple shares current trade at a price-to-earnings ratio of 31.5. I believe it's reasonable that this multiple could drop to 30 in five years, which is still a premium valuation.
On the other hand, sell-side analysts hold a consensus view that diluted earnings per share will rise at a compound annual rate of 11.6% between fiscal 2025 and fiscal 2028. If we assume that this pace of growth continues in the years after this explicit forecast period, then Apple's stock price will be around $410 in five years. This translates to a 10.5% annualized gain.
This is obviously a very rough guide that may or may not prove to be correct. Apple's earnings could surprise to the upside or disappoint to the downside. And market sentiment is also extremely unpredictable, which will impact the stock's valuation. [Seriously?-ed]
That expected rate of return mimics the S&P 500's long-term average. But if the widely followed benchmark keeps up its performance from the past decade, then Apple will lag the market.
“Given Apple’s free cash flow and we are about to embark on one of its most lucrative product rollouts since the big screen iPhones in 2014 - there is a case for Apple’s stock regaining some ground,” Melius analysts wrote in a note to clients.
Lately, Apple has announced the iPhone 17e and a refreshed iPad Air, a new MacBook Air, a MacBook Pro, new Studio Displays, the MacBook Neo, and an updated version of its over-the-ear headphones, the AirPods Max 2.
Apple shares were modestly higher in premarket trading but have lost some 8% year-to-date. Over the past 12 months, shares have gained 12%.
NB: Free cash flow (FCF) is the amount by which a business's operating cash flow exceeds its working capital needs and expenditures on fixed assets (known as capital expenditures). It is that portion of cash flow that can be extracted from a company and distributed to creditors and securities holders without causing issues in its operations. As such, it is an indicator of a company's financial flexibility and is of interest to holders of the company's equity, debt, preferred stock and convertible securities, as well as potential lenders and investors. It has come recently into vogue when the bill for AI infrastructures has come due...
The table above shows the P/E ratios vs. the EV/FCF ratios of the top 10 largest market caps in the world.
Apple may not have a clear trigger to push the stock higher right now, according to top KeyBanc analyst Brandon Nispel. He reiterated a Sector Weight (Neutral) rating on the stock, saying recent spending data and current valuation leave limited room for near-term upside.
KeyBanc’s consumer spending tracker showed indexed spending down 9% month over month in February, worse than the three-year average decline of about 4%. On a yearly basis, spending rose 4%, slightly above January’s 3% growth. Nispel said the data from January and February remains mixed, making it difficult to draw firm conclusions about Apple’s demand this quarter.
KeyBanc also updated its forecasts after Apple’s recent product launches. The firm now expects Apple’s Fiscal 2026 revenue to reach about $466.5 billion. It also raised its Fiscal 2026 earnings estimate to $8.52 per share and Fiscal 2027 earnings to $9.11 per share. For the second quarter of 2026, KeyBanc estimates revenue of about $108.7 billion, which would represent roughly 14% year-over-year growth.
With Apple trading close to its historical valuation levels, Nispel said he does not see a “clear near-term catalyst” that could push the stock higher.
Turning to Wall Street, analysts have a Moderate Buy consensus rating on AAPL stock based on 15 Buys, nine Holds, and one Sell assigned in the past three months. Furthermore, the average AAPL price target of $305.18 per share implies 17% upside potential.
In July this of this year Asymco turns 17. In April of this year Apple turns 50.
This means that Asymco has been following Apple for one third of its life. I regret that it has not been for longer but oh, what a third it has been.
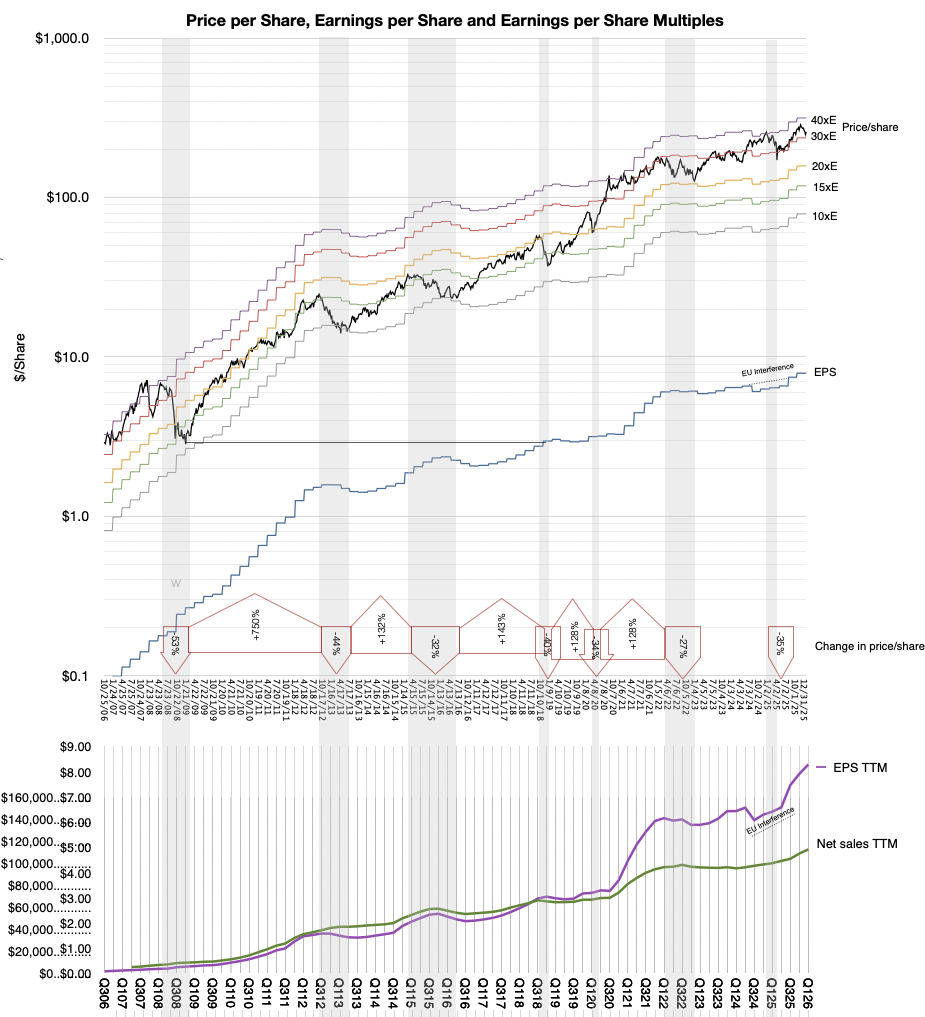
During 2009, Apple Net Sales were $46.7 billion. 17 years later revenues should comfortably top $500 billion.
Earnings per share (split-adjusted) in 2009 were 37c. This year EPS will be around $9.5.
Most importantly, at the end of 2009 Apple had about 107 million active devices (43 million Macs, 33 million iPhones and 30 million iPods!) Today it has 2.5 billion.
The increases in multiples:
23x Active devices, or a compounded annual growth (CAGR) of 20%
11x Revenues, CAGR of 15%
26x Earnings, CAGR of 21%
Apart from the customer love affair these numbers reveal, investors were awakened. 36x increase in Apple share price, from $7.5 to about $270. That’s 17 years of 23.5% growth.
The appreciation of the share price faster than the other underlying metrics reflects the undervaluation that existed for most of the last 17 years. Its value grew a lot more because it was too cheap to begin with.
That was perhaps my most important observation. A recurring undervaluation reflecting a perceived fragility. The more I studied and came to learn how the company operates the more I realized that the perception was wrong. It was in fact the opposite of reality.
When I started my “Apple model” in 2009 I did it out of indignation. I had access to a few analyst reports covering the company and, when looking at their forecasts and assumptions, I was shocked to read that they treated Apple as a computer company. Two years had passed since the iPhone launched and I had made the radical assumption that the future of the company would be determined by the dynamics of phones--later to be broadened into “devices.” This did not appear radical to me because five years earlier Apple had created the market for music players. A market it came to dominate. It seemed very rational to me that with the iPod (and iTunes), Apple had demonstrated that it was more than a computer company. Or perhaps more accurately, it was so profoundly different as a computer company that it redefined what computers were. Nonetheless, observers seemed stuck with the perception that once a PC maker, always a PC maker.
So here is my prediction today: Apple at 50 is no less capable than Apple at 20. Indeed, it is more so. This is because, even if it has not yet completed its quest, the company has sought self knowledge. A knowledge which I have sought to gain as a distant observer.
And so here I am, inviting you to come along with me on this journey.
Asymco is being re-launched. Apple at 50 is entering a new era. It has transitioned from Apple ][ to Mac to iPod, iPhone, iPad, Watch and Spatial Computing. But it has always been the company that brought computers to people and people to computers. The new era of computers that appear more like people is dawning and the connection between the two needs to be built. Only Apple is capable of creating this connection. And only Asymco is able to tell the asymmetric story of how it will happen.
Let’s learn together.
To make this research possible we’re launching Asymco One.
Asymco One is the analysis you need for understanding everything in the world of Apple. It’s a bundle of seven categories of content:
Curated news and commentary with Nota Bene.
Reconsider your assumptions with Research.
Save time with the weekly summary in the Bulletin.
Supercharge your narrative with Asymetric podcasts.
Get your questions answered during Office Hours.
Attend in-person or online the full-day Conference.
Search over 1800 posts, 60,000 comments, 400 podcasts and thousands of graphs since July 2009 in the Archives.
All while connecting with the most knowledgeable community of thinkers and investors in Apple.
Asymco One is a bundle which will offer over one thousand updates per year providing the ultimate intuition on Apple for stakeholders and connoisseurs of the most important phenomenon of our time.
It’s available as a subscription for $1000/yr, about the price of an adequately configured iPhone.
For early adopters we are offering a discount of $150 with the code INNOVATE.
I hope to see you in the Comments, the Office Hours, the only Conference and in person.
In July this of this year Asymco turns 17. In April of this year Apple turns 50.
This means that Asymco has been following Apple for one third of its life. I regret that it has not been for longer but oh, what a third it has been.
During 2009, Apple Net Sales were $46.7 billion. 17 years later revenues should comfortably top $500 billion.
Earnings per share (split-adjusted) in 2009 were 37c. This year EPS will be around $9.5.
Most importantly, at the end of 2009 Apple had about 107 million active devices (43 million Macs, 33 million iPhones and 30 million iPods!) Today it has 2.5 billion.
The increases in multiples:
23x Active devices, or a compounded annual growth (CAGR) of 20%
11x Revenues, CAGR of 15%
26x Earnings, CAGR of 21%
Apart from the customer love affair these numbers reveal, investors were awakened. 36x increase in Apple share price, from $7.5 to about $270. That’s 17 years of 23.5% growth.
The appreciation of the share price faster than the other underlying metrics reflects the undervaluation that existed for most of the last 17 years. Its value grew a lot more because it was too cheap to begin with.
That was perhaps my most important observation. A recurring undervaluation reflecting a perceived fragility. The more I studied and came to learn how the company operates the more I realized that the perception was wrong. It was in fact the opposite of reality.
When I started my “Apple model” in 2009 I did it out of indignation. I had access to a few analyst reports covering the company and, when looking at their forecasts and assumptions, I was shocked to read that they treated Apple as a computer company. Two years had passed since the iPhone launched and I had made the radical assumption that the future of the company would be determined by the dynamics of phones--later to be broadened into “devices.” This did not appear radical to me because five years earlier Apple had created the market for music players. A market it came to dominate. It seemed very rational to me that with the iPod (and iTunes), Apple had demonstrated that it was more than a computer company. Or perhaps more accurately, it was so profoundly different as a computer company that it redefined what computers were. Nonetheless, observers seemed stuck with the perception that once a PC maker, always a PC maker.
So here is my prediction today: Apple at 50 is no less capable than Apple at 20. Indeed, it is more so. This is because, even if it has not yet completed its quest, the company has sought self knowledge. A knowledge which I have sought to gain as a distant observer.
And so here I am, inviting you to come along with me on this journey.
Asymco is being re-launched. Apple at 50 is entering a new era. It has transitioned from Apple ][ to Mac to iPod, iPhone, iPad, Watch and Spatial Computing. But it has always been the company that brought computers to people and people to computers. The new era of computers that appear more like people is dawning and the connection between the two needs to be built. Only Apple is capable of creating this connection. And only Asymco is able to tell the asymmetric story of how it will happen.
Let’s learn together.
To make this research possible we’re launching Asymco One.
Asymco One is the analysis you need for understanding everything in the world of Apple. It’s a bundle of seven categories of content:
Curated news and commentary with Nota Bene.
Reconsider your assumptions with Research.
Save time with the weekly summary in the Bulletin.
Supercharge your narrative with Asymetric podcasts.
Get your questions answered during Office Hours.
Attend in-person or online the full-day Conference.
Search over 1800 posts, 60,000 comments, 400 podcasts and thousands of graphs since July 2009 in the Archives.
All while connecting with the most knowledgeable community of thinkers and investors in Apple.
Asymco One is a bundle which will offer over one thousand updates per year providing the ultimate intuition on Apple for stakeholders and connoisseurs of the most important phenomenon of our time.
It’s available as a subscription for $1000/yr, about the price of an adequately configured iPhone.
But for you, dear reader, who have been with us for so long, I am offering a discount of $250 with the code PIONEER.
I hope to see you in the Comments, the Office Hours, the only Conference and in person.
GF Securities said a recent survey on the tech giant's supply chain suggests a “solid outlook.”
“Following the earnings call on Jan. 29, 2026, we did a supply chain research which indicates strong iPhone build momentum (incl. 2H26’s models) as well as cost management aiming to keep the starting selling prices of iPhone 18 Pro/Pro Max unchanged or at [a] similar level of iPhone 17 Pro/Pro Max,” analyst Jeff Pu wrote in a note to clients.
“Additionally, [the] Gemini partnership is to work on the Apple foundational model to power the Apple Intelligence, including the personalized Siri, which is the next key to watch in WWDC 2026.”
Pu reiterated his Buy rating and upped his price target [] on the back of higher 2026 and 2027 estimates.
Delving deeper, Pu said the upcoming fiscal third-quarter should see another “strong” iPhone build, with around 54M units, which would suggest a year-over-year acceleration. “For 2H26, we note that Apple is expected to launch 3 new iPhone 18 models (Pro, Pro Max, Fold), compared to 4 iPhone 17 models a year ago,” Pu added. “Yet, we expect a solid iPhone 18 build plan in 2H26 of 82m, compared to 89m of iPhone 17 in 2H25, despite [a] much higher [average] selling price. We attribute the key drivers to the new foldable model and Apple’s strategy of keeping iPhone 18 Pro/Pro Max pricing largely the same as that of iPhone 17 Pro/Pro Max by managing memory/display cost. That said, we expect a significant iPhone ASP increase in CY2H26 driven by mix.”
On the company's recent earnings call, Apple management, led by CEO Tim Cook, said revenue is expected to grow between 13% and 16% year-over-year.
Looking to the cost of the iPhone 18 Pro and Pro Max, Pu said the recent impact of surging memory prices should be manageable. “For DRAM, we believe Apple has been negotiating with Samsung Memory and SK Hynix to reach favorable deals, considering Apple’s support in the past memory downcycle and the likely capital investments,” the analyst explained. “For NAND, we estimate the cost to be up ~70% QoQ in F2Q and suppliers are asking for 50-60% QoQ in F3Q. Overall, we expect the BOM cost of memory to increase from 9- 10% in F1Q to 12-13% in F3Q. To partially offset the cost of memory price and 2nm A20 Pro, we expect efforts on other big items such as display, cameras, etc.”