Apple's Net Sales grew at the rate of 30% in the last quarter. Earnings per share grew at 47%. Both of these figures are the highest since 2012.
It should be noted that although the rate of growth is extraordinarily high, the company never actually stopped growing in the past three years. As the table above shows, net sales has always had positive growth.
Compared with the fourth calendar quarter of 2011, Apple's sales are 61% higher and earnings per share are 54% share. ((Some of the expansion in earnings per share is due to the willingness of shareholders to sell their shares to Apple. 10% of the shares around in 2011 have thus disappeared.))
This degree of growth at this stage in the history of the markets it participates in is a revelation.
Consider:
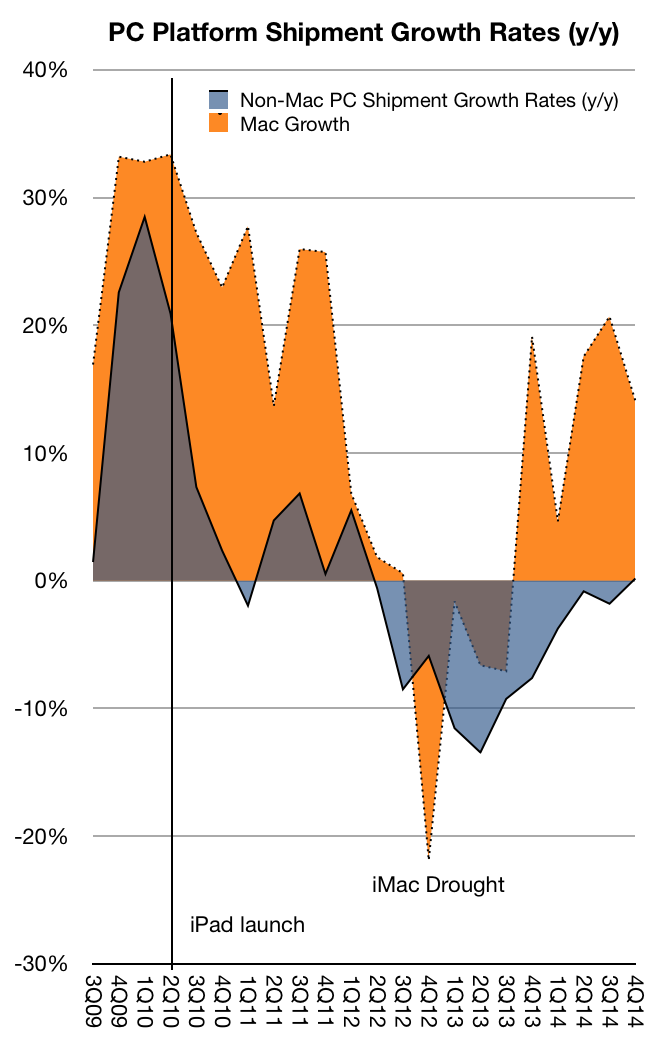
The PC market is more than 30 years old. In this mature market the Mac has been outgrowing the Windows platform for 34 out of the last 35 quarters.
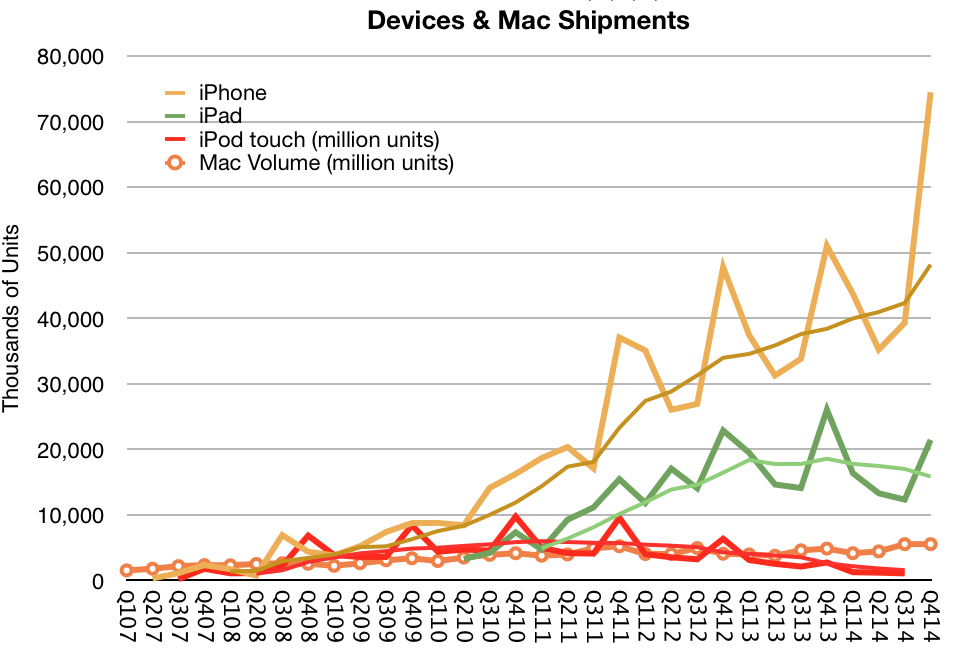
The iPhone was announced eight years ago and it still managed to grow at the rate of 57%.
The market shares of its Mac, iPhone and iPad products are all remarkable only for their paucity.
The pricing of all their products is more than double the median for their categories.
Regardless of extreme growth, pricing power, headroom and, most importantly, customer loyalty, the company's prospects are seen as dismal in contrast to its underperforming peers. ((As measured by P/E or FCF/EV ratios vs. direct rivals, technology companies or the S&P 500.))
I tried to assess the opportunity of Apple Pay but found it to be mostly dependent on how quickly card payments will overtake cash. It seems that as payments move to a digital format they will move to a mobile device. The hurdle isn't going from a card to a phone but from cash to card.
Data published in The Growth and Diffusion of Credit Cards in Society shows that between 1970 and 2001 households with at least one credit card in the US grew from 17% to 70%. More recent data shows 82% of US consumers have at least one credit card and 77% have a debit card.
The Total Addressable Market for Apple Pay then is dependent on how quickly this pattern repeats over the markets where iOS devices are in widespread use. Once cards are in use they are used with higher frequency and quickly overtake cash for the user.
The only assumption that needs to be made is that the device then replaces the plastic card. This seems a safe assumption as the benefits of the device as payment authenticator are high and the costs are negligible given a penetrated market.
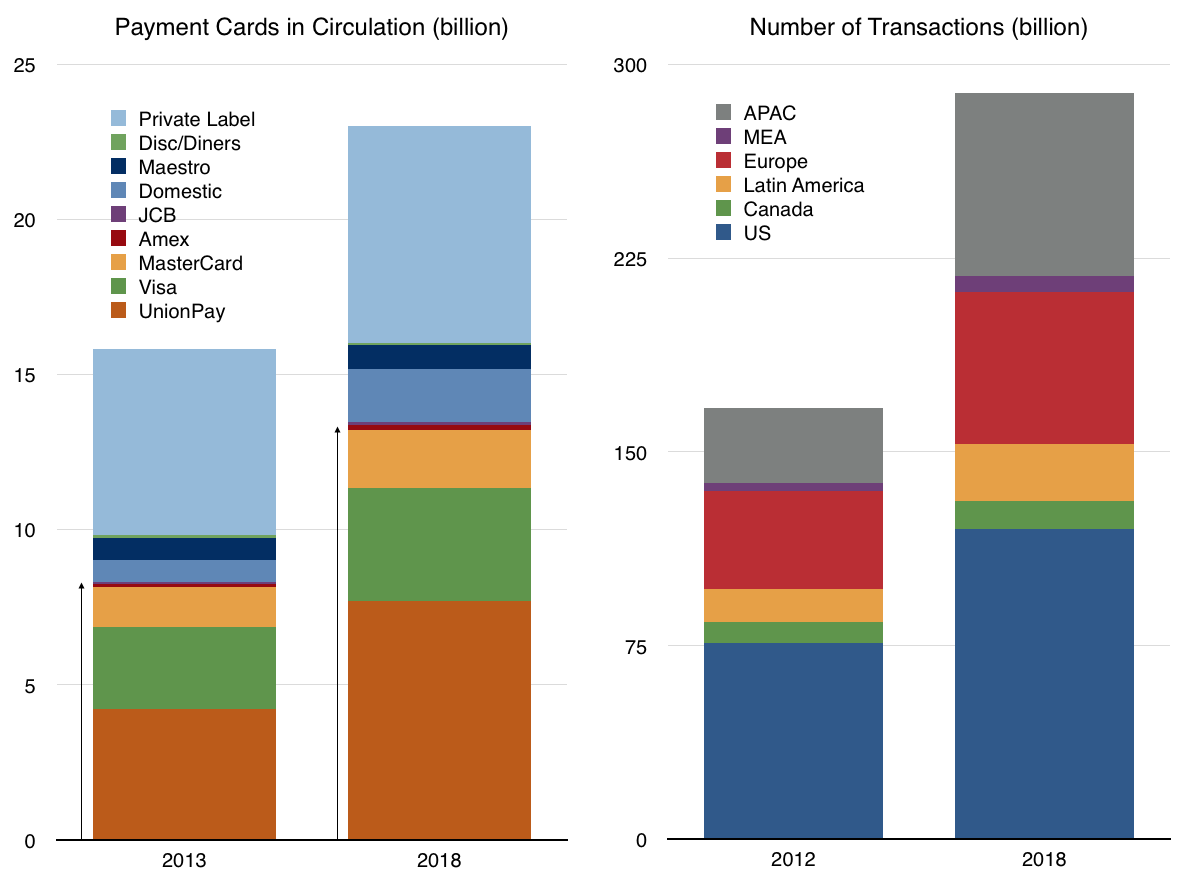
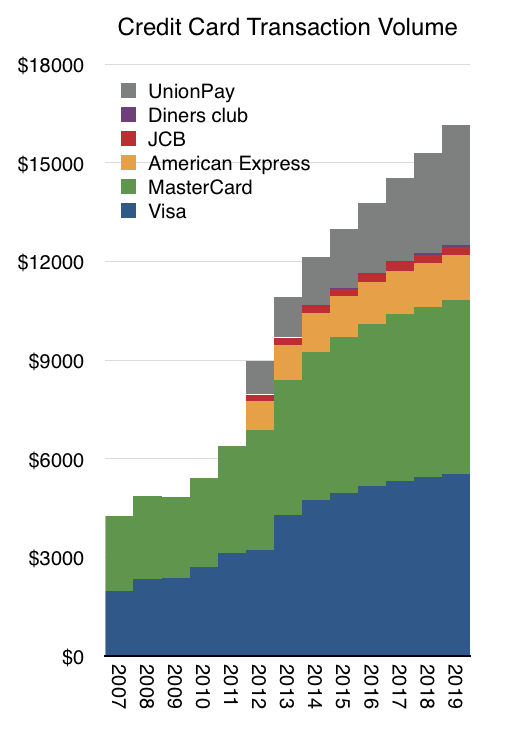
The following graph shows an extrapolation of transaction volumes where Visa and MasterCard and Amex are showing moderating growth with UnionPay showing 20% constant growth through 2019. ((Supporting these assumptions is a forecast from Nilsen showing total number of cards in circulation by issuer and a forecast of total transactions
))
Two more assumptions are needed: the share of transaction value captured by Apple Pay and the Apple Pay fee. I used 15 basis points ($15/$10000) as the assumed Apple fee and a share schedule as follows:
2015: 0.5%
2016: 1%
2017: 1.5%
2018: 2%
2019: 3%
These assumptions result in a cumulative revenue of over $1 billion by 2018 and a yearly run rate of $1 billion in revenue by 2020.
Although this is not a huge amount relative to Apple's overall revenues ((No more than half of one percent of 2015 revenues)), it's important to note that these revenues are likely to go directly to earnings ((About 2% of 2015 earnings)) as there are negligible costs associated with the transactions that Apple needs to bear.
These assumptions make the statement that Apple Pay can become "A Billion Dollar Business" plausible by 2020. Perhaps sooner.
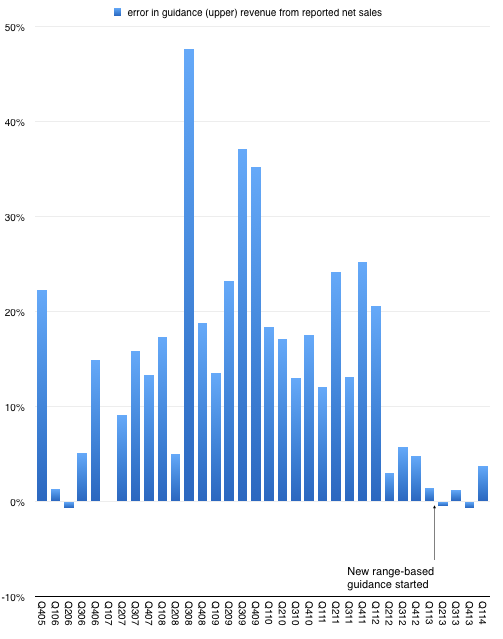
After n quarters of predictability, Apple surprised with sales performance that was 3.74% above the top of their guidance. This may not seem significant but since instituting a new range-bound guidance method in Q1 of last year the company reported revenue within about 1% of the top of the range.
This is in stark contrast to the wide variance in prior years. The following graph shows the "error" in guidance as the percent difference between reported sales and guidance ((Upper end of range in quarters where a range was given.)).
So prior to last quarter we were lulled into thinking that guidance was very nearly perfectly predicting the company. As I tweeted, it took the "sport" out of trying to do any forecasting. All an analyst had to do is tweak the main product growth figures to hit the sales target and then subtract the (generously provided) operating expenses and (also provided) tax rate to get the earnings. Only unknown to getting to an estimate of EPS was how many shares would still be outstanding. ((The company itself would not know shares outstanding as their buying was opportunistic during the quarter.))
Knowing Apple also means that average selling prices are also very rigidly set in stone so the degrees of freedom in analysis were becoming highly constrained.
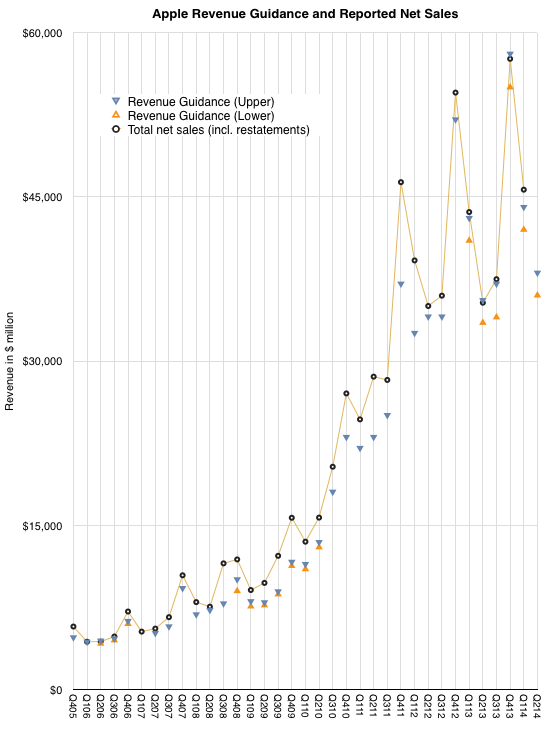
But just when you think you spotted a pattern, it changes. The company surprised with performance outside the band. The following graph shows the estimate ranges it has given and the actual revenues delivered. ((Next quarter is also pencilled in.))
So what happened?
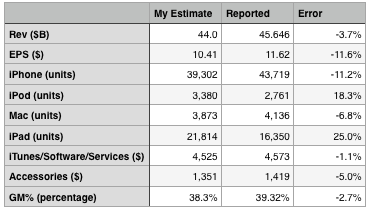
The answer seems to be better iPhone performance. The following table shows my expectations, which were tuned to return revenues exactly at the top of the guidance range.
On product shipments/sales I underestimated the iPhone and Mac and overestimated the iPad and iPod. I estimated iTunes accurately and underestimated accessories by 5%. I also generally got the blend of margins fairly close, being 1 point too low on gross margin.
The bottom line was that the Revenue and Earnings surprise could be accounted for through a significant outperformance on iPhone which offset a less significant underperformance on the iPad.
The iPhone grew sales by 14% which more than offset a drop of 13% in iPad sales and was enough to allow net sales to grow by 5%. Since the company guided nearly flat growth, that 5% was a big surprise.
Now one could ask whether 14% growth in the iPhone revenues is a meaningful change in the long-term evolution of the category. This is a difficult question. The way the iPhone is positioned makes it a great success in the premium segment of the market but it does not place it in competition with the perhaps 80% of the market which seems to be defined by a lower price point.
However let's not forget that pricing is correlative to the market but it may not be causal. Purchase decisions are complex and price is one aspect of that decision. But there are many others. Availability, channels, service, brand all play parts. The error of many analysts is to conclude that price and price alone is causal to behavior. That may be so with commodities, but let us not forget that these products and their uses are newly created and how value is perceived has been changing rapidly. Buyers follow a learning curve in terms of discovering the uses and value of products. These learning curves can be modeled and usually show several years (sometimes decades) for most populations between early and late adoption.
We don't know where the iPhone is on the learning curve for any particular region and that means we can still be surprised by how it grows.
Exactly one year ago, on January 7th, 2013, Apple announced that the App Store reached 40 billion downloads ((Unique downloads excluding re-downloads and updated)). Here are additional data points from that release:
20 billion downloads in 2012
2 billion downloads in December 2012
500 million active iTunes accounts
775,000 apps
sold in 155 countries
300,000 native iPad apps
over $7 billion in developer payments
This year, on January 7th, 2014, Apple announced a new set of data points:
$10 billion spent on the App Store in 2013
$1 billion in December 2013
3 billion app downloads in December 2013
1,000,000 apps
sold in 155 countries
500,000 native iPad apps
$15 billion in developer payments
The obvious:
225,000 apps were added in 2013
200,000 native iPad apps added in 2013
App download rate for December increased by 50%
No new countries were added in 2013
$8 billion was paid to developers in 2013 (more than in all previous years put together)
The less obvious:
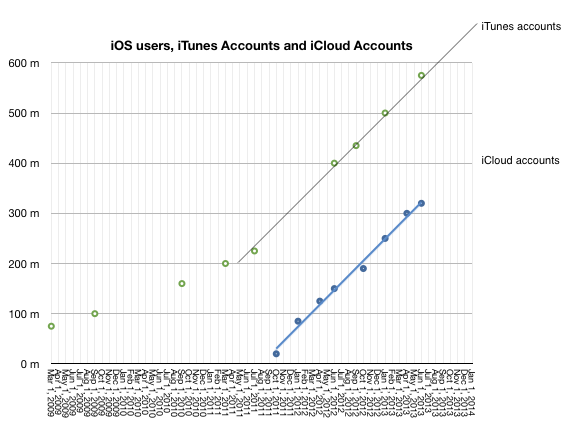
No update on iTunes accounts this time but there was a mid-year update (June 10th) which put iTunes accounts at 575 million. iTunes accounts have grown linearly since mid 2011 so it's quite probable that the current total is above 650 million.
Given mid-year updates to earnings/revenue and the October 22nd update that 60 billion total apps were downloaded and the May 15th update that 50 billion total apps were downloaded it's possible to estimate with confidence that there are now 68 billion total apps downloaded and that were about 27 billion app downloads in 2013. This is an increase of 35% in the yearly download rate. As noted above, the December growth alone was 50%.
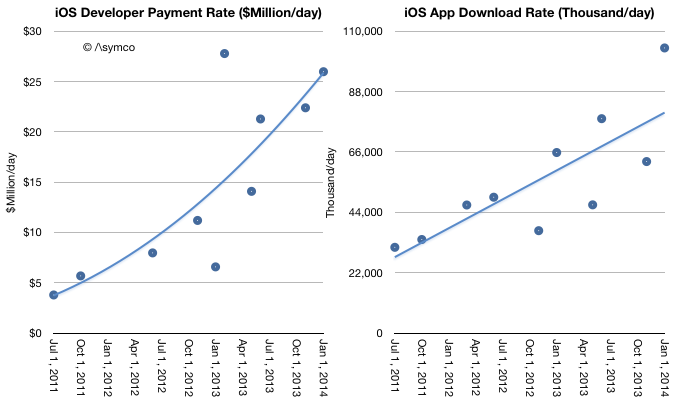
Given mid-year updates on developer payments, and download rates we can estimate revenues per app have increased. As in-app purchasing has taken off it's no longer meaningful to assign a "purchase value" to each download. The rate of payments to developers is increasing faster than the download rate. Currently $26 million is paid out every day while about 100 million apps are downloaded daily. Note that the trend lines below are arbitrary:
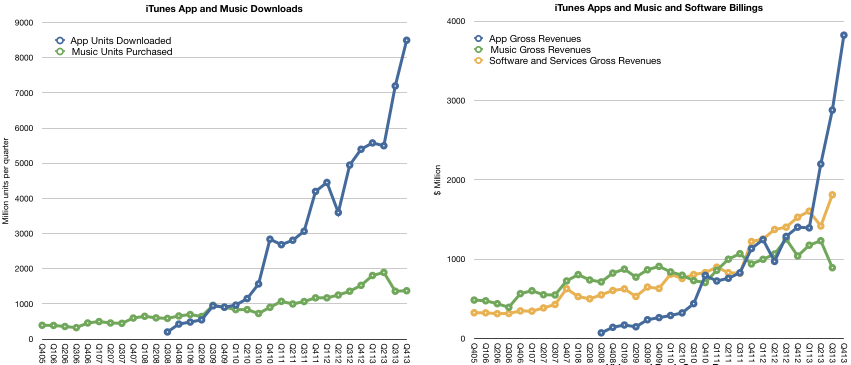
As other reports have noted, there was a decrease in music downloads in 2013. This is also evident when backing into a download total for music given the earnings data and the above evidence of app growth. My estimates below may be overly generous for music unit downloads as they also assume lower pricing. Overall gross music revenues through the iTunes music store ((Excluding new iTunes radio and revenues from services such as Match)) are flat for the year and may even have begun declining precipitously. App revenues are more than compensating for this.
The iTunes content economy is grossing about $17.5 billion/yr. Apple's own software and services (reported as part of the iTunes segment) add another $6.2 billion/yr. The combined total of $23.7 billion/yr. is slightly lower than what Apple net sales were during its fiscal 2007 year or what Amazon sold in 2009.
A complete report on the iTunes economy and pro-forma iTunes income statement is available for purchase at store.asymco.com.
So much for the data. What is really happening?
First, it's tempting to look at music and suggest that music downloads are suffering from streaming, just as it was tempting to suggest that CD buying was suffering from piracy (and later, downloads.) But this is falling into the trap of defining a product's use by the metrics used to measure transactions. These metrics are but a proxy for what consumers are actually doing with their time.
Consumers have a fixed time budget, a more rigid constraint than their spending budget. Competition for a slice of a consumer's time budget is far tougher than competition for a slice of a consumer's wallet. So what's amazing is that apps have successfully grabbed a share of this time budget. I believe that the reason they succeeded is that they initially fit into niche time slices that were previously unoccupied. ((Interestingly, this was how music, especially digital music as enabled by the iPod, gained traction))
Downtime or "boredom" was filled with app interaction. This includes some social media consumption. These are not immersive experiences. They are "casual", inconsequential and trivial. At first anyway. And that's the rub. As apps enter a consumer's world they initially take on non-consumption, which is easy to beat. But as the experiences become increasingly compelling they "move upmarket" and compete more aggressively with existing media consumption patterns.
For instance, one might allow casual gaming to take root in non-consuming contexts such as commuting, waiting, and escaping time niches. But if the experience becomes addictive, the gaming takes over time previously spent watching TV or using console games. The same can be observed for app-based experiences of social media, shopping and chatting.
This is the insidious march of a disruptor. It gains a foothold in a context where it has no competition and then relentlessly gets better, eventually displacing the far better suited alternatives. This is what I believe is happening with apps. They are asymmetric in their competition with established media and as a result they are easily ignored and brushed off as irrelevant competition. That is until the incumbent media sees a sudden drop in consumption. Even then, the culprit blamed is not the upstart but some structural issue.
Music would appear less vulnerable to this app-based substitution because it's an eyes-free experience and can be easily consumed concurrent with another activity. There is however, a subtle de-emphasis and hence devaluation of the experience as it fades into the background. The "job it's hired to do" changes.
Second, and relatedly, the other meta-observation is that apps are media. They are produced, marketed and priced in ways analogous to other media types. This has implications for the artist/producer/creator. For them movement into apps is natural and effortless. It's how developers moved into them without thinking twice. Trouble is that this transition is not at all simple for those who distribute media.
I tweeted that the media industry deplored the shift of "digital pennies for analog dollars" ((Original quote was made by Jeff Zucker, president of NBC Universal, in 2008 in reference to the future of TV)) as the packaging of their product changed. The angst and trauma suffered by the media industry when dealing with what could be seen as a trivial change in the encoding of content are the stuff of lore and legend. Moving to apps could be even more troubling. Mainly because there is already a distribution channel in place. And it's owned by a set of companies whose motives and business models are completely different.
The app economy shows that there are big opportunities in "digital pennies" and that the figures are beginning to match even the "analog dollars". In fact, I suspect eventually digital pennies will dwarf analog dollars. The trouble is that these pennies will not be earned at the same control points. Bits are already big bucks. They're just not the bits we are used to.
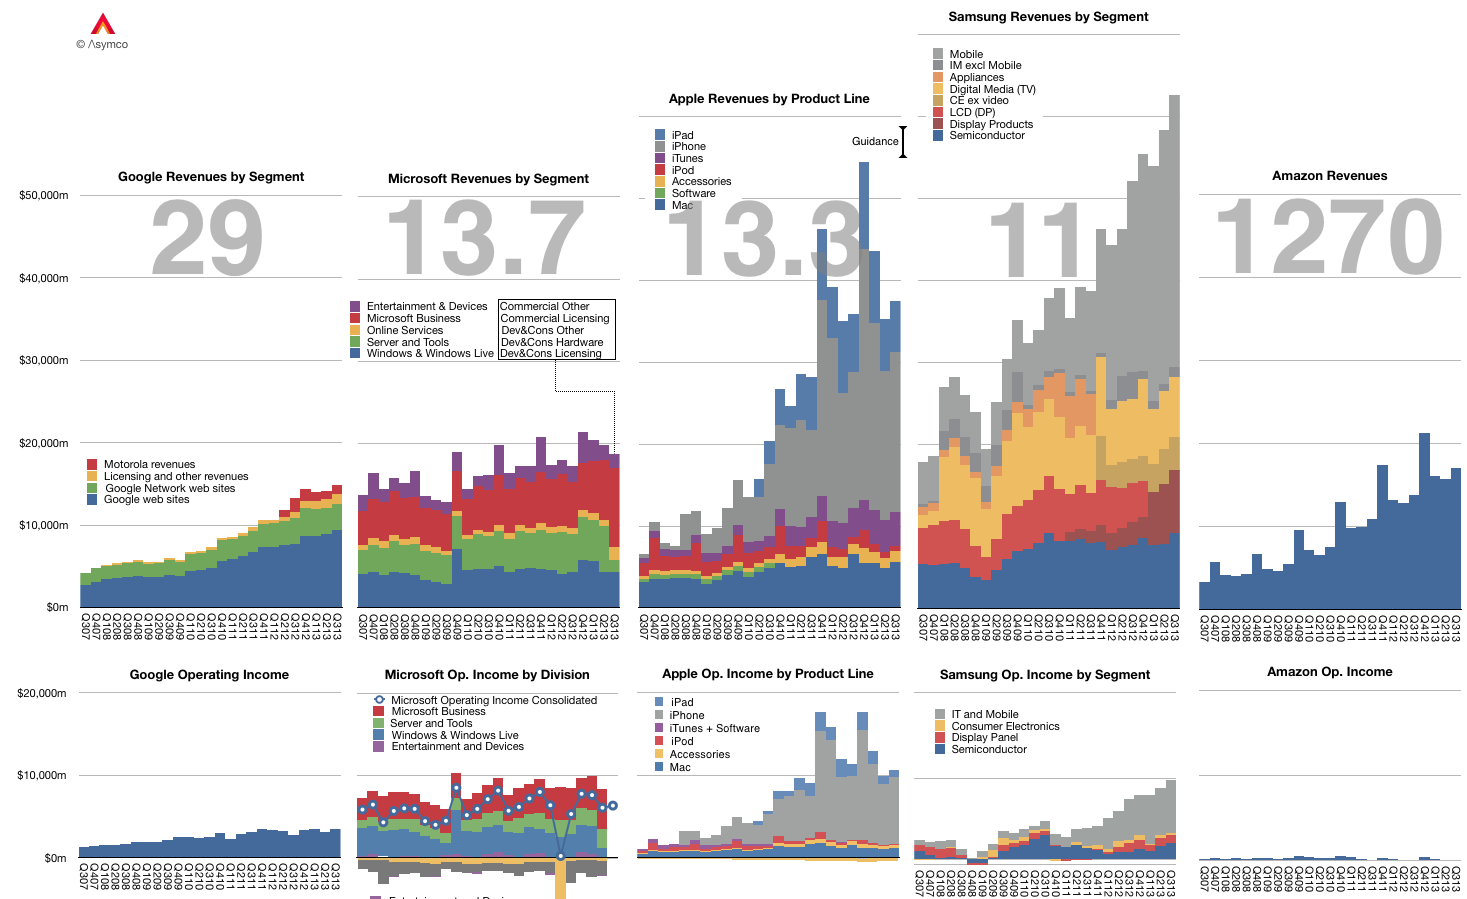
The graph below shows the Revenue and Operating Income for a select group of companies. The large numbers represent the share price to earnings (trailing twelve months) ratio (P/E or PE ratio).
Of course the P/E ratio hides a lot of subtlety. It mostly fails to account for the fact that earnings are largely a matter of opinion. A company can defer income (as Apple and Microsoft do), it can invest earnings (as Amazon does) and can otherwise avoid declaring it since it's taxable.
A better measure is the Enterprise Value to Free Cash Flow ratio (EV/FCF). It reflects a "harder" measure of performance in the form of free cash flow. It is not a matter of opinion but a fact. Enterprise Value also excludes cash which is a measure of past performance.
Nominally both P/E and EV/FCF measure the valuation of a company. They give what amounts to the number of years that current performance can be expected to last. For example a P/E or EV/FCF of 10 can be read as "If I purchase a share today, I should expect the company to pay me back in earnings in 10 years." Any earnings after 10 years are essentially "profit" for the investor.
Inverted these ratios are a measure of Yield or how much of the total investment is paid back in a given year. In the example above, the Yield would be 10% or "If I purchase a share today, the company will pay me back 10% a year in earnings."
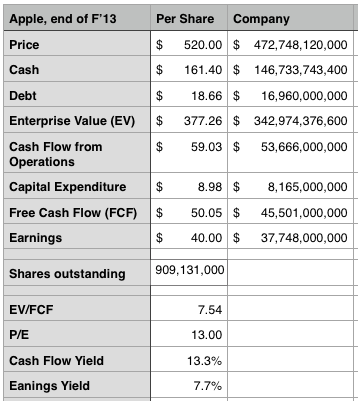
Relying on P/E is troublesome since, as mentioned above, it's deceptive. We get into difficulty when P/E and EV/FCF differ greatly. If a company has minimal cash and declares all free cash flow as earnings then the ratios are the same. However, consider how different these two ratios are for Apple:
The P/E ratio is 13 while the EV/FCF is 7.5. ((It would be very interesting to have both ratios available for all the companies in the graph above.))
This means the investment horizon is nearly half of what P/E suggests. (The cash flow yield should give pause). Put another way, the market suggests that Apple has 7 more years of current profitability and not 13. Note that the P/E ratio for the S&P 500 is above 19.
As Apple's deferrals are increasing investors should look again at what the company's worth. We had similar confusion when the company was deferring most of its iPhone revenue.
Bill, I think the smartphone market has always been competitive. [Only] the names have been changed.
Tim Cook responding to Bill Shope's question on the competitive landscape, April, 2013.
Indeed, over the years, the companies considered Apple's primary competitor have been many.
In years gone by in the phone market there were RIM and Nokia and Palm and HTC. In the iPod era there was Creative and Sony and innumerable others long forgotten (not to mention the tyranny of DRM).
Even today we struggle to decide whether Apple competes with Google first or Samsung. Or perhaps with the iPad it's with Amazon or Microsoft. Or maybe iTunes is threatened by Netflix or Spotify. The Mac surely competes with HP and Dell and Toshiba. What about iCloud? Clearly it's Dropbox or Google Drive. iWork? Both Office and Google Docs.
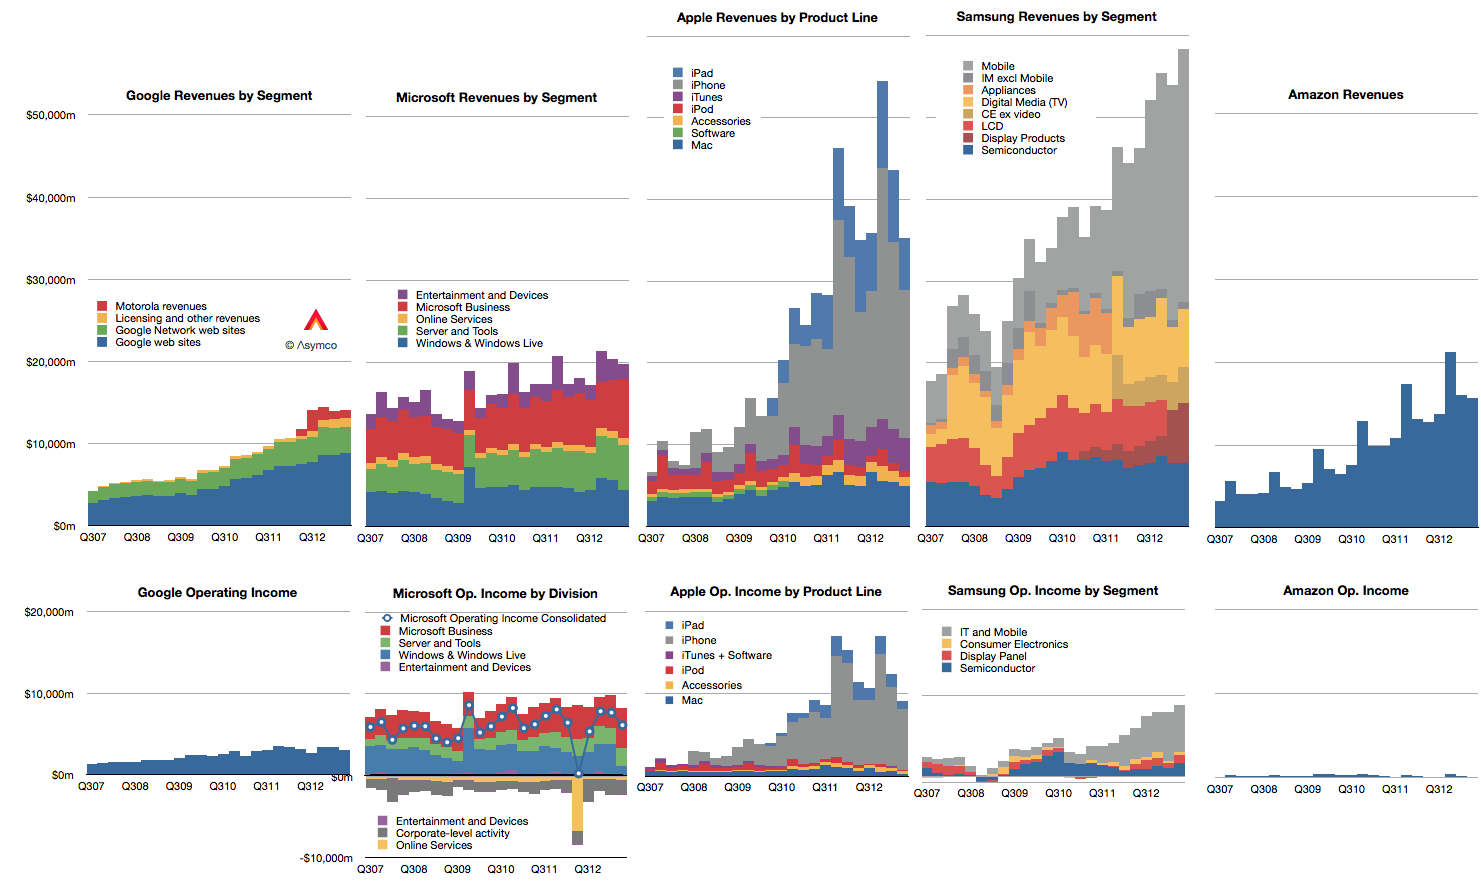
Doing a competitive analysis for Apple is then mostly a struggle of whom to compare it to. So forgive me that I only track the few challengers shown below.
Note also that these companies all may compete with Apple to some degree but they may not compete with each other. Competition, it seems, is not transitive.
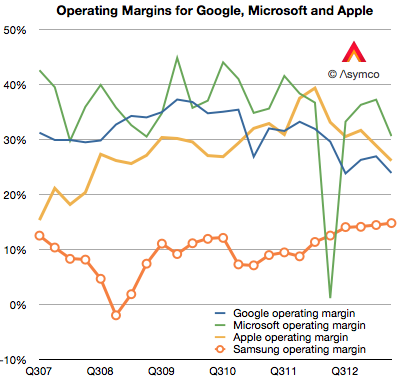
There isn't much that I can observe in the data that hasn't already been observed. Google shows steady but not spectacular growth in revenues with decreasing margins. Microsoft shows even more modest growth in revenues with flat earnings. Apple growth is moderating from near vertical while earnings pause. Samsung has great growth but there is a similar set of doubts about its sustainability and finally, Amazon continues to grow the top line by 20% and has nothing to show for it.
Operating margins have mostly fallen with the exception of Samsung whose increasing reliance on smartphones has led to a modest increase, though not nearly to the level of the others. (Amazon, lacking in profits, cannot be compared.)
In summary there is little change to report.
Except that it's been reported that in the last quarter Samsung managed to "dethrone" Apple from the phone operating profit crown. This is a matter of estimates and for that we need to understand clearly the assumptions.
I estimate that this is not the case. That indeed Apple remains most profitable phone maker by a wide margin.
To estimate operating margins you need to estimate gross margin and the allocation of operating expenses (SG&A and R&D) to a particular "division" or product line. The problem is that Apple does not operate as a divisional organization so its marketing and R&D budgets (i.e. people) are not assigned permanently. You have to move them around based on whatever is being worked on at any given time.
What's more, we need to account for the huge SG&A costs associated with iTunes and Retail. They both consume vast resources which cannot be allocated directly to any product. There are 41,000 people working in retail. Also, some of the expenses for iTunes are overhead and cannot be considered cost of sales. That's also SG&A. Then there's corp research and design (Mansfield and Ive), which are not allocated to any particular product. When you slice out these costs, there is very little to apply to iPhone, etc.
So if (and it's a big, sanctimonious if) you want to cast iPhone out as a separate business unit, it would be wildly profitable. There is a huge gross margin of 46% (this assumes a cost per unit of $316) and only another 5% of sales spent on engineering and marketing leaves a 41% operating margin or $7.4 billion. (Why only 5%? Because there's only 10.8% to allocate and after taking out iTunes, Retail you're really only left with 4.49% for SG&A and 3.3% for R&D or 7.79% so 5% is about two thirds of the operating budget).
If you take all of Samsung's IM division which is PCs, Tablets and phones their operating profit was only $5.6 billion.
You can see the difference in the grey areas of operating profit in the first graph above.
Bear in mind that this is still an artificial comparison. The split of profit between product groups is not only an estimate by the analyst, it would be an estimate for Apple itself since it has only one P/L.
Using interactive graphics and narration, this latest Apple Earnings Review discusses Apple's performance in relation of its historic performance as well as to expectations (published in the Preview) on the following topics:
Guidance vs Actual performance: Now that Apple changed the way it provides guidance, are we seeing a new degree of precision in their signaling. We look at the history of earnings guidance and how effective (or not) the current method is in helping predict performance.
Gross and Operating Margins analysis: What is the pattern of margins and how important are margins to the perception of competitiveness?
Margins by product. How are margins allocated by product?
Average selling prices for each product. Any surprises in Pricing? What was the magnitude, cause and significance of iPhone ASP drop.
iOS product shipments. Comparison with expectations, trends and explanations. Overall iOS growth story.
Cash balance and the effect on cash of share re-purchase.
Sales growth and Earnings growth, a long term retrospective.
Duration is about 1hr.
As a reminder, the Padcast can be reviewed interactively users can access to the underlying data.
It's available for download on the iPad for $19.99. Those who already bought the Preview will be receiving an updated version soon that includes the Review at no extra charge.
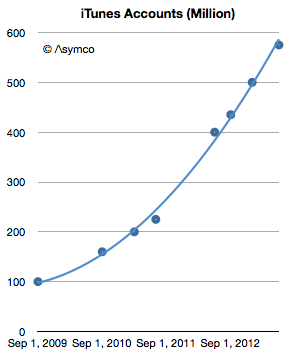
This week Apple announced that iTunes has 575 million accounts. This is the 8th update (that I know of) over the last four years. The history of this data is shown in the following graph.
The number of accounts has increased by almost a factor of six since late 2009. It amounts to an account growth rate of about 500,000/day or 44% compounded annually. Not bad, but along with this increase what happened to revenues per user?
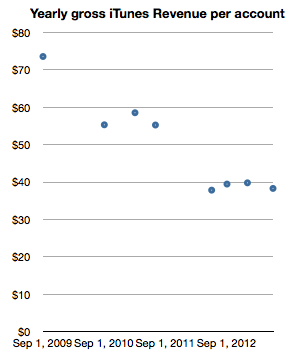
Looking at iTunes revenue (gross) reveals a picture of revenues/account, shown below:
This can be read as: "Each of the current 575 million accounts generates about half the revenue of the 100 million accounts of 2009." One would expect such a decline as an user base expands and this approximate 50% decline in revenues per account seems reasonable for a six-fold base increase. In absolute terms the graph shows that an iTunes account generates about $3.2/month in transactions.[1] Put another way, during the last year, an average of $40/yr of economic value is generated by every iTunes account.
Stretching further, one could also use the 575 million iTunes accounts as a proxy for "the Apple customer base". The assumption would be that iTunes accounts are attached to some Apple product, be it an iPhone, iPod or Mac. As a bounds check, a total of 865 million Apple devices (which interact with iTunes) have been sold since 2007. Assuming 575 million users does not seem to be a contradiction.
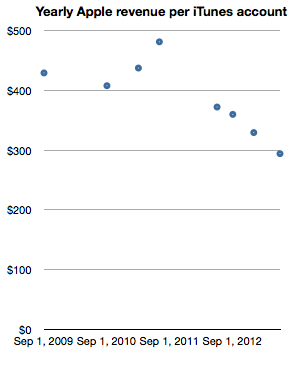
The logic deployed would be that it's unlikely for a consumer to have an iTunes account without owning or using an Apple product. If we take this leap in logic then it would make sense to measure Apple (not just iTunes) revenues per iTunes account. In order to smooth out seasonality I took trailing twelve months' average quarterly revenues and measured the following company revenues per iTunes account.
Note again the reduction in revenue per "customer" as the base grows. The reduction is less pronounced however, with about one third lower spending for a sextupling of the base. One can read this graph as "Three years ago an Apple customer used to spend $400/yr on Apple products but as the number of users increased six-fold the spending decreased to about $300/yr per customer."
The practice of valuing a company by the rate of spending of its customer base is not uncommon, especially when the customer base is relatively loyal. Apple emphasized the importance of customer satisfaction (and, implicitly, loyalty) during its WWDC presentation. It was singled out as the most important metric they track. So perhaps valuing Apple itself on the basis of repeat purchase behavior should be considered.
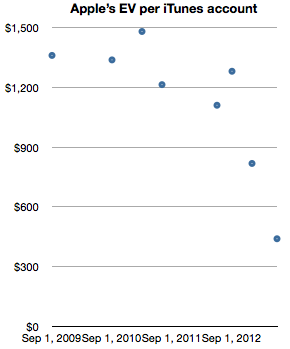
When framing the value of of the company itself as a function of users (in the form of iTunes accounts) we get the following graph.
The graph measures the Enterprise Value (i.e. Market cap minus cash) on a per-customer (i.e. iTunes account) basis.
It shows that for a number of years—from 2009 until late 2012—Apple's users were valued (implicitly by the stock market) as likely to create a net present value of about $1200 in earnings. The current value is about a third of that, or $440 in earnings. Today's expectation is therefore that each current customer will buy the equivalent of 1.8 iPhones. And nothing more, ever. A few months ago it was expected that each customer would buy three times as much.
Although the rate of spending of each customer is decreasing, the number of new customers is increasing more rapidly. As this is happening the company's equity is being priced such that an Apple user is considered less than half as valuable as she used to be—from 3.2x revenues to 1.5x revenues. This change in user value has been quite abrupt, happening only within the last nine months. What could justify a drop in user value would be a drop in customer satisfaction or loyalty. So far, I have seen no evidence of this happening.
--
Notes:
Note that these revenues include App Store, Music Store, TV Shows, Movies, iBookstore, Mac App store, and Services (including iCloud). Some of this revenue is not reported as part of Apple's statement of operations since some content is treated with an agency model.
I've postponed my estimates for the fourth calendar for a long time. The reason is that there have been conflicting data to deal with and I've been hoping for some clues to give clarity. Unfortunately, even though I waited, I have not received many clues. Here are the challenges we have to deal with in this quarter:
Management gave very low guidance for the quarter's earnings and sales. Normally this should not be a concern since the long-term pattern has been for them to "sandbag" significantly. For example last year's fourth quarter was guided at $9.3 EPS while the company delivered $13.87, a 49% "beat" to their guidance. However Q2 and Q3 beats were only 7% and 13% respectively and if we assume a similar number (10%) for Q4 we get about $13/share which would be a year-on-year decline in earnings (down from $13.9). This has not happened for many, many years. Management explained this through a lengthy set of reasons including a shorter quarter (13 weeks vs. 14 weeks), new product launches, currency fluctuations, deferrals and unfavorable component pricing. Then again, similar explanations were used in the past with no reflection in what actually happened.
Management also launched a large number of new products. This normally leads to a surge in sales. In fact, 80% of revenues would come from a new portfolio of products. Having such a broad launch quarter into a holiday, would normally imply huge growth. Not only is this a critical launch quarter for many products but they also rolled out the iPhone to more markets more quickly than ever: 100 countries in three months. The broad roll-out implies a steeper ramp in production and thus more volumes. This would also contradict the lowered expectations from the CFO. However...
Production was constrained. It was quite a long time before waiting times decreased for the iPhone--longer than what we saw last year. In the earnings call Tim Cook said "It's difficult to predict when supply and demand will balance, but I'm feeling very confident on our ability to supply quite a few iPhones". This again implies significant acceleration but did they achieve the targets? He did also announce that they met their target of 100 countries during the quarter but it's not clear if this was as quickly met as they would have liked.
Margins are complicated. Launch quarters have lower margins typically and this is well understood. However, we have new products in the form of a new iPad at a new price point as well as the new iPhone which may have had some difficult manufacturing issues (i.e. yield). So how much faith do we put in the perennial pessimism in guidance?
There was a vast increase in CapEx in the prior quarter. Normally CapEx spending "leads" production and is in proportion to it. However, the surge in Q2 and Q3 seemed to be unmatched by vast new production, at least that's what we are led to believe by both consensus and by management guidance. Did this CapEx differ in character from previous CapEx? Was it more "strategic" and less "tactical"? Will the disconnect continue?
There are also the deeper questions:
Why there are no new operators being signed? The addressable market has not increased in the last 6 months. Why?
Is there a faster product cycle in the works? Is there a shifting of gears to a new product development process?
What's the nature of the relationship with Samsung as a supplier? Is their replacement characterizing the new type of CapEx spending?
All these currents make this quarter doubly difficult to forecast. And it does not help that it comes on the back of two weak quarters which were argued away as exhibiting transition effects.
So I'm very uncomfortable with my forecast and find it hard to defend this quarter. I considered not publishing one at all because it gives too much confidence when none is warranted. However, I received so many requests to publish that I relent and offer the following:
iPhone units: 55.5 million (50%/62%)
Macs: 5.0 million (-4%/+3%)
iPads: 24.4 million (58%/70%)
iPods: 11.2 million (-27%/-22%)
Music (incl. app) rev. growth: 25%/38%
Peripherals rev. growth: 10%/19%
Software rev. growth: 5.5%/14%
Total revenues: $60.0 billion (30%)
GM: 39.8%
EPS: $15.74 (13%)
I included two growth figures (in parentheses). The first is a straight y/y value and the second is adjusted by assuming there were 13 weeks last year (and that sales were evenly distributed over those weeks).
[We'll get a chance to go over this forecast and what is actually reported at Asymconf. Don't forget to sign up.]
Apple's renaissance began with the iPod. This was not evident right away however. The product was unveiled on October 23, 2001 at a time when Apple's share price had just fallen 70% from year-earlier levels. It was perhaps a good point from which one could expect a recovery to begin.
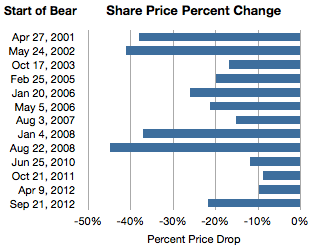
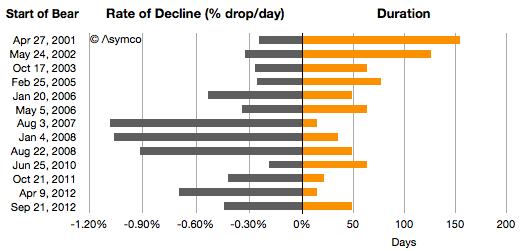
It was not to be. One year after the iPod's launch the stock price had fallen another 20%. Indeed during 2001 the company was in the throes of a "bear market" in its shares. If we measure a time of persistent share price reduction as a bear market, then the one in 2001 was significant. For 154 days, between April 27 and September 28, 2001 the shares fell 38%. This represents the first bar in the following graph showing all the Apple bear markets since then.
I also illustrated these bear markets in terms of their duration and the average %drop/day.
Chronicling these periods:
From May 24th 2002 and September 27th, 2002 the stock fell 41%.
2003 was less harsh but on the second anniversary of the iPod, for two months between October 17th 2003 and December 19, 2003 the stock fell another 17%.
By 2004 the iPod looked like a hit. The stock rose consistently during the year. Then, in early in 2005, from February 25th to May 13, the stock fell 20%.
In early 2006, January 20th to March 10th, the stock dropped 26%. The iPod was reaching incredible levels of popularity and the Mac was looking to be returning to prominence with the switch to Intel.
2007 was the year the iPhone launched. Right after the launch for two weeks between August 3rd and August 17th, the stock fell 15%. That's the equivalent of 1% per day for two weeks.
As the iPhone was shown to be a hit (and before the credit crunch), for four weeks during January 2008 the stock fell 37%. Again, equivalent to 1% a day for 35 days.
Then after the iPhone 3G was launched and growth reached triple digits, Apple's shares fell for 50 days. From August 22 to October 10th they fell a total of 45%. Again, the equivalent rate was 1% every day for a month and a half.
In 2009 the stock recovered steadily but in 2010, again around iPhone launch season the stock fell 12% over a two month period.
Then in 2011 October, 9% was wiped out.
Then for two weeks in April 2012 10% disappeared.
Which brings us to September 21 to November 9th, 2012. This latest "bear market" has run up a loss of 21.7%, running for 49 days.
Sounds dramatic. The even more dramatic twist is that in this same time frame the share price increased by 576 points or the equivalent of 6,294%. Nevertheless, there were 13 episodes when the shares dropped violently and sometimes persistently for long periods.
Why does this happen?
It's important to recall that at no point during Apple's ascent was there "consensus" that Apple was being successful and certainly not sustainably so. Analysts gave it at best a growth prospect of 20%, and the risks were always obvious and prominent. The company was always on the edge and everybody from the layperson to the experts could see that everything was wrong with Apple. Apple went from being irrelevant to being too big without passing through being boring.
So there is a simple explanation for occasional panic: Apple is not predictable.
But it also seems too consistent. Is the pattern of share price collapse actually rooted in some fundamentals, transient or otherwise? There is a clear failure in understanding the long term but were these downdrafts justified as the market "foresaw" or "discounted" the near future? Were these more than just crises of confidence? Was there wisdom in the drops because they were followed by earnings drops or slowing growth? In other words, if there was smoke, was there fire? Was the market being efficient?
No.
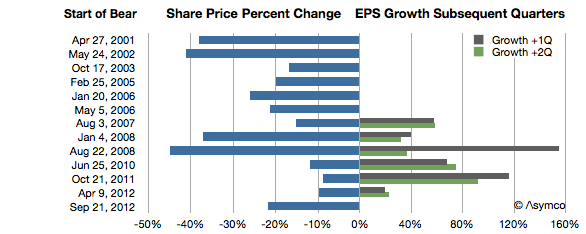
The graph below shows the share price change in the more recent episodes above and the earnings growth during the current and following quarters.
At least since the iPhone launched, every dramatic drop in share price was followed by a surge in earnings growth. One could even say the worse the bear, the better the growth.
Sounds completely counter-intuitive, but there is some perverse logic in this as well. The market reflects crises (as well as over-abundance) of confidence. Unforeseen growth is what creates wealth and the crisis in confidence is a reflection of the improbability of continuing out-performance. When Apple's performance is foreseeable the stock moves slowly upward. When its performance is unforeseeable the stock moves dramatically downward.
A pithy way of putting it is: No news is good news. Good news is bad news.
When a product is understood the stock is mildly desirable. When a new product appears the future is hazy and the stock is undesirable. But that haziness hides potential but up and down. New products is what innovators produce. Bizarre new products is what disruptors produce.
In other words, the paradoxical observation in the chart above of "the more drama in the market, the more success in the marketplace" makes sense when inverted.
For disruptive companies, it should be "the more success in the marketplace, the more drama in the market."
In that sense the current downdraft may be quite auspicious. --- Notes:
Another set of similar observations were made by Eric Jackson in early October in Forbes.
The Price/Earnings ratio is a very simple measure of the "value" a company has. The Price is the current share price and the Earnings is usually the sum of the last 12 months' earnings per share. In other words it measures how many of the last year's earnings are built into the share price. Put yet another way it's the answer to the question "If earnings don't change, how many years will I have to wait before I'm paid back for my share purchase with retained earnings."
So a company with a P/E of 10 implies that if nothing changes, in 10 years a share owner would "earn" back the price they paid for the share. Any earnings after 10 years would be "profit" for the share owner. You can imagine it even more simply as buying not shares but an actual small business of your own. You pay up front for it and then wait until it pays you back. After getting paid back for the initial purchase you then make money that you can set aside.
Obviously this figure of P/E is very sensitive to growth in earnings. Consider paying $100 for a share of a company having just earned $10/share last year. It would have a P/E of 10. If earnings stayed at $10/yr for 10 years, you'd "get your money back" in 10 years. However if earnings grow at 20% then next year the earnings would be $12 then 14.4 then 17.3 then 20.7 etc. Adding these up means you'd get your $100 back in five years, not 10.
So with a company growing at 20% the "realized P/E" is 5. You realized the price of $100 in five years' worth of earnings. In the scenario above you paid expecting to wait 10 years but you got paid in five. If that's your retirement plan then you can retire five years early. Not bad.
Let's then look at what Apple gave investors as "realized P/E."
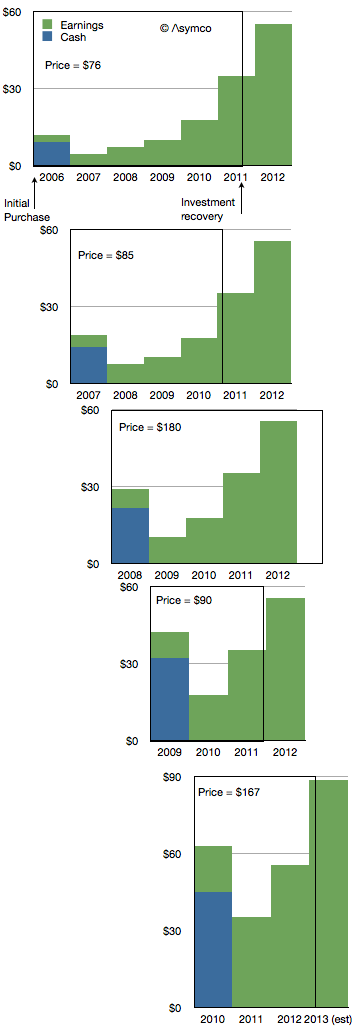
If you bought shares in the first Friday of 2006 you would have paid $76.3/share. At the time the company had $9.36 in cash so you actually paid $66.94 for any future earnings. The P/E ratio at the time was around 35.
The company went on to earn $2.78 in 2006. Another $4.63 in 2007, $7.47 in 2008 and 10.24 in 2009 and 17.91 in 2010. Then in 2011 it earned $35.11.
If you add these values up you realize that Apple reached your price about two thirds of the way into 2011. So the company earned your purchase price in 5.7 years. That becomes the realized P/E if you bought in early 2006. The following diagram shows the time period as a box encompassing the earnings (and cash) for a share purchase in early 2006.
I repeated this for purchase in early 2007. The result is a Realized P/E of 4.9. I did it for 2008 as well[1] and got 5.4 then 2009 yielded an astonishing 2.9. 2010 was not much different with 3.2.
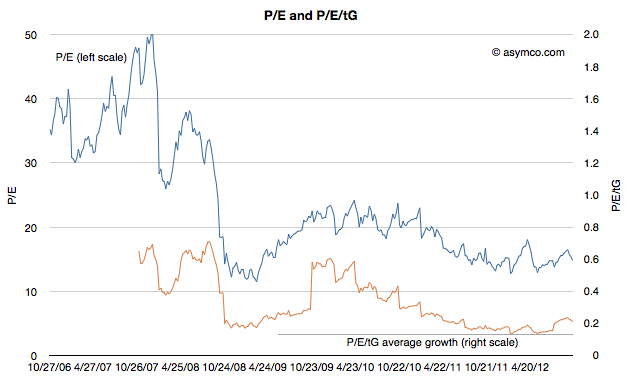
Investing in Apple between 2006 to 2010 meant obtaining a payback period of less than 4.5 years, on average. In other words, regardless of what the trailing or forward P/Es getting quoted at the time (trailing is illustrated below), buyers actually paid for only about 4.5 years of earnings. In other words they actually bought Apple for a P/E of about 4.5.
Using our small business analogy, buying Apple in the past few years has meant getting paid back in less than five years. That makes it a very low risk opportunity.
I could try to repeat the process for years 2010 onward but it would require making forecasts beyond 2013, something I leave as an exercise to the reader.
---
Notes:
I had to make assumptions about full year 2012 and 2013 earnings. I used $55.4 earnings for full calendar year 2012 and 60% growth for 2013.