Asymco

Asymmetric Intelligence

earnings

  1. Analysts upgrading AAPL

    Research

    Susquehanna Financial's Jeff Fidacaro: To $335 from $325.

    Kaufman Bros.' Shaw Wu: To $340 from $320.

    Piper Jaffray's Gene Munster: To $348 from $340.

    Caris and Co.'s Robert Cihra: To $325 from $310.

    Morgan Stanley's Katy Huberty: To $332 from $310.

    International Strategy & Investment Group's Abhey Lamba: initiate with $320.

    Cowen's Matthew Hoffman: initiate with $326.

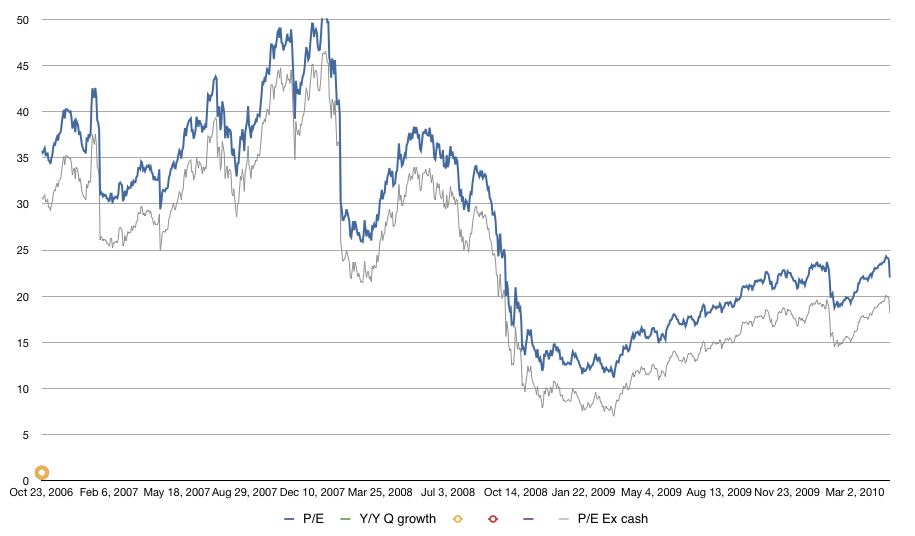
    At yesterday's closing price Apple was trading at a 12-month trailing P/E multiple of 23 despite revenue growth that may exceed 50% and EPS growth that may exceed 70%.

    Using the highest target of $348 price target as an example, it prices the shares at a P/E of less than 30 times the most recent 12-month earnings which does not take into account the contributions from the iPad.

    Apple is on track to report three consecutive quarters of record revenue and earnings (beginning with the June quarter) and current analyst price targets do not reflect the current and anticipated rates of revenue and earnings growth.

    Analysts scramble to raise AAPL targets - Apple 2.0 - Fortune Tech.
  2. Wall St. discounts Apple's growth potential

    Research · 2 comments

    Apple, with its $50 a share in cash, could earn as much as $17 to $20 a share in 2011, which means the stock is trading at a cheap 12.5 times next year’s earnings. Cramer said even if Apple hits his $300 target, the stock will still be cheap trading at just 15 times earnings.

    “That’s less than almost every single growth stock I follow,” Cramer said, “and even less than the S&P 500’s multiple.”

    via Jim Cramer Predicts Apple Inc. (NASDAQ:AAPL) will hit $300 a Share | Madd Money.

    S&P forecasts the S&P 500 average P/E for 6/30/2010 at 22.57.

    Readers of this blog may recall that I noticed Apple's discounted valuation several times.

  3. Apple's Growth Scorecard

    Research

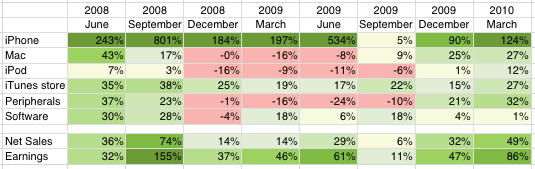
    Apple's growth and its disconnect with valuation has been a common theme on this blog. For another look at this conundrum I present here a table of Apple's year on year sales growth by product line and its top and bottom lines.

    I color coded the values so that a darker green signifies higher growth (and red, negative growth)

    I call this the growth scorecard.

    What does this scorecard say about the previous 24 months?

    • Earnings never grew slower than 30% for any quarter except for one quarter when the comp was ridiculously high at 155% (on the back of iPhone 3G launch).
    • Throughout the recession Apple grew sales.
    • The worst growth performance was on peripherals which is Apple's smallest business
    • The fastest growth was the iPhone, now Apple's largest business.
    • The iTunes store grew sales consistently throughout the previous 24 months.
    • Growth has been positive (green) across all lines for the past two quarters and has been accelerating.

    My estimate for the current (June) quarter is that Net Sales will grow by 47% y/y and Earnings will grow by 60%.

  4. Apple continues to trade at a discount to growth

    Research

    Apple's latest earnings showed growth of nearly 90% (following a nearly 50% growth the previous quarter.)

    Normally, growth like this is rewarded with a significant P/E ratio of 30 to 40.  Apple enjoyed P/E of 50 as recently as 2007.  However Apple's P/E ratio dropped to about 22 after earnings.

    Although higher than during the worst of the recession, this low P/E either reflects continuing pessimism in the overall sustainability of the economy or a continuing discounting of Apple's potential growth.

    Excluding the nearly $45/share cash and looking at a forward twelve months earnings of 15, the forward P/E is an almost embarrassing 14.

    It's possible that after a few quarters of above 50% growth Apple's P/E and hence its valuation will return to more normal (PEG ~1.0) levels.  A P/E of 30 at today's trailing 12 months earnings would put the stock above $350/share.

  5. Apple as Macroeconomic Counter-Indicator

    Research

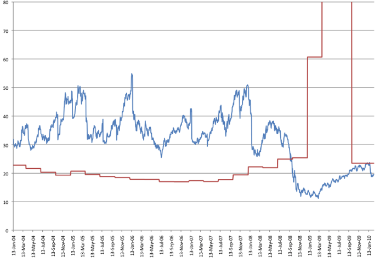
    Following up on the Apple Valuation Entry, I went to the data and pulled the historical P/E for Apple back to include all of 2004 (in blue) and did the same with the S&P P/E (in red).

    A few notes:

    • Apple’s P/E was consistently above 30 until mid-2008
    • Apple’s P/E was consistently and substantially above the S&P until mid-2008 by at about 10 to 30 points.
    • A reversal occurred at that point with S&P P/Es reaching record highs (actually at over 120 in May) and Apple’s reaching record lows of 11 at a time when the S&P P/E was over 60.
    • Since the reversal, Apple’s P/E has been consistently below the S&P’s and indeed has stayed near historic lows while the S&P is returning to historic averages.

    This reversal happened during a time of recession when, in contrast to most companies, Apple kept growing. The spike in the S&P P/E is due to a dearth of earnings, while Apple had increased earnings, sometimes to new records.

    As a “premium” brand it’s perhaps perplexing that Apple seems to be acting as a counter-indicator to macroeconomic conditions.

    Expectations for Apple to decline in times of economic contraction did not come true and as recovery seems near, Apple appears to be discounted.

    In other words, when times are bad, Apple surprises and does well so therefore when times are good Apple should do badly.