By Daniel Tello's ranking I was first in Q2 but 8th (out of 38) in Q3. Overall, bloggers beat Pros but by a lower margin than in the past.
I have been ok at estimating product line performance and top line sales but not so good in guessing margins. Last quarter I went for a high iPhone number (13 million vs 14.1 actual and 11.39 Pro/12.07 Blogger consensus) and middle-of-pack on iPads (5 million vs. 4.2 actual and 4.79 Pro/5.52 Blogger consensus). The total iOS units I forecast was 18 million and Apple sold 18.3 so I was fine on units and pricing.
My guess on the cause of my estimate failure on margins was iPhone 4 rollout ramp. I had to take iPhone margin down to below 50% (about 49%) to make the reported total GM. iPhone has been, on average, running at 52% over the life of the product.
"Media tablet hype around devices such as the iPad has also affected consumer notebook growth by delaying some PC purchases, especially in the U.S. consumer market. Media tablets don't replace primary PCs, but they affect PC purchases in many ways," Ms. Kitagawa said. "At this stage, hype around media tablets has led consumers and the channels to take a 'wait and see' approach to buying a new device."
Fascinating. I'd love to hear more about the non-iPad "media tablets" that delayed PC purchases last quarter. Maybe I don't get out enough.
But more to the point, let's combine the data from Gartner and the forecast for iPad.
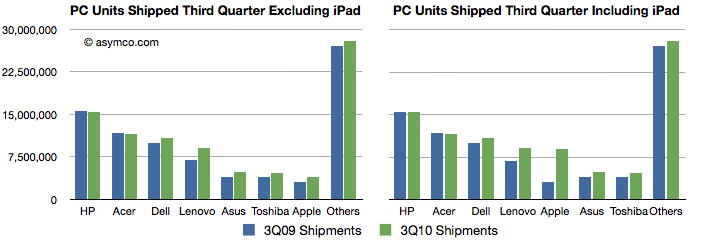
I show below the impact of the iPad on PC vendor sales. I'm using my own estimates of world-wide PC sales (you can see other estimates here (Apple 2.0))
The world-wide PC units shipped without and with iPad:
When including the iPad Apple goes from 7th to 5th ranked, and with 50% growth clearly within shot of top rank next year.
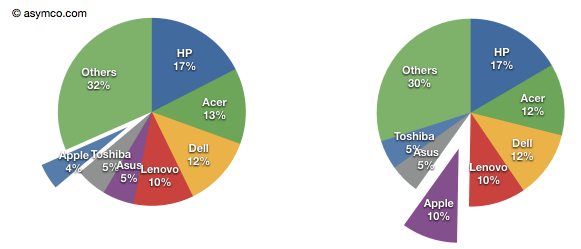
Now I look at PC unit shares:
With the iPad Apple goes from 4% share to 10% share. Again, within striking distance of number one or two in a year.
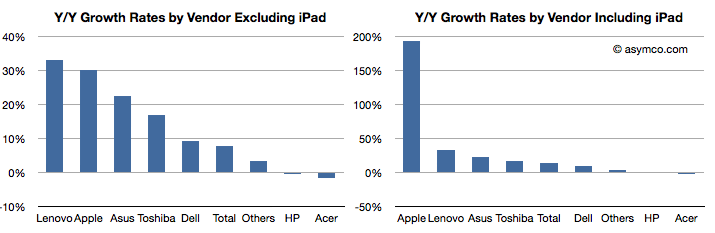
Finally, growth rates:
Apple's share growth goes from second to first but also several times higher than any of the others.
When Gartner spins the iPad as a "Media Tablet" it's clear that the device is disruptive. Reminds me of what Gartner thought about Smartphones four years ago.
I cannot think of a better endorsement for an investment than a snub from Gartner.
In recent articles I highlighted the acceleration in iTunes App downloads where the rate is approaching 18 million apps per day and the cumulative total apps which is about to overtake the cumulative songs downloaded.
We now turn our attention now to constructing the iTunes income statement: namely total sales, gross margins and deduce its operating budget.
Gross Sales
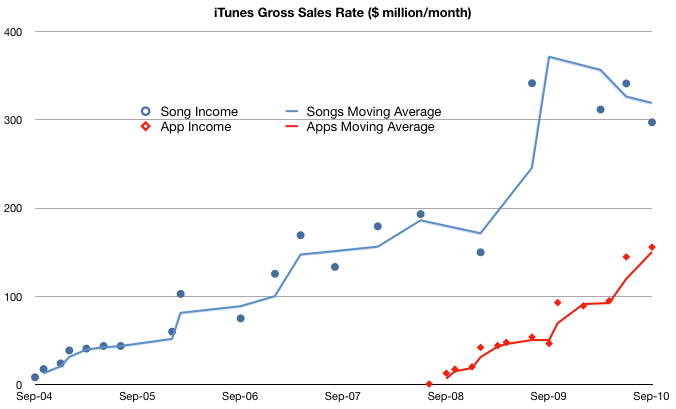
To obtain the top line (income) for iTunes we need to know the average selling price (ASP) for songs and for apps. Apps are easy, we received that info in June: $0.29 per app. For songs, it was easy before early last year: $0.99/song. After the selective price increase, the blended price needs to be estimated. I chose $1.10 for 2009 and $1.2 for 2010. These are just assumptions and can be adjusted but should give us a rough estimate:
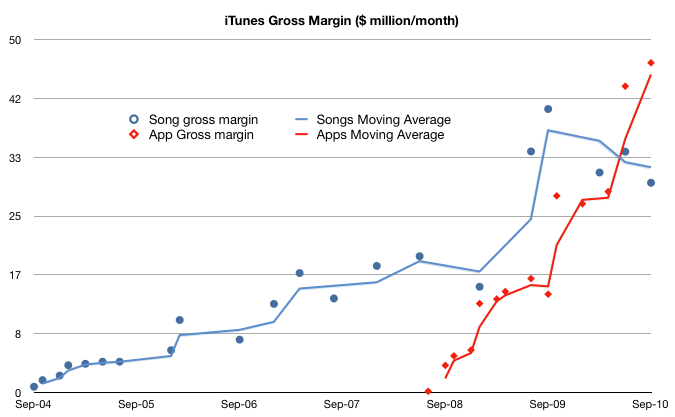
I followed the convention of using income rate or $/month to show the history of sales. It shows that even with a price less than a third of the music product, apps are generating over half of the sales of music. In other words, apps are adding 50% to iTunes sales today. If the decline in music units continues and the app sales increase with the current trajectory then app sales value will overtake music sales next year, consistent with the cross-over of cumulative units sold.
Gross Margin
If we know how much Apple pays music licensors and developers (i.e. cost of goods sold) we can calculate how much it keeps for operations (gross margin). Apple's app margin is 30 percent. The music margin was never official but the consensus has been 10 percent for a while.
Using these figures, we get the following chart:
This shows that what is left after paying the content license, Apple "keeps" about $50 million every month to run the App store (iTAS) and another $30 million to run the Music store (iTMS).
The Operating Budget
Apple has made a point of saying that both iTAS and iTMS are run at "break even" implying that the gross margin is used up in operating costs (CAPEX, R&D, SG&A). To be sure, the cost of bandwidth and the data center(s) needed must be considerable.
But the operating budget for the store is beginning to reach a level that may be beyond what can be spent reasonably. The amount left over for operations has increased from ~$30 million a month in 2009 to $75 million/month today.
In fact, if this burn rate is maintained (even though it's increasing) the operating budget for iTunes is nearing $1 billion/yr.
I'm not an expert on the cost of operating data centers but $ 1billion a year seems like a lot. I would love to see an analysis of how this could be allocated.
Implications
I would also add that because of the increasing mix of apps, the overall gross margin percent is increasing. I estimate that to be a blended 17%--a healthy margin for a content store--and an increase from 10% before the app store came online.
Finally, one implication of the economics involved is that a budget like this may provide a significant barrier to entry for any competitors looking to take on the iTunes juggernaut. iTunes has reached content critical mass (12 million songs), user base (160 million users) and wide distribution (23 countries for songs and 80+ countries for apps).
These are non-trivial operational issues that even the best in the "cloud" business models will find challenging.
Footnote:
This discussion excludes video sales, rentals, book sales as we don't have solid histories for these product lines. However, we can do a spot check on the cumulative totals:
450 million TV episodes downloaded implies $1 billion in sales.
100 million movies downloaded probably adds at least another $1 billion
35 million books adds another 500 million.
Compare with 11.7 billion songs at ASP of $1 for about $12 billion in song sales and 6.5 billion apps at ASP of $0.29 or about $1.9 billion.
iTMS content downloads have generated $16.4 billion in sales to date.
Ghai now estimates that Apple will sell 5.75 million iPads in the quarter that ends Sept. 25, up from an earlier estimate of 5 million, and 22 million in fiscal 2011, up from 19.5 million.
That's very close to my estimate of 21 million, though I might add that my estimate is unrevised since US supply met demand. There are still markets which don't have iPad distribution however, so we'll see if global demand can be met before year end.
By the way, the estimate of 5.75 million for this quarter is higher than all but three of 14 analysts estimates on iPad unit forecasts *for the first year*.
On the iPhone, the firm raised their production forecasts from 14 million units to 18+ million, aided by easing constraints of display panels. Checks show consistent shortage of iPhone 4 inventory at Apple stores and there continues to be a three-week shipping delay from Apple's online store, the firm notes. As a result the firm has increased confidence in its 4QFY10 iPhone unit estimate of 11.6 million, which is up 39% sequentially.
On the iPad, the firm's build forecasts were revised up from 6 million to 7 million, which compares to their iPad shipments estimate of 4.75 million. The firm believes [there] is upside to the Q4 estimates and CY10 estimates of 13.4 million units, given the strong demand and anticipated production ramp heading into the back-to school and holiday seasons, as well as the high level of interest from business customers as expressed by AT&T.
These sound reasonable and credible. Note that production forecasts don't translate into sales forecasts as there is inventory, and some of that inventory will be held by Apple and some by the manufacturer.
My Q4 estimate sits at 12.1 million iPhones and 4 million iPads.
The iPad units numbers were not a surprise (except perhaps to some of the professional analysts who do not read Apple's press releases). Among the more accurate (amateur) analysts, the range was from 3.2 to 3.45 million with an average of 3.32. My estimate of 3.3 million was the mode of the distribution.
Apple sold 3.270 million in the first ever quarter. The ASP came in at $662.39, below my expected $700 but higher than the iPhone.
The only unknown is the gross margin. Given the overall GM and the other products' margins, I am backing out a 33% margin for the quarter. I had expected 40% but the lower margin may be a result of launch quarter issues (shipping and allocation of stock) and perhaps a lower target margin for the product. It should be noted that the iPad margin sits between the Mac and iPod (around 30%) and the iPhone (around 60%). The iPad is a new category that sits between the Mac and iPhone in terms of usage and it seems it sits also half-way in terms of margins. Going forward, I'm still modeling a 40% GM for the iPad.
Overall, I estimate the iPad added $717 million of operating profit to Apple's bottom line. Not bad for a product that was almost universally panned on launch day.
I was surprised by the poor predictions of Mac units by the analyst community with estimates ranging from 2.86 million to 3.51. It was fairly clear to me early in the quarter that the product would get 30%+ growth. There was little news except overall Mac momentum to shape the forecast and it seemed logical that the growth would stay inline with the last quarter which was 32.8%. I dialed in 33% after the first month and stuck with this so my forecast came out to 3.46 million.
In the event, 3.472 million were sold for a growth of 33.4%. The ASP came in at $1,267, slightly down from $1,278 last quarter and $1,289 the year before. ASPs are eroding but Apple are holding the rate down with product updates. Looking forward, I'm forecast $1,300 ASP.
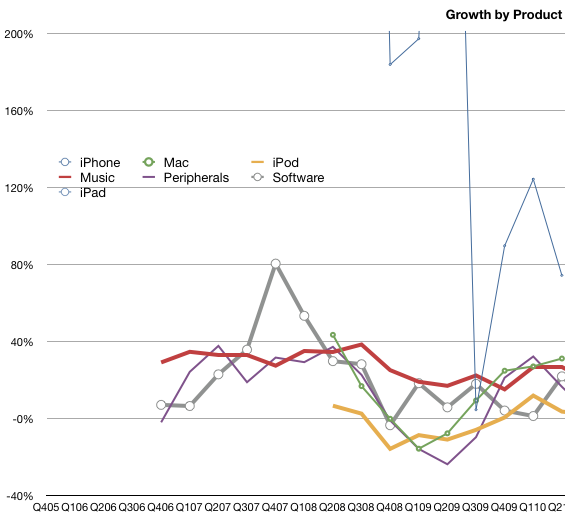
I estimate gross margin for the Mac at 27%. This is down from 31% a year ago. Revenue growth year-on-year was 31%. The Mac franchise is still doing better than most PC vendors and is gaining share. The graph below shows the growth by product revenues. The Mac is now the second fastest grower after the iPhone (the iPad is not included yet as these are y/y growth rates.)
An Ericsson survey shows that the number of global subscriptions to mobile phone services has passed over 5 billion. The global population is estimated at 6.9 billion.
It’s hard to estimate what 100% penetration in this industry is but there is a strong possibility for another billion accounts to be added in the next year. This estimate includes all service accounts, not individuals. As users begin to carry multiple devices (i.e. phones and iPads), the number of subscriptions could easily exceed the global population. In some countries, penetration above 100 percent is already the norm.
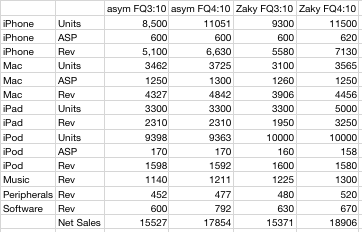
The third fiscal quarter is at an end and it's time to estimate performance. Andy Zaky has kicked off earnings season with his detailed accounting of what could be a $63.5 billion year for Apple.
I put forward below my estimates side-by-side with Zaky. I come in at $62.6b for the year, differing by just under $1b or 1.6%.
His numbers are certainly within what I would consider a margin of error of mine.
My estimate for iPhones this quarter are lower due to possible slowing of sales before the iPhone 4 launch. My Mac numbers are higher based on some early estimates of industry pick-up. I concede that my FQ4:10 iPad estimates are low, but sticking with them for now.
On May 5th, I tried to fill in the blanks on Global smart phone OS shares | Asymco. I estimated that the shares for the mobile OS's were as follows (based on Canalys partial data):
Symbian (Nokia): 42%
Blackberry OS (RIM): 19%
iPhone OS (Apple): 16%
WinMo (Microsoft): 10%
Android (Google): 10%
WebOS (Palm): 2%
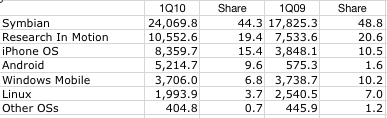
Now Gartner has published their sell-through estimates:
Symbian (Nokia):: 44%
Blackberry OS (RIM): 19%
iPhone OS (Apple): 15%
Android (Google): 10%
WinMo (Microsoft): 7%
Linux: 4%
Other OSs: 1%
My estimates were within 1 or 2 percent of actuals except for Windows Mobile where I over-estimated by 300 basis points.