Asymco

Asymmetric Intelligence

estimate

  1. Analysts: Apple's growth next year to drop to half of what it could obtain during the recession

    Research · 72 comments

    Apple is having difficulty meeting demand for the iPhone and the iPad. It is growing both businesses at more than 100% and they make up about 65% of revenues, and 71% of profits. The Mac business is also growing at 2x to 3x the PC industry.

    Being supply constrained makes it therefore a great challenge to forecast future growth for the company. Supply issues and ramp rates are needful of an operational expertise few possess outside of the industry. But many take up this challenge, myself included. We put up our numbers every quarter and get scrutinized and challenged for our failures.

    So it's always exciting to see how others are looking at the big picture. Sadly, with the growth data being what it is, there seems to be a great deal of pessimism around the company's prospects. The P/E ratio has remained at despondent levels for over two years, barely tracking with the P/E of the S&P 500 and not reflecting the company's historic or current growth.

    The logical explanation is that pricing reflects a consensus that growth will fall off a cliff. Indeed this can be confirmed. Bloomberg surveyed analysts and they say:

    Apple’s sales may climb 54 percent to $100.3 billion this fiscal year, which ends in September, the average prediction of analysts surveyed by Bloomberg. Growth may slow to 18 percent the following year.

    Fifty percent growth this year and 18 percent next year is indeed catastrophic. Consider the company's recent history as shown in the following chart:
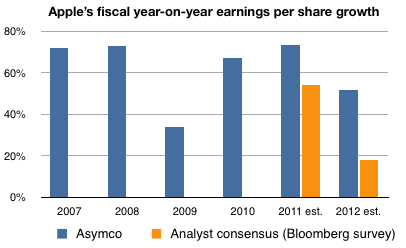
    The company has been growing earnings around 70% a year since 2007 at least. The exception being 2009 when in the middle of the worst recession for a century the growth dropped to 34%.

    I took the liberty of adding the estimates cited above to the chart (in orange) while putting forward my estimates for the same time frame.

    I am, I believe, conservative in my estimates (for example, my estimates do not take into account any new product categories Apple may launch). But the prospect of 18% growth for the fiscal year beginning this October is quite hard to justify knowing what I know about the markets Apple competes in. As I've amply described in this blog, the mobile computing (aka post-PC) shift is underway and Apple is leading the charge. The prospect of billions of unserved customers beckons and Apple is crushed with demand.

    But let's not quibble about billions of desperately underserved consumers. The thing that sticks out from the chart is that analysts are forecasting growth about half of what Apple was able to achieve in 2009--a time when consumer spending practically stopped world-wide and there was talk of another depression.

    Either they're in agreement that we're in for something resembling a global plague starting in six months or they believe Apple is singularly positioned to drop the ball.

    I would love to hear some these scenarios defended because I see no evidence for either.
  2. The billion dollar Smart Cover

    Research · 105 comments

    I was only half-joking when, on first sight, I tweeted that I will buy a new iPad 2 to go with my new Smart Cover. The new iPad cover is enchanting.

    It also seems to be enchanting to many.

    I'm estimating that at least 60% of iPad buyers will get one. Based on an estimate of 36 million iPads sold in 2011 and an average price of $48 (70% polyurethane and 30% leather mix), the total revenue for Smart Covers will top $1 billion this year.

    I further estimate that with a very modest gross margin of 75% (average cost to produce of $12), the Smart Cover could contribute $777 million to Apple's gross margins.

    The iPad by itself should generate $23 billion in revenue and a contribution of $7.7 billion. That means that the Smart Cover will add 4% to sales and 9% to gross profits. If taken as a bundle, the iPad+SC will increase gross margin over the iPad alone by nearly 200 basis points (taking it from 33% to 35%).

    It will be interesting to compare the Smart Cover business with competitor tablet businesses.

  3. Platform sunk (cost): What is the value of a quarter billion Symbian users?

    Research · 38 comments

    In the quarterly smartphone summary published here, I noted the significant acceleration of Android sales at the expense of "other" and Windows Mobile/Phone. Some share was also lost to Symbian. This might be seen as justification for the "platform jump" that Nokia undertook.

    In a second discussion, I published the history and life cycles of the smartphone platforms, identifying 10 platforms (out of 16) still in the market. This challenged the view that it was a two horse race today and that it will become no more than a three horse race in the future.

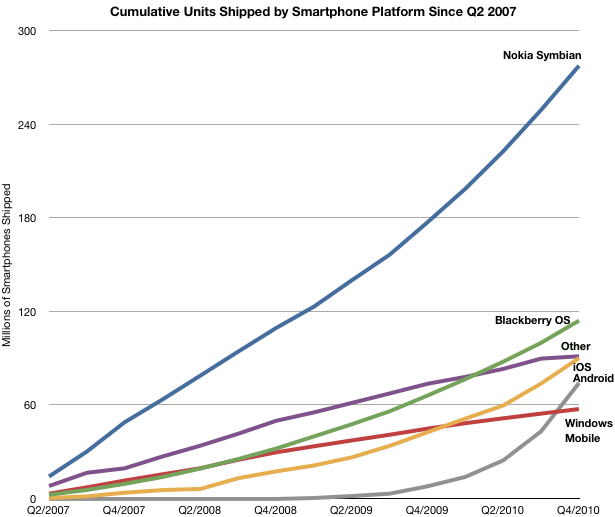
    Questions came up about the "quality" of these platforms. Clearly some are barely viable while some are thriving. To explain the value of a platform, one metric we can use is the cumulative sales which allows us to derive the installed base.

    The following charts do just that.

    This first chart shows the cumulative total of units sold since Q2 2007. This is the sum of all smartphones sold in the last 3.5 years. There are some interesting patterns here, but right now we want to focus on the installed base.

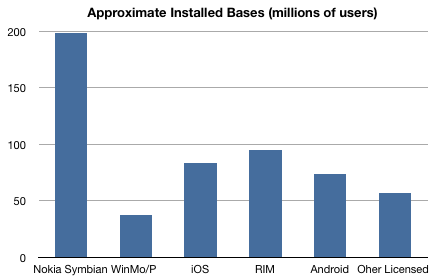
    3.5 years of cumulative sales is an upper bound on the installed base. We can get a better estimate the phones in use by subtracting from the base phones older than 2.5 years. This is shown in the second chart below:

    As of the last quarter, Nokia's Symbian is likely to have 200 million in use. Apple may have about 85 million iPhones in use (this excludes iPod touch and iPads) and Android about 75 million. RIM is around 95 million and Windows Mobile less than 40 million.

    What's interesting is that of these installed bases, the largest is the one that's just been abandoned, and the smallest was chosen as its replacement. Even that's not quite fair since Windows Mobile is not a valid replacement. It's Windows Phone that was chosen and that probably has an installed base of about 1 million [Unlike the measurement of units shipped, Microsoft reported two million licenses were sold to OEMs who had to build those into phones which would be shipped to carriers and distributors. One million may be a generous estimate.]

    The bottom line is that there are about 5 Windows Phone users for every 1000 Symbian users. In other words, Nokia jumped from the "burning" 200 million user Symbian platform to the "ice cold" 1 million user Windows Phone platform.

    The disposal of such a large installed base must count among the largest divestitures in technology history and, when coupled with the adoption of the least-tested alternative as a replacement, elevates platform risk-taking to a new level. It may seem bold, but there is a fine line between courage and recklessness.

    I'll do my own "dive" into the possible justification for this in a future posting.

  4. Nokia employs as many people to develop its smartphone software as Apple does to develop all its products

    Research · 106 comments

    In a recent post I pointed out that Apple's R&D was about 2.2% of sales in the last quarter. Bernstein took a look at the R&D for Nokia and presented a chart showing the difference between the mobile industry players in terms of total expenditure on R&D.

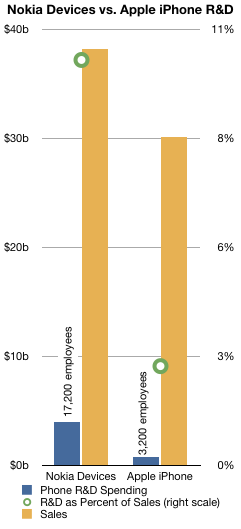
    I took inspiration from that to plot the Devices R&D for both Nokia and Apple over the entire 2010 period. I also compared that with sales and computed the ratio between R&D and sales.

    The result is shown in the chart on the left.

    Bottom line: Nokia spent 10.2% of phone sales in 2010 on phone R&D while Apple spent 2.5%.

    Bernstein goes on to argue that at least for Devices,

    Nokia spent $3.9bn in R&D in 2010, almost 3x the average of its peers, 31% of the industry's R&D total spending, for an output that we can qualify as visibly disappointing.

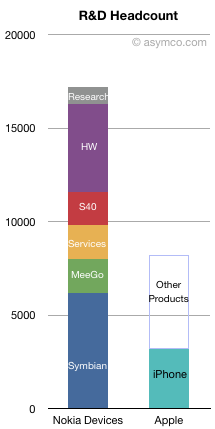
    To relate the $3.9 billion for Devices into head count, they estimate that Symbian projects employ 6,200 people; MeeGo and Qt 1,800; Services 1,800; and S40 1,800. Hardware headcount is assumed to be 4,700 and 900 more for fundamental research.

    So Nokia's total software headcount adds up to 11,600 people. Nokia smartphone headcount adds up to about 8,000.

    Applying a similar formula ($240k/employee[1]) to Apple's estimated iPhone R&D (from Bernstein's chart) yields a headcount of about 3,200 and a total Apple company R&D headcount of 8,200.

    So Nokia employs about the same number of engineers[2] for its smartphone software platforms as Apple does for all its product lines[3].

    In fact, Symbian alone may cost twice as much to develop than the iPhone (including the hardware).

    ---

    Notes:

    1. The cost per employee is obviously different between the companies as they operate in different countries. However there are enough sources of error in these estimates that they probably overwhelm the cost of living/tax differentials.
    2. I know that engineers are not all that R&D headcount covers, but let's assume that the mix of overhead is similar for the two companies.
    3. The total for Symbian + MeeGo is 8000 and the total for Apple overall is 8,200, however one can comfortably allocate 200 out of 900 researchers out of Nokia research to their mobile software effort.
  5. Summary view of Apple's income statement [Updated]

    Research · 22 comments

    Since reporting on the 18th, I've mostly finished going over the the fourth quarter Apple data. Here is a quick summary of the articles that covered the financial and product performance:

    SubjectArticle
    CashHaving added $20 billion last year, Apple’s cash growth suggests total could top $100 billion next year
    GrowthApple’s Growth Scorecard: 63% average earnings growth over 16 quarters
    iPhone pricingThe end of exclusivity doesn’t change the price operators pay for the iPhone
    Sales by product65% of Apple’s sales came from iOS powered devices
    Next quarter’s estimatesEstimates for Apple’s second quarter earnings (ending March)
    Share price/valuationIs Apple a candidate for acquisition?
    Margins and platform mix of profitiOS enables 71% of Apple’s profits. Platform products power 93% of gross margin
    CannibalizationiPhone and iPad: Fine Young Cannibals?
    Operational Expenses$76 billion a year from a tableful of products

    That leaves one more: Summary view of cash flows.

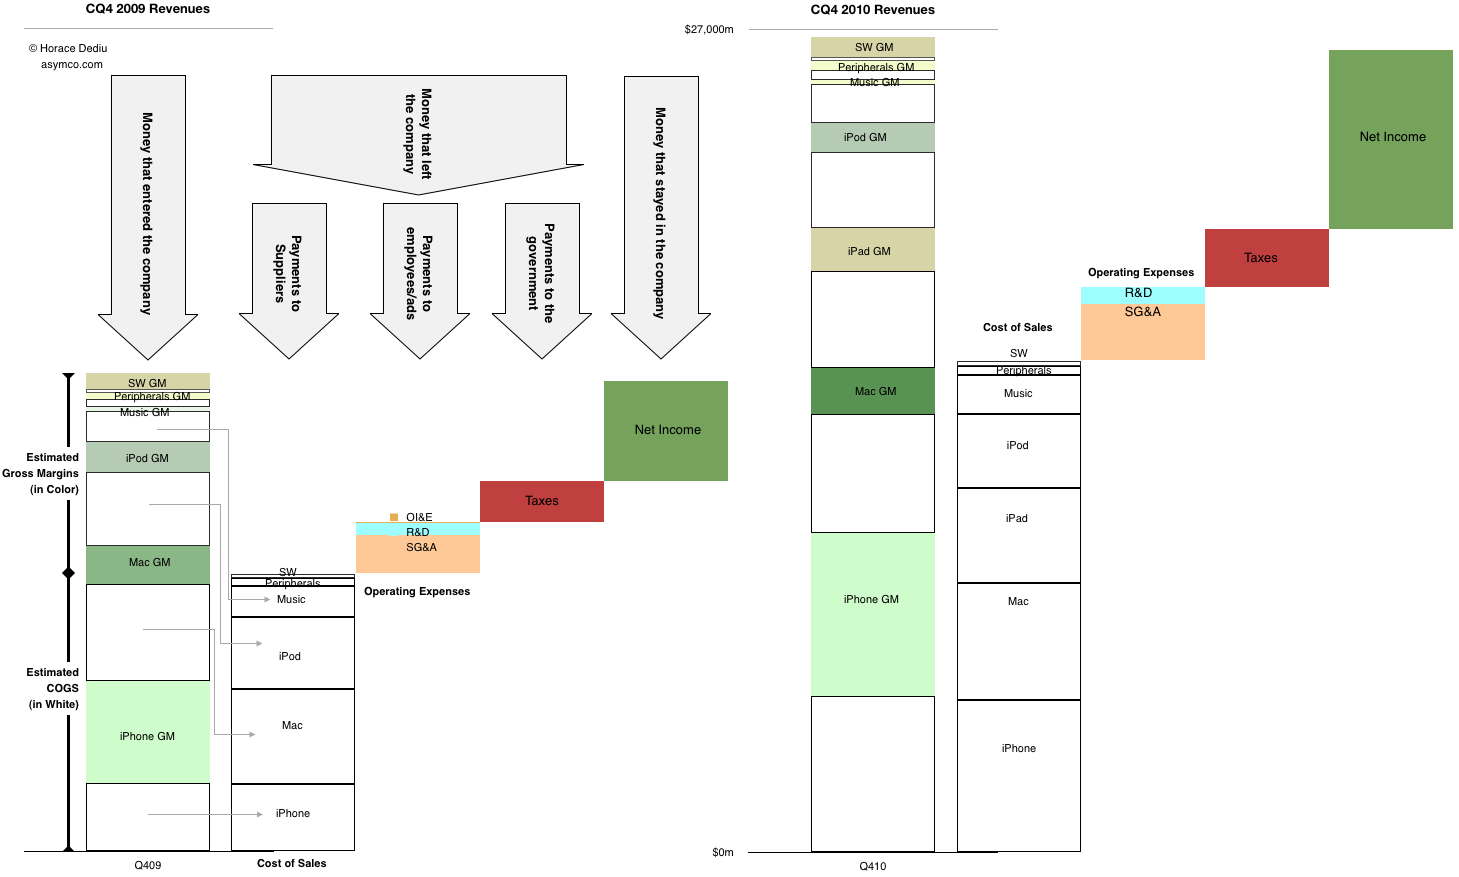
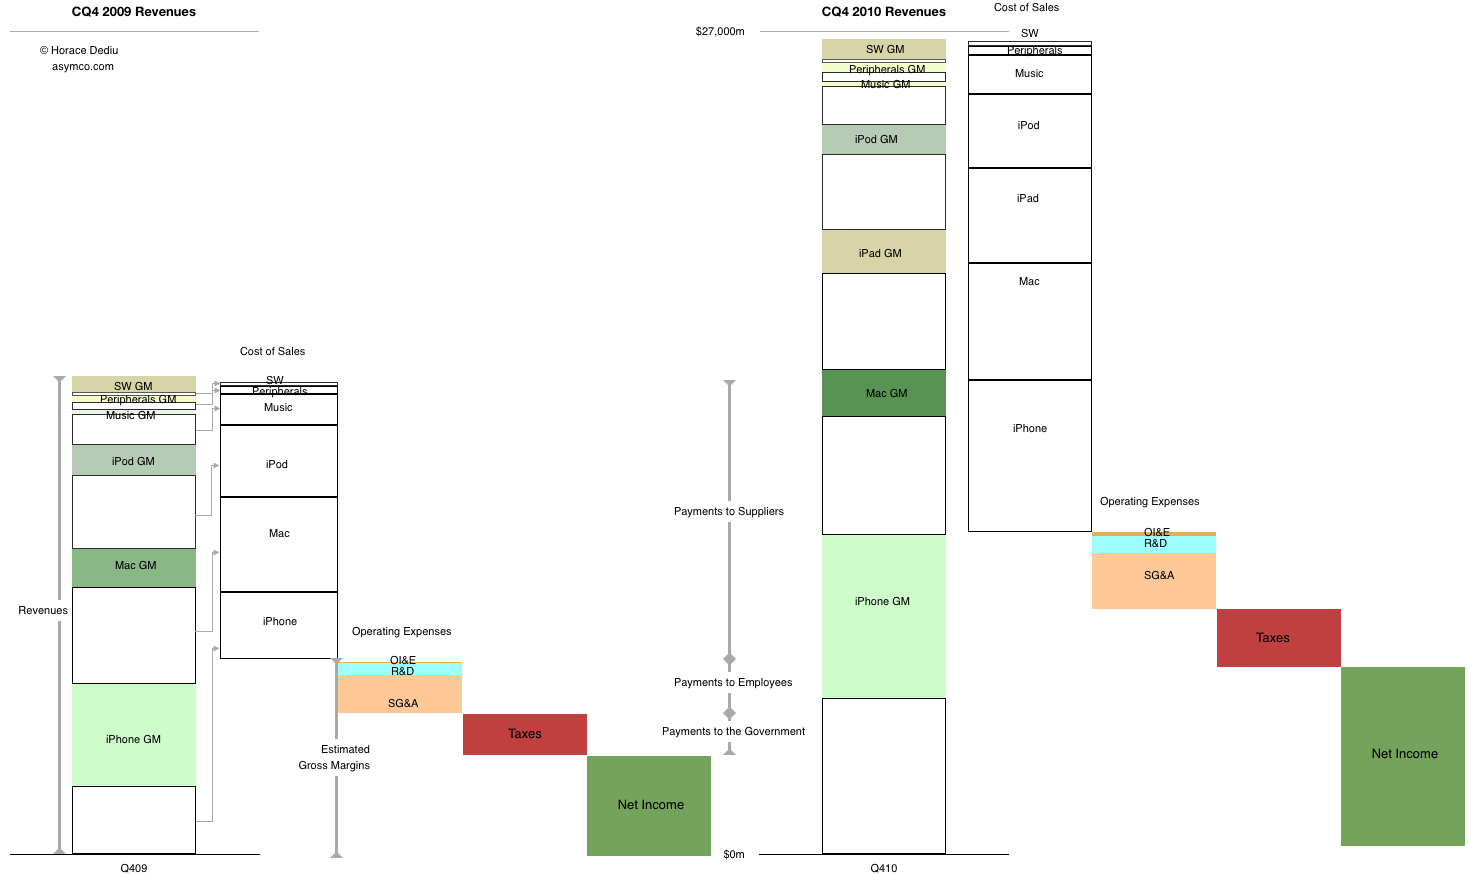
    After introducing it last quarter, this is a chart that I'm trying to improve and use as a single snapshot of growth, product mix, profitability, cost structure and overall sales. The purist in me likes to see the chart clean but it can be a puzzle to some.  So for the sake of explanation, this time I've added some annotations to the year-ago quarter.

    The left half shows flows in the same quarter a year ago and the right side shows the flows in the fourth quarter just ended December 2010. You can see where sales came from, how much of each product's sales went to suppliers and how much was available to pay employees (and who got what). You can also see how much was paid in taxes and what was retained.

    Please click on the figure (requires no scrolling when viewed on screens wider than 1464 pixels).

    [Update] Alternate view using "waterfall".

  6. iOS enables 71% of Apple's profits. Platform products power 93% of gross margin

    Research · 17 comments

    As the highly profitable iPhone makes up an increasingly larger proportion of Apple's sales, the overall gross margin would be expected to grow.

    Sure enough that's what's been happening.

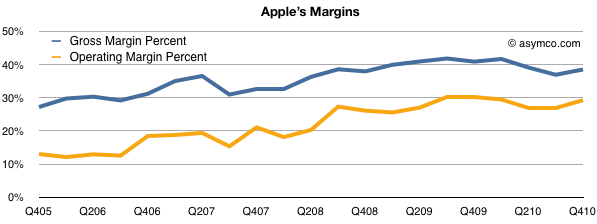
    The gross margin percent, which measures the direct or variable costs of production vs. price, shows a healthy rise in the last five years from slightly below 30% to around 40%. The Operating Margin, which also includes the overhead or fixed costs like R&D and SG&A, shows a similar rise, reaching about 30%.

    Margin expansion while sales quadruple is a good indicator that a company is producing real value not just trading sales volume for profit.

    Focusing attention on individual product lines, it's clear that the iPhone is the largest component of sales and of profits. We don't have specific product line-item gross margins from management, but we can estimate a figure for the iPhone by several means.

    First, we can work out roughly what every other product line's margin is due to their longer histories. (Mac and iPod have reliable profitability estimates). What's left can be deduced to make up the iPhone's margin.

    Alternatively, we can get estimates of the bill of materials and add in some of the other direct expenses like manufacturing, warranties, shipping and incidentals to get an estimate of the cost of production.

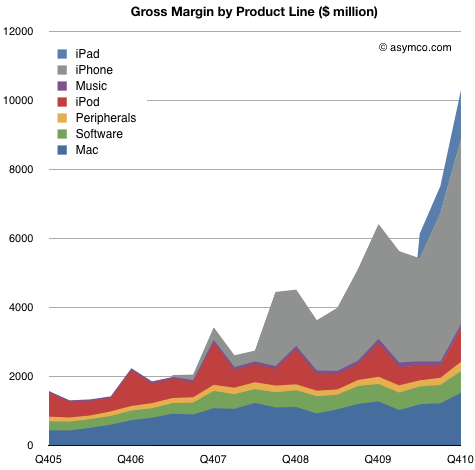
    These methods allow me to guess at a margin for the iPhone of about 50% for the last quarter. Based on these inputs we can plot the gross margins for the entire company's product lines:

    Overall, gross margins have reached over $10.3 billion in the quarter, increasing 543% from five years ago and 61% from a year ago.

    That's great, but by knowing product line profitability we can get a better feel how the company changed strategically.

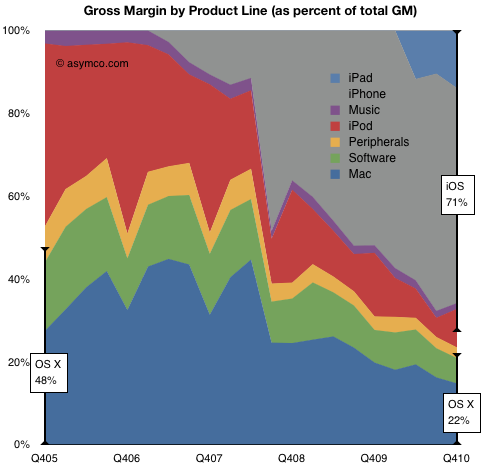
    In the following chart I show the percent of gross profit captured by each product line.

    What we can observe is that at the end of 2005, OS X based products made up nearly half the profits. The rest was mostly the iPod, which was not a software platform product.

    A short five years later, OS X products which, although having grown in volume, made up only 22% of total margin. The rest was mostly iPhone but with significant contributions from iPad and iPod. What's most important to note is that the non-OS X profits are almost all powered by iOS.

    iOS powers about 70% of Apple's current gross profits. Combined with OS X, 93% of profits are from platform products.

    So again the question about Apple being a software, hardware or media company comes back. Perhaps, those categories are not relevant. Perhaps Apple is a platform company.

  7. Apple now trading at 10.5 times Deagol's fwd EPS estimate ex cash

    Research · 54 comments

    Apple now trading at 12.9 times Deagol's fwd EPS estimate (10.5x after excluding cash).

    Deagol's AAPL Model: Fiscal 1Q 2011 Final Estimates.

    The revenue growth rate is expected to continue at 66% (following 61% and 67% for previous two quarters). Earnings growth is also expected to be maintained at 70% as it has been over the full calendar year.

    Apple continues to be one of the cheapest stocks in the S&P 500 when measured by growth multiples.

    After years spent thinking about it, I can only conclude that the company's depressed valuation is due to the uncertainty surrounding the CEO succession plans.

  8. 20% vs 33% for "Others": Why are Gartner and IDC so far apart on mobile phone market estimates

    Research · 39 comments

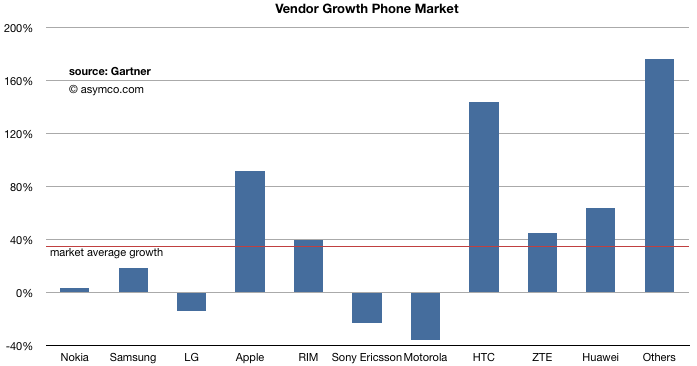
    The latest mobile phone estimates from Gartner made a startling claim that "Others" vendors increased share from 16% a year ago to 33%. Doubling share in a year is possible if you're at 1% share but to double from a base of 16% is sounding improbable. They allege that the "Others" now sell more phones than Nokia. And Others don't even include ZTE and Huawei, the prototypical low end challengers.

    They emphasize this point in their discussion and state that the incumbent vendors are being pressured by these low end entrants. They go on to explain that the same set of vendors will probably use Android to enter the smartphone space.

    To illustrate, the growth of individual companies is shown here (all phones).

    Also puzzling is that ZTE and Huawei did not share in this boom. They barely beat market growth and were growing at half of "Others". Until recently ZTE and Huawei were themselves Others, so the new vendors are truly unbranded "white box" vendors.

    To put it in perspective, their year-on-year growth is astronomical: 176%, selling 87 million more phones this third quarter than last year's. This is equivalent to saying that a new company was born in the last year and has already become the second largest in the world. The growth in volumes is higher than the total units Samsung sold!

    Mind the gap

    Extraordinary claims require extraordinary evidence. Can we check what other analysts estimated and do some form of validation of the claims?

    Yes we can.

    IDC reports the same data and they only reported 340.5 million phones sold (vs. Gartner's 417 million). Excluding ZTE and Huawei the total share for "Others" in IDC would be about 20%.

    20% share vs. 33% share is a big gap.

    IDC and Gartner both agree on smartphones, so the difference is even more glaring when you consider the "non-smart" comparisons:

    Non-smart phones:

    Total Market: millions of units sold____3Q2009______3Q2010
    Gartner268337
    IDC244260

    For added emphasis, I added a comparison of last year's quarter. Last year the Gartner total estimate was about 10% higher than IDC. This year they are 30% higher.

    How could the difference in the total phones sold be so big: 77 million phones?

    If Gartner is right, how could IDC miss 77 million phones. If IDC is right how did Gartner conjure up 77 million phones in one quarter? That number is nearly as big as all the smartphones sold (81 million). This is not within any margin of error for whatever sampling method they use.

    Perhaps they need to clarify this because until they do, neither is credible.

    --

    Note: My own models are built from individual company public reports. The only data I depend on from IDC and/or Gartner is this total market size which allows me to back out what the "Others" are doing. If the total market estimates disagree so much, I'll be forced to throw out the "Others" all together.

  9. The largest Android vendors

    Research · 8 comments

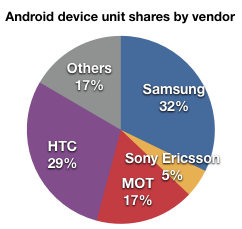
    Gartner released sell-through data for the handset market. In the release appears an estimate of total Android 3Q Smartphone sales (20.5 million). Combining this with what some of the vendors have reported in terms of units sold, we can estimate the share of Android by vendors.

    Note that this is a rough estimate. We don't have data on Sony Ericsson's smartphone units sold and we don't know the mix of HTC's Windows Mobile vs. Android.  I'm also assuming LG as part of Others. The data from Gartner is claimed to be sell-through whereas vendors report sell-in so there is more roughness about each vendor.

    Regardless of these potential sources of error, it's a very safe bet that Samsung and HTC are the largest Android vendors by a fairly large margin.

    It's perhaps noteworthy that both are also committed Windows Phone vendors. According to pdadb.net here is the count of Windows Phone SKUs by vendor:

    • HTC 12
    • LG 5
    • Samsung 2
    • Dell 2
    • Toshiba 1

    Motorola is keeping its Windows Phone options open, leaving "Others" as the only likely exclusive Android vendors.

  10. Competing with non-consumption: Can Apple sell 100M iPhones next year?

    Research · 30 comments

    [Wedge Partners analyst Brian Blair] also contends that Apple’s production forecasts suggest the company thinks it can sell 100 million iPhones next year. “While a staggering number any way you look at it, our checks reflect full calendar 2010 builds in the 48-50 million unit range,” he writes. “While this number can change and adjust downward or upward  based on demand, we believe it is incredibly bullish that Apple feels it is possible that they could see nearly 100% year over year growth for iPhone in 2011 as this would mean that exiting 2011, Apple would have approximately 10% share in the global handset market.”

    via Apple Can Sell 100M iPhones, 48M iPads in 2011, Analyst Says - Tech Trader Daily - Barrons.com.

    Apple is, in my estimate, likely to sell at least 47 million iPhones in calendar 2010. (16 million in the current quarter, or 85% y/y growth).

    The 100 million in 2011 estimate assumes 100% growth on average. Is it really "staggering" to forecast another year of triple digit growth?

    The history of growth is one indicator. There the news is good: the product has been able to sustain that level of growth for three years.

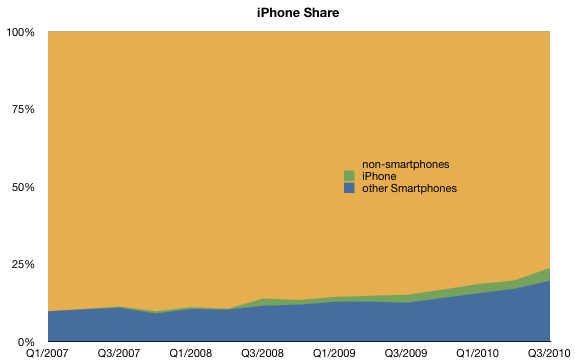
    The second indicator is room to grow. Apple largest competitor is smartphone non-consumption. This competitor holds 76% share, but is rapidly losing share. Consider the the following chart:

    I've heard the mantra that smartphones are not for everybody and that the vast bulk of consumers will opt for voice-oriented phones indefinitely, especially in low-GPD/capita countries.

    To this I point out that there are no technical obstacles to implementing smartphone technology in all price points nor that there are any constraints on distribution, network technology rollouts or shortage of capacity to produce these products for all current mobile users (5 billion at last count). I also believe that user demand for this level of product utility will shift rather more quickly than supply.

    So, in my mind, the headroom looks pretty good as well.

    Lastly there is the question of alternative platforms. I'll get to that shortly.

  11. Estimating Android market share for the third quarter

    Research · 10 comments

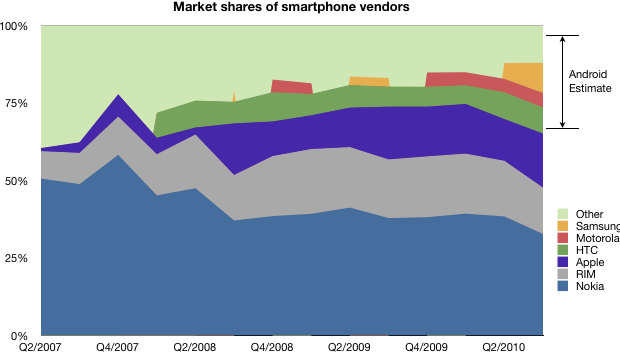
    Take a look at this chart. It combines the known shipment data with the total market size for smartphones as defined by Canalys.

    Knowing the platform/vendor make-up we can estimate the percent of the market that was Android.

    Note that the major unknown is still how much the platform hedgers (Samsung, Other) split their volumes between Android and Windows Mobile (yes, it's still being sold).

    Given this information, I would estimate Android share was around 30% globally. Canalys estimates 25%, which makes this analysis look reasonable.

    On a platform basis, Android gains were mostly at the expense of RIM, Symbian and Windows Mobile as we know that the iPhone share remained steady.

    Note that in years past the licensing vendors predominantly opted for Windows Mobile, a market that Microsoft wants to regain.