We are proud to report that we have a new record for our installed base with more than 2.5 billion active devices. -Tim Cook
2.5 billion active devices follows the announcement of 2.35 billion active devices a year ago, a growth of 150 million devices in one year. Let's examine some of the implications.
By my estimate, Apple sold about 250 million iPhones, 23 million Macs, 40 million Watches, 70 million iPads. Other devices including Apple TVs, Apple Vision Pro, Apple HomePods may add another 10 million units. Therefore the total number of "connected" devices sold is around 400 million/yr.
Adding 150 million to the active base in one year implies that 250 million devices are replacements, many surely are reused but also at least a third (37.5%) of units sold are expanding the base. This is reflected by management's occasional mention that "nearly (or, alternatively, over) half of customers who purchased a <product> being new to the product".
In the last quarter and for quite some time, <product> has been the Mac, the iPad and Apple Watch. If we use my estimates of units sold during the full year that means 17 million Macs, 20 million Watches and 35 million iPads were sold to new users. These add up to 72 non-iPhone new devices in use. That suggests about 78 million new iPhone users.
How does this compare to the following pattern:
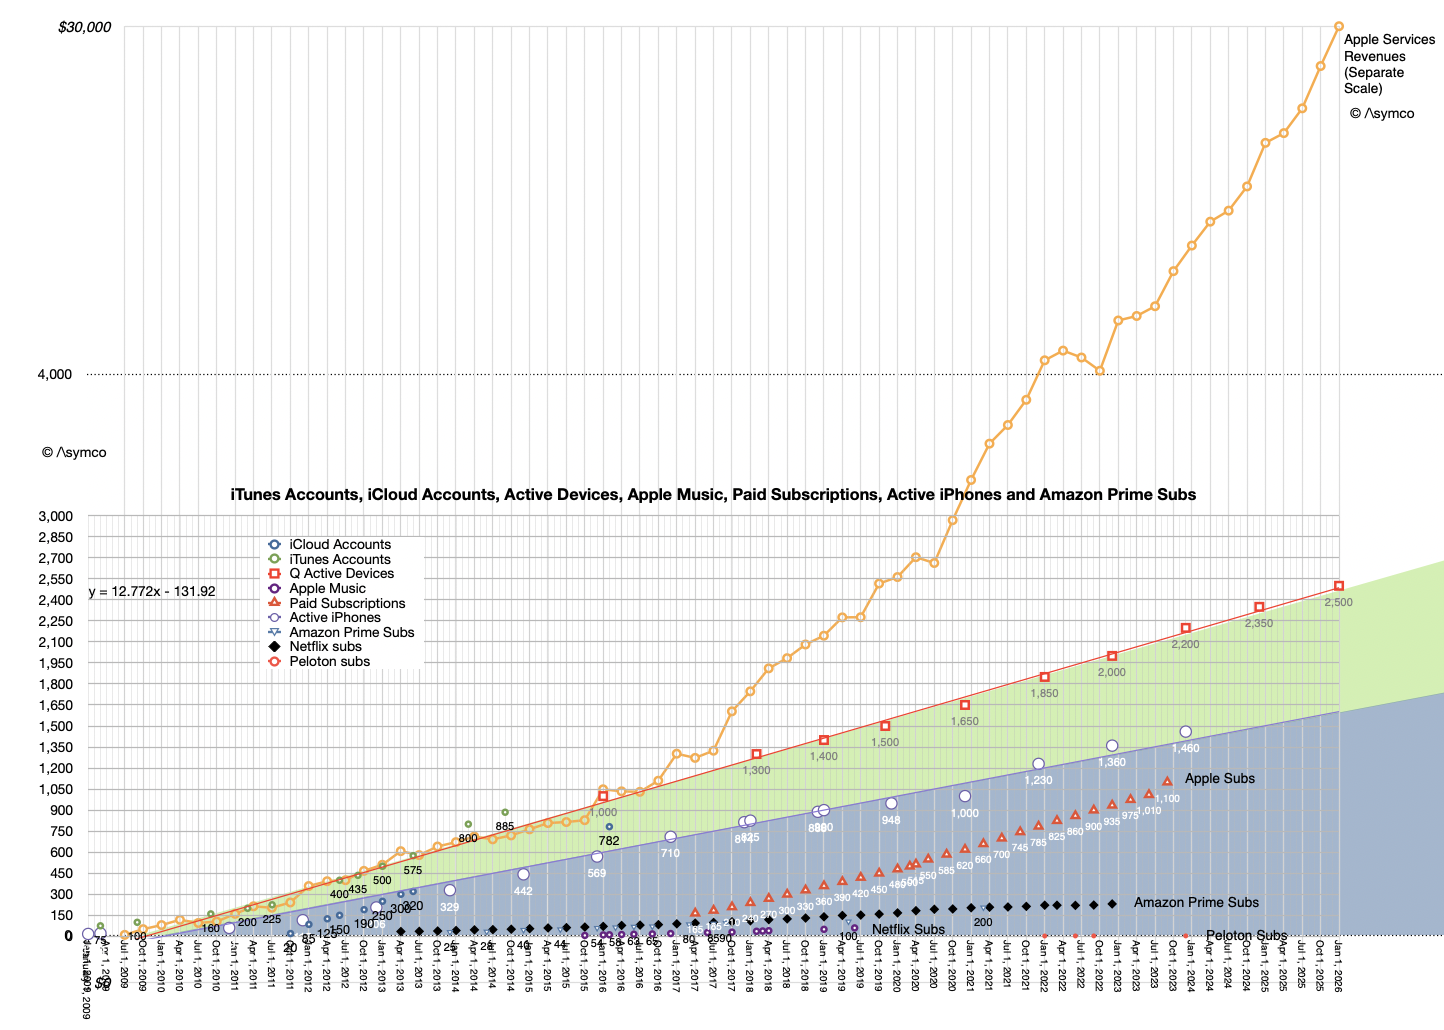
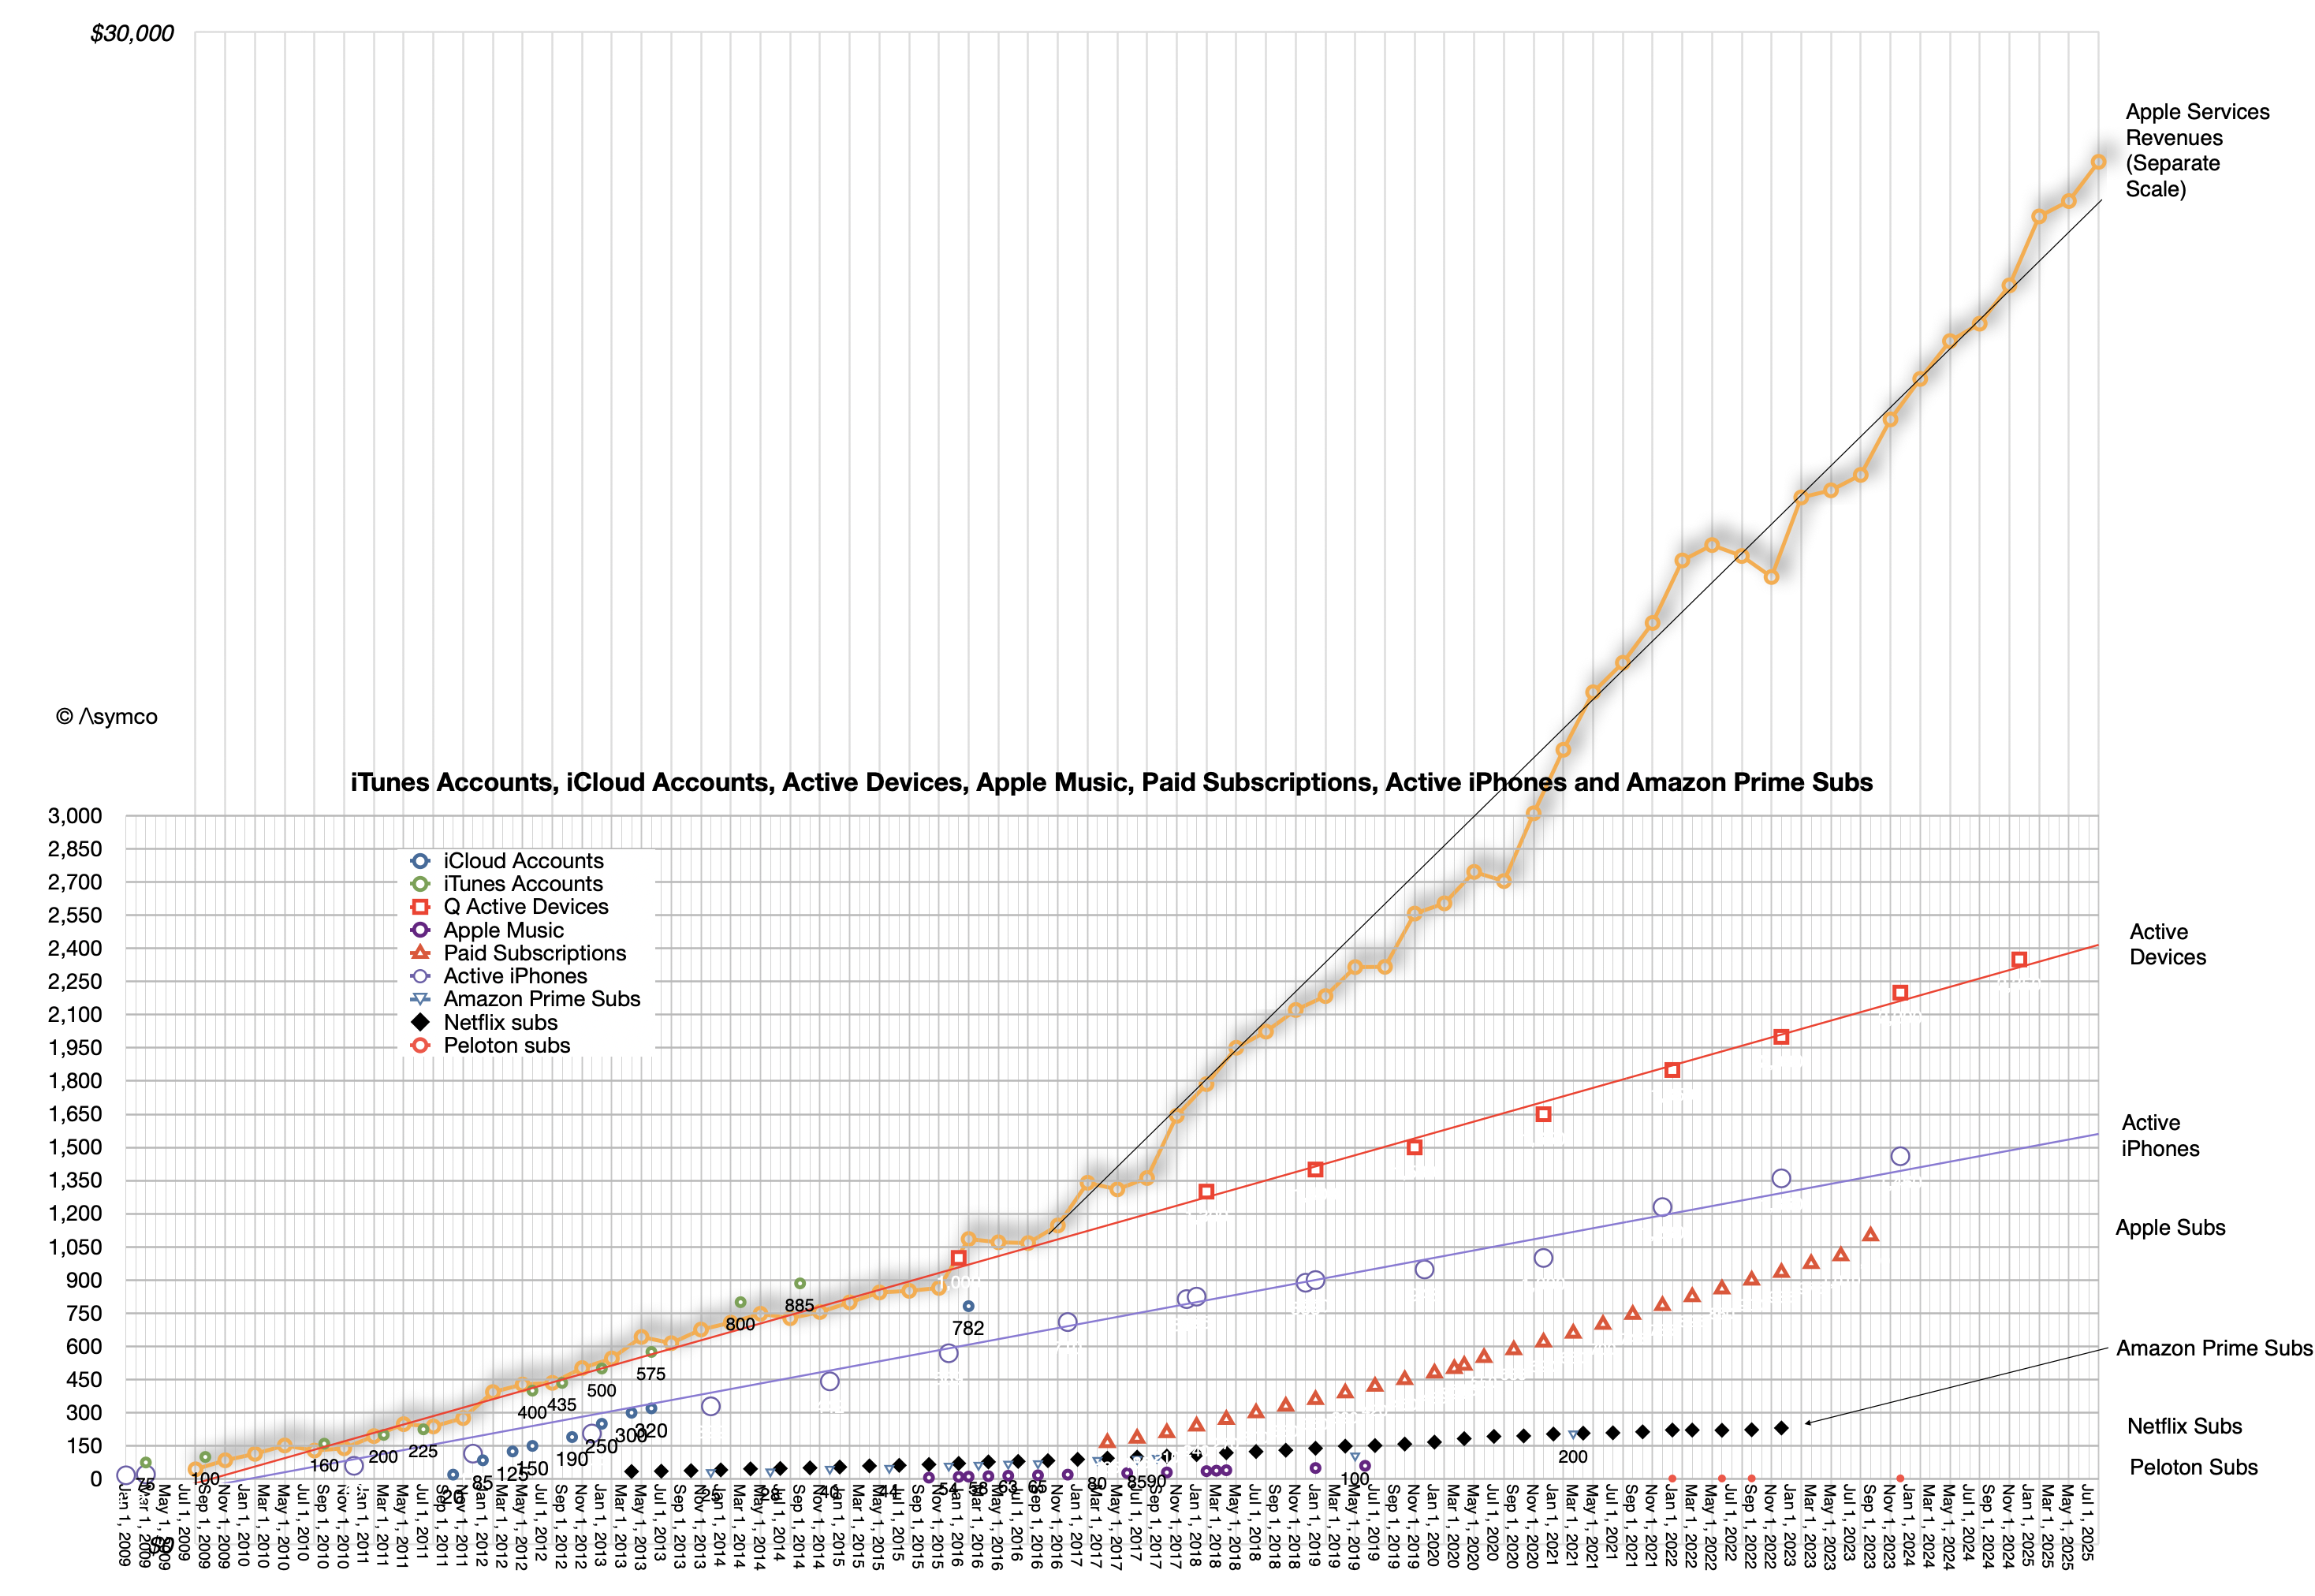
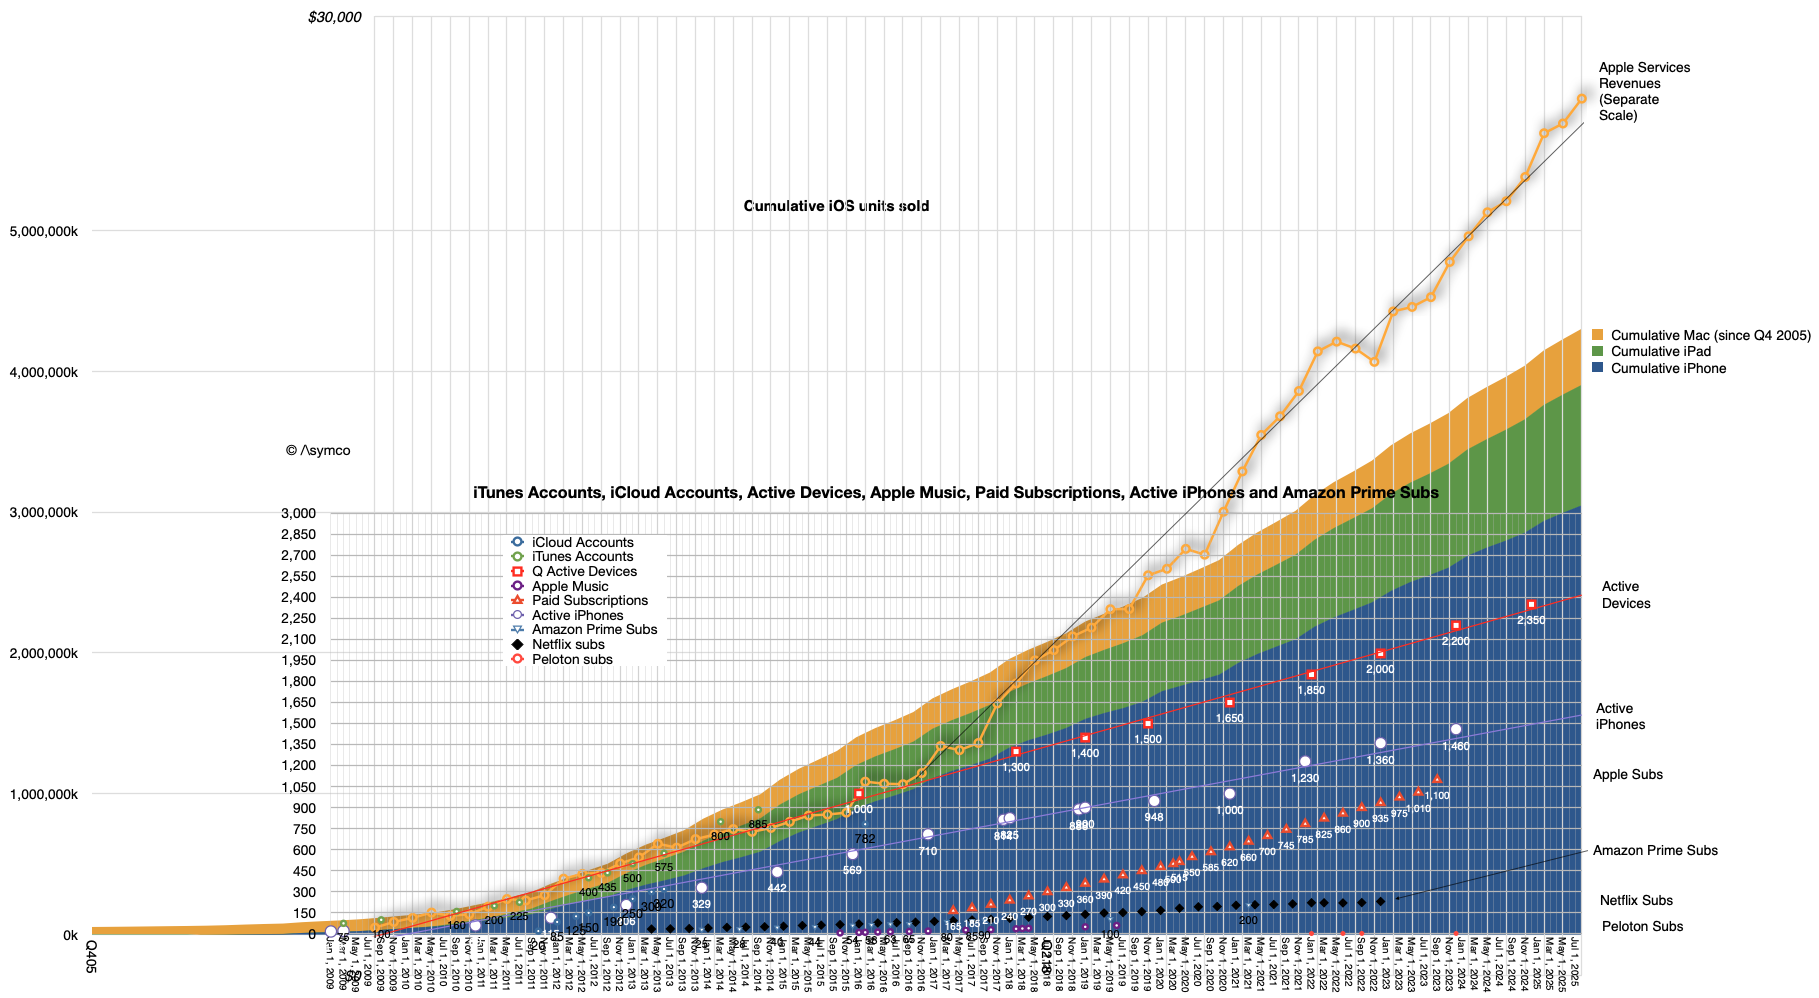
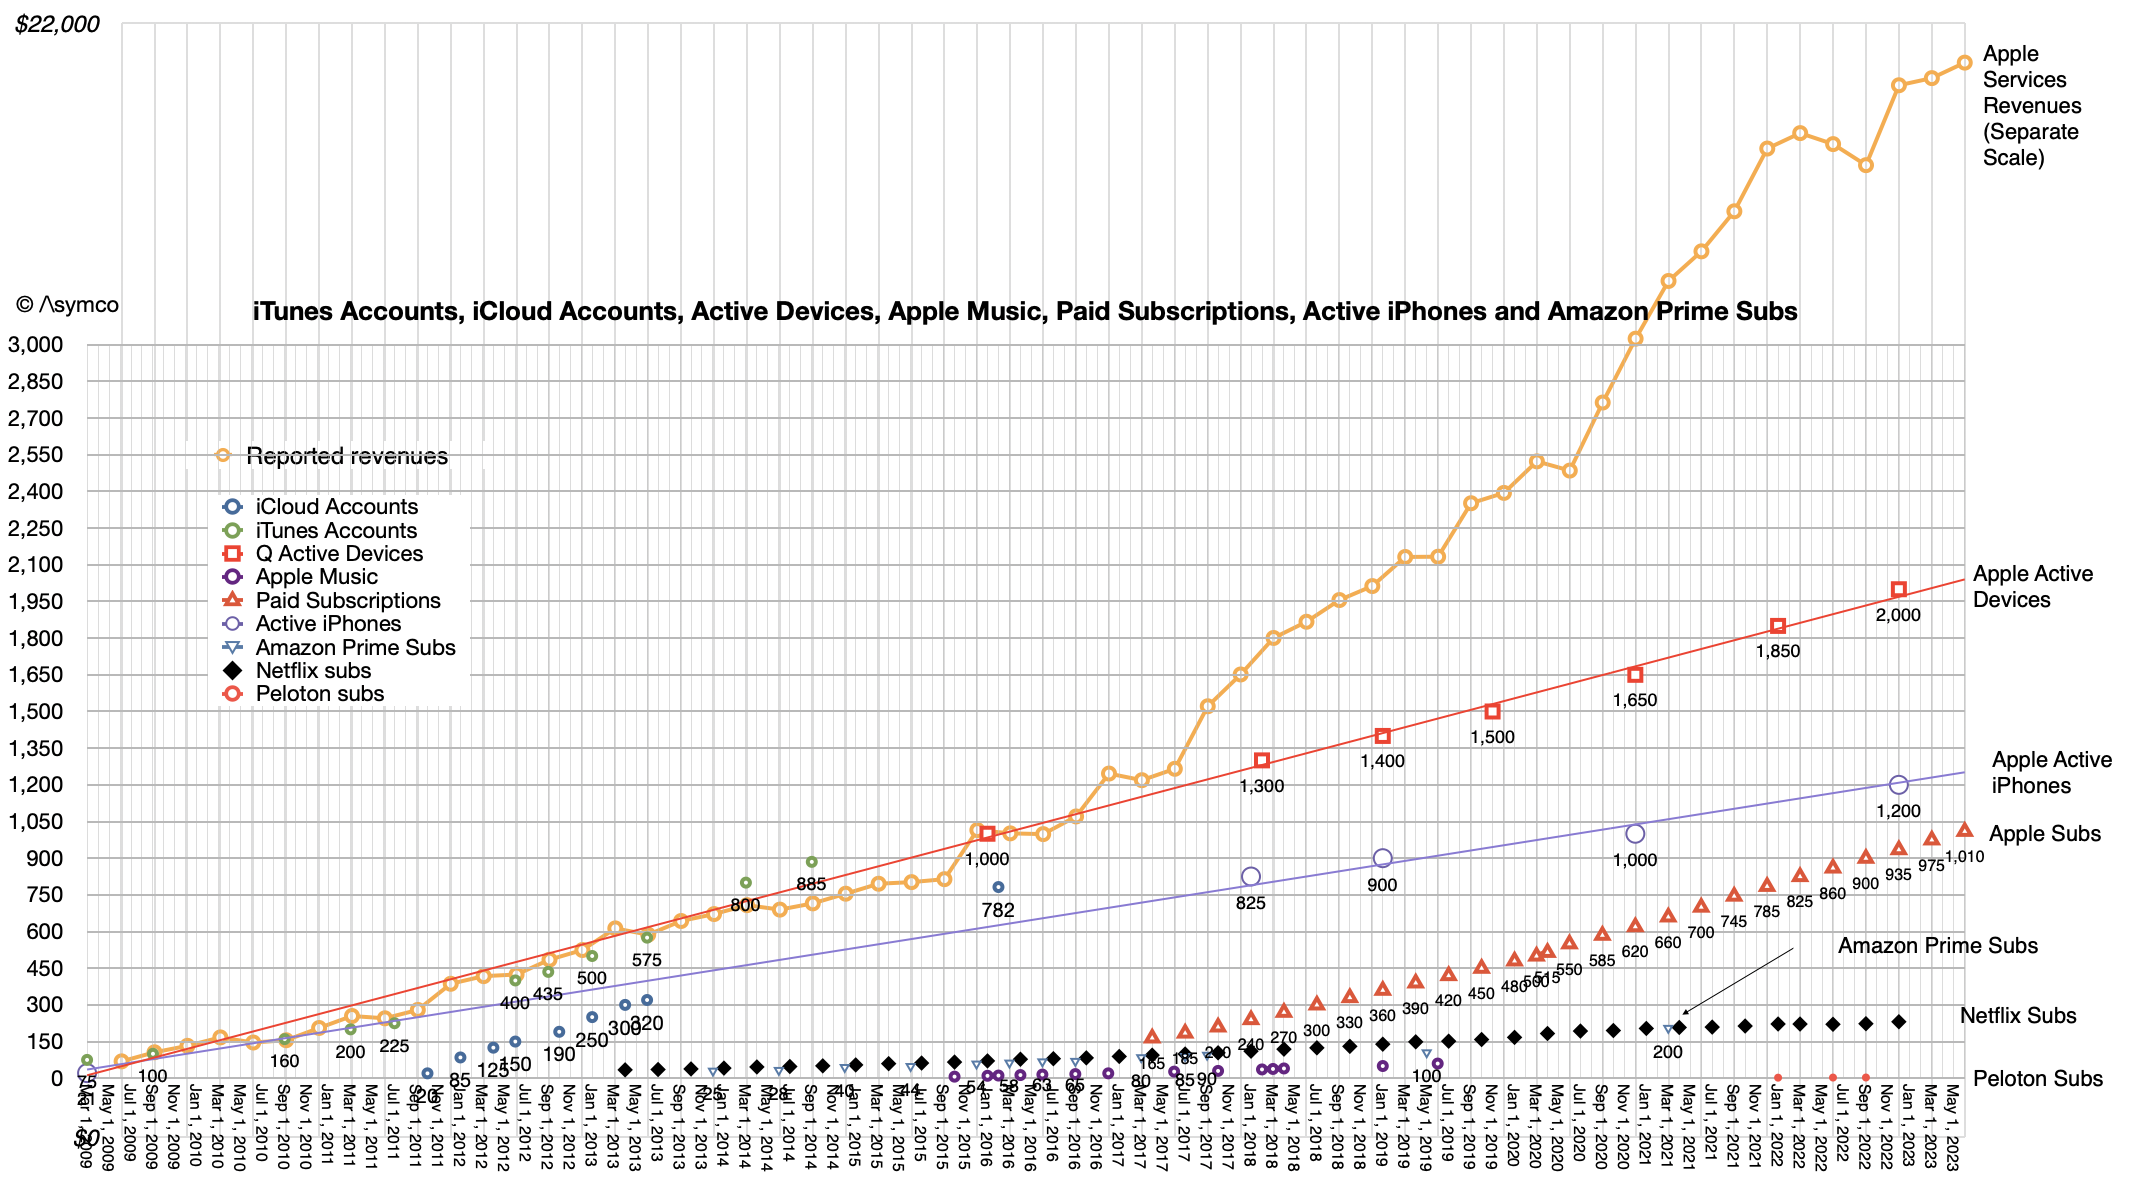
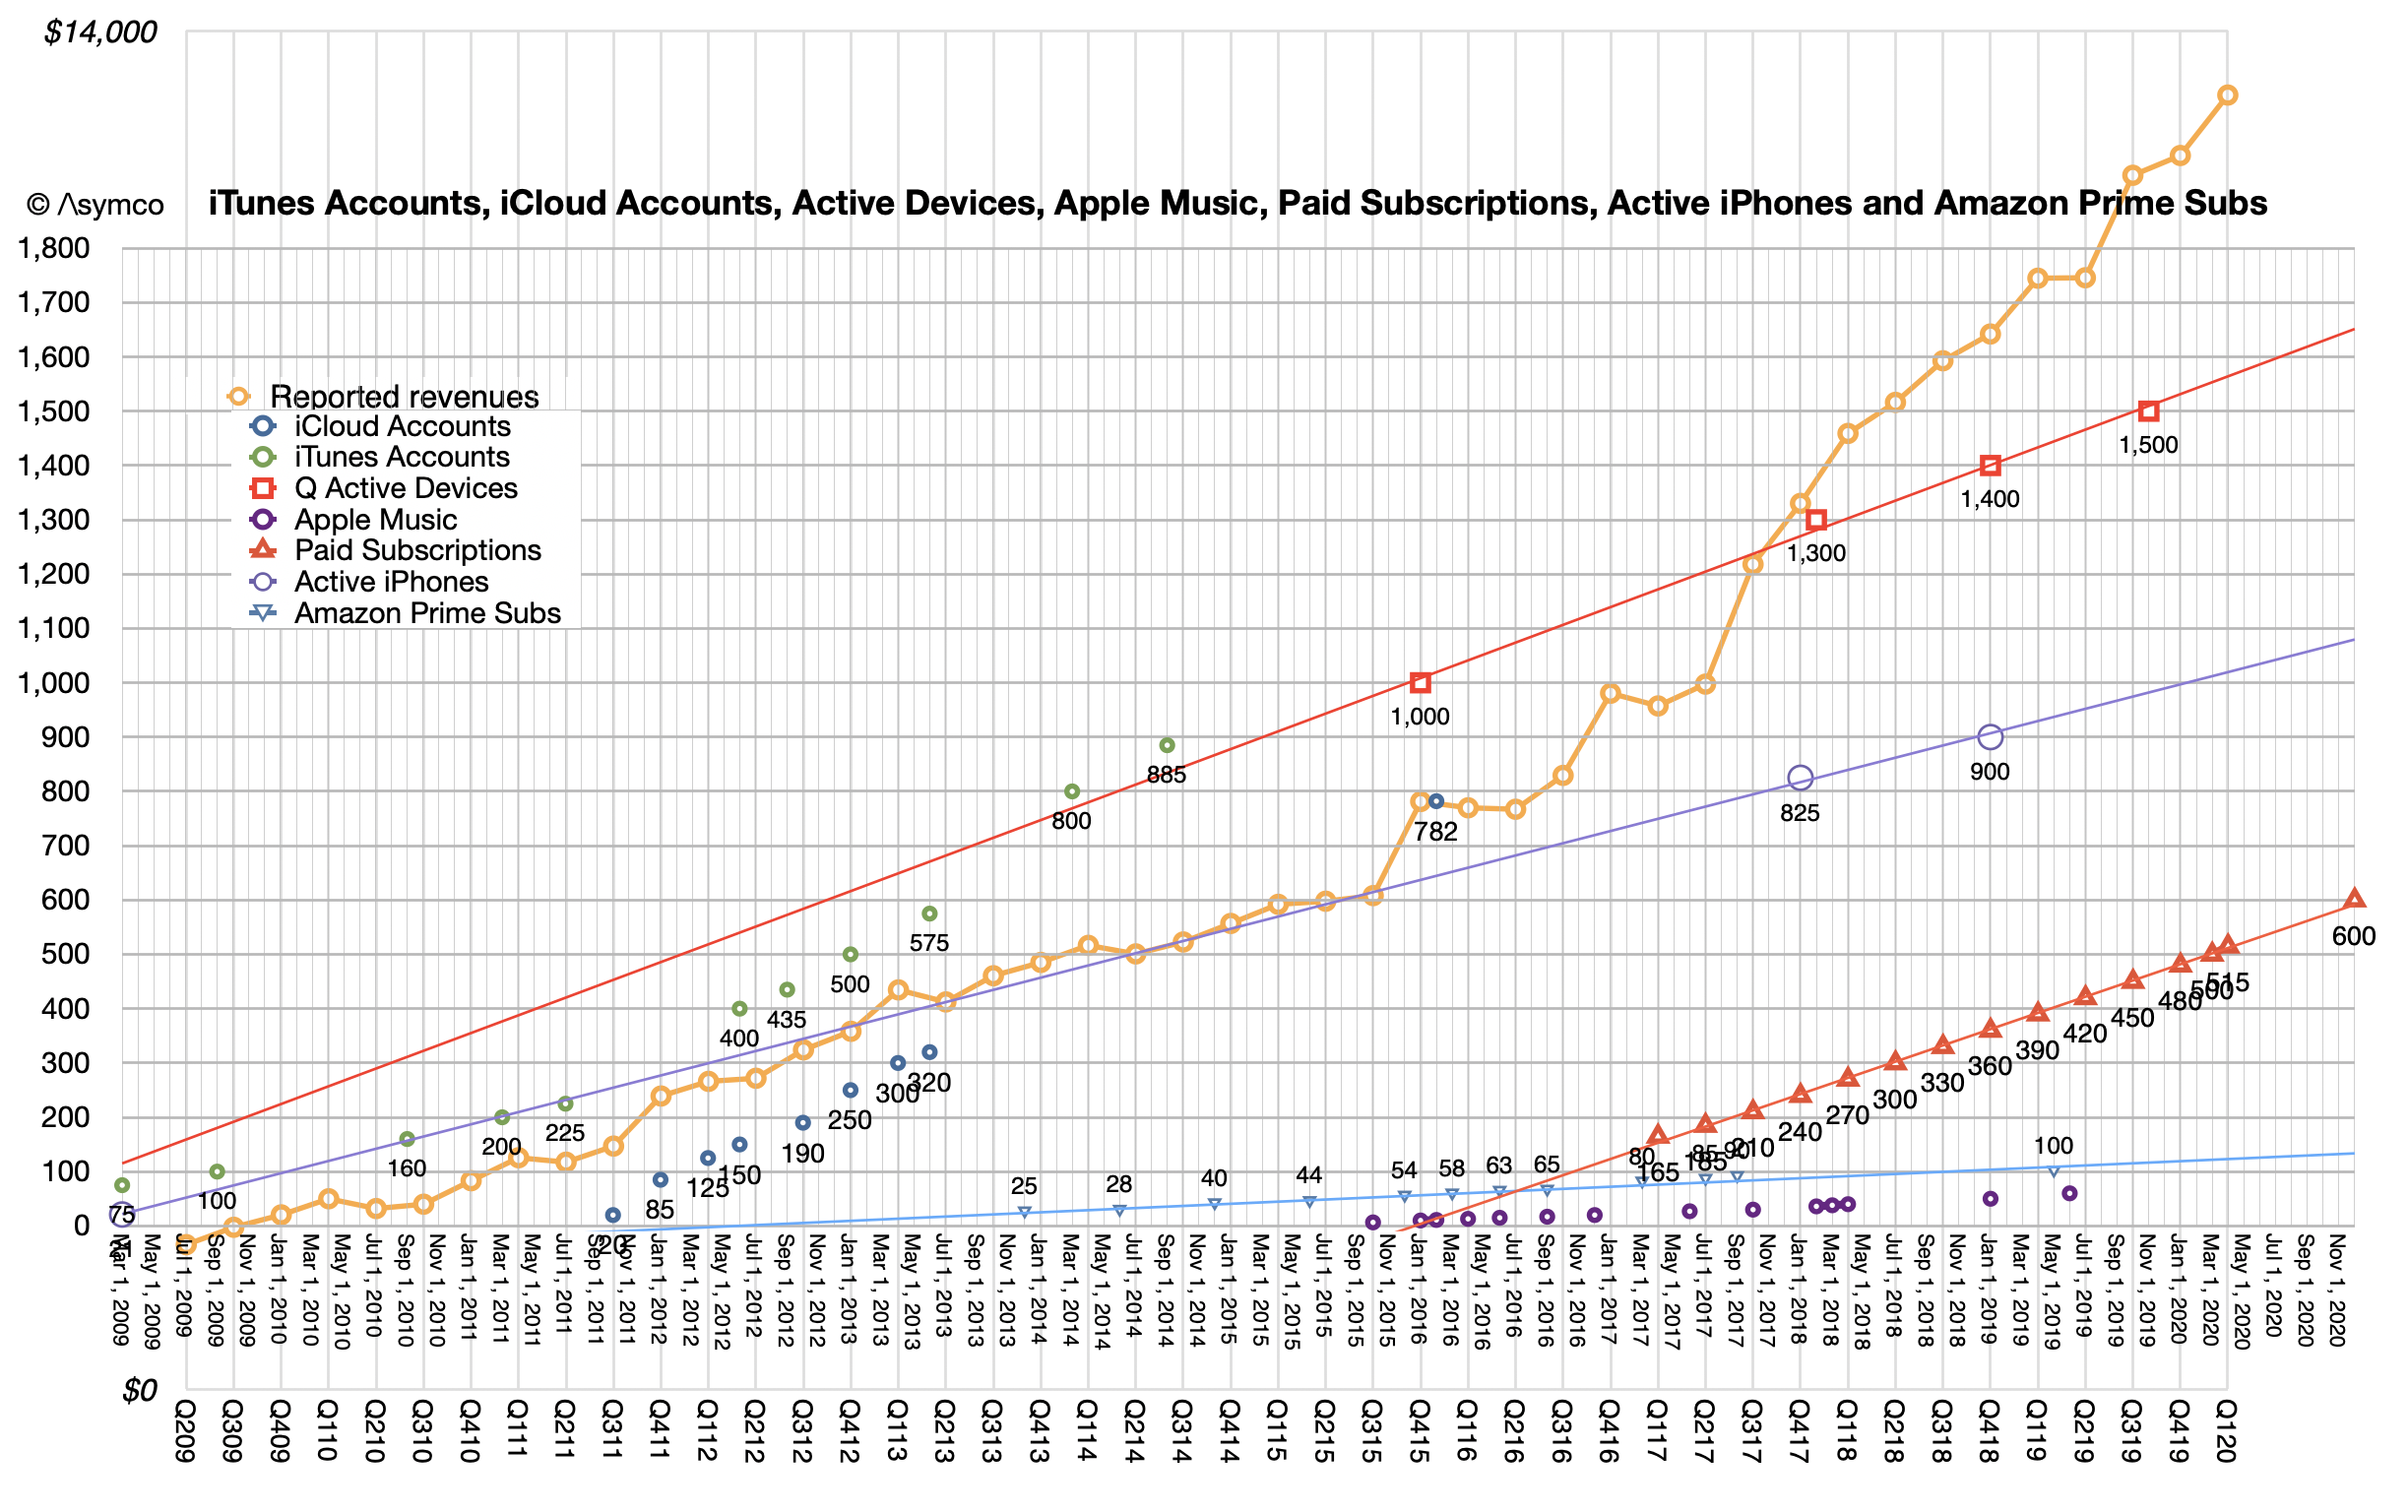
The line to focus on is the red with square points. "Q Active Devices" is the history of what Apple calls "Quarterly Active" devices or those which ping an Apple server at least once a quarter. The data appears to be linear, or the growth is about 150 million per year at least since 2016. Historic data on the iPhone is also shown with a blue line. That is also consistent with about 100 million new iPhones in use every year. This is a bit higher than the 78 million bottom-up analysis of new users. I'd argue that Watch numbers may be a bit too high and perhaps iPad as well.
The mix is a matter of debate but overall this consistency allows for some confident forecasting.
The iPhone will reach 1.7 billion active users by this time next year.
There will be three billion active devices by early 2029.
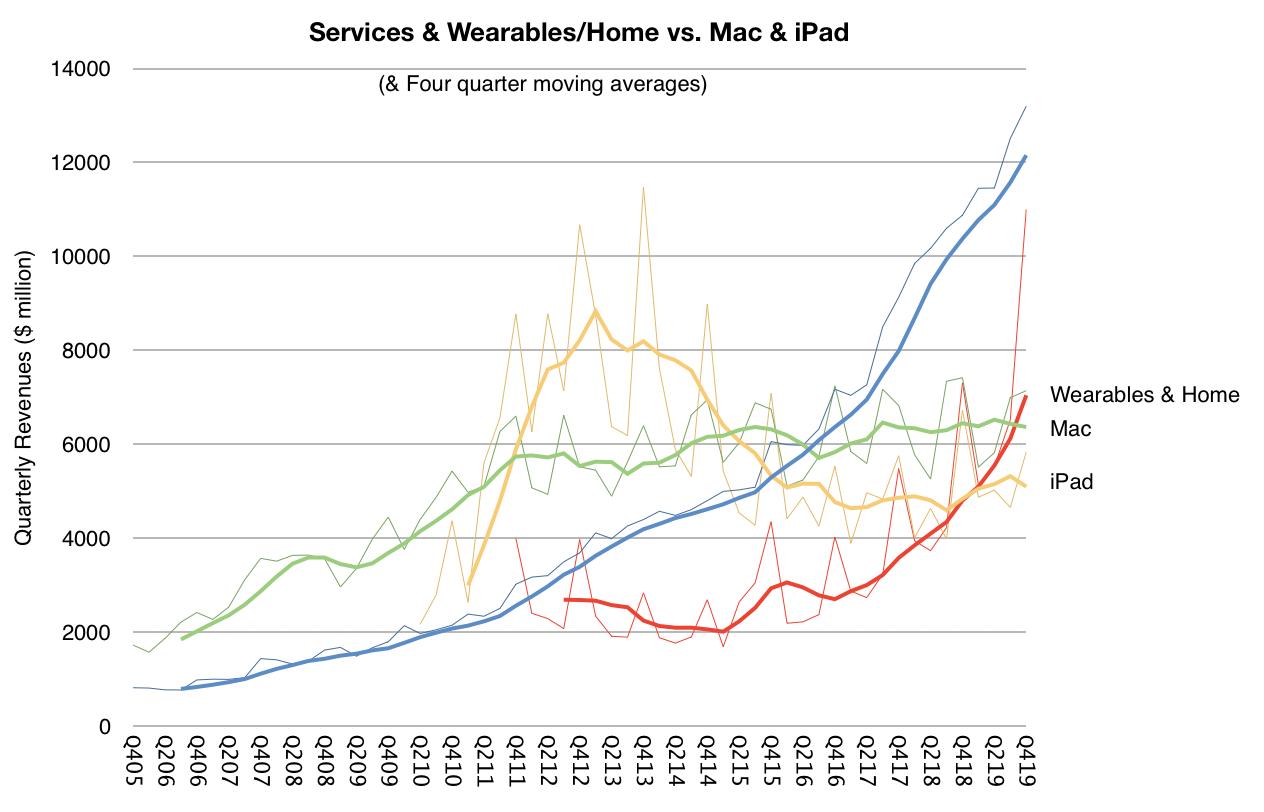
Services, which is shown in the second graph is clearly correlated to active device growth.
The consistency in active device growth is far more important than device sales in a particular period and determines the value of the company.
Knowing this, here are some additional observations:
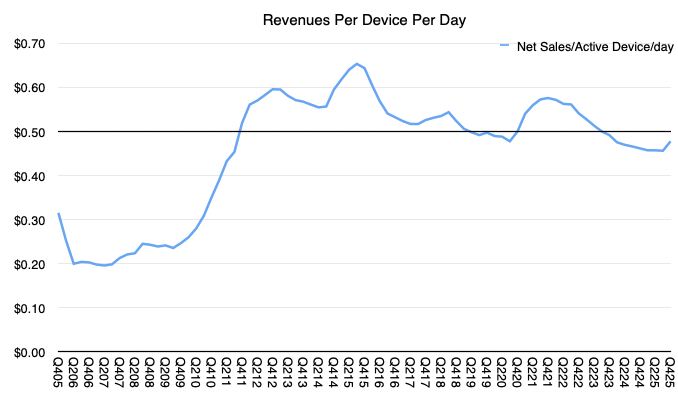
Yearly revenues per active device are $129, services revenues per active device are $45 for a total revenue per active device at $174/device/yr. That is equivalent to 48c/device/day. Data shows that daily revenues have been an average of 53c/device/day for 59 quarters. My rule of thumb is 50c/day per active device is a good estimate for Apple's revenues, and estimate that I have been holding for over 14 years.
There are additional implications. With a base of 1.65 billion iPhones, and knowledge of replacement vs. new-to-product/switcher growth what is their average lifespan and thus replacement rate and therefore what is the average selling price?
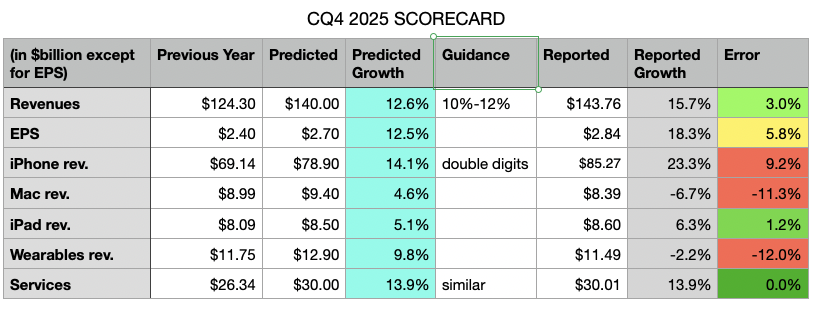
My predicted growth is in the light blue column, the reported growth is in the grey column and my errors are in the last column. Also included is the guidance from the previous quarter's conference call.
The table shows my errors were primarily in underestimating iPhone, while over-estimating Mac and Wearables. The errors mostly cancelled each other out on the top line (off by 3 percentage points) but, due to an underestimation of the gross margin led to a bottom line error of 5.8 percentage points.
The Mac overestimation was based on not paying enough attention to the comparable from the year earlier. I was warned: "On Mac, keep in mind, we expect to face a very difficult compare against the M4 MacBook Pro, Mac Mini and iMac launches in the year ago quarter". Wearables are similarly underperforming due to lack of new product launches.
But the iPhone underestimation is simply because the new products are a massive hit. Nobody predicted this level of performance. Indeed Apple was caught by surprise and has been unable to meet demand. They are still going to be below supply/demand balance going well into the first quarter of 2026.
Finally, an error on the margin came from Apple's continuing over-performance on supply chain management.
Apple is providing the following guidance [my emphasis]:
We expect our March total company revenue to grow by 13% to 16% year over year, which comprehends our best estimates of constrained iPhone supply during the quarter.
We expect services revenue to grow at a year-over-year rate similar to what we reported in December. We expect gross margin to be between 48-49%. We expect operating expenses to be between $18.4 billion and $18.7 billion, which is at a similar level to what we reported in December and driven by higher R&D on a year-over-year basis. We expect OI&E to be around $100 million, excluding any potential impact from the mark-to-market of minority investments, and our tax rate to be around 17.5%.
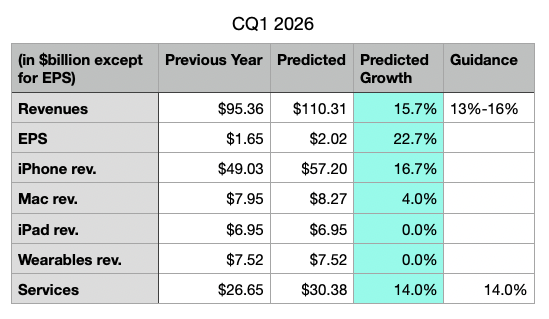
Based on provided guidance, I'm making the following predictions for the next quarter:
It's vey important to note that Apple is guiding gross margin to be between 48-49%, a record high and something that we will discuss in the next post. This results in a 22% to 23% EPS growth rate!
Note also that Apple guided revenue growth between 10% and 12% and delivered 12.6%. They guided grass margins between 47% and 48% and delivered 48.2%. It's highly probable that their top-of-the-range guidance will also be exceeded slightly and that my current estimates are therefore modest. [NB: the guidance is being put forward at the end of the first month of the quarter therefore the company already has booked one third of the quarter and has very clear visibility into the next third.]
In the latest, (Fiscal Q3, Calendar Q2 2025) conference call, Tim Cook made a welcome announcement: "We also recently marked a significant milestone. We shipped the 3 billionth iPhone since its launch in 2007."
This was welcome because the company has not been providing iPhone unit shipment numbers since Q4 2018. What it has meant is that the number of iPhones sold and their average selling price had to be estimated. Active iPhones were occasionally provided but quite rarely.
With this update, the veil has been party lifted. I, as well as you I'm sure, rushed to assess how well we have been estimating the iPhone economy over the last seven years. Prior to Tim's data dump, my own estimate for total iPhone shipments was 3.104 billion, including the last quarter. [Keep in mind that the 3 billionth iPhone may have shipped in the beginning of the quarter which amounts to more than 50 million units prior to announcement so my error of 104 million is minus perhaps 50 million.]
In the worst case, my error amounts to about 3.4% over the entire lifespan and perhaps 5% over the estimate period. That is perhaps not criminal since, after all, what's 100 million iPhones between friends?
I adjusted the estimated average selling price to reflect this error and shaved essentially one quarter's worth of shipments from the data set. In other words, my estimate would have been that 3 billion was reached in March rather than June. Mea culpa.
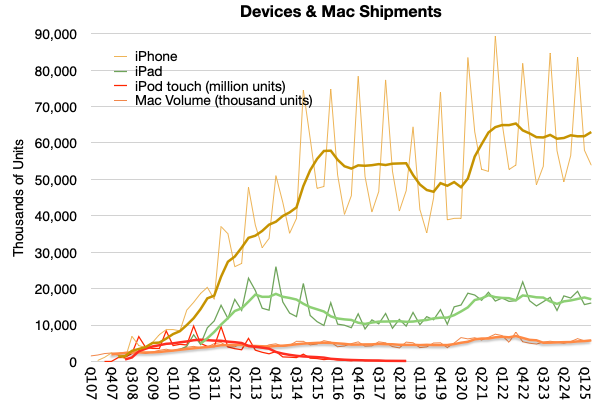
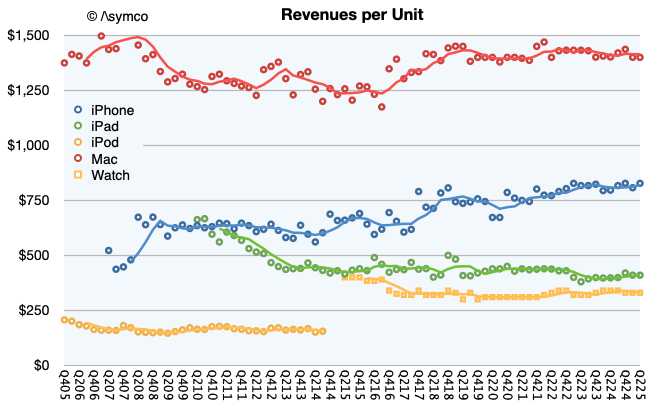
The new view into the entire iPhone shipment history is shown below. Also below is the impact of adjustment in the revenue per unit (i.e. average selling price.)
Note that I used trend lines to show the four-period (12 months) running average to remove the seasonality. Perhaps there is something to be read in the pattern. I would say that there are some notable surges as during the initial uptake, during the first "supercycle" in 2014, the surge during Covid and perhaps the "China recession" of 2018.
Clearly we are not at the highest sales levels today, as the Covid surge will take some time to grow into but at the same time the volumes are not decreasing. You can see the contrast to the iPod touch when an alternative was available, namely the iPad. The demise of the iPhone has been greatly exaggerated.
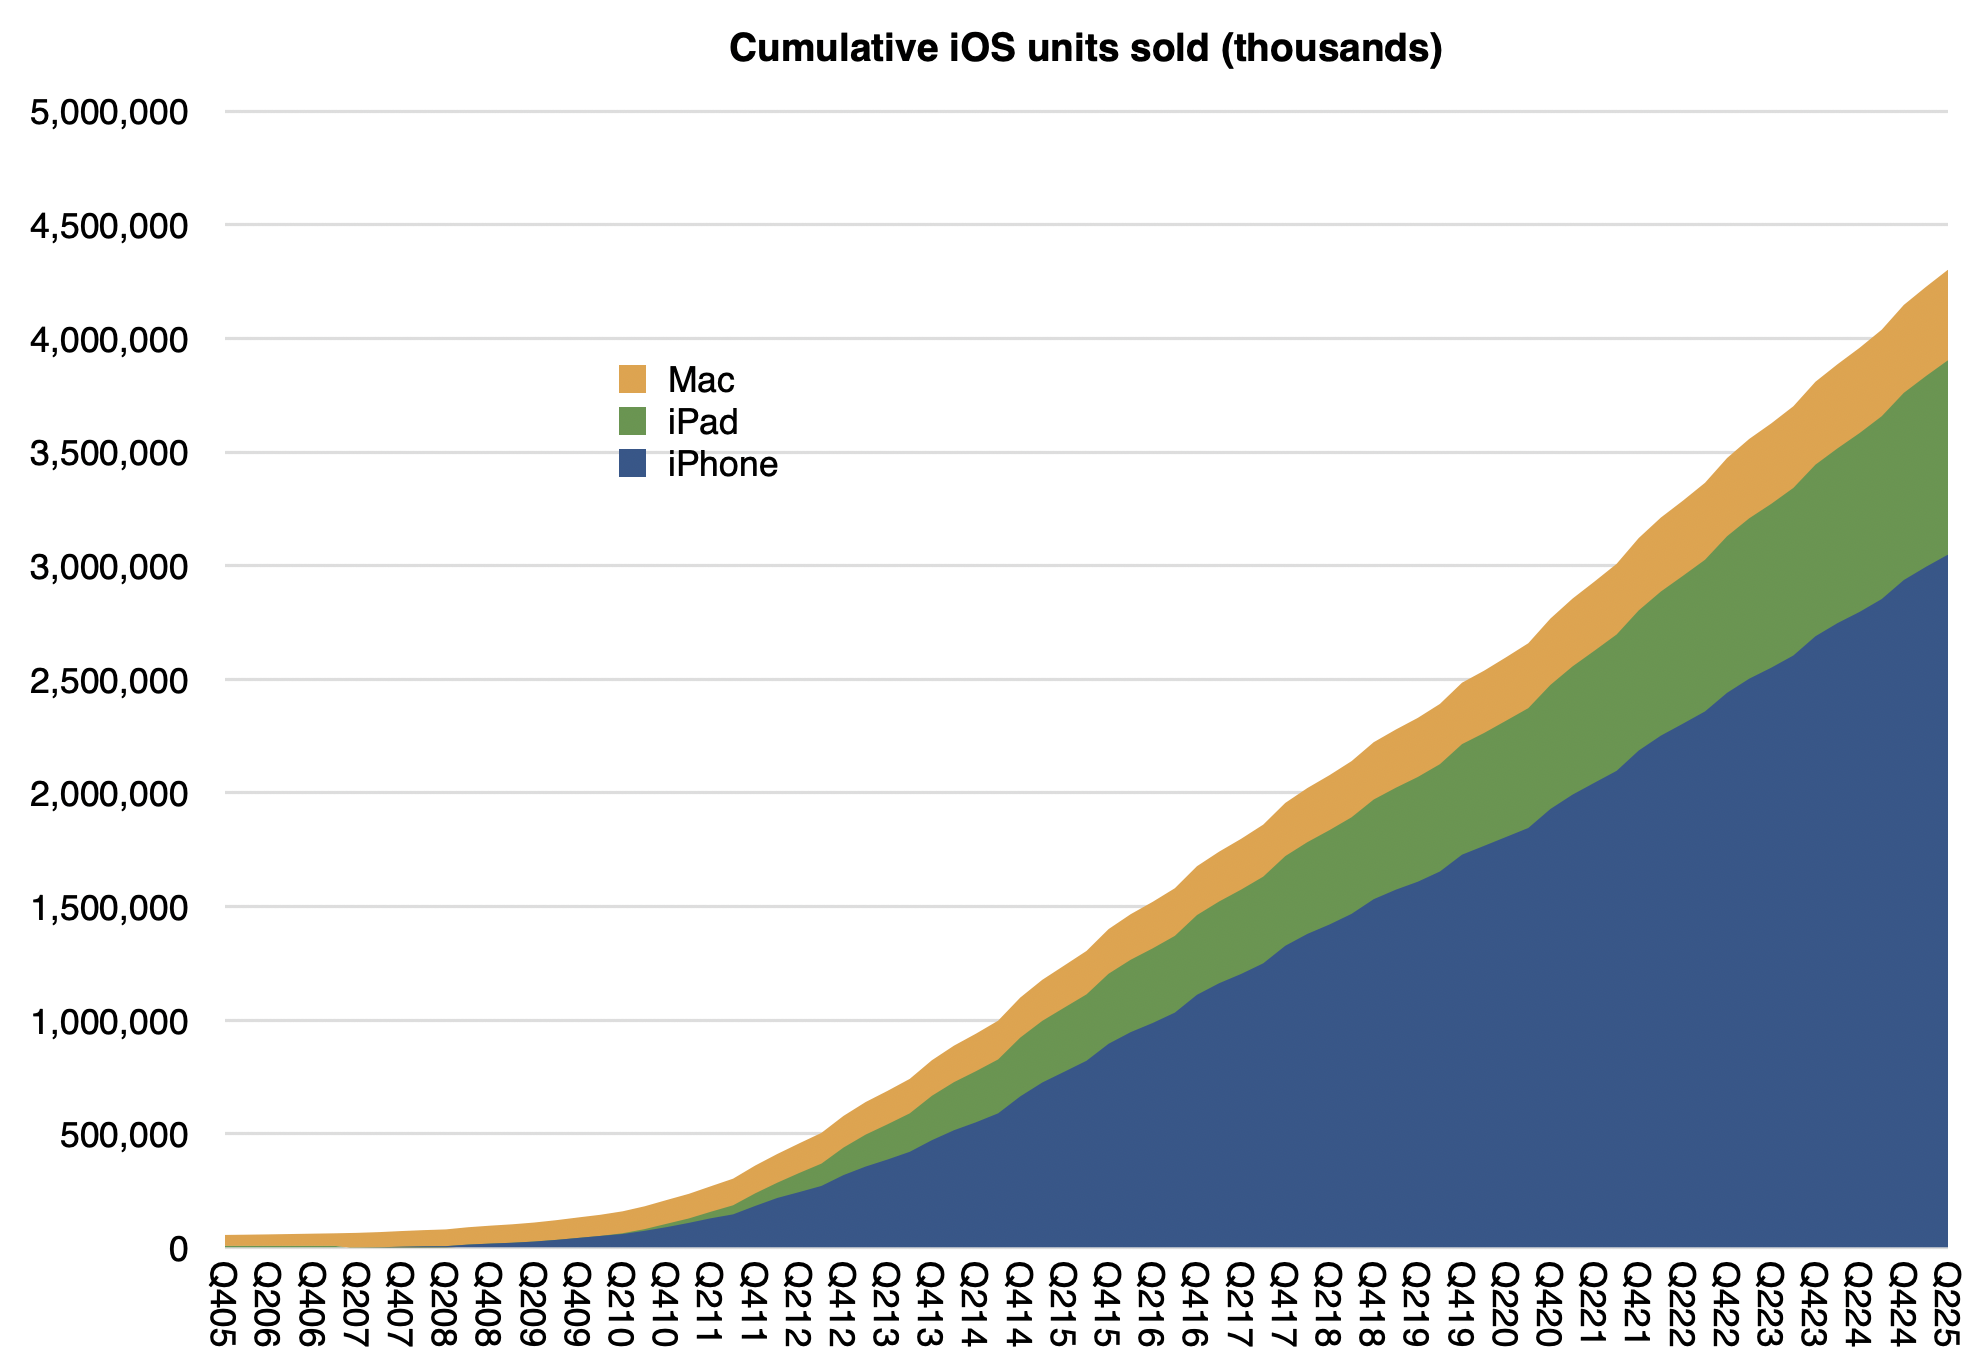
Note also that I also included the iPad, Mac and the iPod touch for comparison. You can try your hand at reading the patterns there. For the record, my cumulative Mac estimate (since Q4 2005) is 398 million[1] and the cumulative iPad is 855 million. Here are the iPhone, iPad and Mac cumulatively with a current total of about 4.3 billion:
Not shown are iPods (touch alone is about 114 million), Watches (probably at least 250 million) and Vision Pro (single digit millions) or wearables and home. If we did include those, it's a safe bet that Apple has shipped over 5 billion devices.
Interesting, but not as interesting as how many are active (in use at least once a month.) For that estimate we have another set of data:
The linear extrapolations for active devices, active iPhone and, on a separate scale, actual Apple Services revenues can be seen. Also subscriptions, as long as they were available, plus other data sets for comparison such as Amazon Prime subscriptions, Netfilx and old Apple Music and iCloud account data.
At the risk of overloading an already busy graph, it might be interesting to show cumulative devices vs. active devices:
The top of the area graph seems to be not too different than the top of the red dotted device line. What might be instructive is to calculate the ratio between these two: the active devices and the cumulative devices during the period from 2016 (when 1 billion active were reported) and the beginning of this year when the last figure was reported (2.35 billion active devices on Jan. 30 2025).
Again, excluding wearables, iPod touch, Apple TV and Apple Vision Pro we have these ratios:
Date
Ratio of Active devices to Cumulative iPhone, iPad and Mac sold
Q417
0.66
Q418
0.63
Q419
0.60
Q420
0.60
Q421
0.59
Q422
0.58
Q423
0.58
Q424
0.57
What this suggests therefore is yet another way to forecast the value of Apple as an enterprise. We already know that the prediction of active devices, revenue per device and margin is sufficient to forecast the company's earnings. These all seem to be quite linear and thus predictable. Now we can add the relationship to devices sold as yet another way to calibrate or test assumptions.
After diligently doing so, simply multiplying the results by a random number called the P/E ratio (aka "sentiment") allows you to predict the share price at any point in the future.
Have fun.
It would be interesting to consider that if, as it's been often claimed by Apple, half of Mac users and half of iPad users are new to the products, then there would be 200 million new Mac users and perhaps 400 million iPad users.
According to JP Morgan analyst Samik Chatterjee, citing Sensor Tower, Apple's App Store revenue for May 2025, increased by 4.9% month-over-month (which compares to an average sequential increase of 2.3%) and an acceleration of year-over-year revenue to 13.0% in May versus up 11.8% in April. On a year-over-year basis, the App Store downloads increased by 3.1% in May (versus +5.8% in April) according to Chatterjee.
This analysis is based on app download sampling and may be indicative of the activities of consumers on the App Store. Services revenue in the first calendar quarter was $26.6 billion, up 12% year-over-year and at an all-time revenue record. Services gross margin was 75.7%, up 70 basis points sequentially, also an all-time record.
The world however seems to be having a problem with Apple Services. After years of skepticism of its relevance, now that it has achieved a run level above $100 billion/yr., it's being criticized for being harmful to competition.
The comments that it's unfair to developers or that it deters innovation are uninformed to say the least. What is missing from that analysis is that the App Store is only a small fraction of the entire ecosystem around Apple's platforms and that the economic activity the platforms enable is immense.
Let's learn.
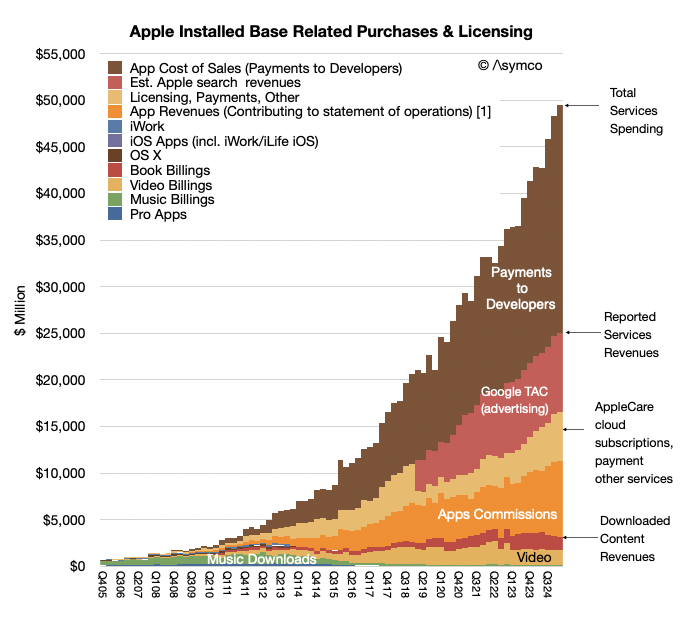
Over the last year Apple reported a bit more than $102 billion in revenues for Services at a very high margin. The reason it was such a high margin was partly due to the fact the Services does book all payments from customers through the App store as revenues. In other words it does not include payments to developers as either revenue or costs. Those payments pass through but they are certainly part of the economic activity on the store. It would be indeed unusual for a physical store not to report what it pays for what it sells as part of revenues. But this is the basis Apple chose (or was obligated to choose) as the way to report App Store revenues.
Thus considering the payments to developers, the economic activity directly related to the App Store amounts to $120 billion/yr which includes commissions of about $30 billion/yr (last 12 months) and payments to developers of about $90 billion/yr (implying about 25% blended average commission rate.)
So including payments to developers the Services business grosses $186 billion/yr. of which 102 billion is reported as revenue, with the 75% gross margin and $90 billion is paid to developers "off the books".
But that $102 billion in revenues is only about 30% App Store commissions. The rest includes many types of income: It includes:
Advertising which consists of Apple's own advertising services and third-party licensing arrangements notably the distribution fees for Google search (accounting for most of Googles "TAC" or traffic acquisition costs.
AppleCare, Apple's own extended warranty service.
Cloud Services which provide content synchronization.
Digital Content which not only includes the App Store but also stores for books, music, video, games and podcasts. Apple also offers digital content through subscription-based services, frequently bundled, including Apple Arcade, essentially a game subscription service; Apple Fitness, a personalized fitness service; Apple Music, which offers music streaming and on-demand radio stations; Apple News, a subscription news and magazine service; and Apple TV, which offers exclusive original content produced by Apple and live sports access licensed sometimes exclusively by Apple.
Payment Services which offers Apple Card, a co-branded credit card, and Apple Pay, a cashless payment service.
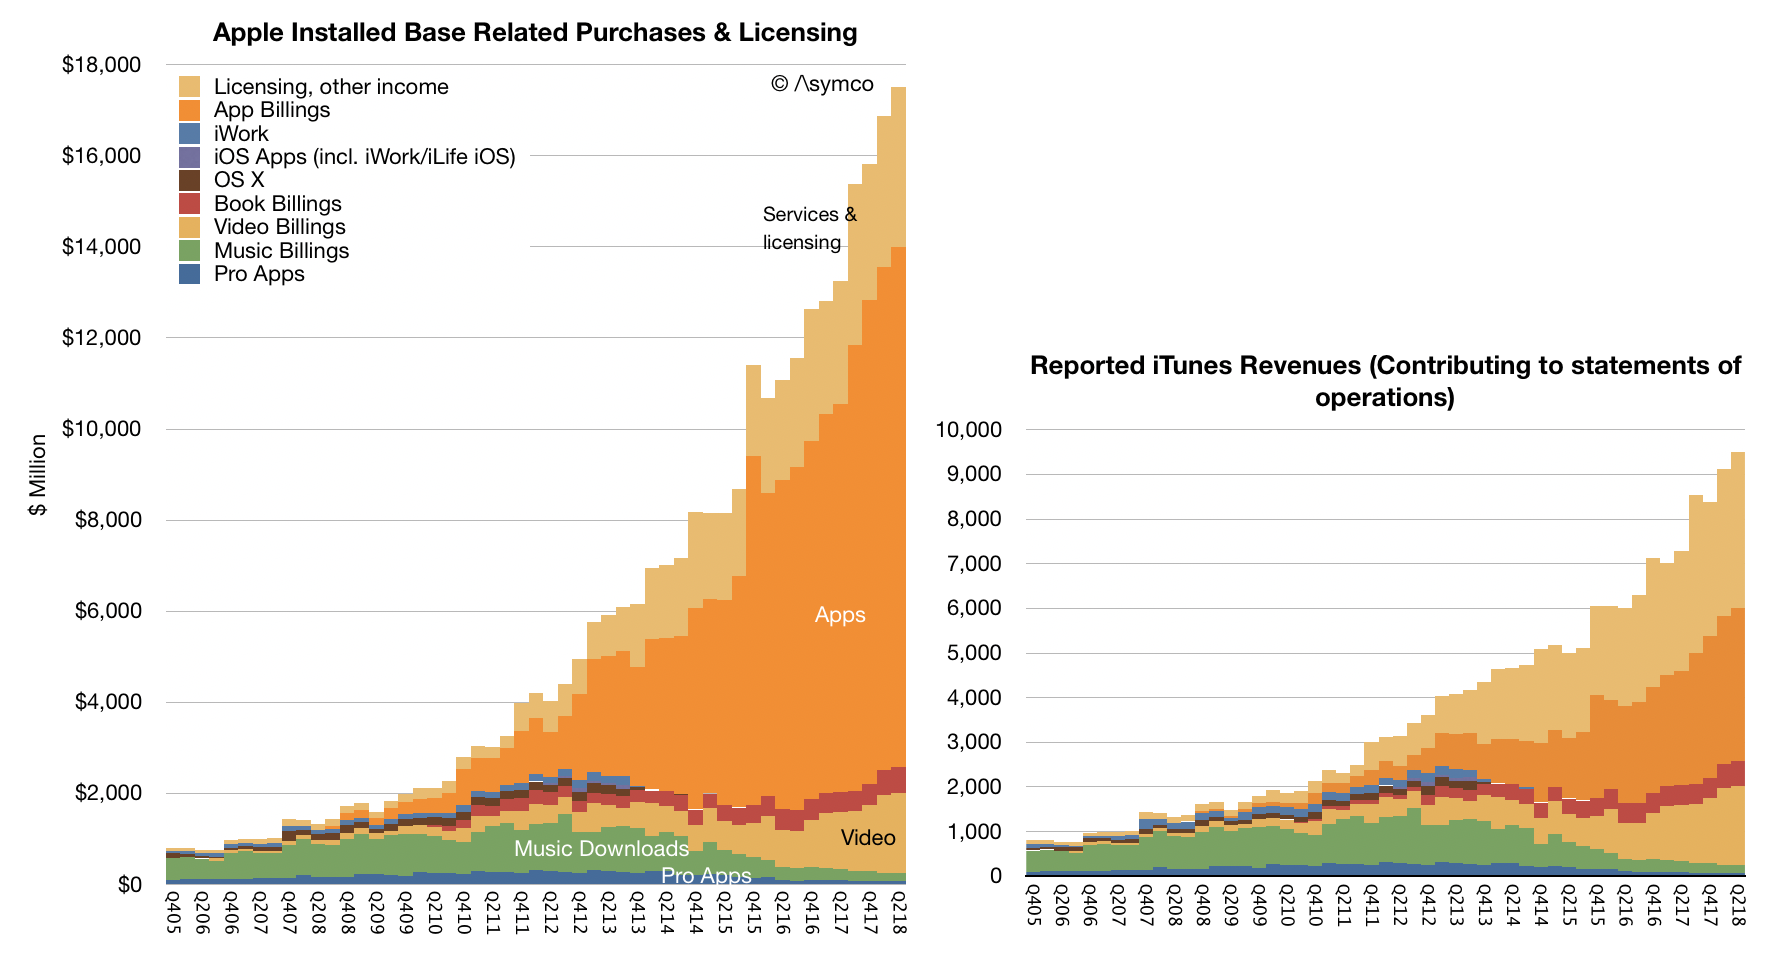
The quarterly view is summarized in the graph above. So a fixation on the commission is only a view into 16% of Services as an economic foundation (the orange area in the graph above).
But that's still only a sliver of the whole picture.
A report written by Jessica Burley, Analysis Group and Professor Andrey Fradkin, Boston University Questrom School of Business has estimated that the global App Store ecosystem facilitated $1.3 trillion in developer billings and sales in 2024. As the report writers say: "For more than 90% of the billings and sales facilitated by the App Store ecosystem, developers did not pay any commission to Apple."
How is this not visible? The reason is that this economic activity is distributed over the millions of purchases Apple users make through its iOS Apps every day. This includes traditional App Store "Billings" including paid downloads and in-app purchases, including subscriptions, that use Apple’s in-app purchase system and “Sales” which includes money spent by customers purchasing goods and services in general using any iOS and iPad OS apps. Apps developed by Apple such as Apple Music, Safari or browser apps such as Chrome are excluded from this analysis.
The economic activity unleashed by the App Store now reaches well over $1.3 trillion/yr. As the authors further explain,
While the present analysis captures the major app monetization strategies available to developers, the full economic impact of the App Store ecosystem extends beyond the estimates provided in this report, as the current methodology does not capture all of the ways in which the App Store ecosystem facilitates sales, or all of the benefits created by apps. For example, the App Store supports “companion apps” that raise the value of a company’s goods and services, including smart home apps and health apps. In addition, many apps now use different monetization strategies. As such, this analysis does not account for all the ways in which the App Store ecosystem creates value.
Furthermore the report breaks down the categories as Digital Goods and Services, Physical Goods and Services, M-Commerce (General Retail, Travel, Food Delivery and Pickup, Grocery, Ride Hailing), Digital Payment and In-App Advertising.
In addition the report estimates these categories from 2019 as well as 2024 providing a growth perspective: Over the past five years, the App Store ecosystem has more than doubled in size, increasing from $514 billion in 2019 to nearly $1.3 trillion in 2024.
It also identifies regional dynamics between the US, China, Europe (with select countries) and Rest of World (with select Asian countries).
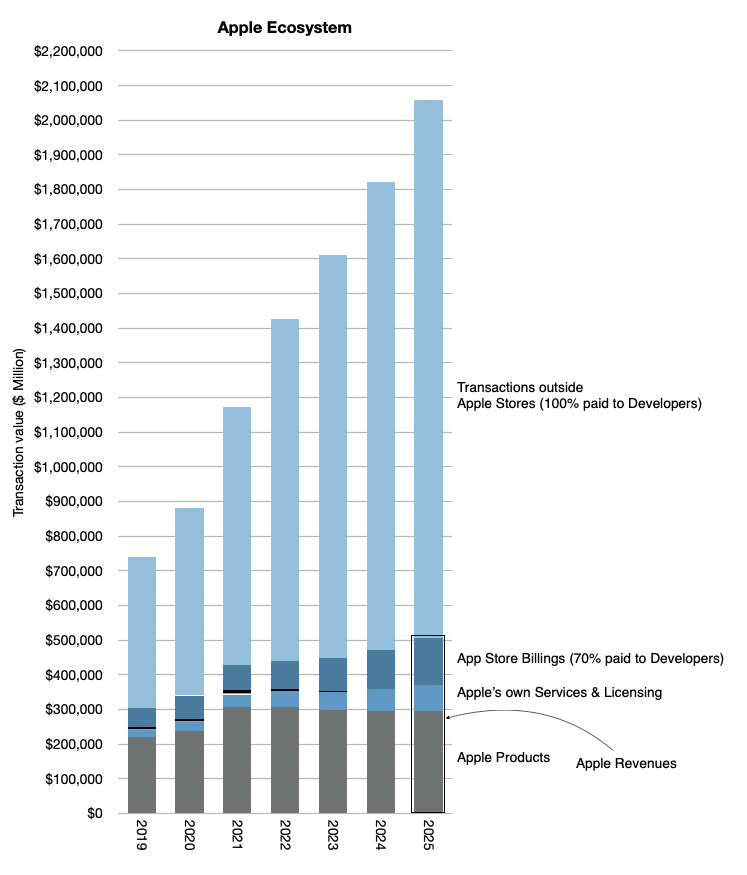
I've been keeping my own analysis of what I called the Apple Economy and it includes these transactions outside the App Store and Apple's own products and services. If I were to subtract Apple's own revenues from the total, for 2024 I was getting about 1.4 trillion (out of a total of over 1.8 trillion).
My point was always to estimate the economic impact of Apple beyond its own sales. This gave us perspective to assume that in 2025 the total would reach over $2 trillion. The graph below gives the perspective which also implies a doubling since 2020 to 2024.
The new report from Burley and Fradkin is a detailed, bottom-up analysis which quantifies what was perceived as the economic value of Apple being far more than what the financial data records.
Bill Gates once stated in reference to Zuckerberg's assertion that Meta was developing a "platform" that it's not a platform unless the economic value of everybody that uses it exceeds the value of the company that creates it.
Apple captures about $30 billion as sales but delivers over $1.3 trillion in sales, a multiple of 43! I would call that generous. In addition it doubles the market in 4 to 5 years. I'd call that market expanding not constraining. Finally, it's a market that Apple created out of nothing. I'd call that market creation not destruction.
If judged on the question of creation and satisfaction of the customer, i.e. the ultimate purpose of the firm, the App Store and Services in general has satisfied 1.4 billion people. That they are spending over $1.3 trillion and doubling in 4 years is nothing short of astonishing.
We'll discuss this topic and other topics related to Apple at ACTIVE: The Apple Investor Conference, which takes place on next Tuesday, June 10th, the day after the WWDC25 keynote.
In Google and Apple: The Beginning, we looked at the history of the relationship and the situation which emerged when Mobile Computing rose to such a level of ubiquity that it determined the fate of both companies. Apple today holds firmly in its grasp about 27% of all smartphone users (1.3 billion out of about 4.8 billion). That audience consists of the top quartile of users in terms of income, access to credit, consumption and loyalty. I performed a deep dive on newly available data which confirms that App Store users individually spend more than 7 times Play Store users.
Apple has over 1 billion customers but also they're the best billion.
For this reason, Google has needed to ensure that it maintains access to Apple users for its main business: search. Just like any developer looking at iOS and Android ecosystems, Google knows that Apple's customers are highly desirable, profitable and loyal. Apple had to remain a distribution partner for Google.
How to do that? Google distributors are incentivized with what Google calls TAC or traffic acquisition costs. This is how Google describes TAC in its 10Q filings:
TAC includes: ◦ Amounts paid to our distribution partners who make available our search access points and services. Our distribution partners include browser providers, mobile carriers, original equipment manufacturers, and software developers. ◦ Amounts paid to Google Network partners primarily for ads displayed on their properties.
Apple belongs to the first category, a distribution partner that is both a browser provider and OEM. These costs are part of Google's "Cost of revenues" or Cost of Sales. These are costs that are proportional to sales and are usually measured as a percent of sales. The higher the sales, the higher the costs.
So the question that has been hovering over both companies for a long time is just how much is the portion of TAC allocated to Apple? Consequently, how much does Apple receive in such payments? This is a relevant figure as it affects the degree of co-dependency but also of relative profitability of each business. Apple gaining highly profitable commissions for access to its customers and Google getting highly profitable search terms from those same customers.
Here's what we know: Google reports its overall TAC total as part of its cost of revenues and Apple reports its overall Services revenues and margins as a separate segment. Google also reports TAC as a cost against its Advertising segment revenues.
In the last quarter TAC was $12.6 billion, a 21.2% cost against an Advertising total of about $59.4 billion. Apple reports Services top line only without sub-segments so we don't know how much of that TAC it receives. Services for Apple includes many elements including licensing, AppleCare, cloud subscriptions, digital content, third party subscriptions, apps, payment, advertising and other services. Some of these elements can be estimated as we have some historic data. Apps in particular can be teased out as we have developer payment data.
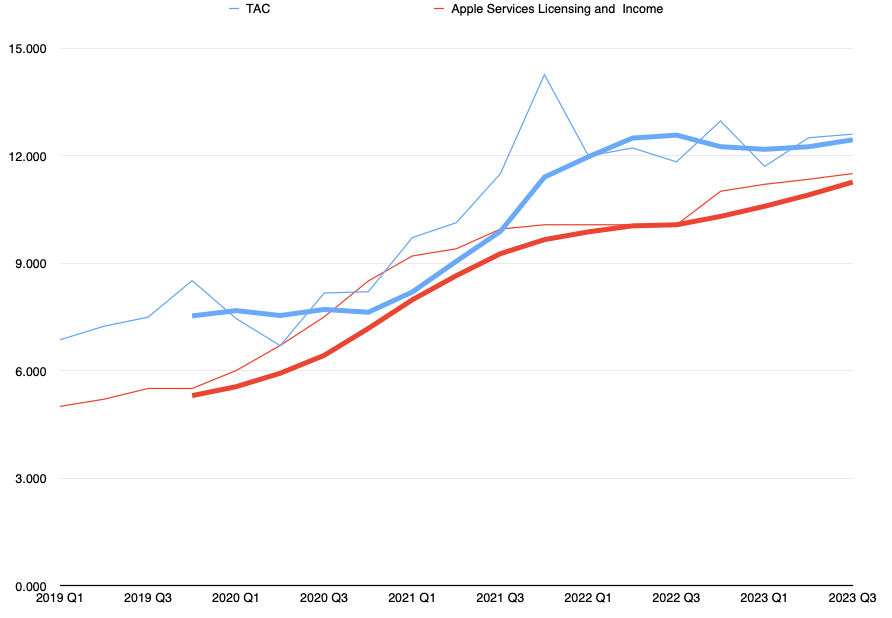
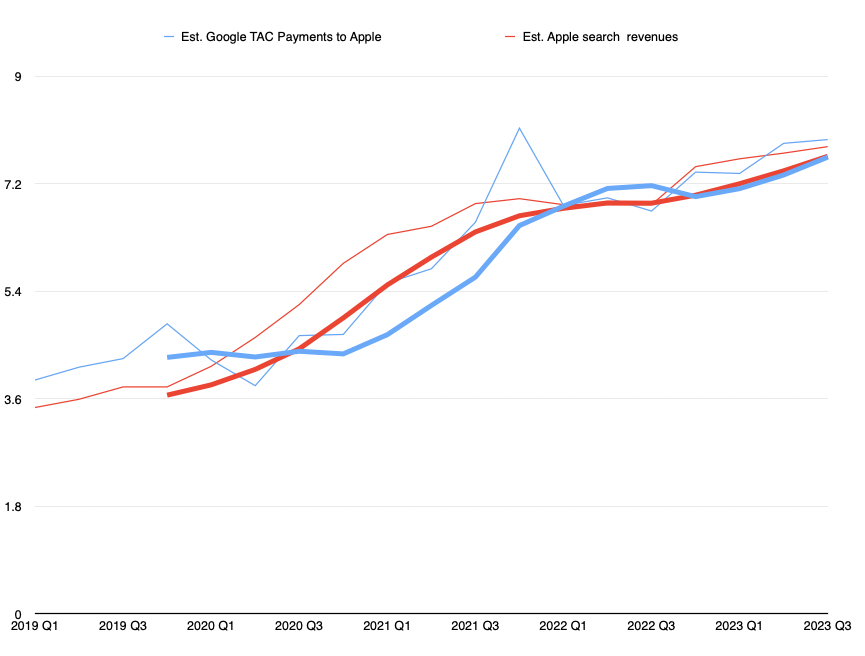
I've been estimating what would be Apple's TAC+cloud+payments as a bundle over the years. Looking at this figure vs. what Google reports as TAC yields this graph:
The thin lines are the actual data and the thick lines are 4 period averages. Apple is red, Google is Blue.
What this shows is that Google TAC is fairly well correlated to what Apple receives and that there is a gap of some degree. What is needed is an estimate of the percent of TAC that goes to Apple and a percent of Apple Services that matches it. Two variables but one equation.
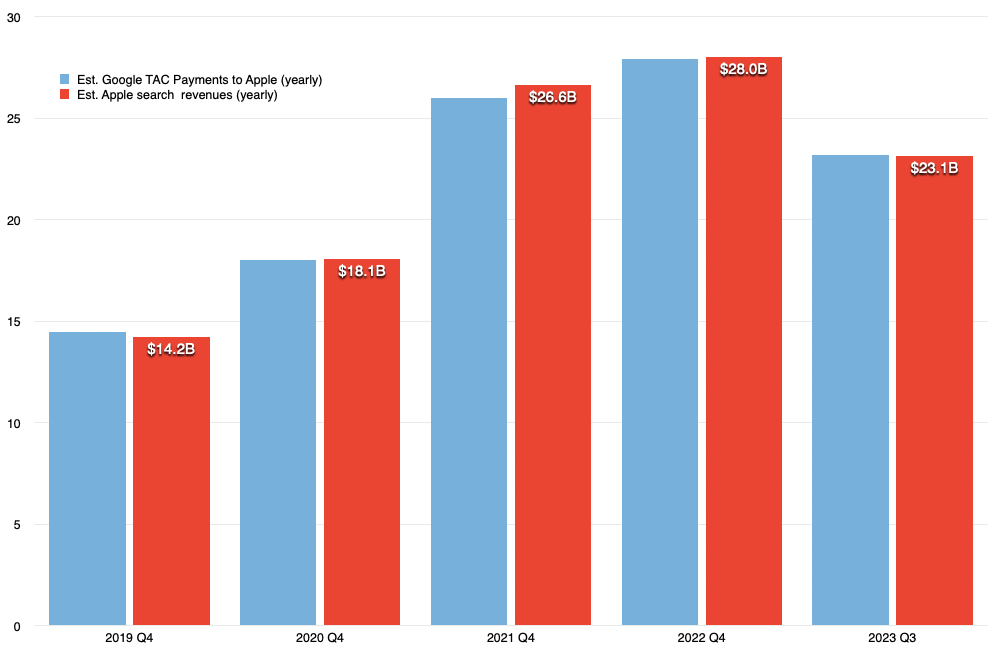
After some iteration through some constraints (which would be laborious to explicate but I can reveal at the next live event) I built the following estimate:
Though not matching identically, the yearly totals are pretty close to each other. The resulting yearly payments are
2019: $14.2 billion
2020: $18 billion
2021: $26 billion
2022: $28 billion
2023 (first 3 quarters): $23 billion
I would say this might be an upper bound for the estimate but not too far from reality. Most estimates to date have been far lower and I don't think they are accurate.
To stress test this I ran several sanity tests including comparing the revenue per user for Apple users and for non-Apple users and checking the sensitivity of services gross margins to TAC total.
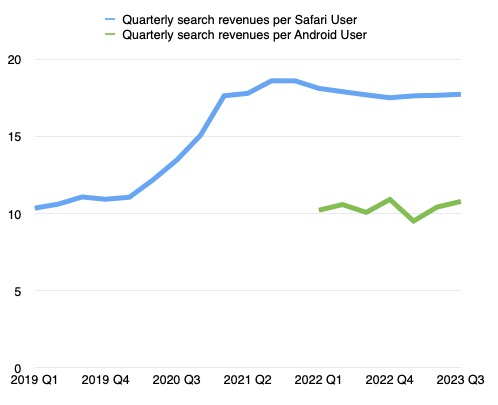
I'll just expand a bit on the revenue per user implications. We can calculate the revenues per user since we know that, according to Google's CEO, Apple receives 36% commission on search. Having the figures above, we can estimate the search income attributed to Apple and, by subtraction, the same for non-Apple. Then we can divide by the install base of each.
This shows that the deal could very well be indexed on the number of users with a specific value attached to each per quarter/month/day as these figures are fairly stable. The figure at this time shows that Apple users are valued at about $17.7/quarter or 19c/day while non-Apple users are around $10/quarter or 11c/day.
It also shows that Apple got "a raise" during 2021, increasing the amount it gets paid per user by about 60%.
It also suggests that Apple users generate about 37% of all of Google's advertising revenue, disproportionately as it's from a 27% user base market share.
None of these conclusions should seem surprising or extraordinary. If anything, they suggest that Apple is providing Google with bargain access to its customers. I suspect that Apple users are more valuable than a ratio of 2:1 in search. The app (and content and device ASP) economics are far more lopsided.
Apple is most certainly also very well aware of this and yet has maintained relatively modest pressure on Google in terms of pricing for access. There might be good reasons of which we are not aware of but as the antitrust pressure grows, so might Apple's interest in getting a better deal.
In the next installment of this series we will look into just how much better this deal can get.
The data is finally out. Apple Services and perhaps Apple itself can be quantified and predicted as never before. As we shall see this data changes almost everything we know.
It is even more shocking that this most important data set has been released by Apple itself. (Though it did so in order to comply with regulation, Apple did offer a bit more detail than was required.)
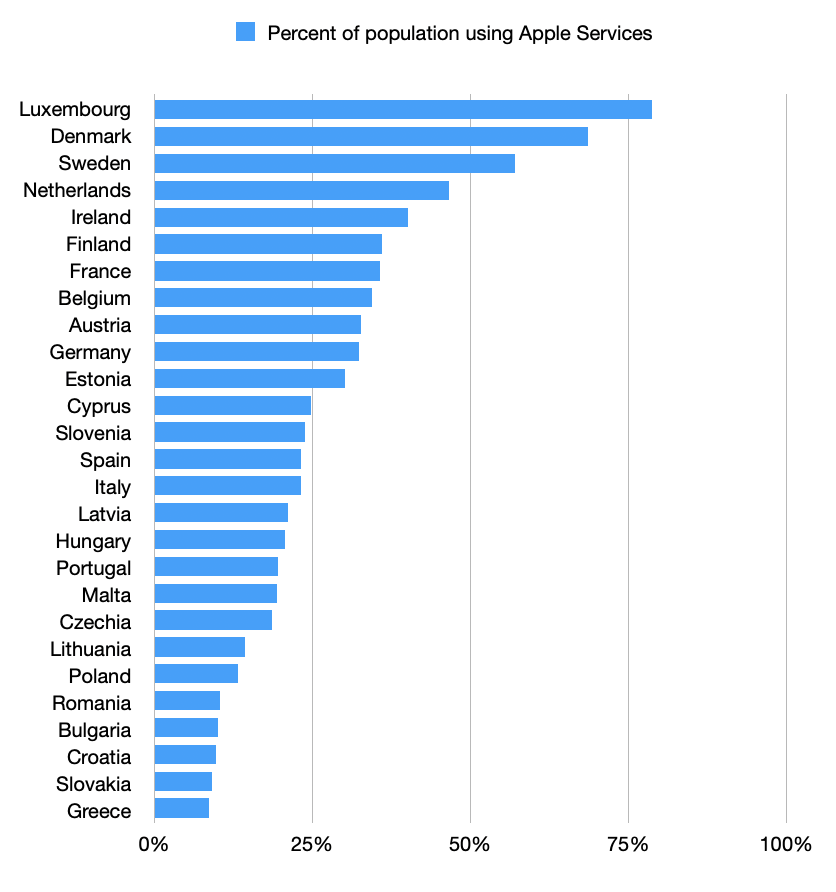
What the data shows is the number of average monthly active recipients in the EU of Apple-provided data services, calculated as an average over the period of the six months to 31 July 2023. This number is 123 million.
In addition, if you follow the link, you can see the number of recipients broken down by Member States. I summarize this data below.
Note that my summary is not that of the absolute numbers of recipients but the percent of population that these numbers represent. Note further that for some of the states with less than 1 million total recipients, estimates had to be generated. These were done in order to complete a total of 123 million. You'll have to trust me that these estimates make sense.
This release of data might be amusing for the ranking we obtain, showing which countries' citizens are more likely Apple fans than others. Seeing, for example, that the nordic countries show more affinity for Apple than the balkans; whatever that implies.
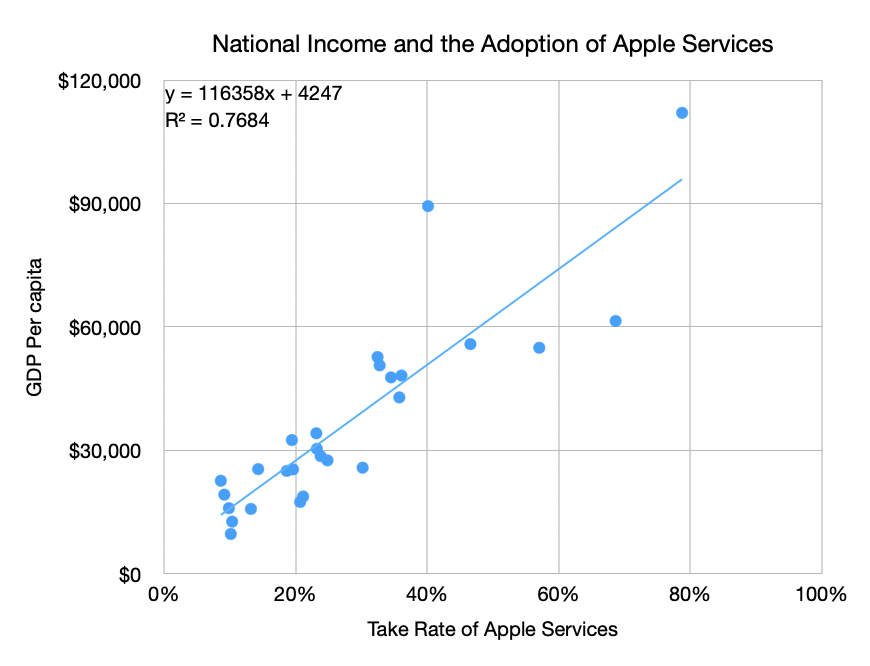
But a geographic categorization is banal. What would be more interesting is to look for a proxy for Apple adoption that is predictive. I know what you're thinking: it's obvious, look at income. More precisely GDP per capita. The data yields the following.
Please keep in mind that some countries might have missing or outdated data, and the values presented here are based on information available up to 2021. Note that there is one outlier. That data point around $90,000 and 40% adoption is Ireland. It's an outlier because the GDP income for Ireland includes the large number of multinational firms based there. That includes Apple, Facebook, Google and LinkedIn, etc. which pull GDP above what would be assumed by GNP.
With Ireland the data fits with the coefficient r-squared of 0.77. Without Ireland it's 0.85. This seems good enough to me to estimate the relationship of Apple Adoption ~= (National Income - 4247)/116,358. The trend line in the graph above shows this relationship.
What are the implications?
First, the ends of the line need to be finessed. 100% Apple Adoption is suggested at income of $116,358/yr/capita. Also, 0% Apple Adoption happens below an income of $4,247/yr/capita. Now both of these are problematic as there are known adopters in countries with income below $4,247/yr (more about this later) and there are countries with income above $116,358 which cannot therefore have more than 100% adoption (or can they? This makes a good trivia question.)
These anomalies should encourage us to look further. What if we apply this formula for countries outside the EU? To answer this, I generated a country set with about 190 entries and applied the pattern seen within the EU country set (n = 27.)
Knowing the GDP per capita for all countries as well as population size, we can estimate the global total of Apple services subscribers to be 560 million individuals. Note that Apple reports 1,010 million total subscriptions but that includes multiple subscriptions per subscriber and subscriptions to services which for Apple only acts as guarantor through the Apple App Store. Overall data on Apple Subscriptions (and other details) is provided below:
Note that we know the total active devices to be over 2 billion and the active iPhones to be about 1.2 billion. This implies that about half of iPhone users have an Apple-owned subscription and that over half of the subscriptions Apple manages are for its own services.
What's more, we can obtain a detailed list of expected Apple Services users for each country. An example would be 5.8 million users in Mexico or 1.7 million in New Zealand. [I could furnish this on a country-level in a newsletter, if anybody is interested please let me know.]
It also allows us to understand the potential for countries which currently are below the model's threshold of income. That list consists of 88 countries with a combined population of over 4 billion. They will join the Apple ecosystem, it's only a matter of time. Can we predict this? I believe so. Stay tuned.
The story of Apple Services is only getting more important but also more detailed in terms of data and analysis. Readers of this blog have been well prepared for what happened and Apple has followed through with gross margin data and now with some limited country-level data.
As we move into the era of spatial computing, services will only matter more and it's imperative that observers of the company stay on top of the data with solid modeling.
In March 2016 Ben Bajarin and I put on an event called SUBSCRIBE where we asked, among other things,
How will the online services business models evolve?
How will hardware affect software and services and vice versa?
How will users, usage, and capital connect?
Now is a good time to look back on that event.
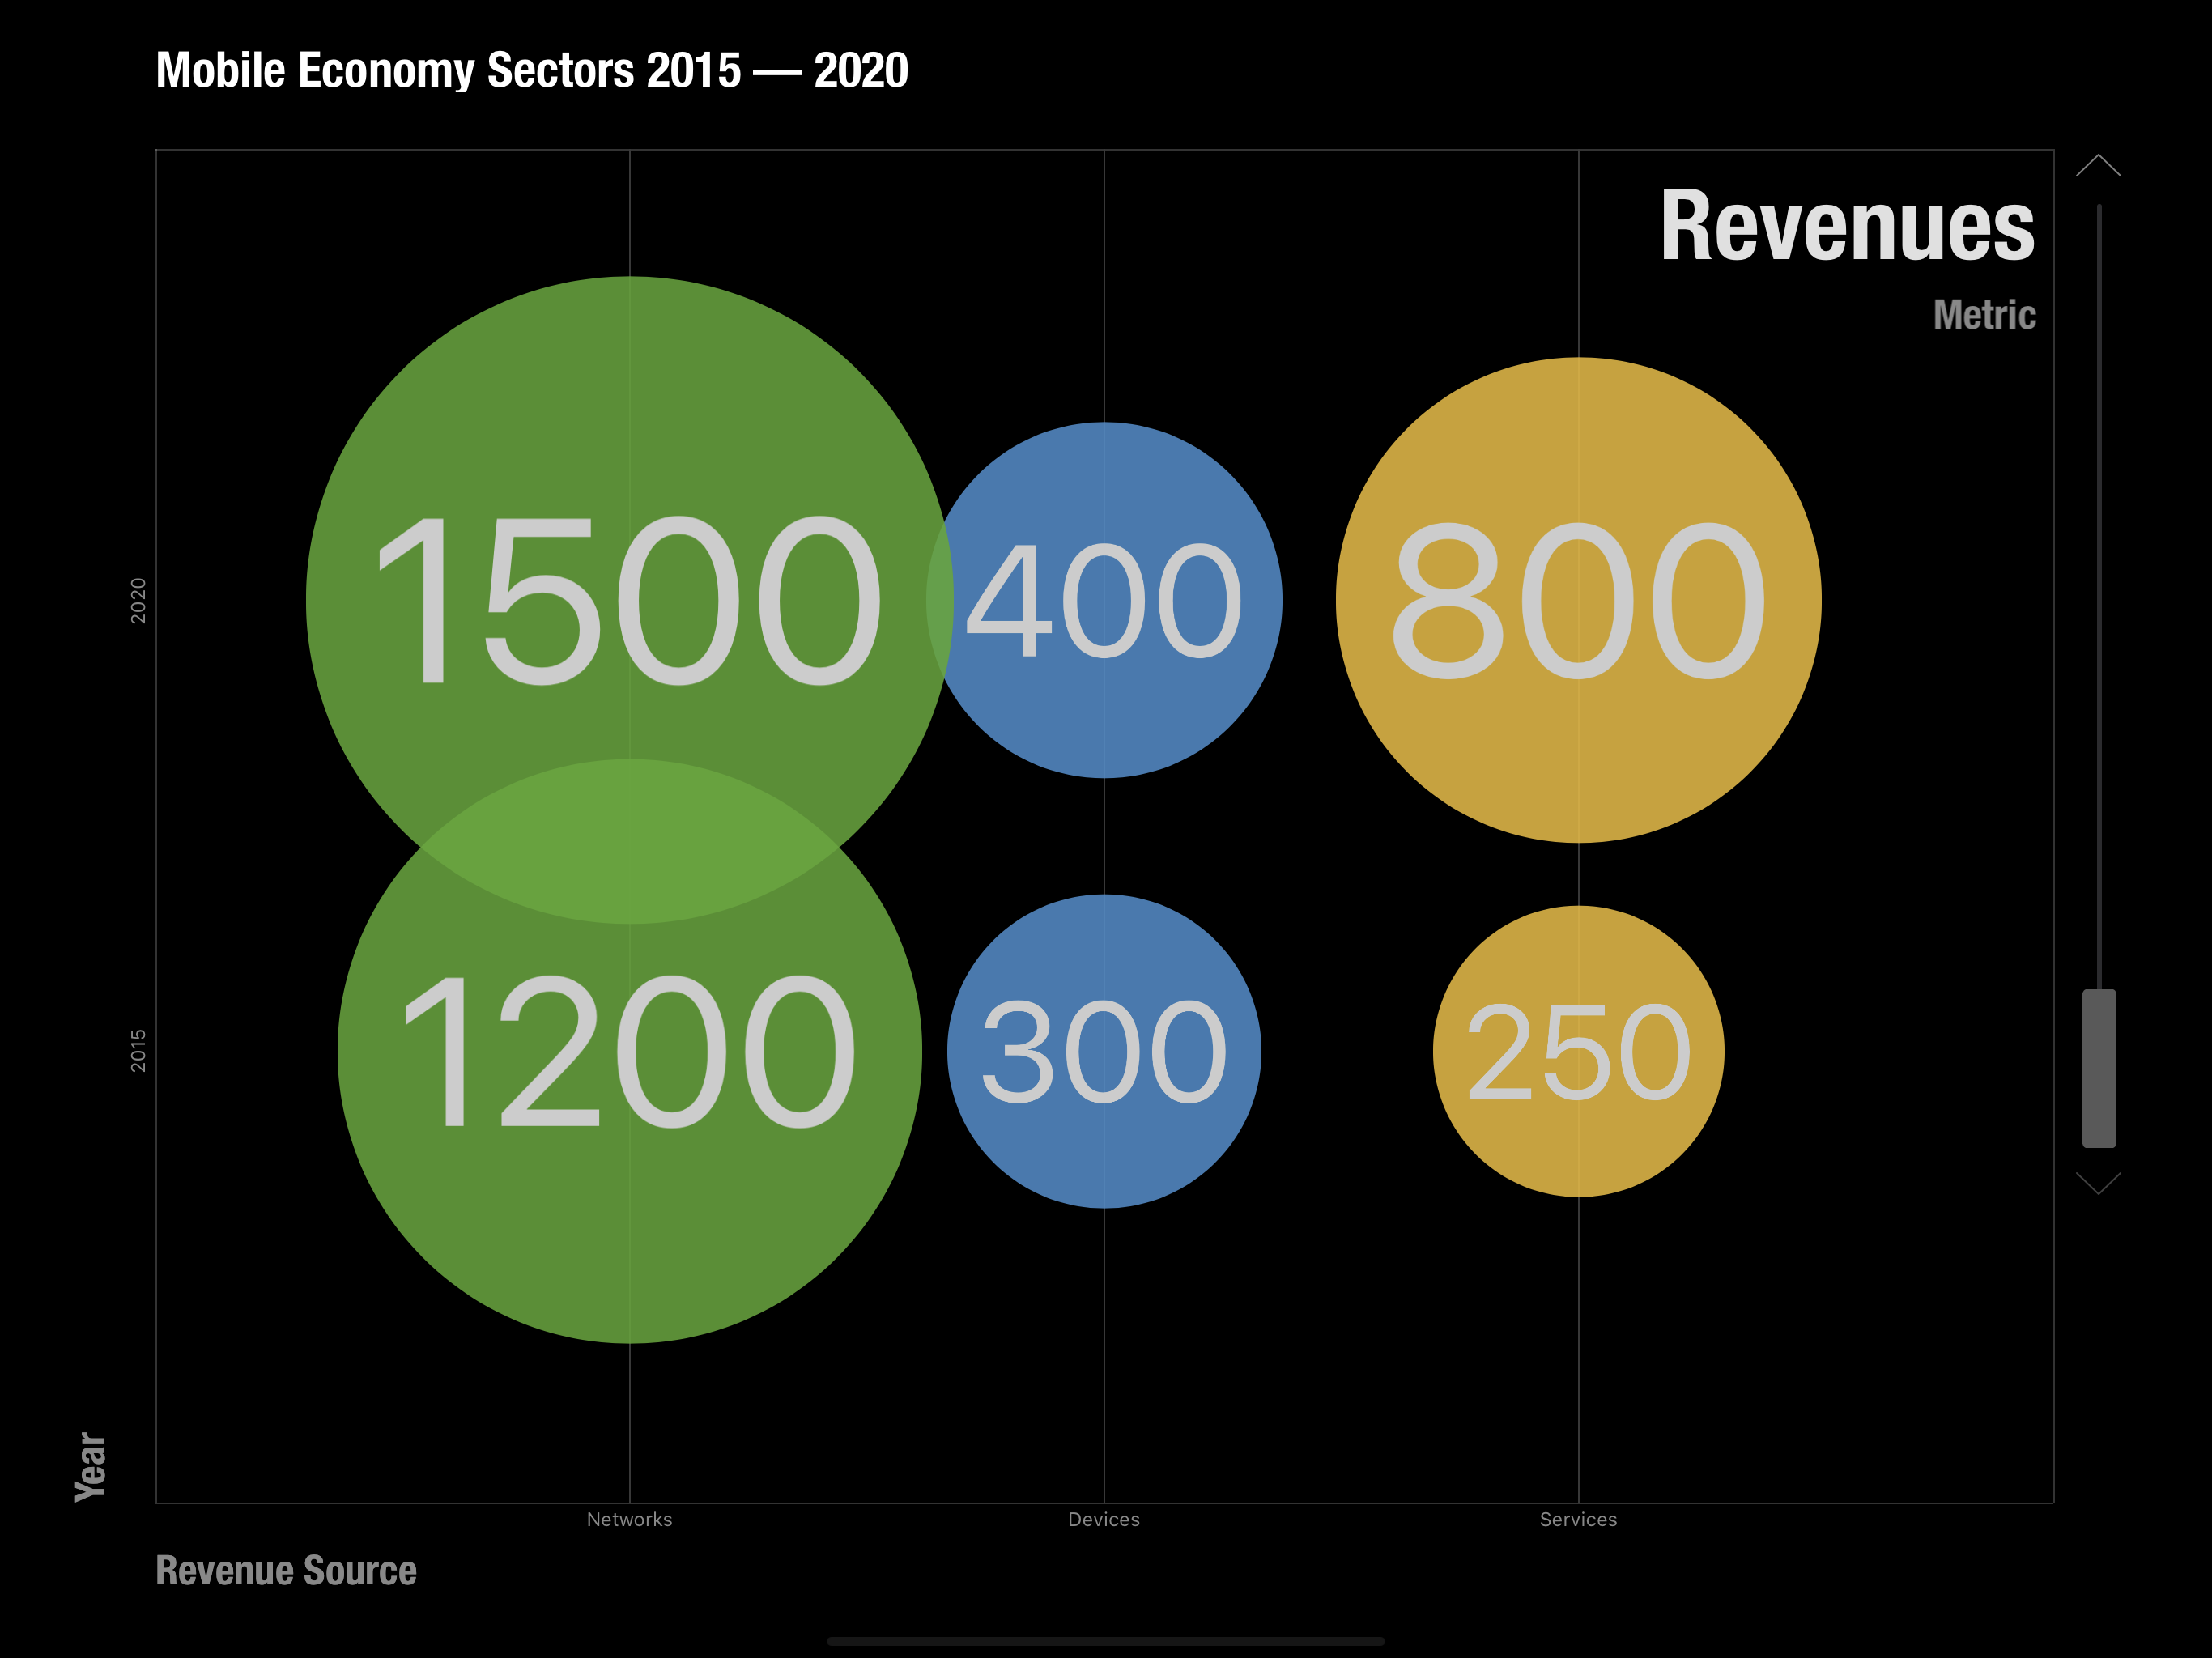
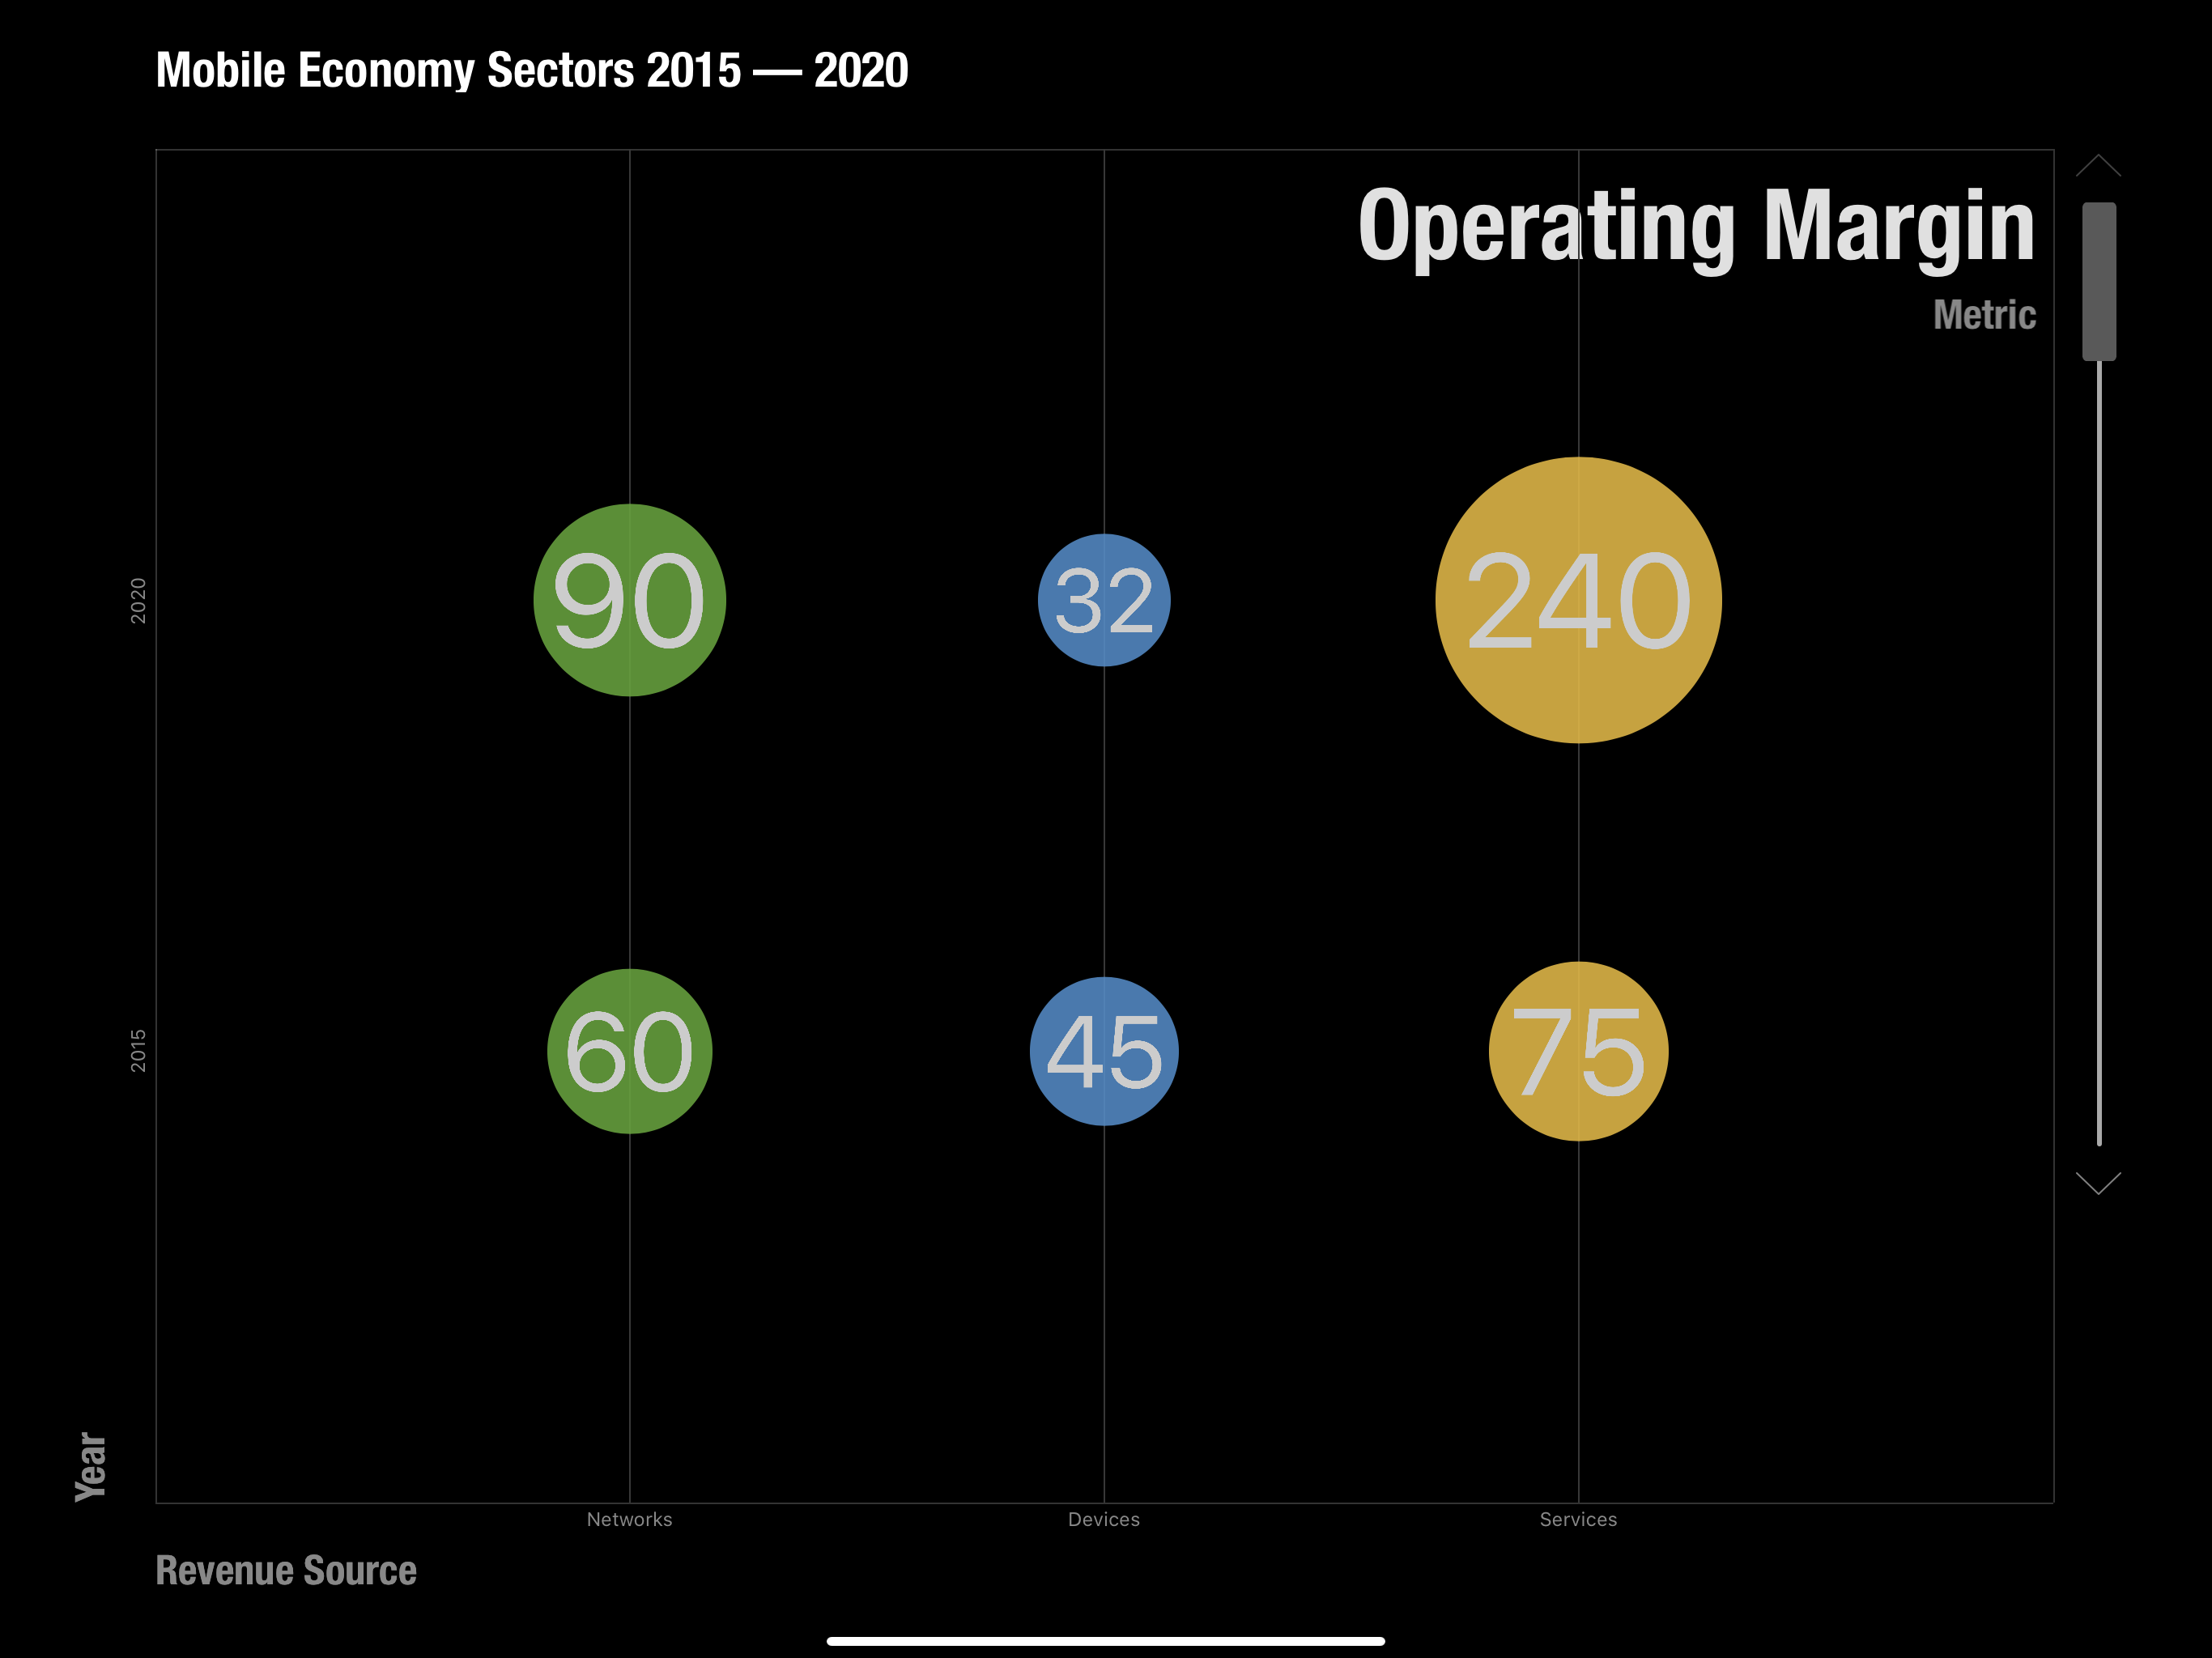
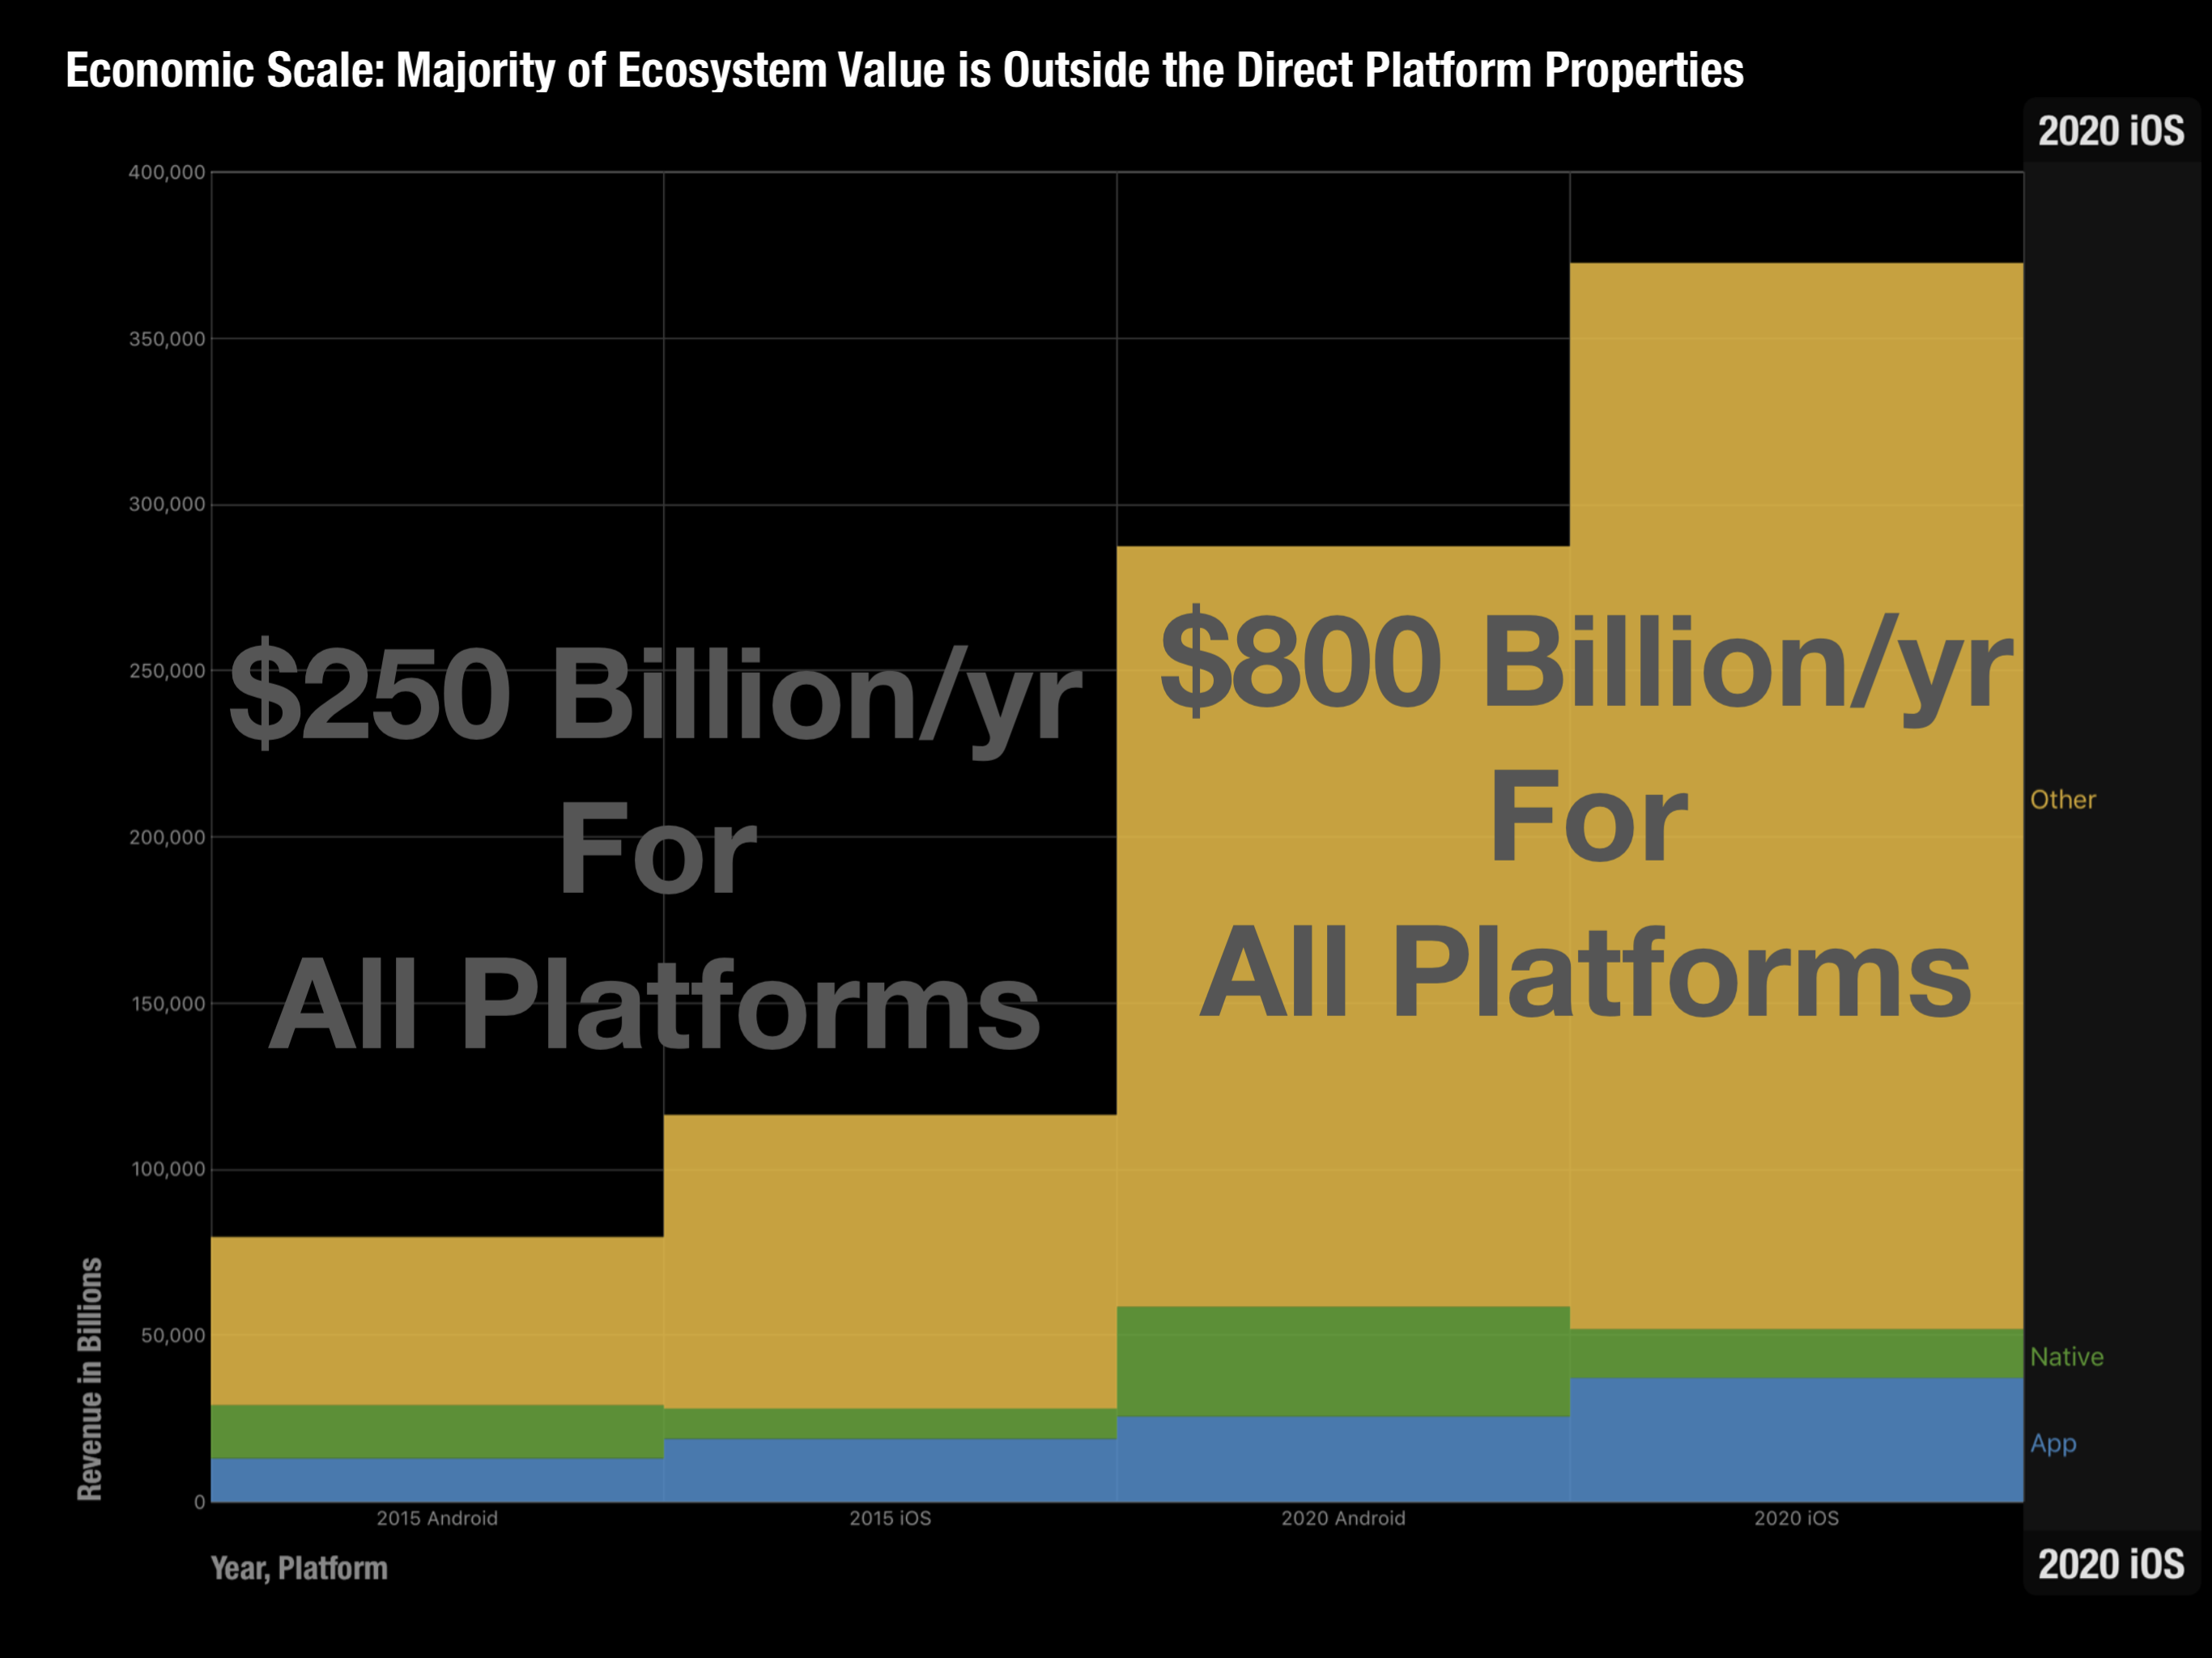
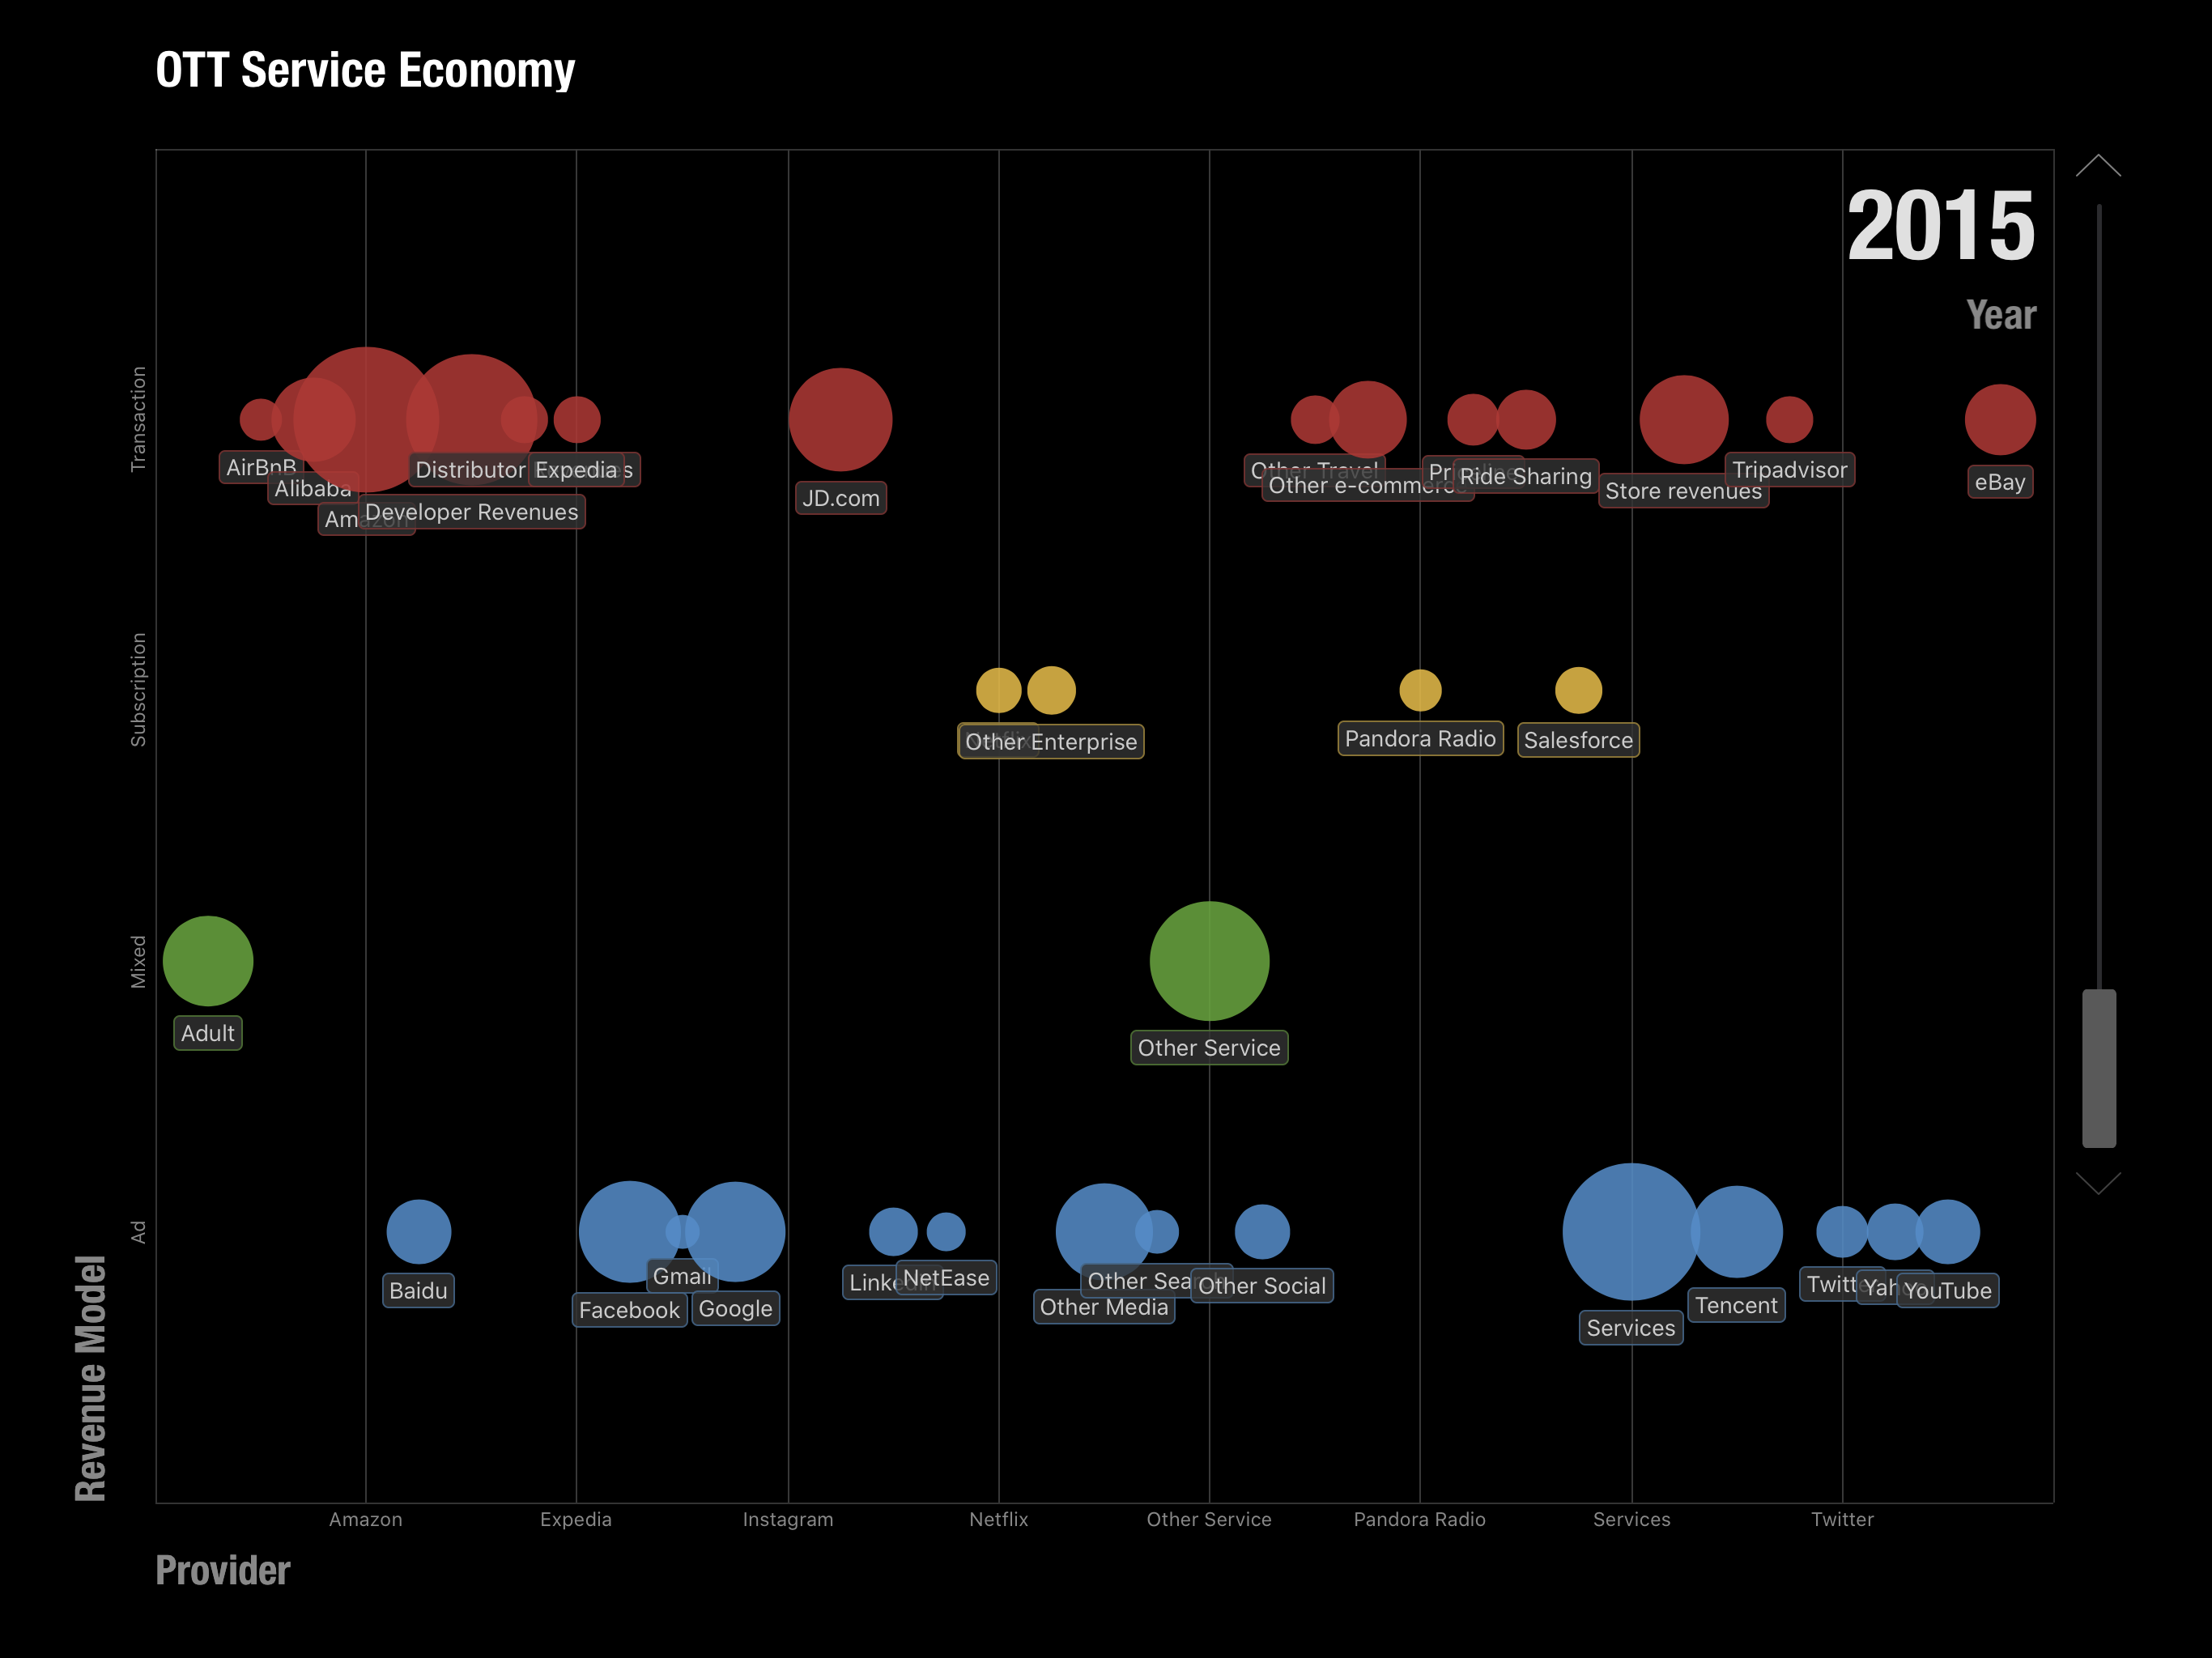
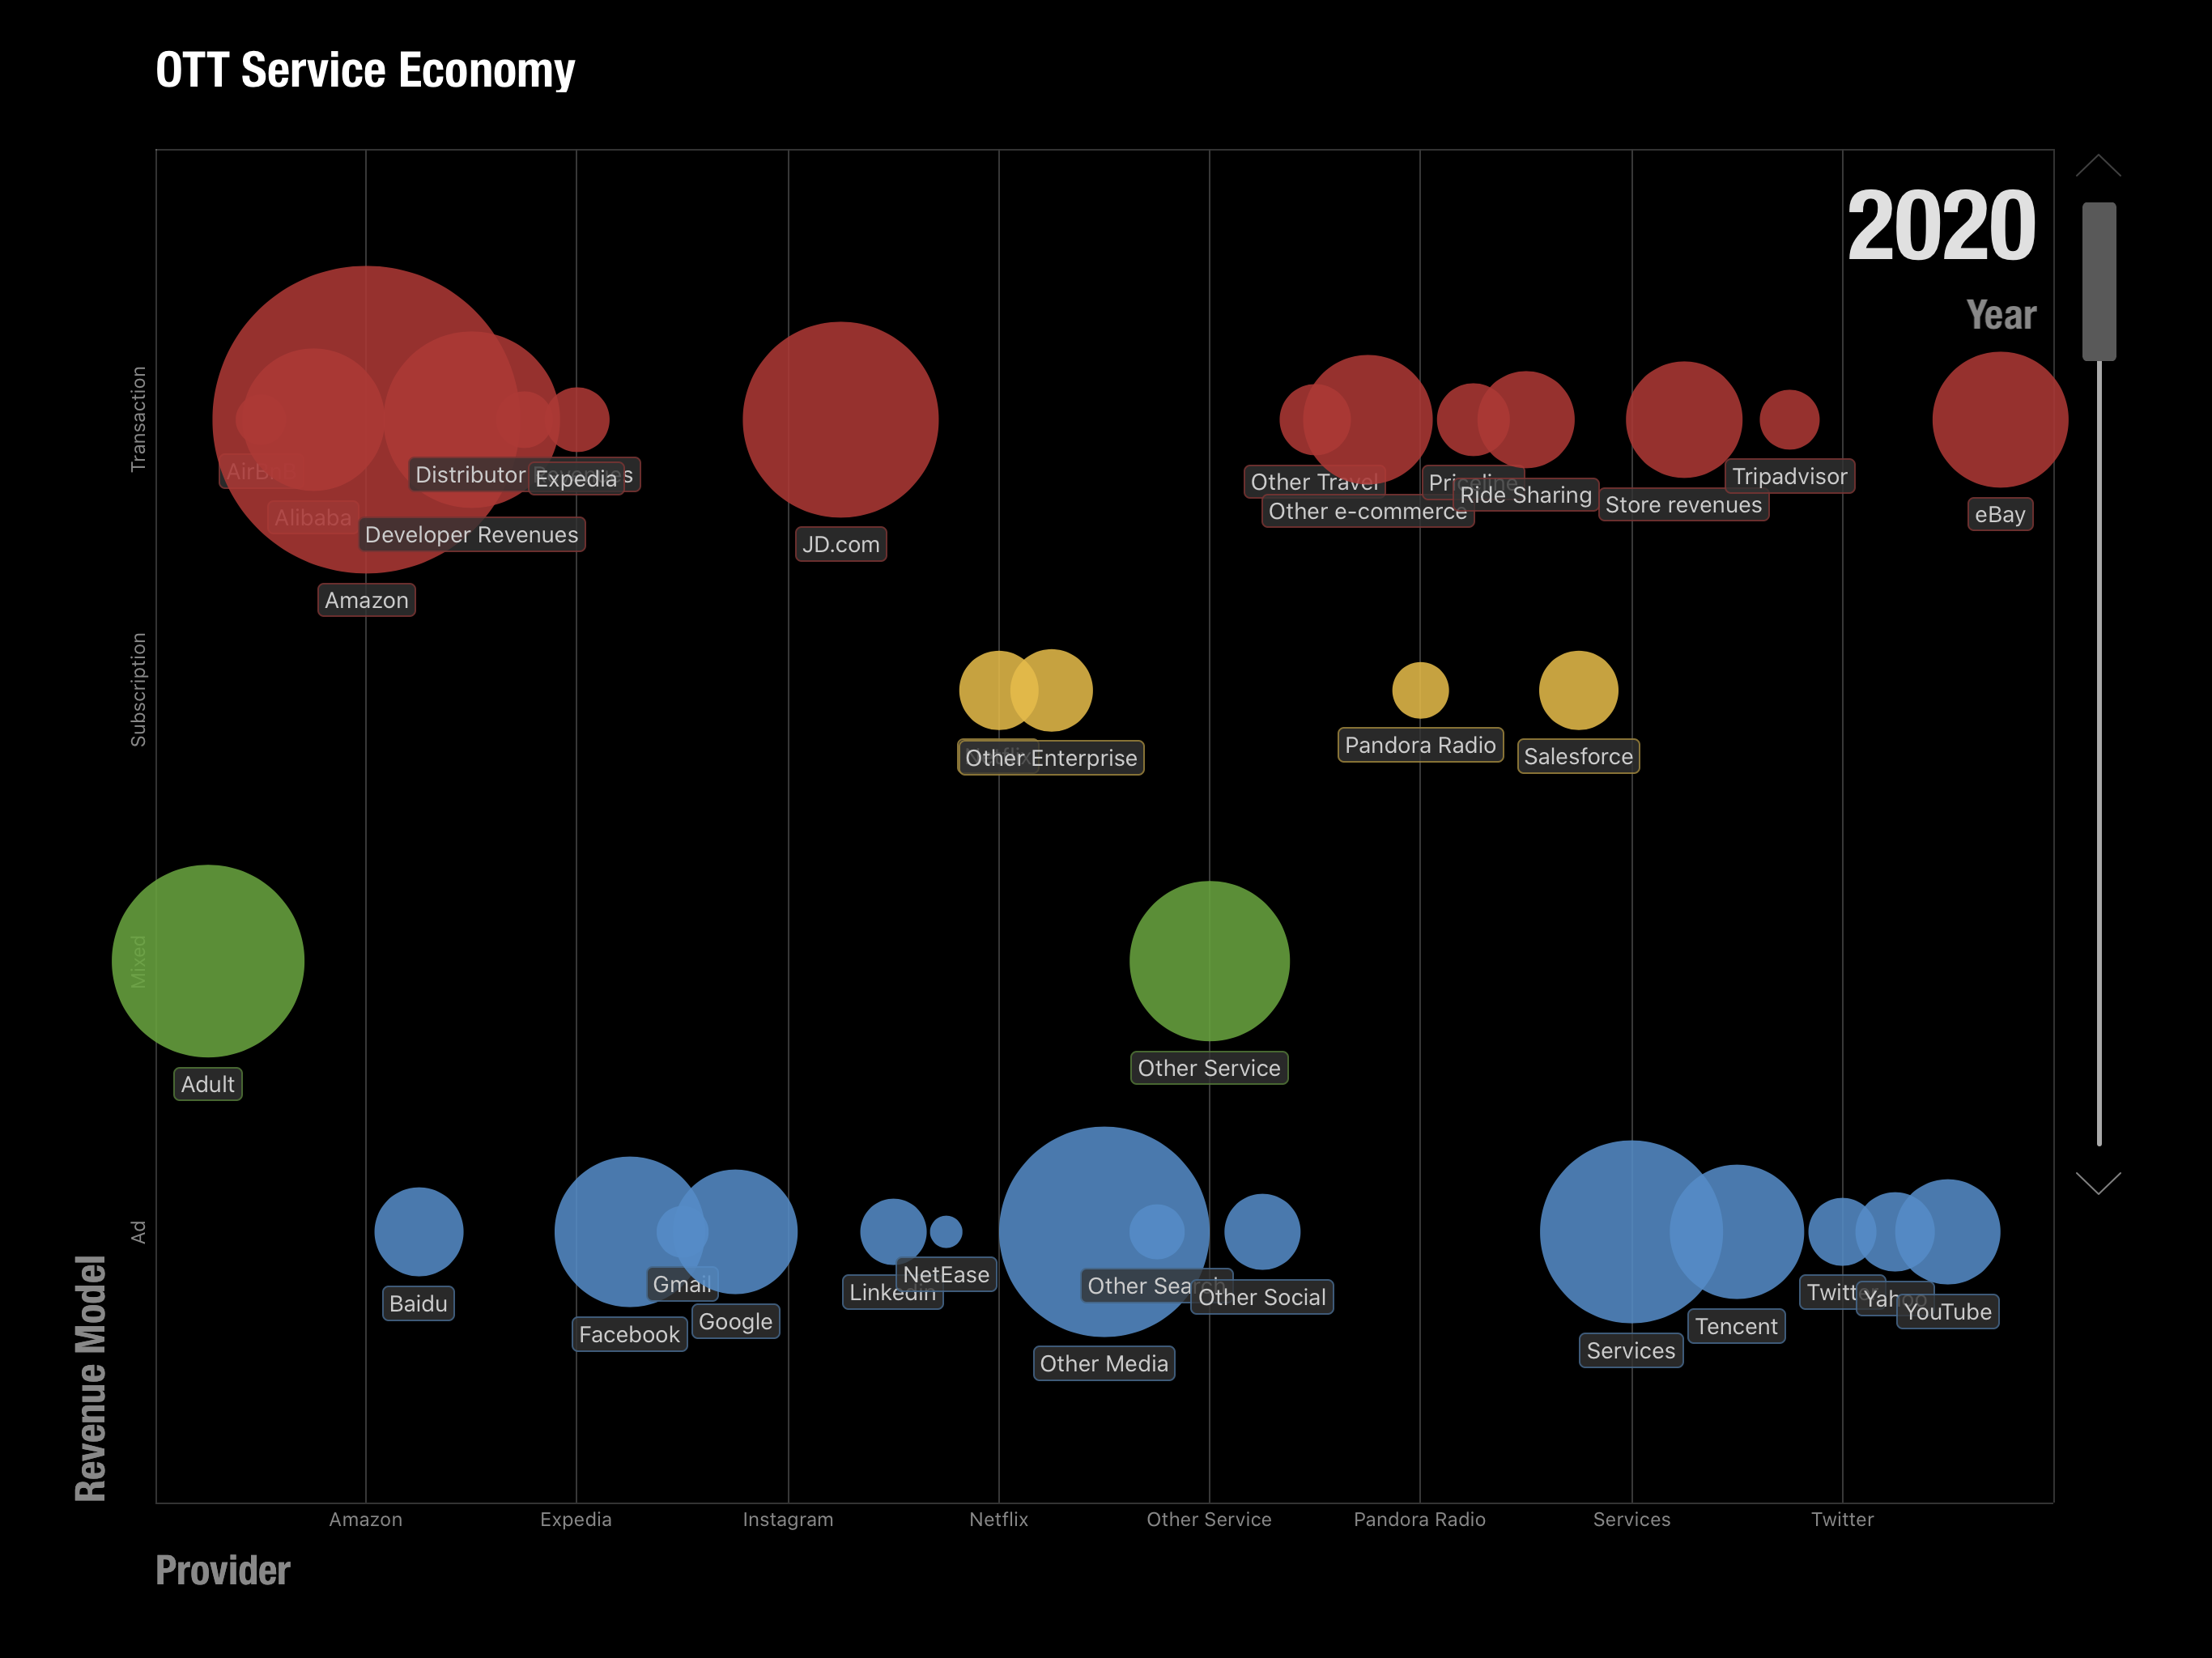
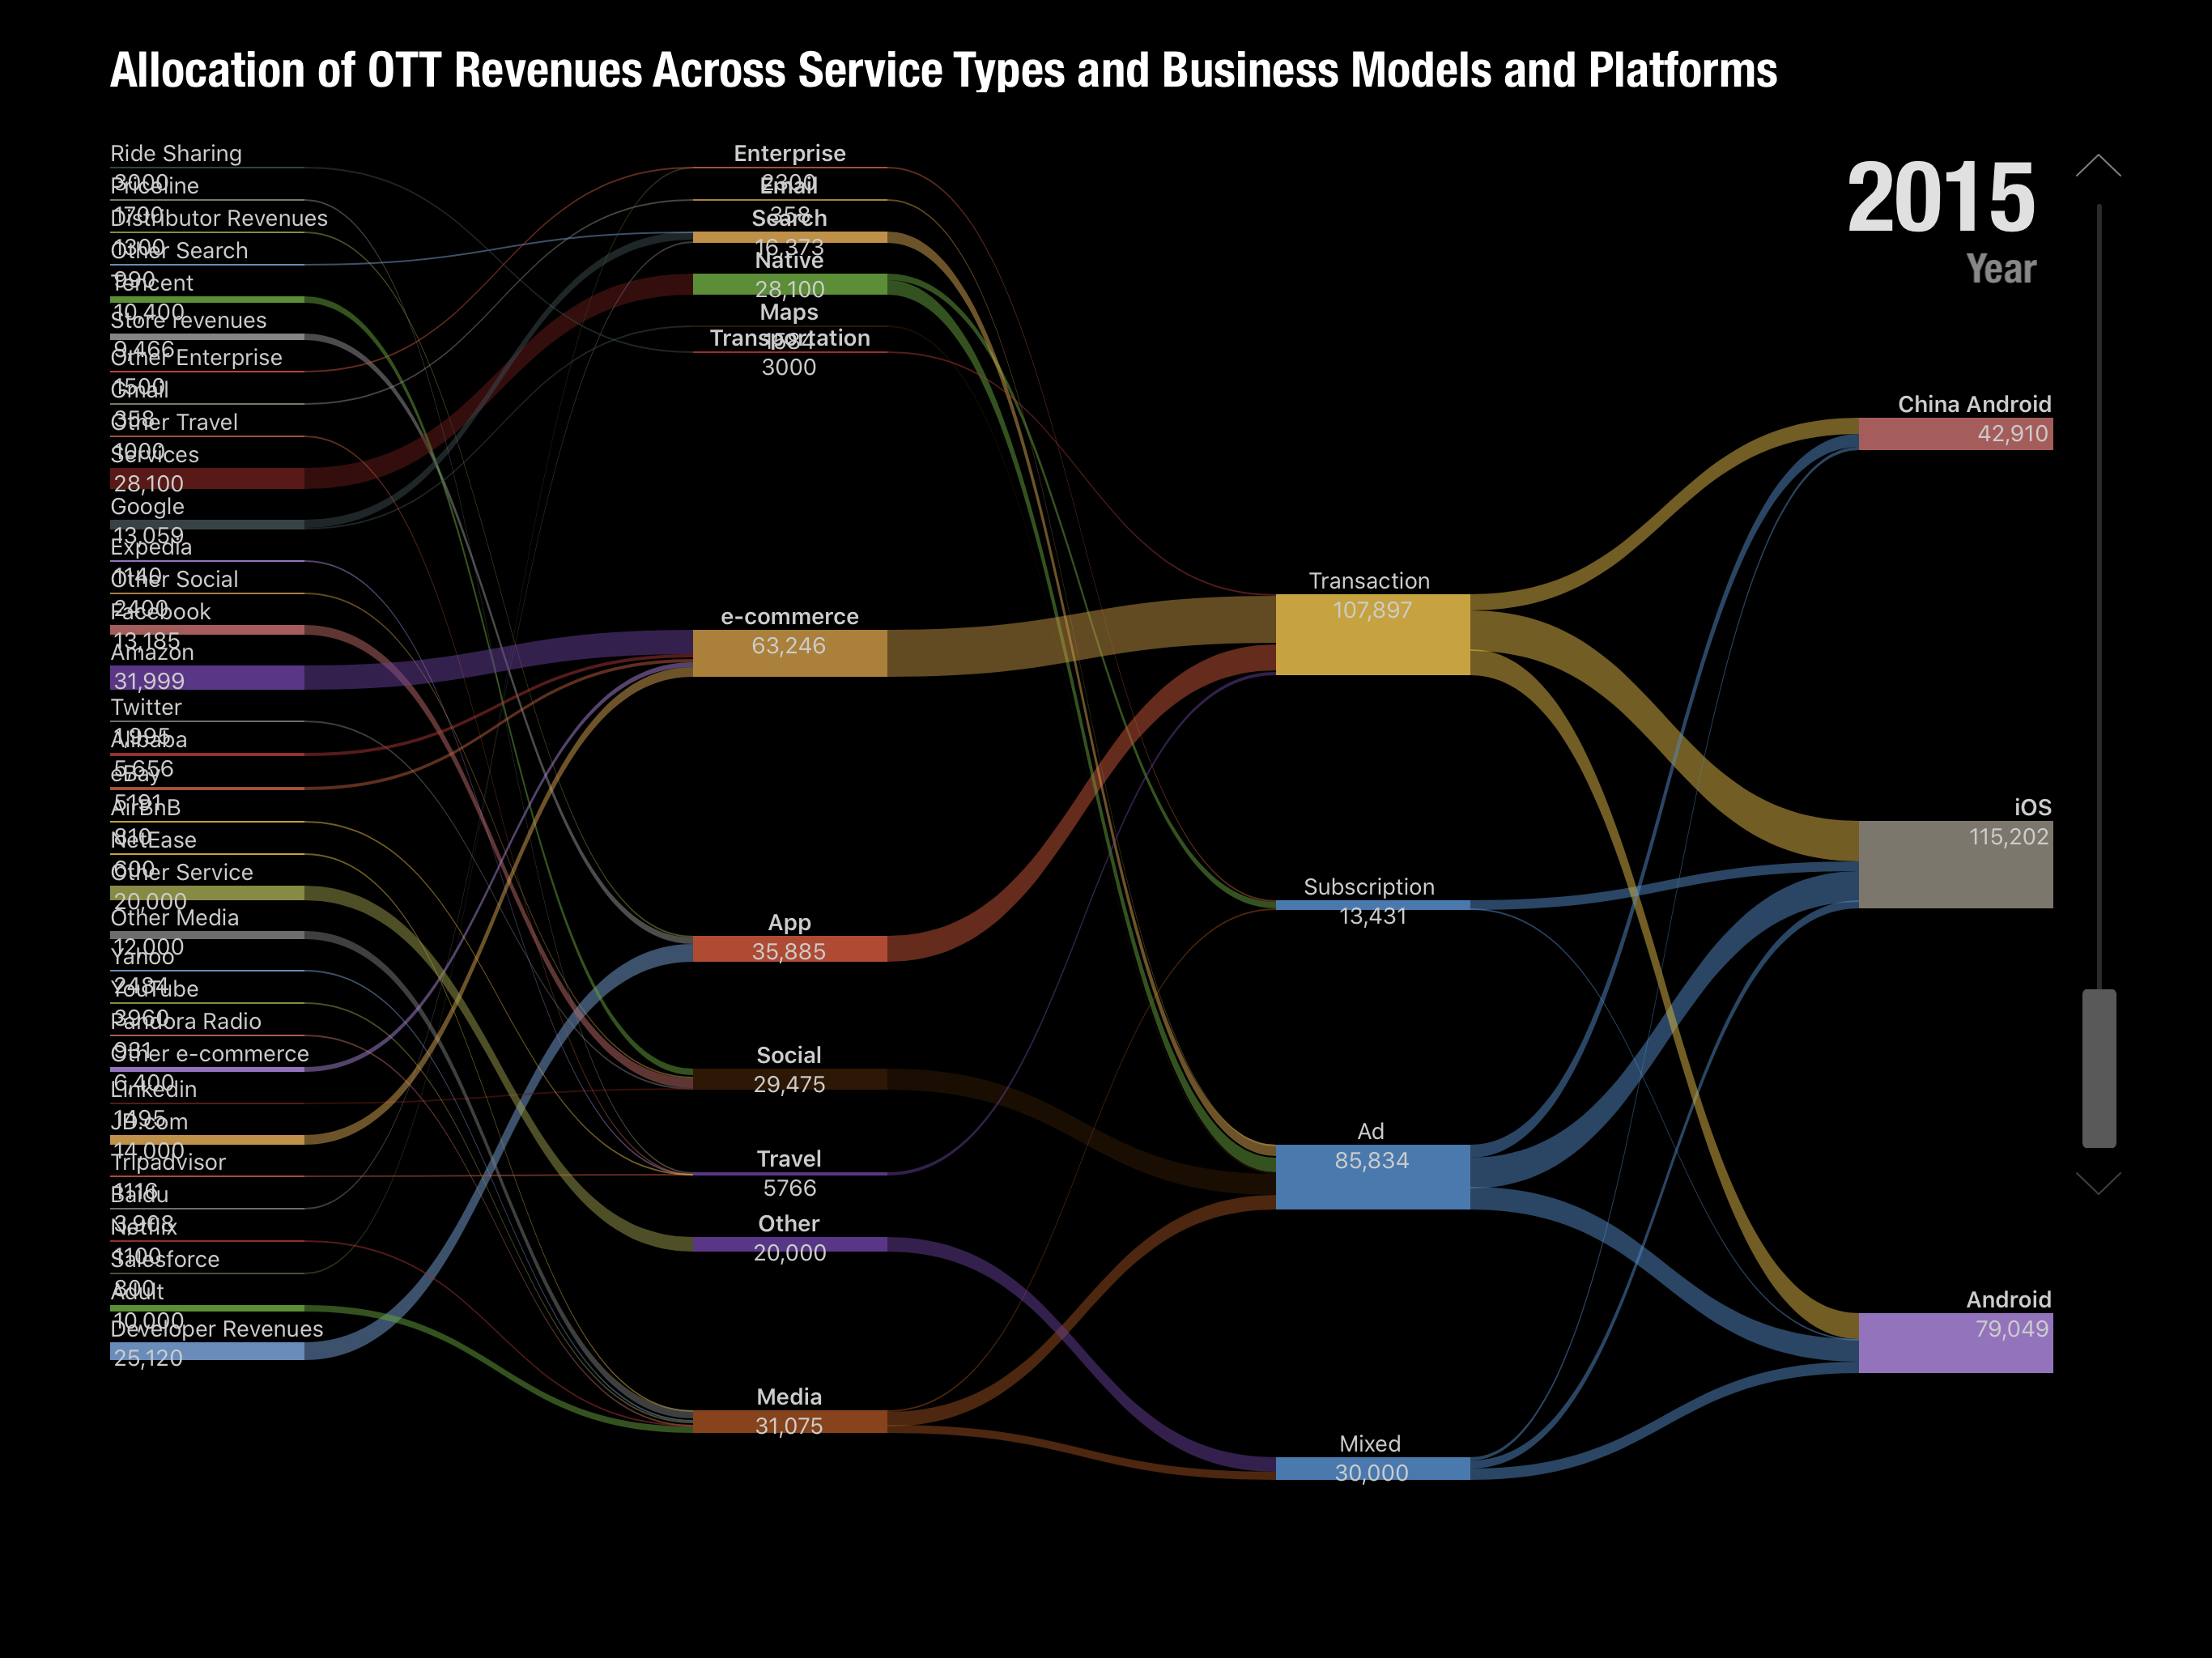
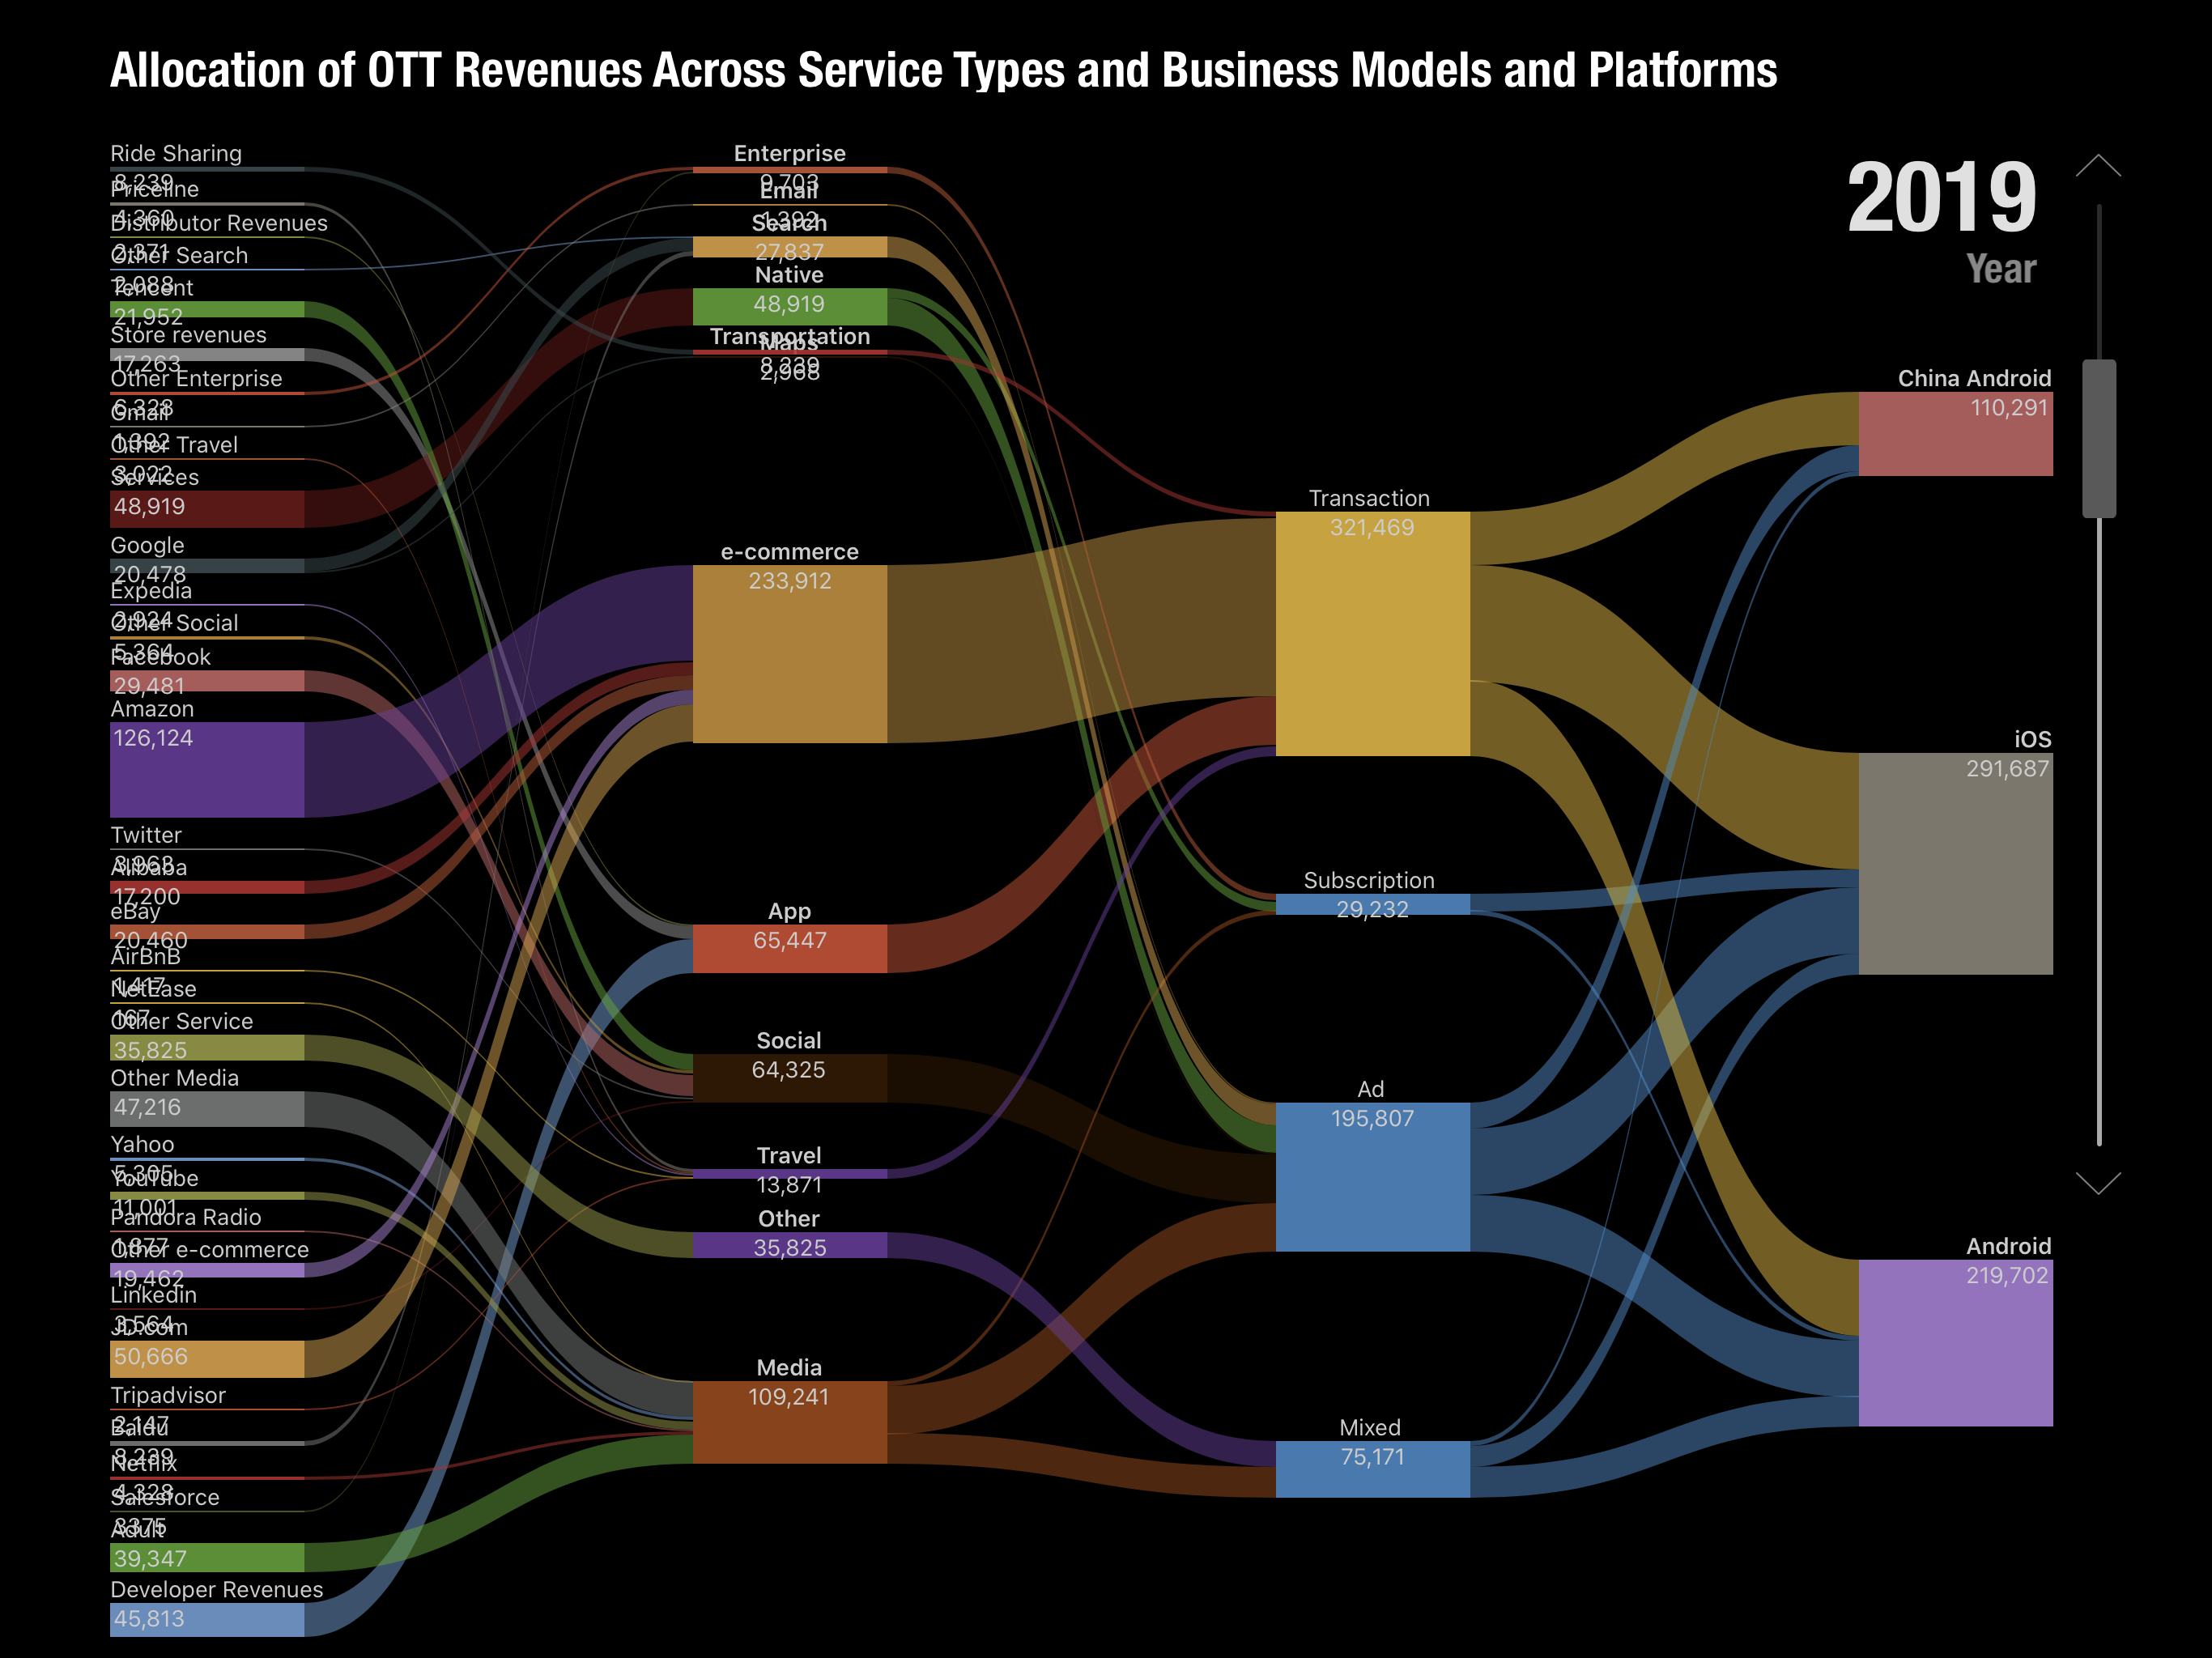
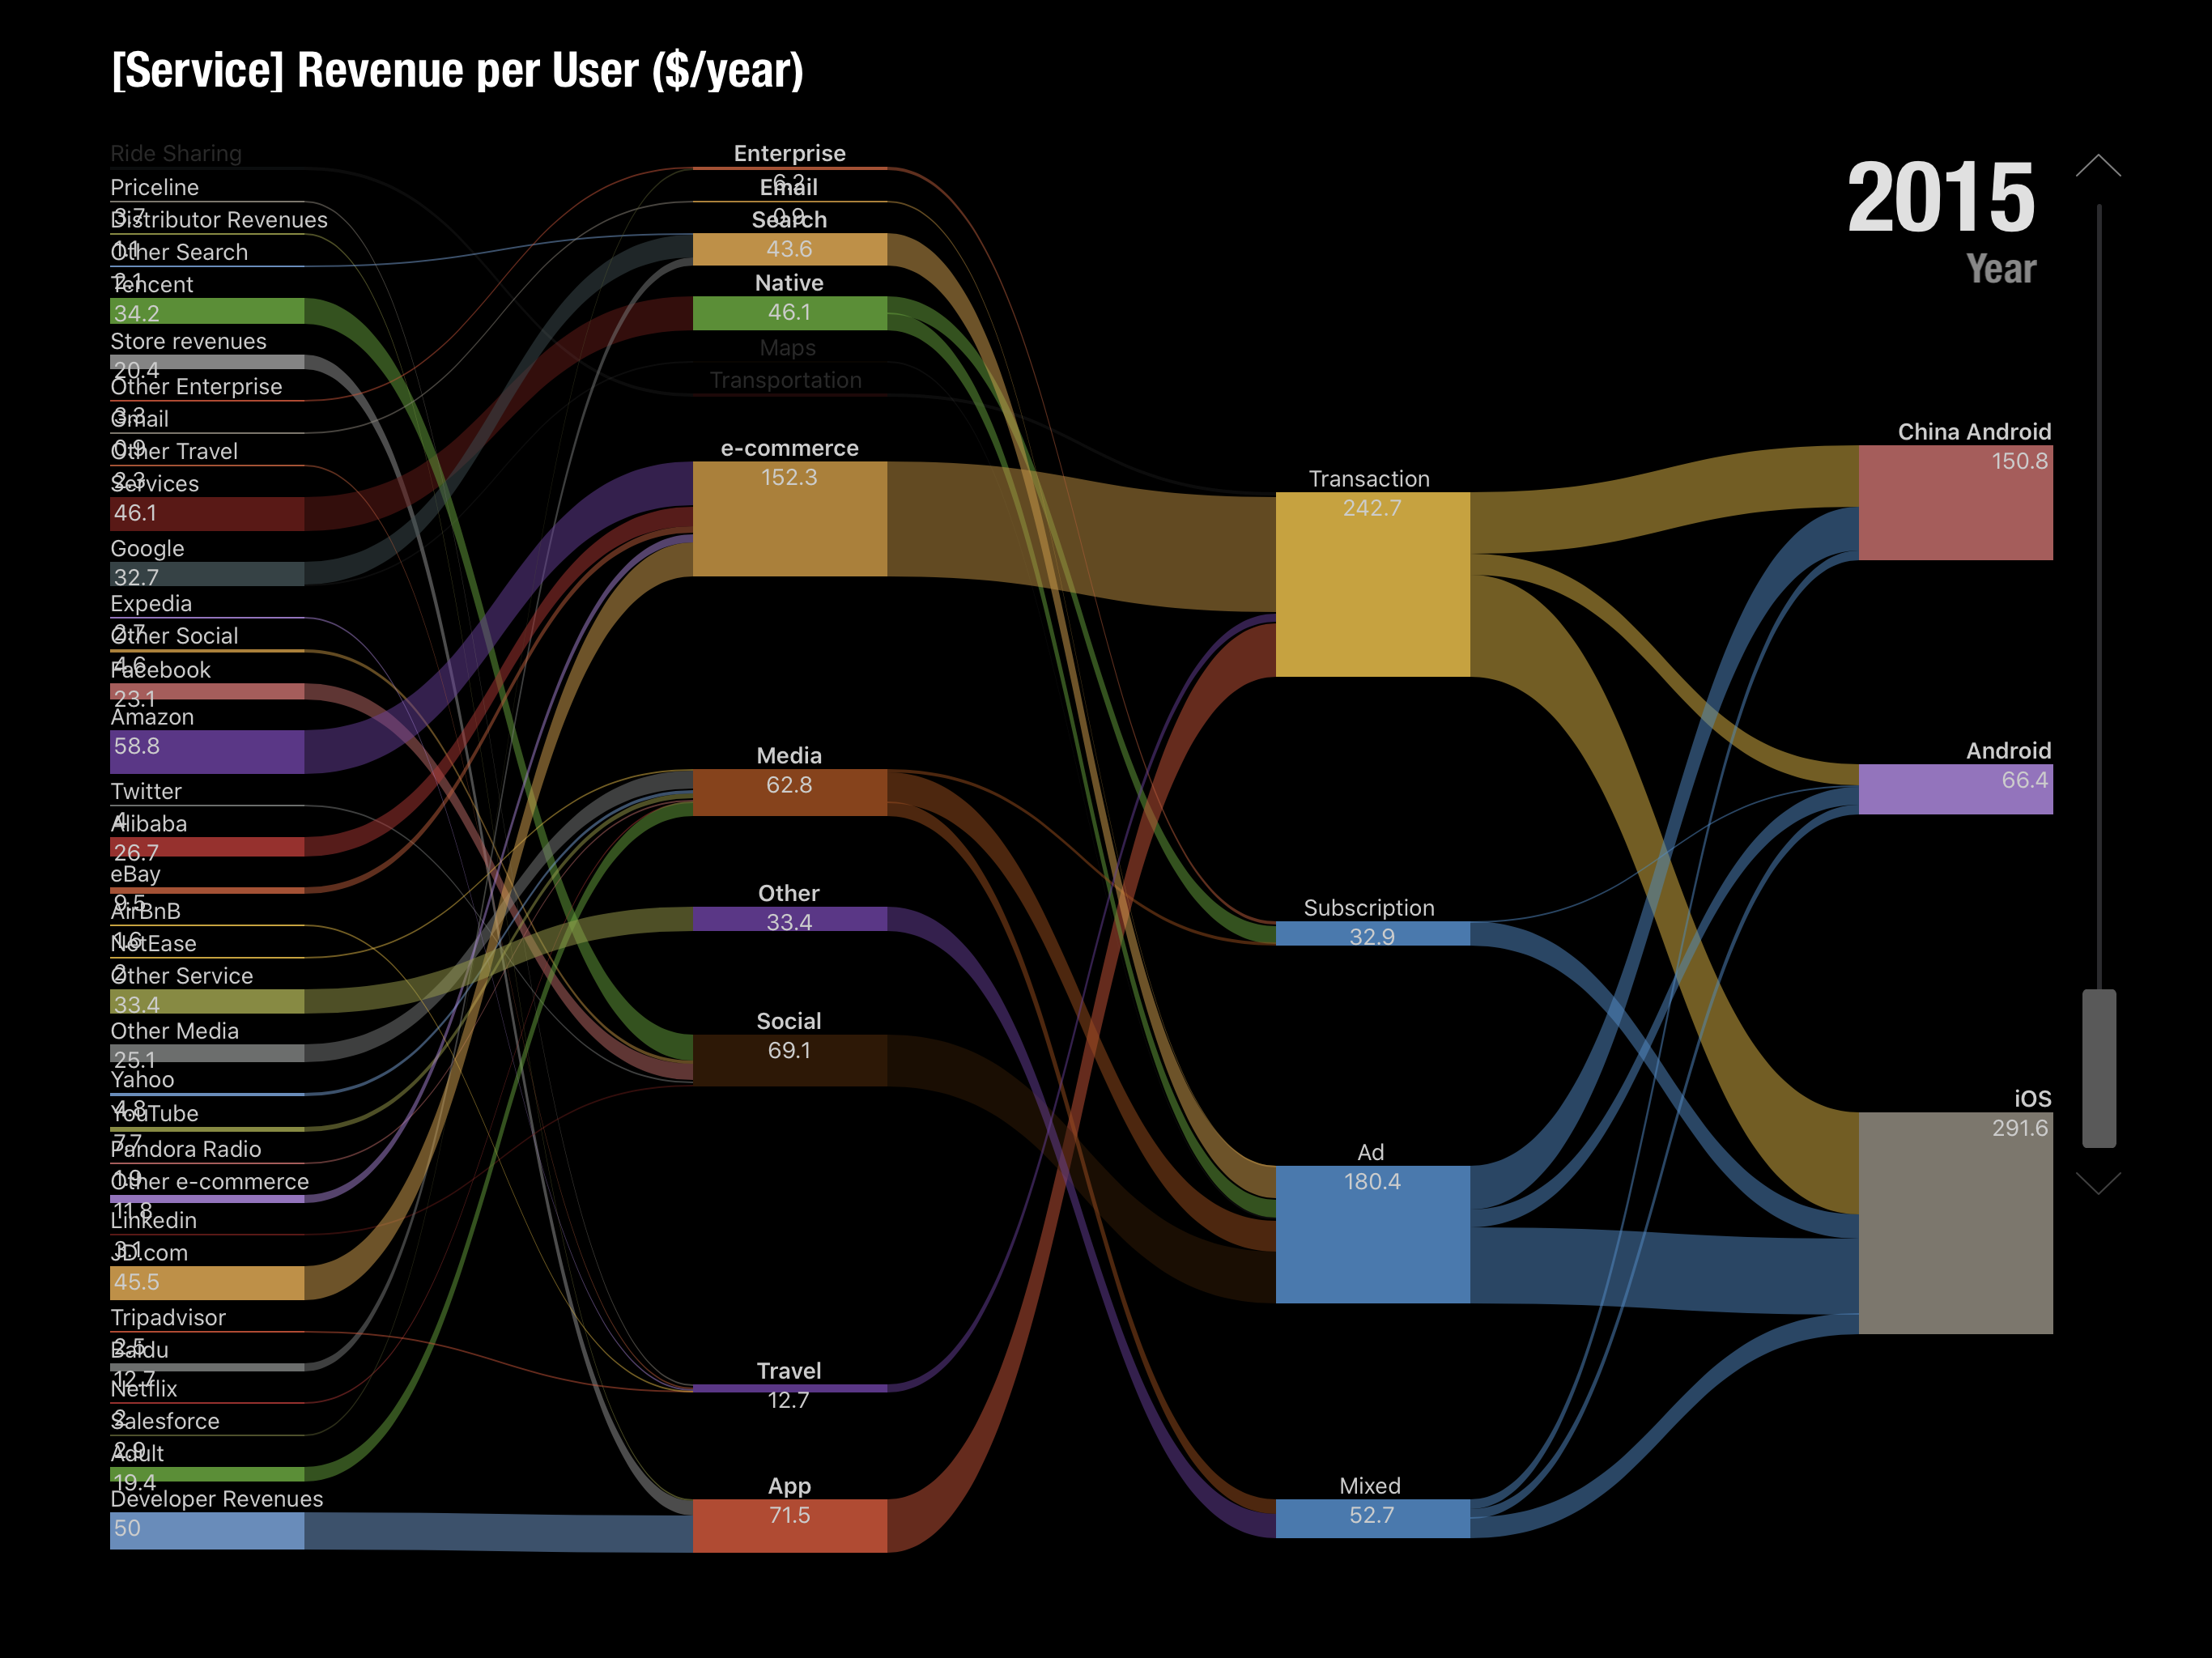
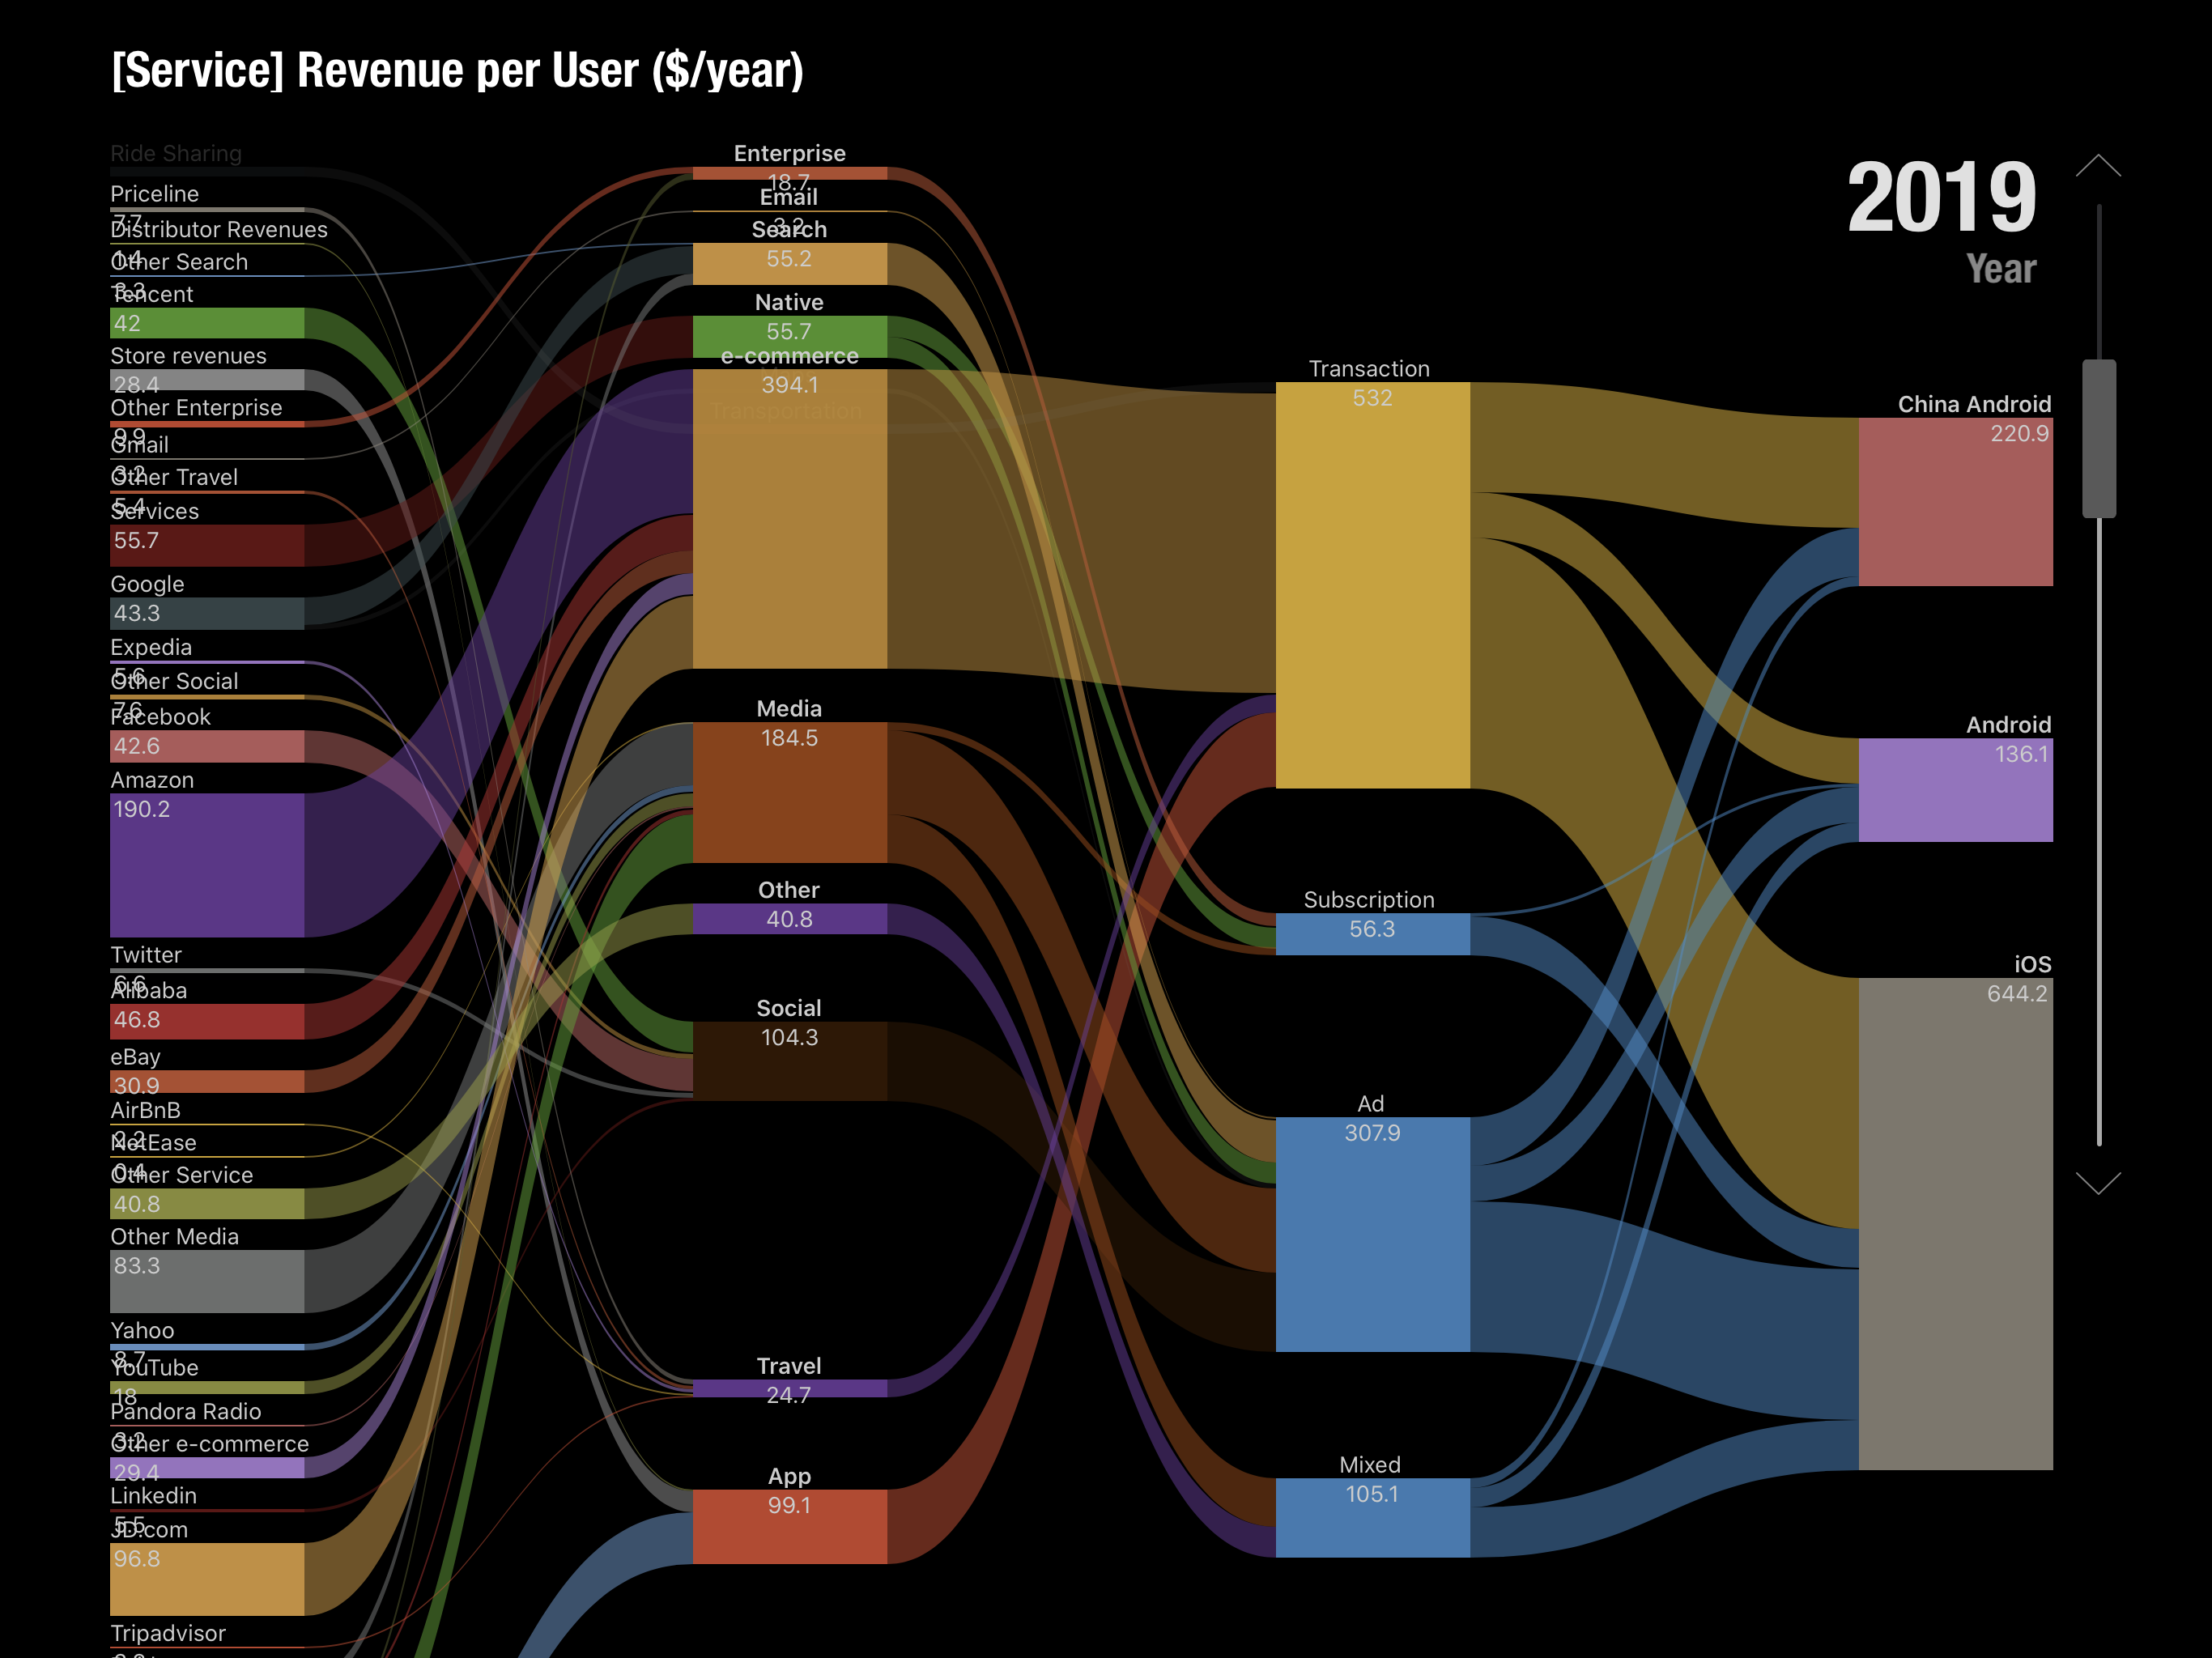
For the keynote I prepared a model which predicted the mobile ecosystems for iOS, Android and Chinese Android over the next 5 years (to 2020). The methodology involved taking a measurement of the revenues of the top internet service companies, building up the categories these companies occupied, estimating how much of those revenues are through mobile distribution and then splitting the result among the three platforms of iOS and the two Androids.
Adding to that the "native" app and content revenues for each platform would yield the Ecosystem total value. Applying a growth rate would offer some visibility into the future.
The following images are screen captures of the Perspective presentation.
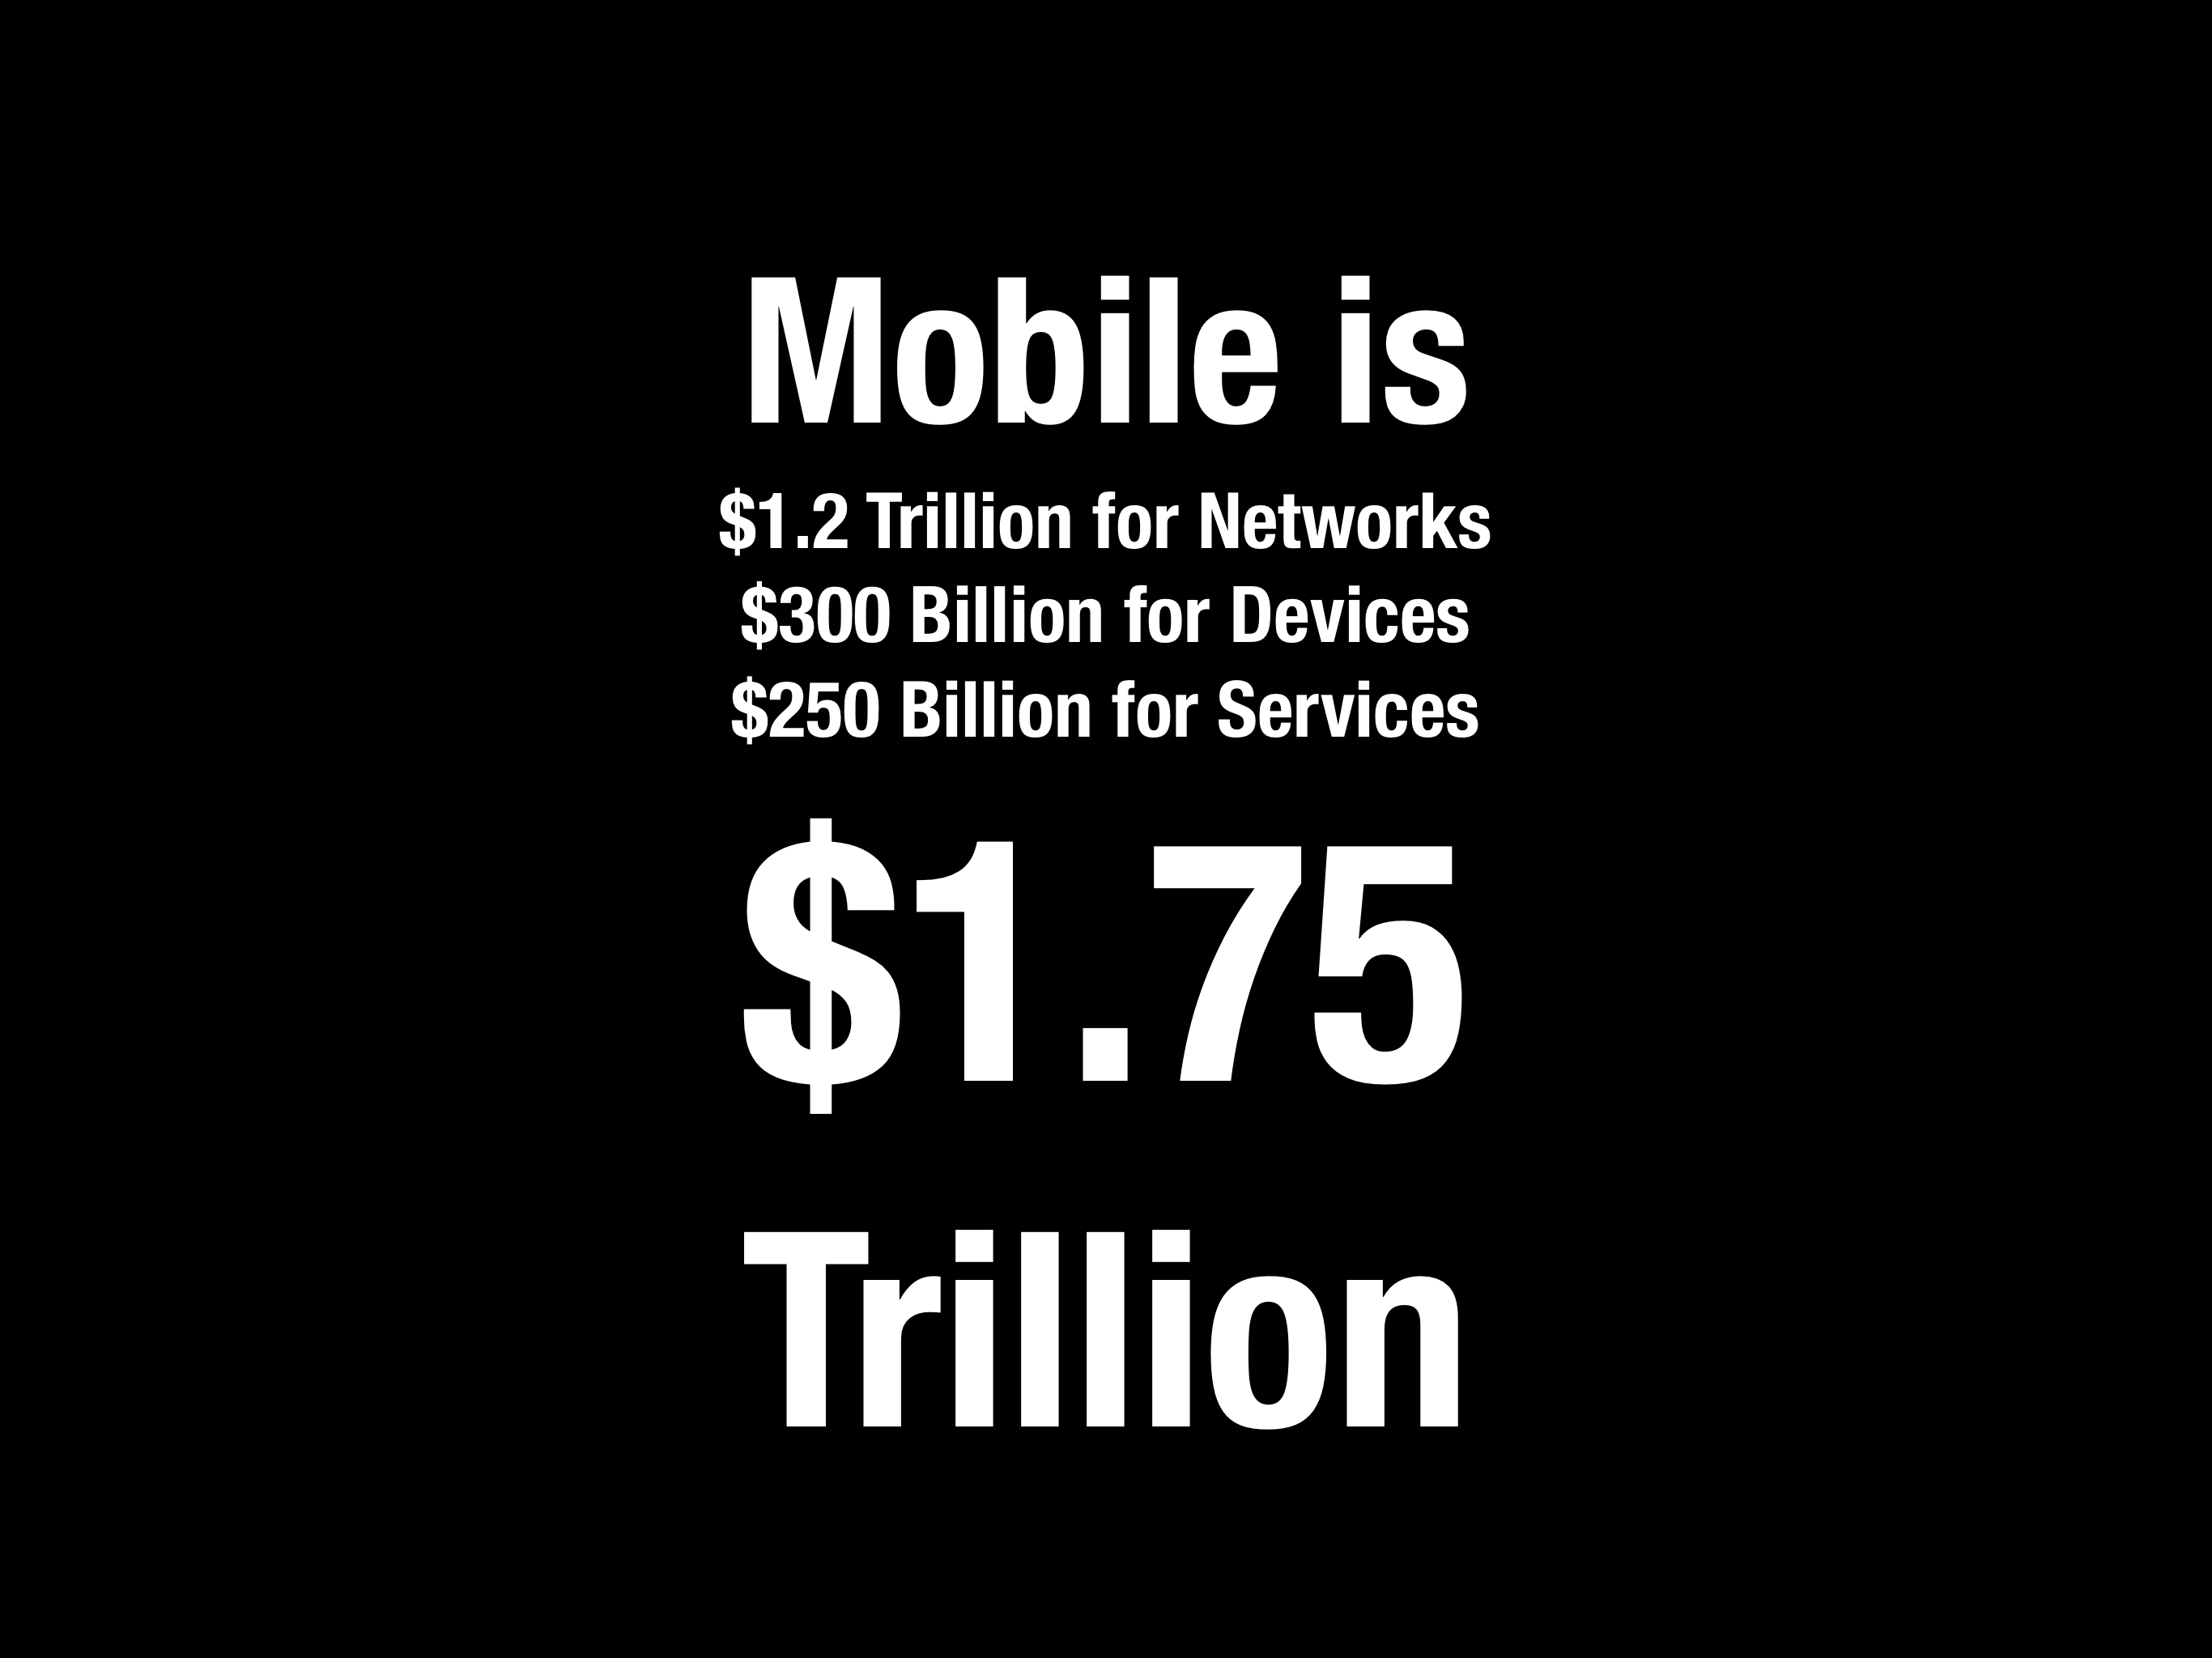
Revenues across Networks, Devices and Services 2015 to 2020 (estimated March 2016)Operating Income across Networks, Devices and Services 2015 to 2020 (estimated March 2016)Ecosystem composition (Third Party App, Native Apps, Other) 2015 to 2020, Android vs. iOS.Estimated mobile ecosystems total value by 2020 estimated in 2016.Over the top (OTT) service components by revenue model in 2015 estimated in 2016.Over the top (OTT) service components by revenue model in 2020 estimated in 2016.Allocation of OTT Revenues Across Service Types and Business Models and Platforms 2015 (estimated in 2016)Allocation of OTT Revenues Across Service Types and Business Models and Platforms 2019 (estimated in 2016)Composition of service revenues per user ($/year) for mobile platforms in 2015 (estimated in 2016)Composition of service revenues per user ($/year) for mobile platforms in 2020 (estimated in 2016)
Of course there are several potential errors in this methodology. The categories were not all inclusive. I used Social, Media, Search, Maps, email, Messaging, e-commerce, Travel, Enterprise, Storage, Transportation, Travel and Other as the top level categories. There are many products and services who would end up in Other. Moreover, these categories were anchored by the top companies in each category and the share of the top names was not always clear. Finally, the growth rates for these categories were based on historic trends which could change either way.
The online services ecosystem (all platforms) was thus estimated to be $450 billion in 2015, growing to $820 billion by 2019 and $914 billion by 2020.
The mobile split would vary by segment but would be roughly 75% by 2020 (25% would not be mobile). The final assumption was based on the split among the existing mobile platforms. I put a multiple of roughly 50% for iOS and 35% for Google Android and the rest for China Android.
Multiplying all these assumptions gave me a figure of $275 billion for the iOS portion of the global online services market in 2019. (Incidentally, Android was estimated at $207 billion and China Android $110 billion.) Note that this does not mean this was an expectation of Apple's revenues or that this was the opportunity of Apple obtaining any percentage of this revenue. It was simply the value of what would transact through iOS, a platform which would act as a commerce enabler. This was to be the size of the iOS "ecosystem" or co-dependency between Apple and the companies delivering through its platform.
Ecosystems are a powerful idea. As I recall, this term applied to mobile was coined by a Palm executive in the late 1990s when he referred to the value of all the apps built for the Palm Pilot. The biological term refers to the system of multiple species living in close proximity. It implies an equilibrium as each species benefits from the others and the environment. There might be predators and prey but biodiversity is the successful construct.
The idea of an ecosystem for a platform was also the core strength of Microsoft's Windows which created the network effects around it and it has been the goal of every platform since. The nature of computing and networking implies that these systems grow faster and are more resilient than the more traditional value networks of other businesses or industries.
Now this ecosystem was something we wished to highlight in 2016 as a core strength for Apple. It was not considered as such at the time and I thought putting a figure of $275 billion in 4 years' time was a way to highlight the potential. Time since has proven us right.
This week Apple highlighted the result of another research team who attempted to measure the iOS ecosystem. Their conclusion was that billings and sales facilitated by the Apple App Store Ecosystem in 2019 was $519 billion. More than twice the amount I had so optimistically forecast four years earlier.
The authors also emphasize that this is a conservative estimate and should serve as a baseline.
I feel partly vindicated about that figure as my attempt at a figure was intended to highlight the scope of the ecosystem and it is better to have underestimated it than overestimated it. The authors' methodology was also similar in being bottom-up summation of components by categories of services but the information available today is enhanced by the new data Apple made available on subs and Services revenues and install base.
Note that in the graph below the salient data points of subscribers (red triangles) had not begun until 2017 causing the acceleration in Services revenue (yellow line). Note also the additional square points representing install base.
This figure of more than half a trillion dollars of value transacted through iOS should give some pause. It it a very powerful figure that can be combined with the other data from Apple:
More than 1.5 billion active devices
More than 1 billion iPhone users
More than 500 million paid subscriptions
More than $1/day iPhone hardware revenues for Apple
The half-trillion per year on services implies between $335 and $520 in spending per user (likely closer to $500) per year. This would be in addition to the approximately $365/yr in hardware spending per user (which Apple books as hardware revenue). In the case of the iPhone there is yet more: the cellular network service which may average $350 per year.
To simplify, the "average Apple user" spends $1/day for each device, $1/day for the network and $1.4/day on items bought through the device. Adding a margin of error, that's between $3.4 and $4 per day each user spends. Oh, and there are about a billion such users.
The total spending enabled by iOS thus is close to $1.4 trillion/yr.
That's a significant amount. It's bigger than many industries. There are only about 12 countries with higher GDP (Spain is about the same.)
How does Apple benefit from this?
Apple captures 30% of billings through its App Store. My estimate for these billings were $67.9 billion in 2019 which means App Store billings were 13% of the 2019 ecosystem. Apple's 30% cut of Billings amounts to 3.8% for the whole ecosystem. It's hardly an oppressive number.
If Apple only captures 3.8% what use is this to Apple?
The last decade has seen Apple emerge as the world's largest company in terms of market capitalization, and not doing so with a wild multiple of revenue or earnings, quite the opposite. It did this by creating the world's greatest customer base. Not in absolute scale. Android and Facebook have larger customer bases with multiple billions of users.
No, Apple's one billion users are simply the best billion users. They are the most likely to stick with Apple and they are the most likely to buy more from Apple and—this is crucial—they are the most likely to buy everything else. Those other companies whose sales come from Apple customers have been taking note. They know that Apple customers are desirable customers and choose to target Apple customers, as much as they can. Associating your company with Apple makes a lot of economic sense.
I will admit however that my argument that Apple created a customer base is contrived. The fact is that Apple creates productsand services and those products are the root of its power to attract the right customers. By choosing to create the best products it coincidentally chooses to create the best customers. The power flows from product not from pricing or positioning. This is a lesson lost for many.
Developers and regulators might feel Apple's massive power is perhaps too much. In the last decade, the narration around Apple has shifted from Apple being perpetually "doomed" to it being too dominant. Although I'm sure there are some who will try to conflate the two declaring that dominance will inevitably result in doom, most critics of Apple went from laughing (at it) to crying (about its practices).
The argument that Apple should change its practices developed to price as it does, distribute as it does or design as it does because it was too successful or is "unfair" is getting the causality wrong. Dominance won't be altered by a few points of percentage change (on a tiny fraction of ecosystem transactions). Fairness won't be altered when there are thousands of business models and many remain to be invented. Case in point is pornography which is not permitted on the App Store but which exists in abundance thorough other access methods.
The argument is that Apple should be more generous. That it should decrease the "cut" it takes for distribution. Or that it should not enforce revenue split for the customers it exposes to others.
But this is problematic on many levels. The playing field for all developers needs to be level. The customer must be respected and access to that customer should be constrained or certainly metered. Abuses must be policed and that requires leverage.
These practices are inter-dependent and the effect multiplicative, not additive. Apple has a monopoly on iOS and on MacOS and WatchOS and iPadOS. It does this to control the experience, security and safety of the user. It's that control which created the customer in the first place. It should naturally control access to its hard-earned customers.
It does not monetize the distribution of content or apps unless the developer/creator directly charges for the product or service. Distribution is not cost free and to offer it for free is a subsidy which would create additional market and innovation disincentives. The loyalty of Apple users is evidenced by the 600 million paid subscriptions (end of year estimate) that are booked through the App Store. Developers benefit directly as a result.
One could argue that the abundance of services which don't distribute through the App Store is evidence that the system works as intended. Apple's App store front is its property and it reflects its core values.
Being on the shelf in the App Store means you operate on the terms of the shelf owner. If the rules are not agreeable then the half trillion dollars of ecosystem activity is testament to the availability of alternatives.
It's common knowledge that sell-side analyst price targets for stocks are not taken seriously. The evidence is simply that no public accounting exists for their historic performance. It would be trivial to grade performance but it seems nobody bothers to do it.
It seems strange given the attention paid and repetition of these targets in financial media. When a "note" is published with an opinion and a target price the stock price can and does actually react. But why should it if there is no accountability?
Well, not quite zero accountability. Philip Elmer-DeWitt publishes analyst estimates (example) diligently. These estimates are presumed to be 12 month targets, meaning that at the time when the estimate is published the target price is assume to be reached 12 months hence. He does grade the performance of these same analysts (and more) in predicting quarterly earnings and revenue estimates for the just-ended quarter.
But an estimate for what *just* happened in the last 90 days is a lot easier than predicting how markets will react to all the information about a company 12 months into the future.
So how hard can it be to measure performance on price targets vs. just-ended quarterly estimates?
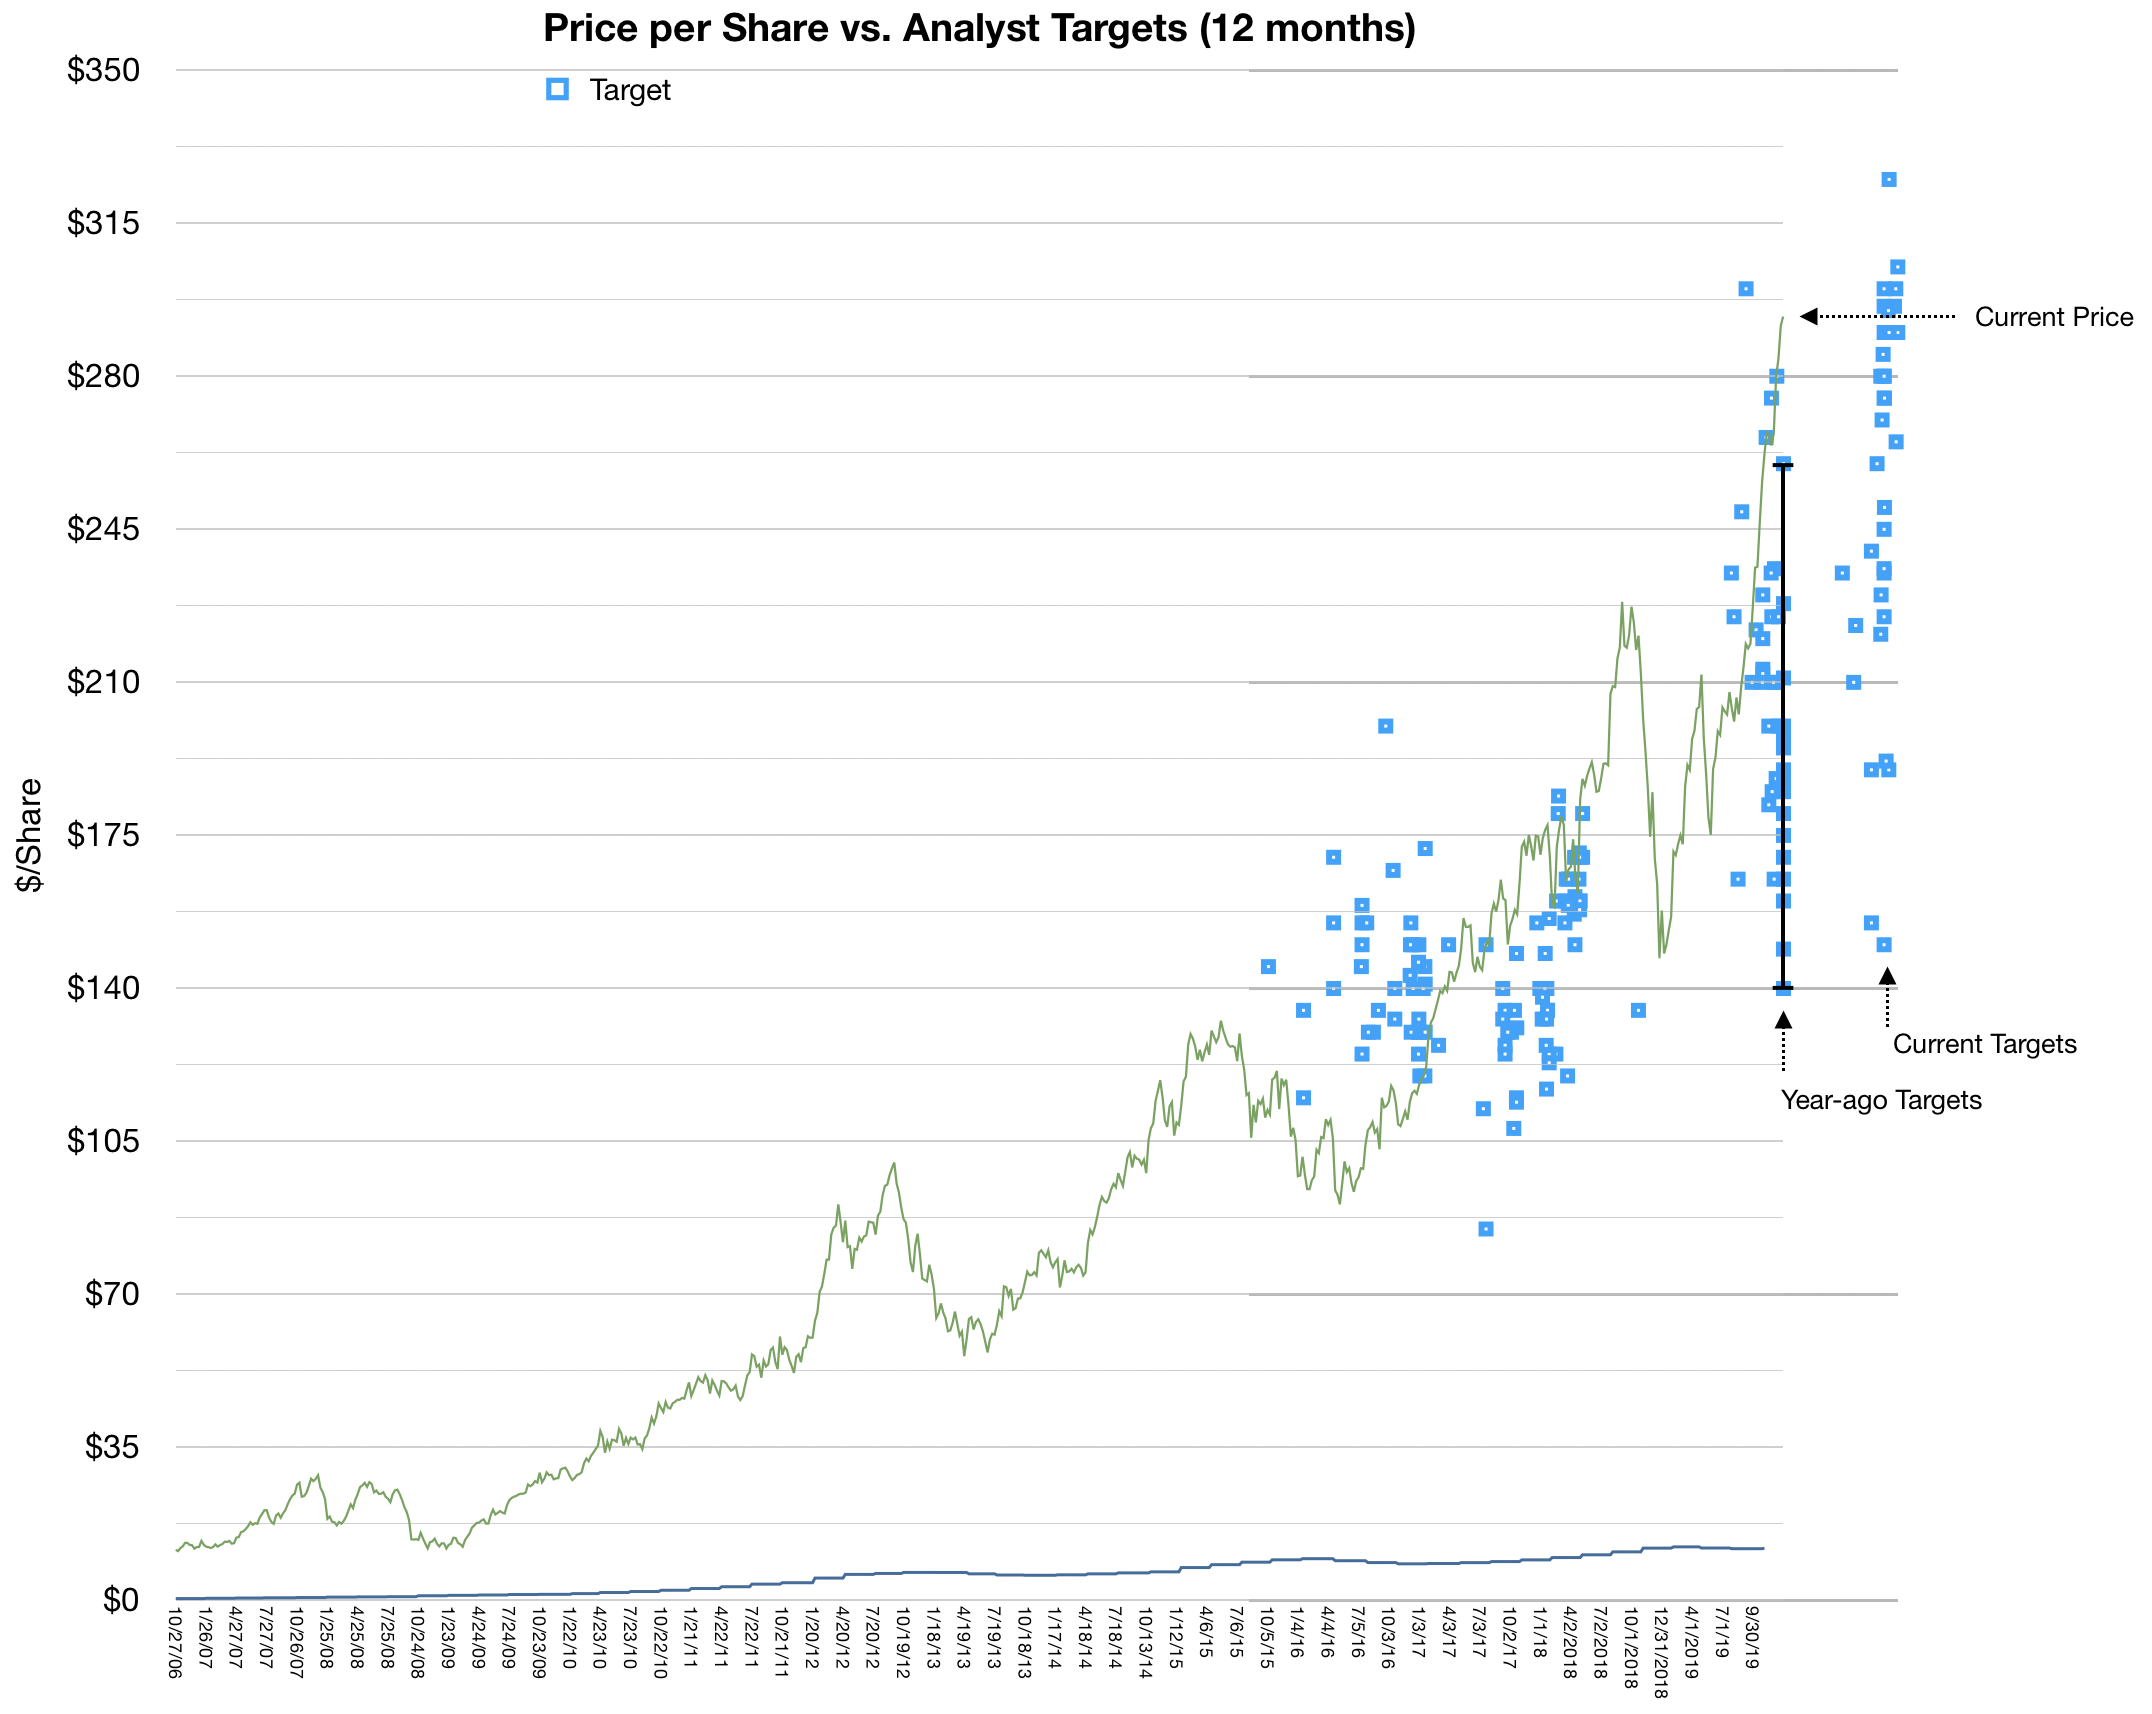
Here is my modest attempt: I note that Apple's share price today is trading around $298 per share. I also note that we can recover the estimates from analysts exactly a year ago. At that time Apple issued a rare warning that its own estimates for the fourth calendar quarter 2018, issued about 60 days earlier would be quite a bit different than what will be released (in 3 weeks).
This compelled all the analysts to re-set their targets at the same time. What we ended up is a whole batch of January 3rd 2019 estimates for, presumably, January 3rd 2020.
Well, January 3rd 2020 is tomorrow. How did the estimates hold up?
The following graph tells the story:
Apple Share Price vs. a sampling of Analyst Estimates, Past and Present.
The green line in the graph represents the closing share price at weekly intervals (from about October 2016 until last week.) The blue dots represent various estimates. Note that they are 12 months since their issuance and that since estimates can come at any time the are not easily clustered.
That is except last year and the "big reset" when the estimates all were issued on the same day. I highlighted the range with a vertical line. Note that the closing price last week was well above the highest estimate and that the lowest estimate ($140 is less than 50% of the current price).
This is quite a big fail. Errors of 50 for a 12 month time frame are egregious.
A few additional observations:
The spread or variance of estimates is enormous. Far wider than what was the case 3 or 4 years ago. (I look forward to getting more data to perform this variance analysis). It's peculiar to me that a larger, more stable business, as Apple is today, is more difficult to predict. To see even today a range in targets between $150 to $350 is bizarre.
Another observation is that very, very few targets were "accurate". That is anywhere near what actually happened. To find these rare successes, look for blue dots placed directly or near the green line. The chances of a correct target is less than what can be attributed to chance. Again, I look forward to a larger data set to see if there is any set of analysts that perform particularly well or particularly poorly.
Again, we're not describing here predictions about the stock market in general, or of macroeconomic indicators. We're talking about predicting one single company's stock price in a 12 month period. A company that receives a great deal of scrutiny and which publishes a surprisingly large amount of data about itself.
Now I don't want to suggest that there is a better way to predict share prices. I will not try to do so because although it might be easy to predict earnings based on overall company strategy, processes and team (all well known) the share price is that data multiplied by a random number called "sentiment". That sentiment can be summarized as the P/E ratio which wanders around aimlessly. I don't think I have any way to predict sentiment one second into the future, never mind one year.
But even if I don't think there is a method to the madness of sentiment, it seems dozens of people find it necessary to claim that there is one. But if you do, then analyze yourself. What did you learn from the mistakes? What is the theory you're employing?
And if you don't analyze yourself, then don't expect to be taken seriously.
At time of writing (December 12, 2019) AirPods Pro delivery wait time is over 4 weeks. It's been like this since they shipped. I tried stores in several countries and although units can make an appearance on a shelf, they sell out immediately.
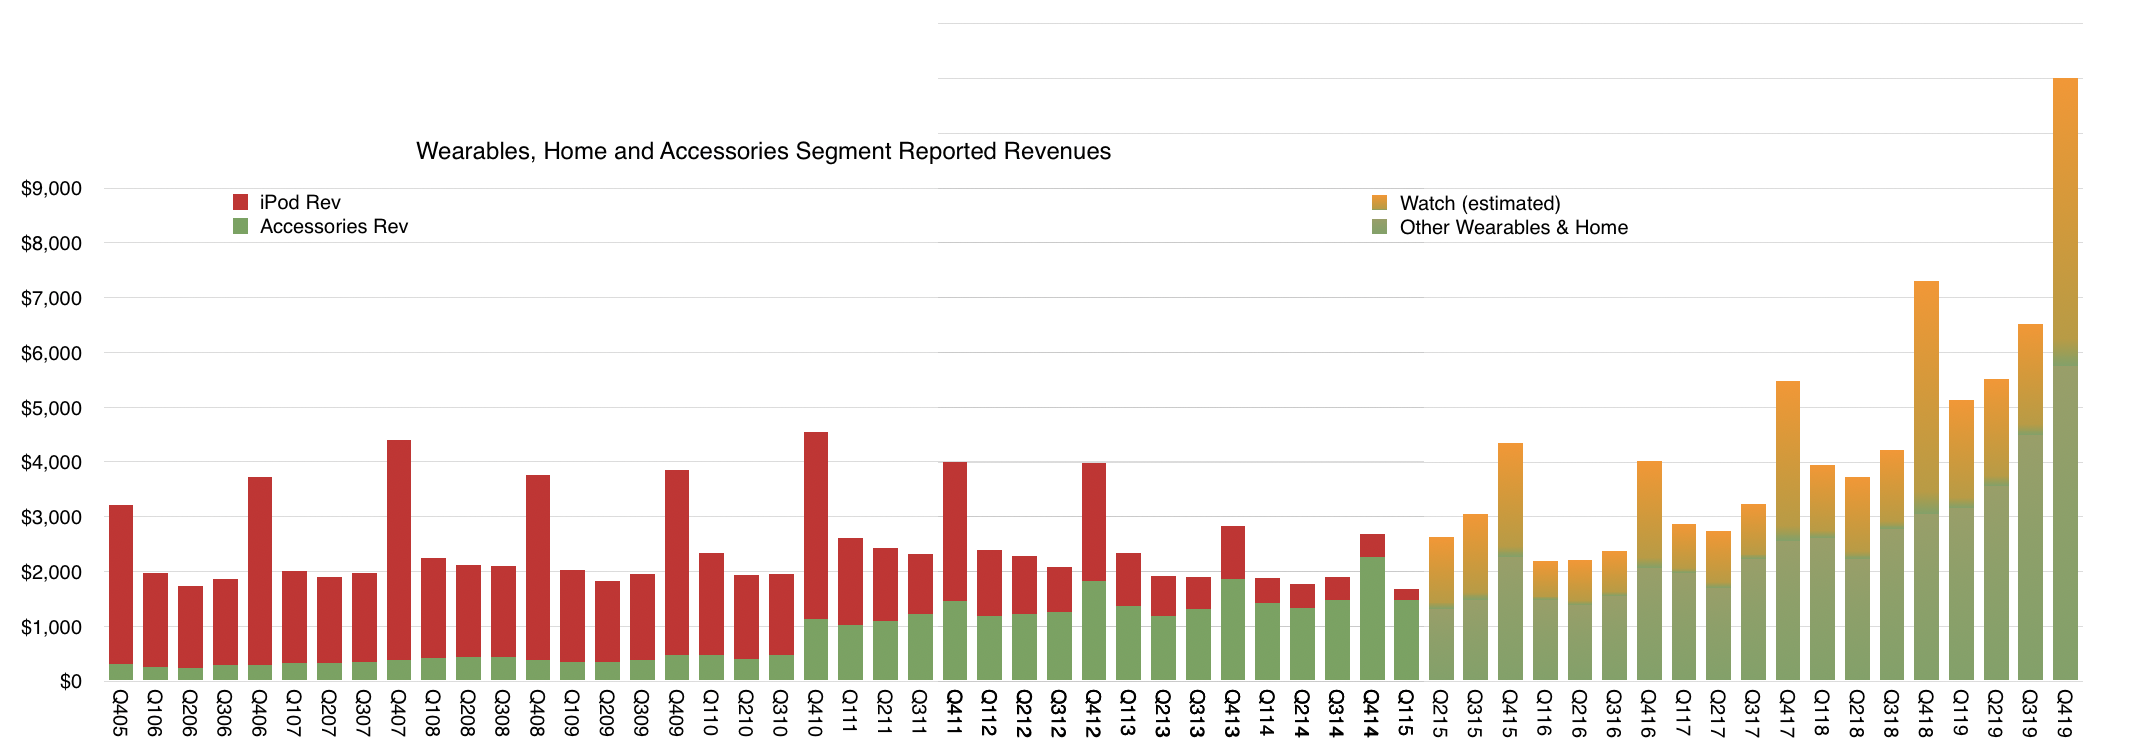
AirPods are part of the "Wearables & Home" category for Apple which used to be called Other Products and include also the Watch, iPod, Apple TV, Beats and HomePod (among other items.) iPod revenues were broken out as recently as 2015 but as the graph below shows, there have been no specifics on any product in "Wearables & Home" since then.
Wearables, Home and Accessories in a historic perspective with the iPod.
It therefore falls upon us to estimate how much of the entire category is any one product. It's been very difficult as the only clues lie in growth rates, sometimes cited for the Apple Watch and sometimes for "Wearables" alone. As far as I can tell from the available clues, the split is roughly as shown between the Orange and Green areas. Orange reflects estimate for Watch and Green everything else.
This analysis helped me conclude the Apple Watch overtook the historic "peak iPod" which occurred in the fourth quarter of 2007 at $4 billion. My Watch revenue estimate was $4.2 billion in the fourth quarter of 2018. This conclusion was confirmed by statements from the Company.
The problem lately has been that AirPods have become huge unto themselves. There is literally no information about AirPods sales as a product category. The only option is to guess Watch and subtract it from Wearables and then guess again the portion of "non-Watch Wearables & Home" that is AirPods.
Looking forward to the next quarter, I am expecting a 51% increase y/y for Wearables and 24% growth in Watch. This results in a Watch revenues about $5.2 billion and non-Watch $5.7 billion. Now if we assume $1.7 billion for non-Watch-non-AirPods (i.e. Apple TV, HomePod, Beats, iPod, other) then this quarter AirPods will have overtaken peak iPod.
Remember that iPod was the phenomenon which reset all expectations for Apple. It caused Apple to cease calling itself Apple Computer. It (at least psychologically) laid the foundation for iPhone and everything else that followed. In 2005 and through 2007 Apple was "the iPod company". I remember people working in a large search engine company calling Apple "that media company" as a result of over-intellectualizing iTunes.
(One more footnote on the AirPods Pro is that at $250 a pair and $300 for Apple Watch, throwing in a case puts these attached accessories for an iPhone at roughly the same average selling price for the iPhone of a few years ago.)
For the AirPods to overtake the iPod highlights just what a phenomenal category Wearables has become. In combination with Home and other accessories the category is going to decidedly overtake the Mac, having already passed the iPad.
And so it goes, something dismissed as inconsequential–"does not move the needle"–ends up becoming a massive force of change. The iPod was that, the original Apple II, the Mac and yes, also the iPhone. It's the asymmetry of humility that this happens over and over again.
To hear more about the profundities of AirPods Pro tune in to the next Critical Path podcast.
In June of this year Apple reported that it had paid a total of $100 billion to developers. That is the 18th such figure given in the 10 year history of App Store, making the progress of payments and hence revenue and spending easily trackable.
The other regularly reported figure is the business segment revenue where App sales are currently allocated. Now called "Services" this omnibus segment includes many other sources of revenues such as:
Digital Content (Books, Music downloads, Video downloads--including TV shows and movies and movie rentals.)
AppleCare, Apple's extended warranty service.
Apple Pay, transaction fees
Apple Pro Apps, including Final Cut, Logic Pro, Motion, Aperture
Licensing including "Made for iPhone/iPad"
One-time settlements of various lawsuits.
Other Services revenues which include
Apple iCloud-related services
Music Match
Music subscriptions
Other third party subscriptions (commissions)
Third party licenses
This combined Services segment is significant with $35 billion revenues in the last 12 months. This is quite a jump from 2016 when Services had crossed $25 billion. At the end of 2016 Apple said it expected Services revenue to double by 2020. With a growth rate since then of 25% the company is on track to reach its target one year early. ((To calibrate this consider that Facebook revenues for the last 12 months were $48 billion and it now has a market capitalization of $468 billion or 41% that of Apple whereas Services consists of about 14% of Apple's total revenues.))
Consumer spending on Apple services includes more than what it books as revenue since only the (typically) 30% of App Revenues is considered Apple's revenue. Including the payments to developers, Services generated over $65.5 billion/yr in billings. This will reach $100 billion/yr in 2 years. The difference between reported revenues and consumer spending is shown in the following graphs.
I described the visibility into App Store revenues (which is the orange area in the graphs above) but the other sub-segments of Services are much more difficult to ascertain. Of special interest is Other Services which includes very high margin services. As part of that there is a peculiar source of revenues: Google.
It's known that Google pays Apple for the default placement of Google search within Safari on iOS and Mac OS. That payment is registered by Google as a "Traffic Acquisition Cost" or TAC. TAC is essentially payment for distribution where what is granted by the distributor is access to queries (traffic.) This way Apple acts as distributor for Google. So, for that matter, does Firefox which also receives TAC payments.
What is peculiar is that the amount of TAC paid by Google to Apple is becoming staggering.
A few years ago Google was paying over 20% of its revenues as TAC. Recently that ratio rose to 23%. Bernstein analyst Toni Sacconaghi estimated that Google paid Apple $1 billion in 2014 as TAC and that payments to Apple were about $3 billion in 2017. Now Goldman Sachs analyst Rod Hall estimates Google could pay Apple $9 billion in 2018, and $12 billion in 2019.
This is starting to look interesting but is it believable?
My own estimate of Apple's Other Services (which includes TAC revenues) is a run rate of $15 billion for calendar 2018. This makes $9 billion (60%) from Google quite challenging but not impossible. The remaining $6 billion needs to account for Apple's own cloud and subscription service revenues.
Does this make sense given Google's spending? TAC payments to distribution partners in Q2 were $3 billion. The $9 billion/yr assumption implies a $2.25B/quarter payment to Apple. That would be 75% of Google's distribution costs. That also sounds reasonable given the high utilization of iOS relative to any other platform.
An increase to $12 billion for next year is also quite a claim but it certainly is possible. I don't have a basis for making this estimate but the assumption of growth leads me to conclude that the payments are tied to actual traffic generated.
In other words the two companies have an agreement that Apple is paid in proportion to the actual query volume generated. This would extend the relationship from one of granting access for a number of users or devices to revenue sharing based on usage or consumption.
Effectively Apple would have "equity" in Google search sharing in the growth as well as decline in search volume.
The idea that Apple receives $1B/month of pure profit from Google may come as a shock. It would amount to 20% of Apple's net income and be an even bigger transfer of value out of Google. The shock comes from considering the previously antagonistic relationship between the companies.
The remarkable story here is how Apple has come to be such a good partner. Both Microsoft and Google now distribute a significant portion of their products through Apple. Apple is also a partner for enterprises such as Salesforce, IBM, and Cisco. In many ways Apple is the quintessential platform company: providing a collaborative environment for competitors as much as for agnostic third parties.
The first number that Tim Cook mentioned in the fourth quarter investor conference call was the number of active Apple devices. The 1.3 billion monthly active devices is the most important measure of the health of Apple's business. It's the primary way the company chooses to measure itself and it's the best instrument available to understand the company's strategy.
This is only the second time this number was revealed. The previous figure, given in January 2016, was 1 billion active devices. Thus, while Apple sold 586,744,000 devices ((This is an estimate that includes Macs, iPhones, iPads and Apple Watch but does not include Apple TV or accessories such as AirPods.)) the number of active devices increased by 300,000,000. While the number of units sold is frequently updated and attracts a lot of attention, the number of units active is very infrequently updated and attracts little attention. Yet the number of active devices speaks of the future of the company and should be carefully scrutinized while the number of devices sold speaks of the past and should be cursorily glanced at.
Dr. Edward Deming once said that the numbers that best define a company are two factors that do not appear on any financial statement. These factors are the value of a satisfied customer and the value of a dissatisfied customer. These factors must be multiplied by every other number in a financial statement in order to assess the prospects of the business. A high satisfaction leads to repeat purchases and referrals, growing the business; while a low satisfaction leads to ending relationships and a repulsion of potential new customers.
These numbers determine everything about the future and nobody quite knows what they are.
It's tempting to suppose that, by asking, you can find out if customers are satisfied. Certainly the company cites these answers to the question of satisfaction and it's partially useful to have some data. But customers are people and people are social beings. They are flawed in that they want to be liked and will use their powers of deduction to determine whether what they say will lead to their being liked more. Thus they will say things which they judge the listener will want to hear.
This auto-suggestion is especially likely when the answer (satisfaction) is so difficult to ascertain and the feeling is so fleeting.
You can't rely on surveys alone to know if people like your product. You have to base that number on what they do.
This is where the active device data comes in.
A liked product will be used and a well-liked product will be used more. Usage is valuable not just in its intensity but also in its duration. When you see activity of a device it's always a good sign if that is both frequent and long-lasting.
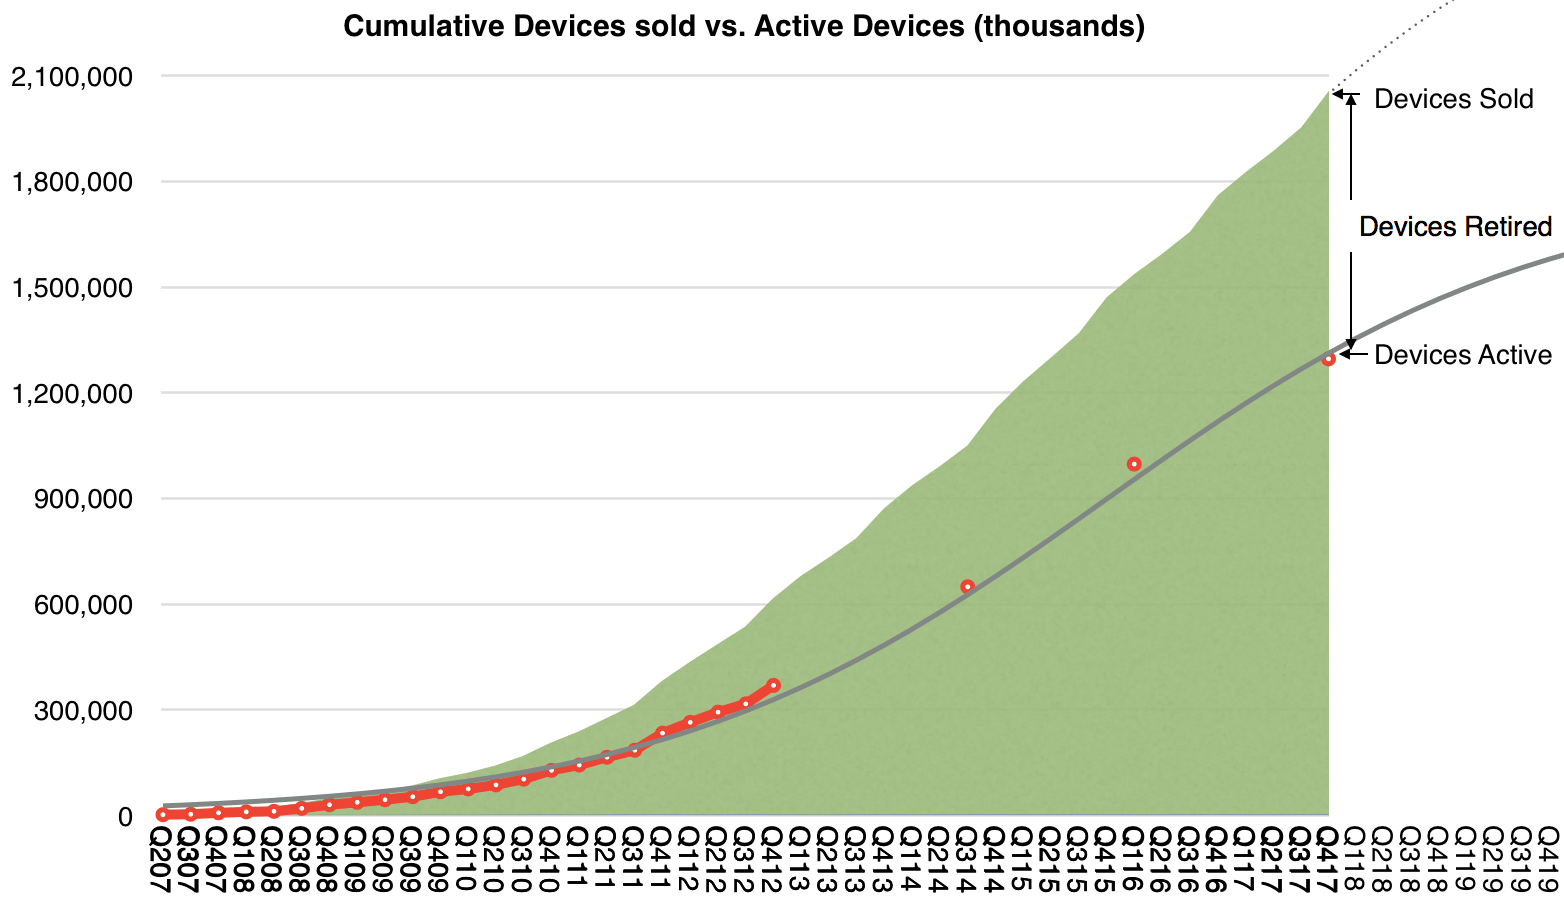
The following graph shows the history of cumulative devices sold by Apple since mid-2007, when the iPhone was launched. That total is now 2.05 billion devices. I have added early estimates on the number of active devices (in red) based on assumptions about product life-span. I added the company's own reported figures since then.
I then tried to paint a continuous curve for this active number using a logistic function which assumes a diffusion into a population of addressable users, shown as the grey line above. The logistic curve is a good tool because it has a solid theoretical foundation in social behaviors.
The formula for this line is S÷(1+EXP(−1×(t−o)÷g)) where S is the point of saturation or maximum population size, t is the period or count of quarters (1 for Q1 2007 and 2 for Q2 2007, etc), o is the offset to 50% or the point of inflection, in quarters, and g is the growth factor.
The S-curve above corresponds to S=1.8 billion, o=35 and g=8.
I chose these parameters because they best fit the data. It does not mean the reality will be precisely this but this is the best guess so far. It implies that there will be about 1.8 billion active devices sometime close to 2022 and tells us how we get there. This can and will change but for now this is the best guess using a theory that has worked in similar circumstances.
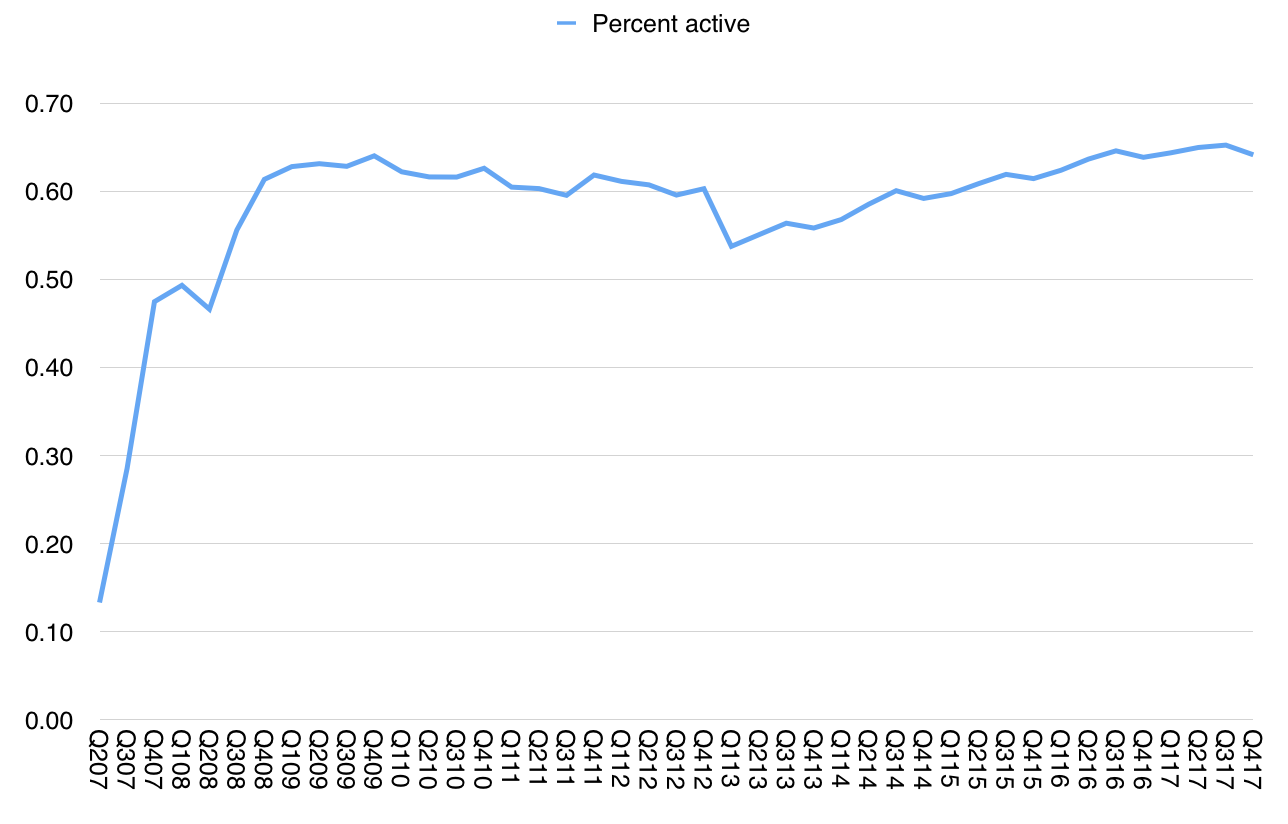
Working backwards from this active base estimate, we have predictive power on units sold, and even on revenues. However this is not the whole story. It's not even the main story. What matters is what it tells us of the relationship between past behavior (purchases) and future behavior (use, referral, repeat purchase). This is hinted at by the ratio between purchases and active devices. In other words, the ratio between cumulative units and active units tells us whether the products are used and for how long. Having a continuous estimate of active uses allows for a reliable measure of satisfaction.
The following graph shows this estimate.
Note that the ratio remains remarkably constant. It's currently about 64%. It's so constant that perhaps we can invent a rule of thumb which says that two out of every three devices ever sold by Apple is still in use. And that this rule is always true.
This begins to be interesting.
The staying power and predictability of the business ((i.e. Free cash flow)) comes from a guarantee that activity is rigidly tied to purchase.
This speaks more than any satisfaction survey. It's a measure of actions based on interaction rather than words based on human frailty.
There is no better number available to predict Apple's business.