Asymco

Asymmetric Intelligence

estimate

  1. Apple Remarks to Investors in FQ1 2018 Earnings Conference Call, Categorized and Annotated

    Conference · 149 comments

    The following is a transcript of the comments from Tim Cook (CEO) and Luca Maestri (CFO) at Apple's Q1 2018 Earnings Conference Call February 1, 2018. I color coded my interpretation of the comments into four categories:

    • Grey: Background and promotional commentary
    • Red: Strategy and signals of what management considers important and may include data beyond the regularly reported numbers.
    • Green: Financial data
    • Black: Commentary.
    • Blue: My commentary, in brackets.

    For a quick read of Apple's strategy, read the Red text. These comments are not repeated in financial reports. Highly recommended.

    For a quick read of Apple's financial performance, read the green text (which are replicated in financial reports). Read this if you don't want to wade through the financial reports.

    For marketing or product material, read the grey text.This is sometimes unique but also repeats product launch information.

    ----
    Tim Cook:  Thanks, Nancy and thanks everyone on the call, and welcome to everyone today. Before we dive into the quarter, I'd like to take a moment to talk about a significant milestone we recently crossed.

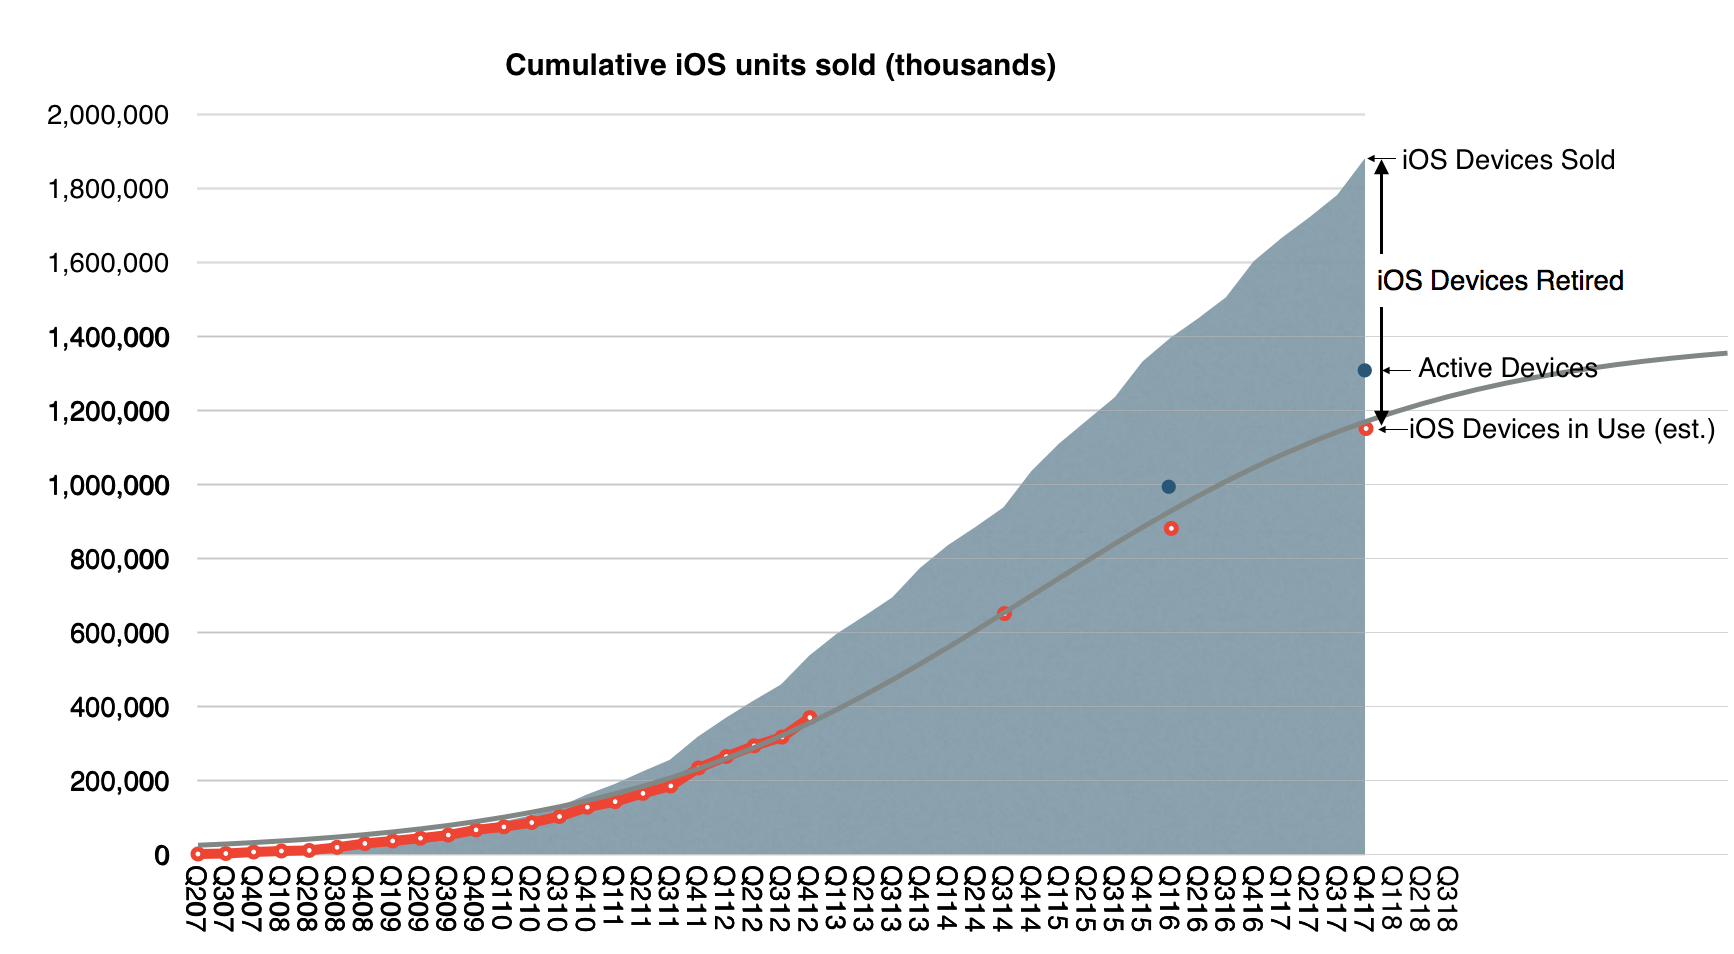
    Apple's active installed base reached 1.3 billion devices in January and is at an all-time high for all of our major products. 1.3 billion devices represents an astonishing 30% growth in just two years. It speaks to the strength and reliability of our products and our ecosystem, as well as the loyalty, satisfaction and engagement of our customers. It's also fueling tremendous growth in our services business, which I’ll talk about a little later in the call. [This is probably Apple's most important number. For at least the next 20 years this is the key performance metric and it can be used to derive company's valuation. A summary of the history of active devices vs. units sold is shown in the graph below:]
    Turning to the December quarter. We're thrilled to report Apple's biggest quarter ever, which set new all-time records in both revenue and earnings. We generated revenue of $88.3 billion, which is above the high-end of our guidance range, and it is up almost $10 billion or 13% over the previous all-time record we set a year ago.

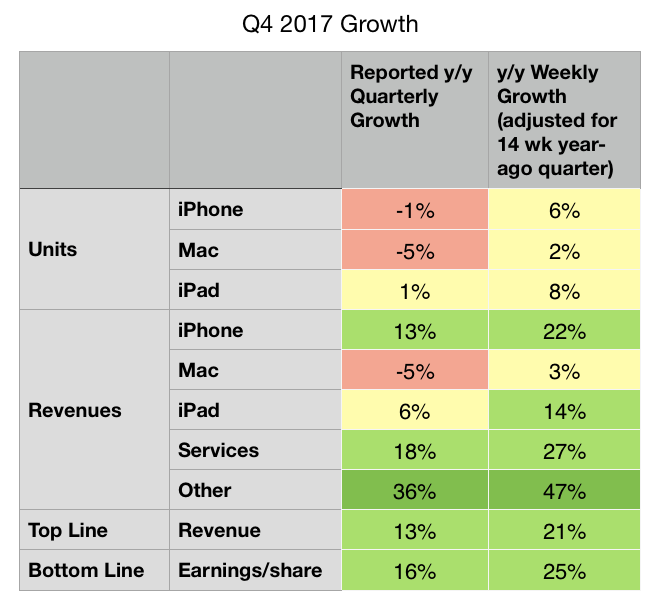
    It's also our fifth consecutive quarter of accelerating revenue growth with double digit growth in each of our geographic segments around the world. What makes us even more remarkable is that the quarter we're reporting today was 13-weeks long, while the year ago quarter was 14-weeks. When we look at the average revenue per week in the December quarter this year compared to last year, our growth was a stunning 21%. [The 13-week vs. 14-week year-on-year comparison is repeated several times. The summary differences are shown in the table below:] 
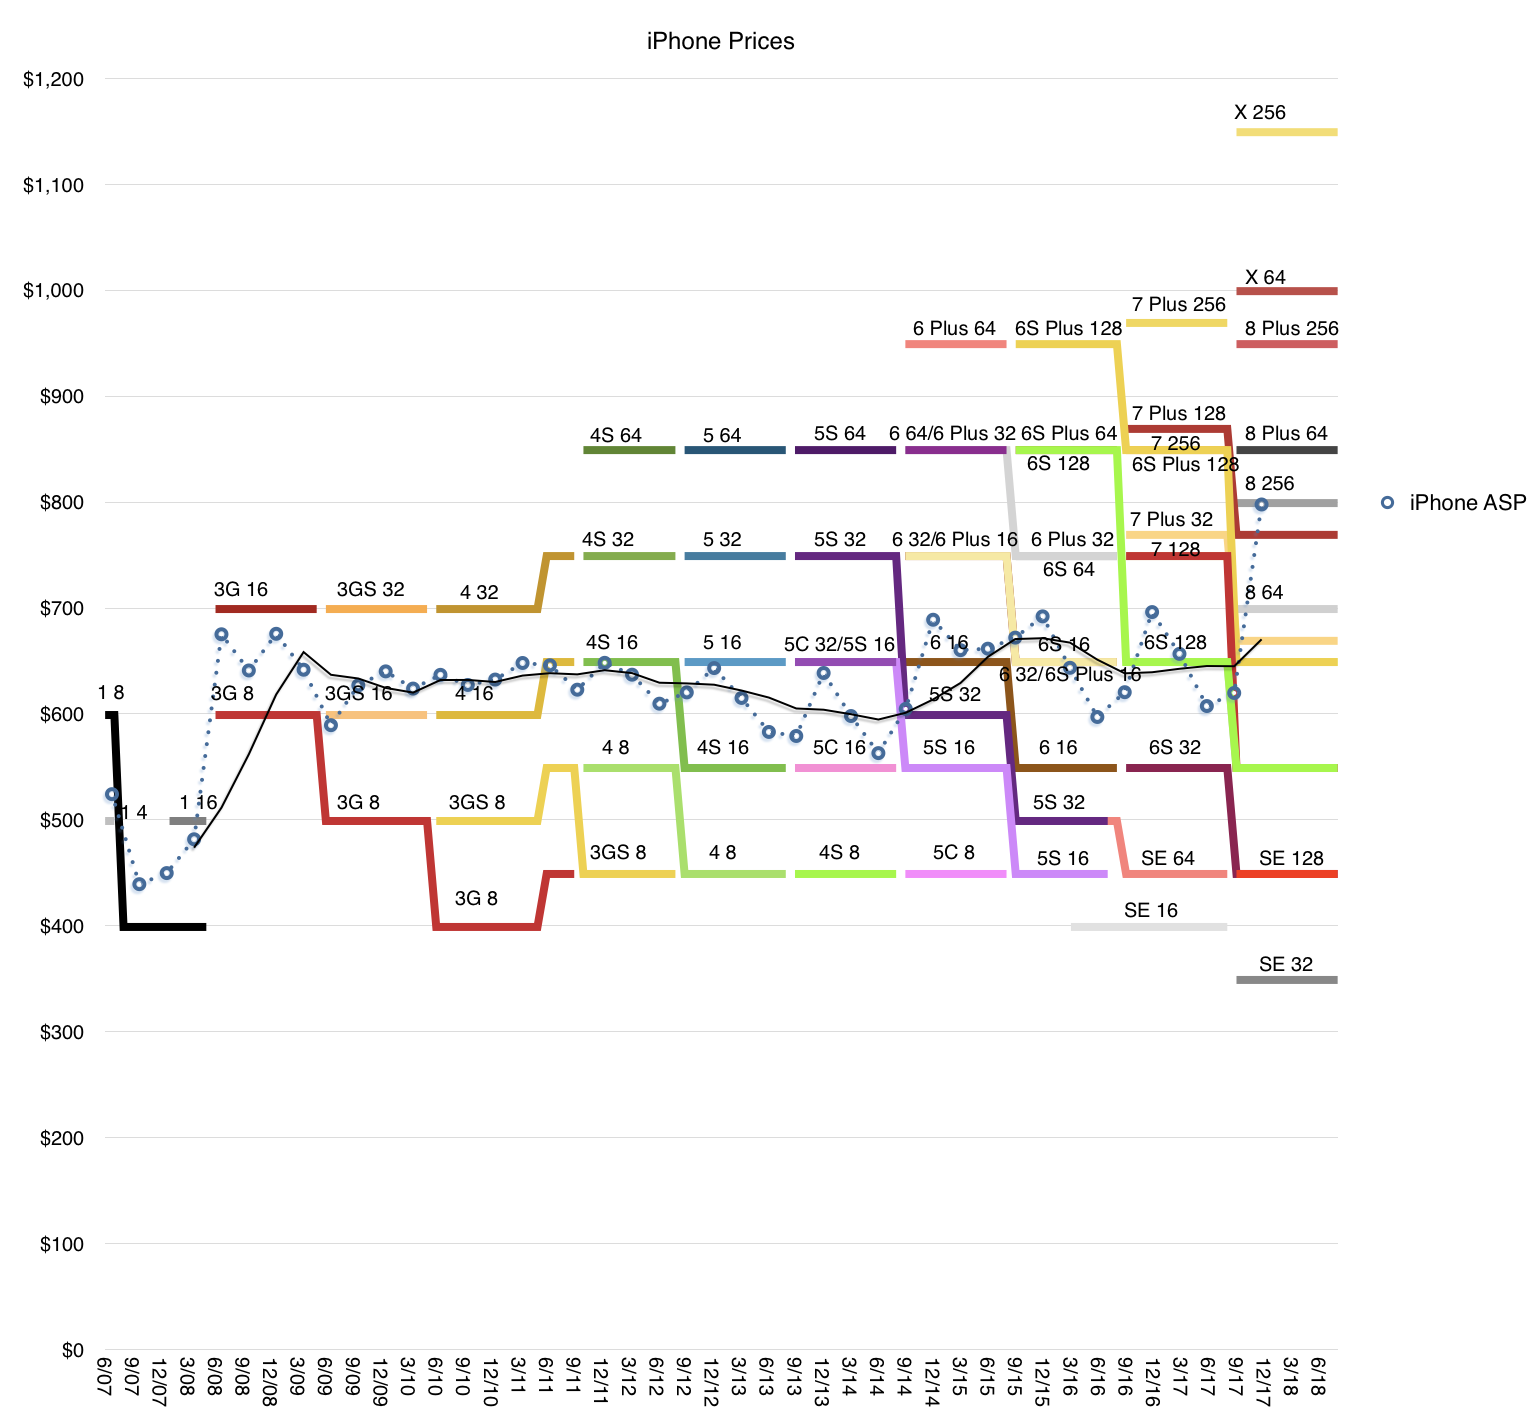
    Our growth was broad-based and a key driver was iPhone, which generated its highest revenue ever. iPhone X was the best-selling smartphone in the world in the December quarter according to Canalys, and it has been our top selling phone every week since it launched. iPhone 8 and iPhone 8 Plus rounded out the top three iPhones in the quarter. In fact, revenue for our newly launched iPhones was the highest of any lineup in our history, driving total Apple revenue above our guidance range. [The iPhone X is a huge hit. It drove the average selling price $100 higher y/y. This is not only unprecedented for Apple but for the entire Industry. The average smartphone sells for less than $300 while iPhones sold for $800. The gap is widening. The following graph shows the product mix and the average resulting price.] 
    I want to take a moment to recognize the tremendous amount of work that went into creating iPhone 10. Our teams carried out an extremely complex launch from both an engineering and operations perspective, executing an outstanding product ramp that required years of research and development; one that introduced innovative features like an edge-to-edge Super Retina Display and the TrueDepth Camera, which enables face ID. Our customers love these new features and the new gestures like simply swiping up from the bottom, which make using iPhone even more intuitive and enjoyable.

    Our team has put the technology of tomorrow in our customers’ hands today, set a standard for the next decade of smartphones and we are very proud of their achievements.

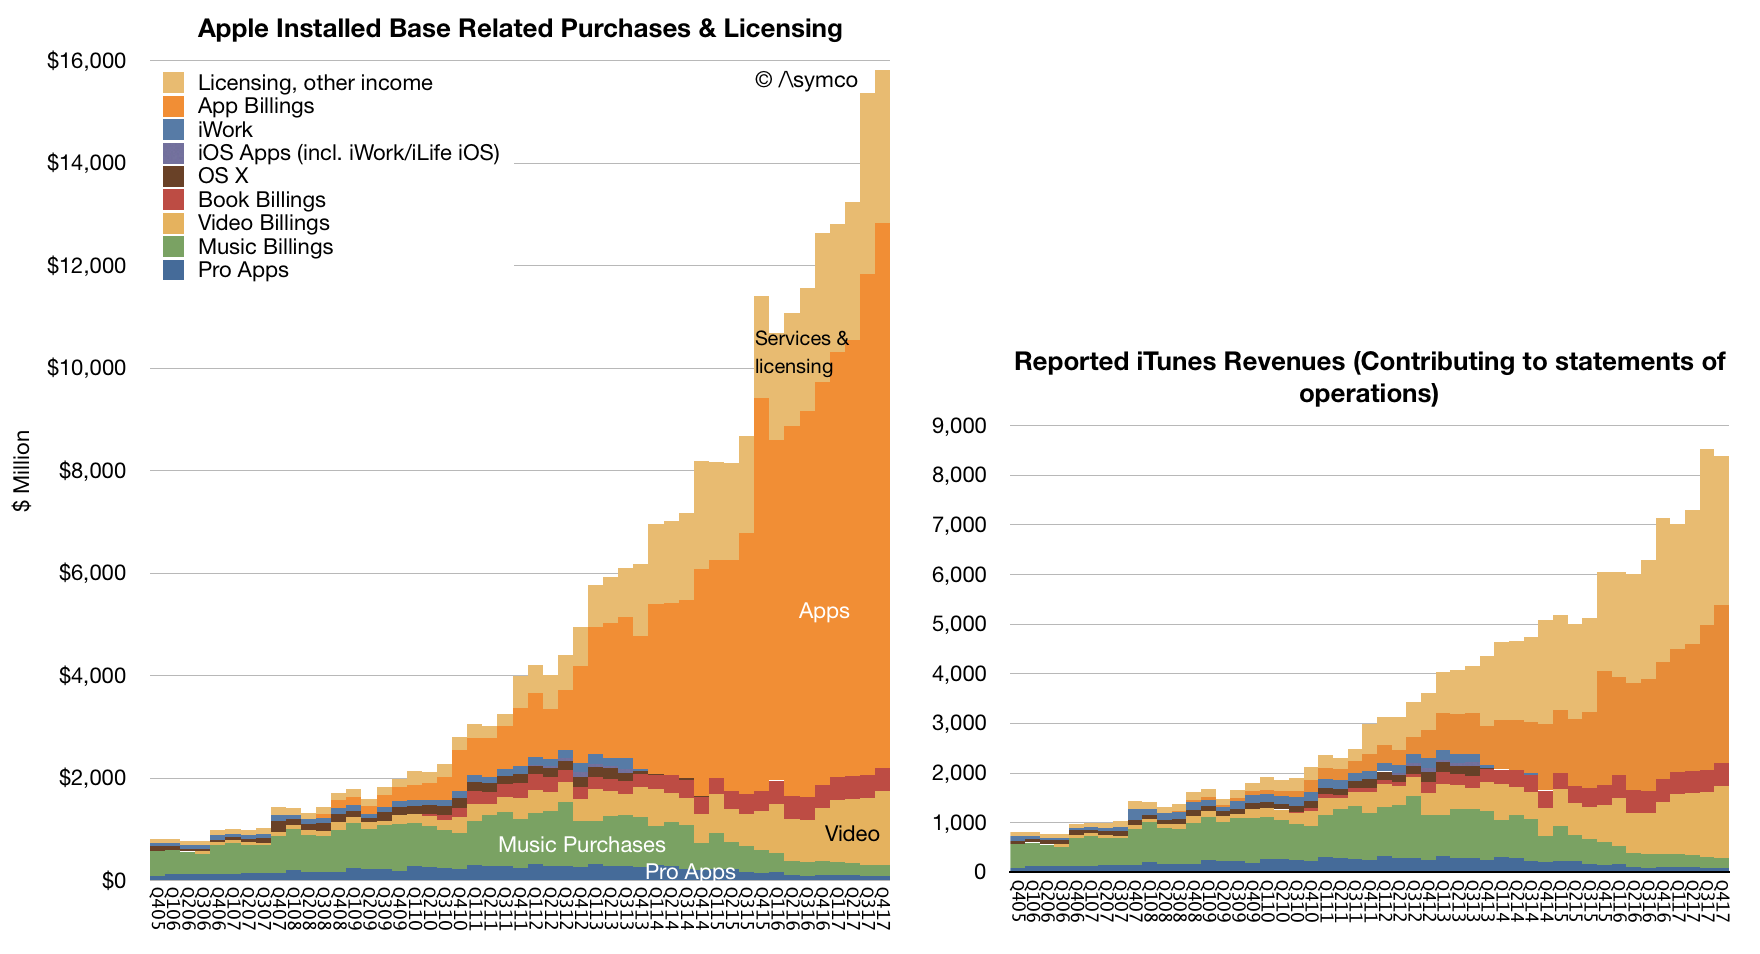
    It was another very strong quarter for services with revenue of $8.5 billion, up 18% over last year, and we’re on pace to achieve our goal of doubling our 2016 services revenue by 2020. The number of paid subscriptions across our services offerings passed 240 million by the end of the December quarter, that’s an increase of 30 million in the last 90 days alone, which is the largest quarterly growth ever. [Services has been growing relentlessly for over a decade. This steadiness of growth makes is a juggernaut. Apple is increasingly speaking about subscriptions as the key metric and 240 million is reaching record territory. The rise of Services is shown below (both revenues and consumer spending.)]
    We had an all-time record quarter for the App Store with our best holiday season ever. We’re seeing great excitement around augmented reality with customers now enjoying over 2,000 ARKit enabled app, spanning every category in the App Store. In December, when Pokémon GO released its new augmented reality features built with ARKit, it jumped the top of the App Store charts. Last week, on a stop in Toronto, I met developers who are hard at work on creative applications using ARKit from art appreciation to ecommerce, and I was very impressed with what I saw.

    Just for months after ARKit launched to the public, we’ve already released ARKit 1.5 in beta to developers around the world, and the response has been tremendous. Augmented reality is going to revolutionize many of the experiences we have with mobile devices. And with ARKit, we’re giving developers the most advanced tools on the market to create apps for the most advanced operating system running on the most advanced hardware. This is something only Apple can do.

    In addition to the App Store, several other services had their biggest quarter ever, including Apple Music, iCloud and Apple Pay, all of which saw growth in both active users and revenue.

    Apple Pay has reached an important milestone in the U.S. As a result of 50% year-over-year growth in merchant adoption, it’s now accepted at more than half of all American retail locations, which includes more than two-thirds of the country’s top 100 retailers. Now available in 20 markets, global Apple Pay purchase volume more than tripled year-over-year and we’re delighted to be expanding to Brazil in the coming months. [There are no absolute data points on Apple Pay but we do have some scattered growth data. The US data is cited here but in my experience it's more popular in select countries like UK where users are using it habitually]

    Today, you can use Apple Pay to take the subway in Guangzhou, China, see a concert at London’s Wembley Stadium or buy a souvenir in Yosemite National Park. In the U.S., we launched Apple Pay Cash in December, and it’s off to a terrific start. Millions of people are already using it to send and receive money with friends and family quickly, easily and securely; to split a bill, pay someone back, or send last minute gift right from the messages app.

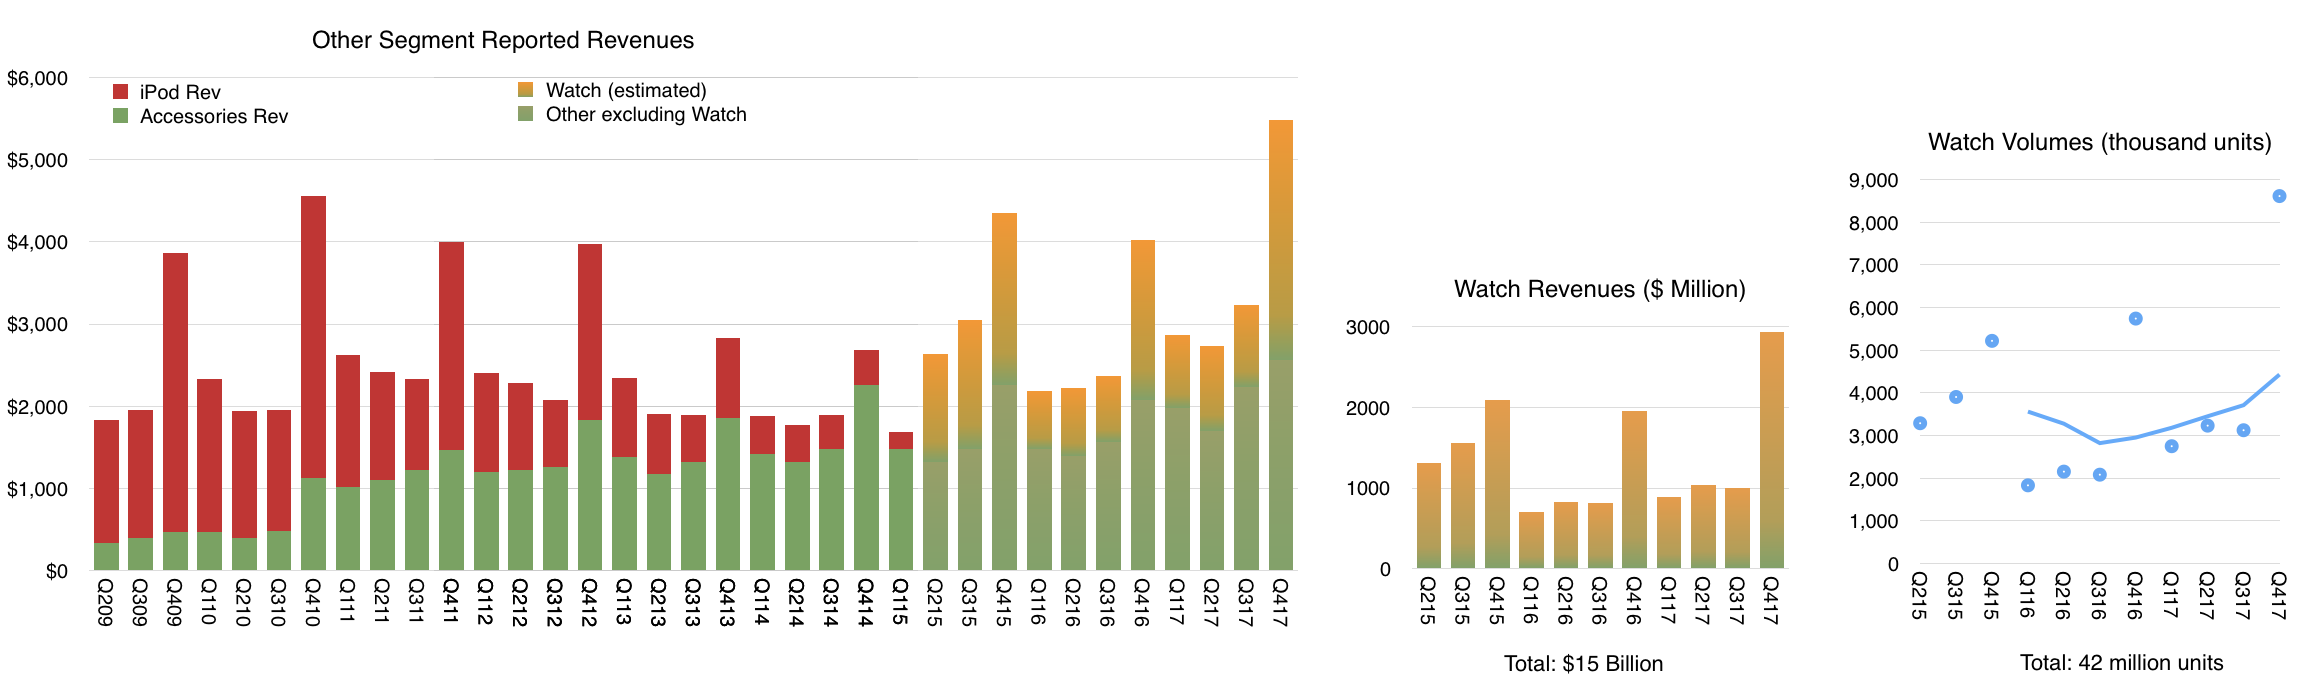
    It was our best quarter ever for the Apple Watch with over 50% growth in revenue and units for the fourth quarter in a row and strong double-digit growth in every geographic segment. Sales of Apple Watch Series 3 models were also more than twice the volume of Series 2 a year ago. Apple Watch is the most popular, smart watch in the world and gained market share during the quarter based on the latest estimates from IDC. [Apple Watch is growing consistently. The following graph shows my estimates of volume (total 42 million to date) and revenues (total $15 billion) based on all available data and commentary from management.]
    It was the third consecutive quarter of growth for iPad revenue, thanks to the strength of both iPad and iPad Pro. Based on the latest data from IDC, we gained share in nearly every market we track with strong outperformance in emerging markets.

    Worldwide, almost half of our iPad sales were the first-time tablet buyers are those switching to Apple, and that’s true in some of our most developed markets, including Japan and France. In China, new and switching users made up over 70% of all iPad sales.

    For Mac, we launched the all new, iMac Pro in mid-December. It’s an entirely new product line designed for our Pro users who love the all-in-one design of iMac and require workstation class performance. It's the fastest, most powerful Mac ever, delivering incredible computational power, for simulation and real time 3D rendering, immersive VR and complex photography audio and video projects. Worldwide, 60% of our Mac sales were the first time buyers and switchers and in China, that number was almost 90%.

    We're looking forward to getting HomePod in customers’ hands beginning next week. HomePod is an innovative wireless speaker, which delivers stunning audio quality wherever its placed in the home, thanks to the advanced Apple engineered hardware and software.

    Together with Apple Music, HomePod gives you instant access to one of the world's largest music catalogs. And with the intelligence of Siri, it’s a powerful assistant you control through natural voice interaction. We're very happy with the initial response from reviewers who've experienced HomePod ahead of its launch, and we think our customers are going to love this new product.

    We believe one of the key issues of the 21st century is education. And because of that, we've strengthened our commitment and investment into initiatives like everyone can code. To find the innovators of the future, we need to nurture the students of today. Our App Development with Swift curriculum, which is available free on iBooks, has been downloaded more than 1.2 million times worldwide with almost half of those coming from here in the United States. It’s also being taught in dozens of community colleges across the country, putting practical skills in the hands of today’s jobs seekers.

    I was in London two weeks ago as we announced that the program was expanding to more than 70 colleges and universities in Europe. Millions of students around the world will have the opportunity to add Swift to their coding vocabulary and gain skills that are essential for today’s economy.

    This is an exciting time at Apple and with the best lineup of products and services we've ever had and a set of initiatives that show how business can be a force for good in the world. We could not be more excited about our future.

    Now, for more details on the December quarter results, I'd like to turn over the call to Luca.

    Luca Maestri: Thank you, Tim. Good afternoon, everyone. Our business and financial performance in the December quarter were exceptional, as we set new all-time records for revenue, operating income, net income and earnings per share.

    Starting with revenue, we’re reporting an all-time record, $88.3 billion, up nearly $10 billion or 13% over the prior record set last year. It is our fifth consecutive quarter of accelerating revenue growth. As you know, the December quarter a year ago spanned 14-weeks compared to 13-weeks this year, which is important to consider as we have set the underlying performance of our business this year. When we look at average revenue per week, our growth rate was even higher at 21% with growth across all product categories for the third consecutive quarter.

    Our results were terrific all around the world with double digit revenue growth in all our geographic segments, an all-time quarterly record in the vast majority of markets we track, including the U.S., Western Europe, Japan, Canada, Australia and Korea, as well as Mainland China, Latin America, The Middle East, Central and Eastern Europe, and India.

    In Greater China, we were very happy to generate double digit revenue growth for the second quarter in a row and in emerging markets outside of Greater China, we saw 25% year-over-year growth.

    Gross margin was 38.4% at the high end of our guidance range. Operating margin was 29.8% of revenue. Our net income was $20.1 billion an all-time record, and up $2.2 billion over the last year. Diluted earnings per share were $3.89 also an all-time record and cash flow from operations was very strong at $28.3 billion.

    During the quarter, we sold 77.3 million iPhones, the highest number ever for a 13-week quarter. Average weekly iPhone sales were up 6% compared to December quarter last year with growth in every region of the world despite the staggered launch of iPhone 10. We established all-time iPhone revenue record in nearly every market we track with double-digit growth in all of our geographic segments. iPhone ASP increased to $796 from $695 a year ago, driven primarily by the launch of iPhone 10 and the success of iPhone 8 and 8 Plus.

    We exited the December quarter towards the lower end of our target range of five to seven weeks of iPhone channel inventory with less than 1 million more iPhones in the channel compared to the December quarter a year ago, in line with our growth in average weekly unit sales. Customer interest and satisfaction with iPhone are very, very strong for both consumers and business users.

    The latest data from 451 Research indicates U.S. customer satisfaction ratings of 96% or higher across iPhone models. In fact, combining iPhone 8, iPhone 8 Plus and iPhone 10, consumers reported an amazing 99% satisfaction rating. And among business customers planning to purchase smartphones in the next quarter, 77% planned to purchase iPhone. Our customers are also incredibly loyal with Kantar's latest U.S. research, reflecting a 96% iPhone loyalty rate, the highest ever measured. [Customer satisfaction is the second most important figure after active user base. Combining these two figures yields the recurring revenue value of the company. Remember what Deming said: the most important measurements for a company's value are the multipliers of a satisfied customer and a dissatisfied customer--these numbers never appear on any financial report but they are applied to all the numbers on every report].

    Turning to services. We had a terrific quarter with revenue of $8.5 billion, up 18% year-over-year and up 27% in terms of average revenue per week; that is an acceleration to the 24% services growth run rate that we experienced in the September quarter.

    The App Store set a new all-time revenue record. The Store’s all-new design is off to a fantastic start with quarterly store visitors, transacting accounts and paying accounts, reaching new all-time highs. During the week beginning December 24th, a record number of customers made purchases or downloaded Apps from the App Store, spending over $890 million in that seven-day period, followed by $300 million in purchases on New Year’s day alone.

    And according to App Annie’s latest report, the App Store continues to be the preferred destination for customer purchases by a very wide margin, generating nearly twice the revenue of Google Play. Across all our services offerings, paid subscriptions reached $240 million with growth of 58% over last year and they were a major contributor to the overall strong growth in services revenue. [Apple has half the user base of Google Android. This is based on Google's May 2017 report of 2 billion active devices vs. the 1.3 billion that we just got from Apple. And yet these users collectively spend twice as much on apps. This ratio of "half the users, twice the spending" has been cropping up in individual developer anecdotes and can also be seen in other metrics of engagement and consumption. This should not be surprising as it conforms to the Pareto distribution of economic value.]

    As Tim mentioned, it was our best quarter ever for Apple Watch. And when we add to this us from Beats and AirPods, our total revenue from wearables was up almost 70% year-over-year. In fact, wearables were the second largest contributor to revenue growth after iPhone, which is impressive for a business that started only three years ago. In total, our other products category set a new all-time record with quarterly revenue exceeding $5 billion for the first time. [Wearables now includes more than watches but watches are likely still the dominant product.]

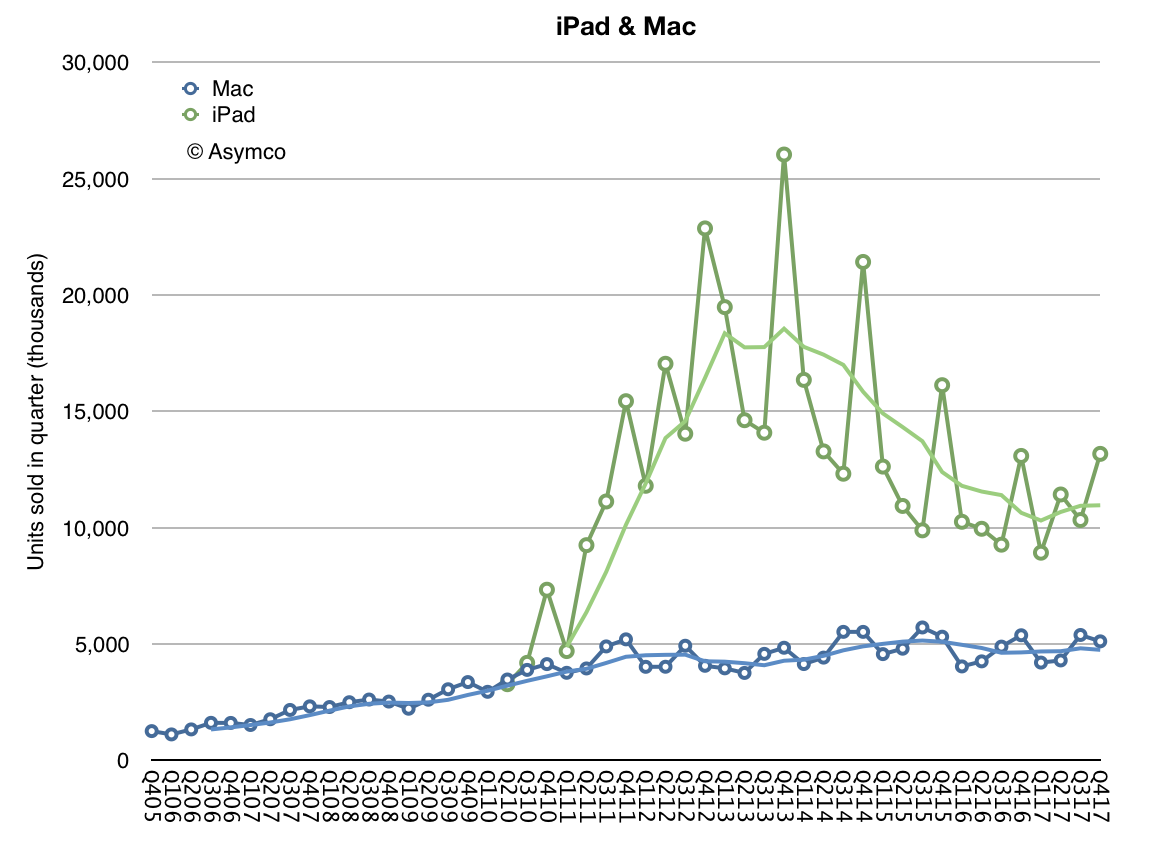
    Next, I’d like to talk about the Mac. We sold 5.1 million Macs during the December quarter, which translates to a 2% year-over-year increase in average sales per week. Mac performance was particularly strong in emerging markets with unit sales up 13% year-over-year and with all-time records in Latin America, in India, Turkey and Central and Eastern Europe. On a worldwide basis, the active install base of Macs was up double-digits year-over-year to a new record.

    It was also another growth quarter for iPad. We sold 13.2 million units with average iPad sales per week up 8% over last year’s December quarter. iPad sales grew strong double-digits in many emerging markets, including Latin America, the Middle East, Central and Eastern Europe and India, as well as developed markets, including Japan, Australia and Korea. The active install base of iPad has grown every quarter since its launch in 2010, and it reached a new all-time high in December, thanks to extremely high customer loyalty and large numbers of first-time iPad users. [iPad is clearly recovering from a long decline. ASPs are rising as it's being positioned as a PC alternative. Its low end functions are being absorbed by large screen iPhones.]
    NPD indicates that iPad had 46% share of the U.S. tablet market in the December quarter, up from 36% share a year ago. And the most recent surveys from 451 Research found that among customers planning to purchase tablets within 90 days, 72% of consumers and 68% of business users planned to purchase iPads. Customer satisfaction is also very high with businesses reporting a 99% satisfaction rating for iPad.

    We are seeing great traction in enterprise as businesses across industries and around the world standardize on iOS. For example, Intesa Sanpaolo, one of Europe’s leading banks, has chosen iOS as the mobile standard for its entire 70,000 employee base in Italy; choosing iOS for its security, user interface, accessibility and reliability, Intesa Sanpaolo will deploy native apps to improve employee productivity in customer support, human resources, and marketing across the company.

    And LensCrafters, one of the largest optical retail brands in North America, will be using over 7,000 iPad Pros to enable digital eye exams and digital optical measurements in a personalized and interactive experience. We’re also rolling out a new initiative, called Apple AtWork to help businesses implement employee choice programs more easily and offer Apple products company-wide.

    Resources from both Apple and our channel partners will enable enterprise IT and procurement teams to buy or lease Apple products more efficiently, streamline the setup of iPhone, iPad, and Mac, and deliver a seamless onboarding experience for employees. We launched the program with CDW in the U.S. last week, and we would be expanding to more channels and regions later this year.

    The December quarter was extremely busy for our retail and online stores, which welcomed 538 million visitors. Traffic was particularly strong during the four-weeks following the launch of iPhone 10, up 46% over last year. And across the quarter, our stores conducted over 200,000 today at Apple sessions, covering topics including photography, music, gaming, and app development, and art and design. Just last weekend, we opened our first store in Seoul, Korea and we’re looking forward to opening our first store in Austria in a few weeks. These newest openings will mark the expansion of our retail store presence to 21 countries.

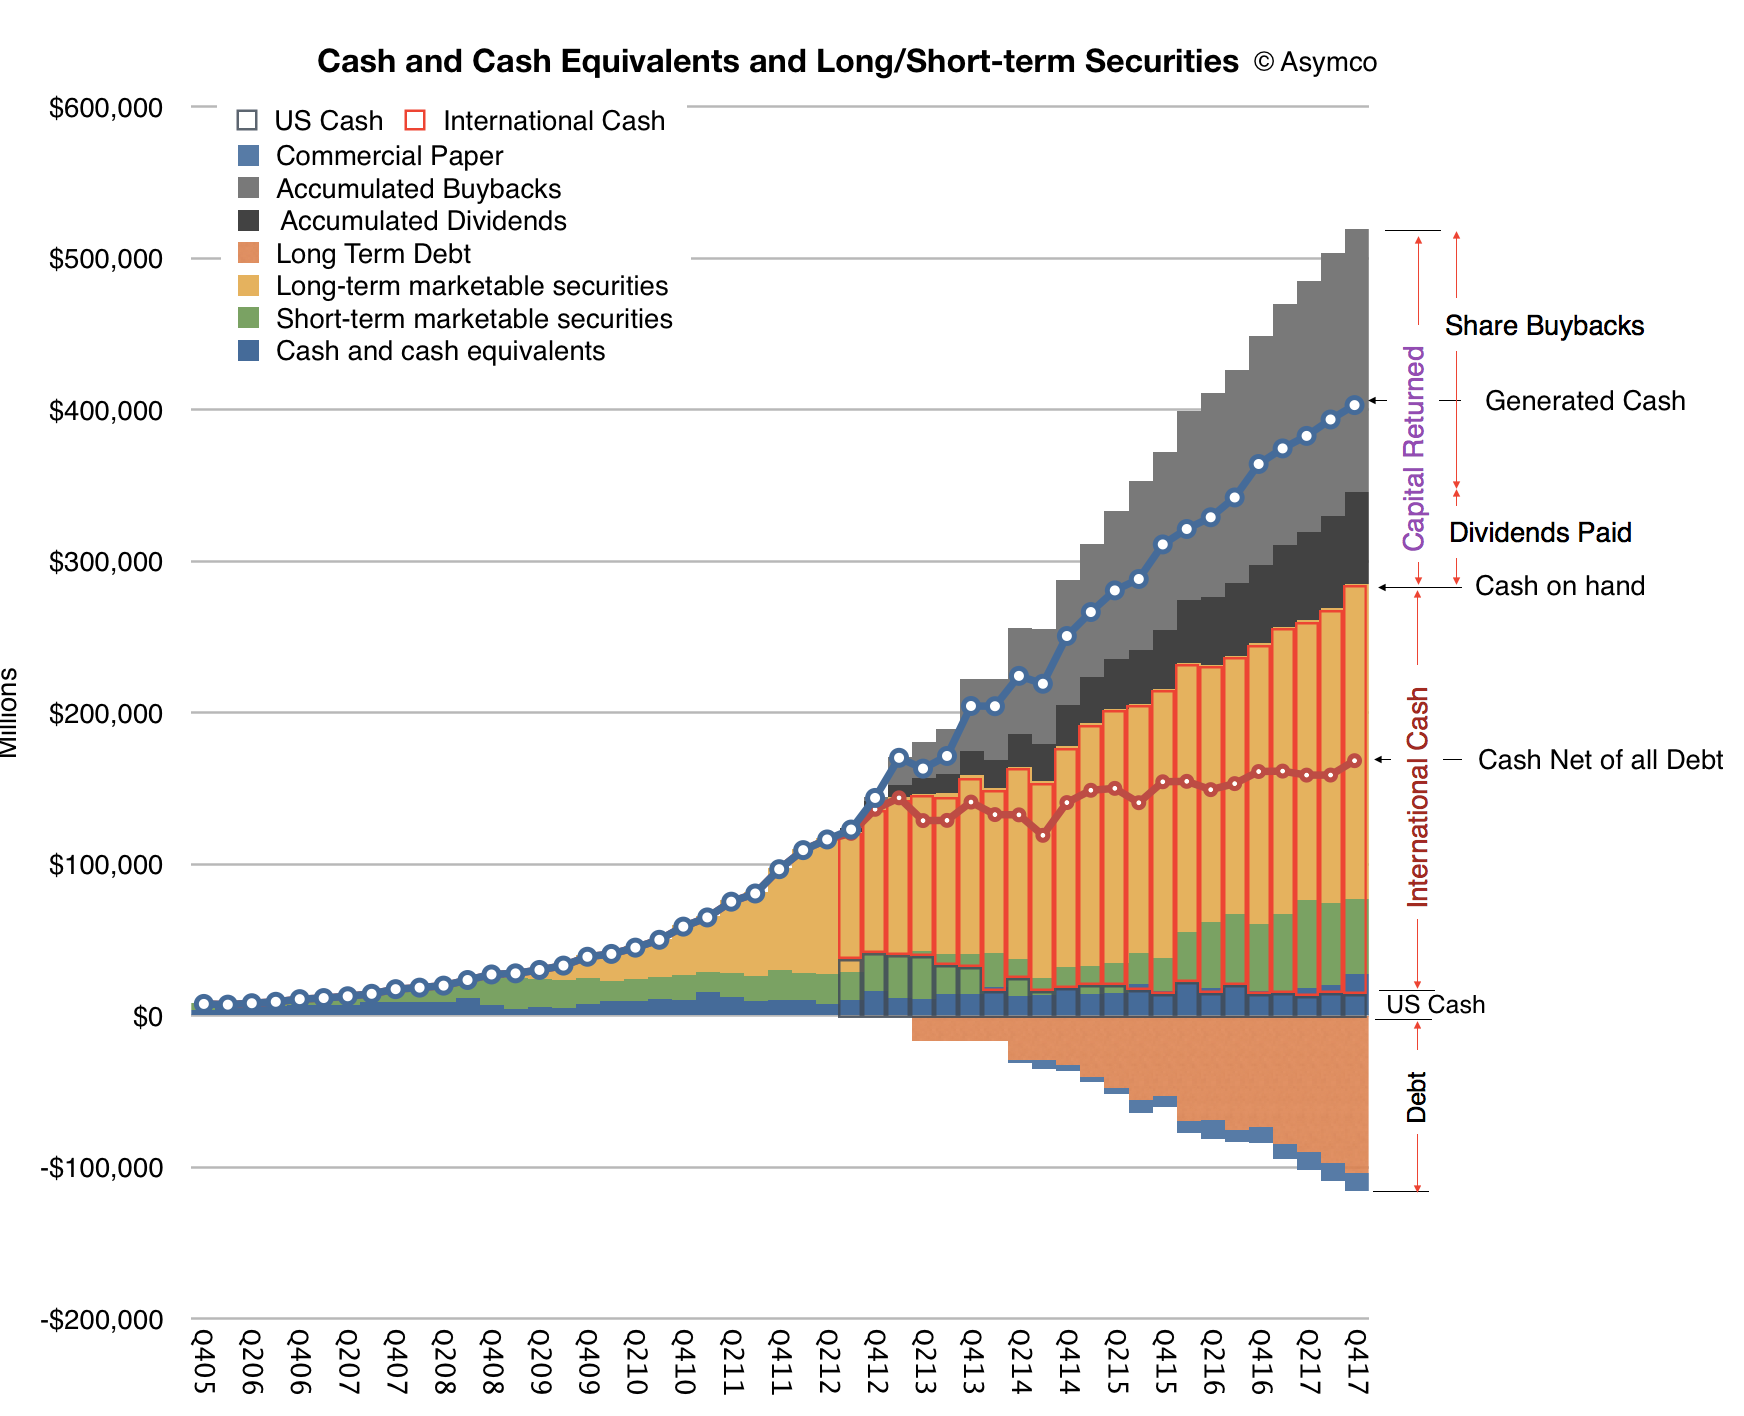
    Let me now turn to our cash position. We ended the quarter with $285.1 billion in cash plus marketable securities, a sequential increase of $16.2 billion. $269 billion of this cash, or 94% of the total, was outside the United States. We issued $7 billion in debt during the quarter, bringing us to $110 billion in term-debt and $12 billion in commercial paper outstanding, for a total net cash position of $163 billion at the end of the quarter. We also returned $14.5 billion to investors during the quarter. We paid $3.3 billion in dividends and equivalents, and spent $5.1 billion on repurchases of 30.2 million Apple shares through open market transactions.

    We launched a new $5 billion ASR program, resulting in initial delivery and retirement of 23.6 million shares and we retired 3.8 million shares upon the completion of our 12th ASR during the quarter. We’ve now completed over $248 billion of our $300 billion capital return program, including $176 billion in share repurchases against our announced $210 billion buyback program with $34 billion remaining under our current authorization. [An updated look at Apple's cash is shown below]
    Turning to taxes. Due to the recently enacted legislation in the U.S., we estimate making a corporate income tax payment of approximately $38 billion to the U.S. government on our cumulative past foreign earnings. This amount is very similar to what we had been accruing on those earnings in our financial results through fiscal year 2017, including the $38 billion payment. We will have paid over $110 billion of corporate income tax on our total domestic and foreign earnings during the last 10 years for a cash tax rate of about 26%. [Apple has paid more tax than any company in history, and is about the make the largest single payment to the US Treasury.]

    Our tax rate of 25.8% for the December quarter was close to our guidance of 25.5% as the lower U.S. statutory rate from the new legislation was effective offset by the remeasurement of deferred tax balances.

    As we move ahead into the March quarter, I'd like to review our outlook, which includes the types of forward looking information that Nancy referred to at the beginning of the call; we expect revenue to be between $60 billion and $62 billion; we expect gross margin to be between 38% and 38.5%; we expect OpEx to be between $7.6 billion and $7.7 billion; we expect OI&E to be about $300 million; and we expect the tax rate to be about 15%.

    Tax reform will allow us to pursue a more optimal capital structure for our company. Our current net cash position is $163 billion. And given the increased financial and operational flexibility from the access to our foreign cash, we are targeting to become approximately net cash neutral overtime. We will provide an update to our specific capital allocation plans when we report results for our second fiscal quarter, consistent with the timing of updates that we have provided in the past.

    Finally, today our Board of Directors has declared a cash dividend of $0.63 per share of common stock, payable on February 15, 2018, to shareholders of record as of February 12, 2018.
  2. When Watch surpassed iPod

    Research · 18 comments

    The last time Apple reported iPod unit and revenues was for the third quarter of 2014. Thereafter the product segment called “Other Products” was used to include what was formerly the iPod segment and the “Accessories” segment. Exactly two quarters later Apple began to sell the Apple Watch. Apple Watch was not broken out as a separate product segment and remained a part of Other Products along with iPod touch, Beats, Apple TV, and Apple-branded and third-party accessories. Soon the HomePod will also join the Other products.

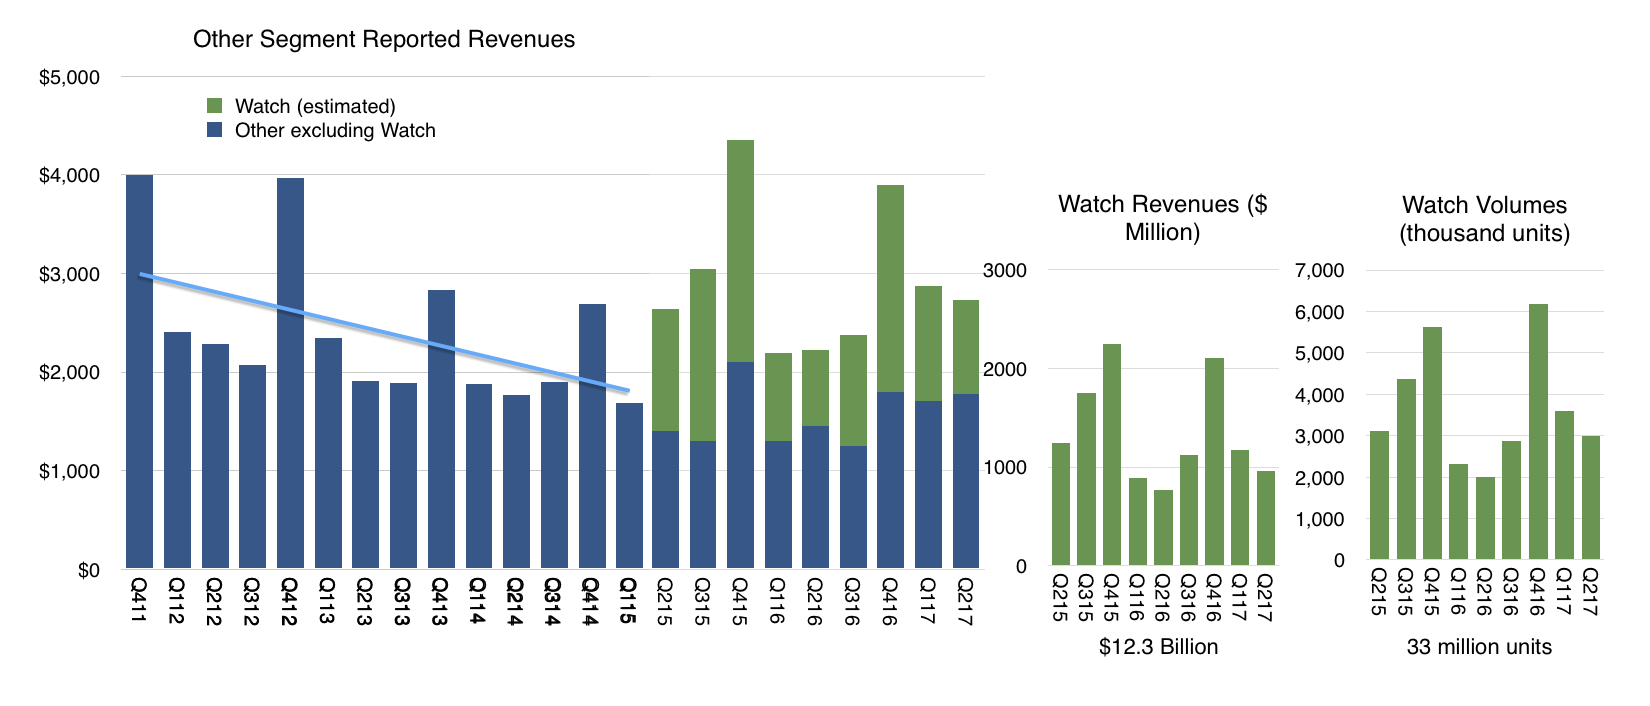
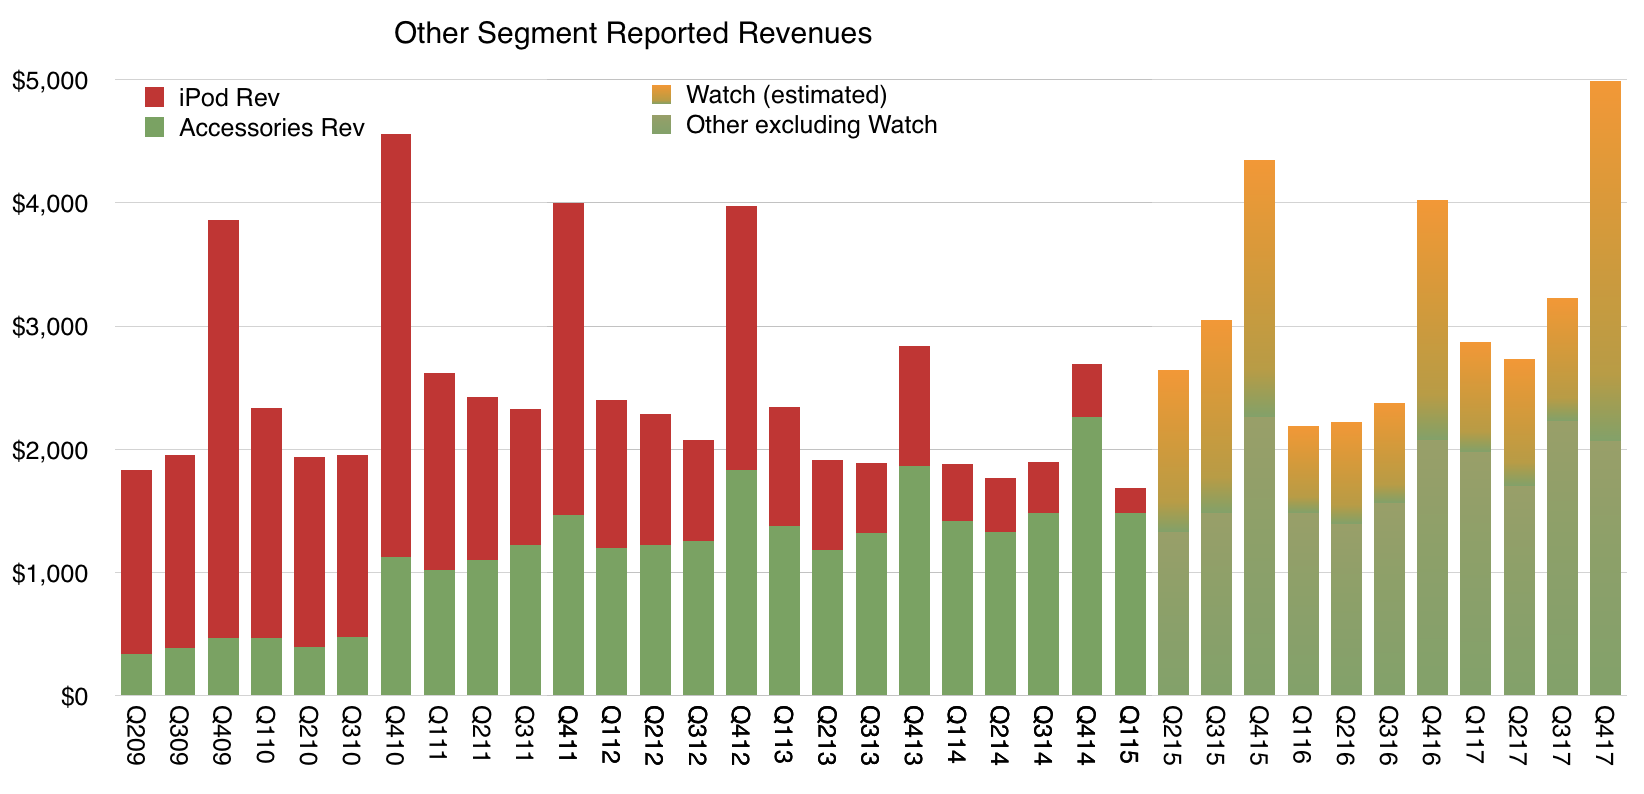
    The combined iPod, Accessories and “Other” product sales are shown in the following graph. ((Two quarters include estimated iPod revenues: Q4 ’14 and Q1 ’15. The iPod contribution is estimated with a simple extrapolation using the previous four quarters’ average rate of decline))

    Note that an attempt is made to estimate the contribution of Apple Watch to the mix. The method is simple: if you can estimate the non-Watch sales trajectory then the Watch is the difference between Other total and this trajectory.

    If we discount the iPod, the non-Watch revenues come down to Apple TV and Beats, mainly.  Note that the data shows the contribution of Beats (Q4 2010) but it’s hard to parse specifically the growth of Beats. Since the Watch launched we also saw the introduction of AirPods and new Apple TVs, both of which probably contributed to some growth to “Other excluding Watch.”

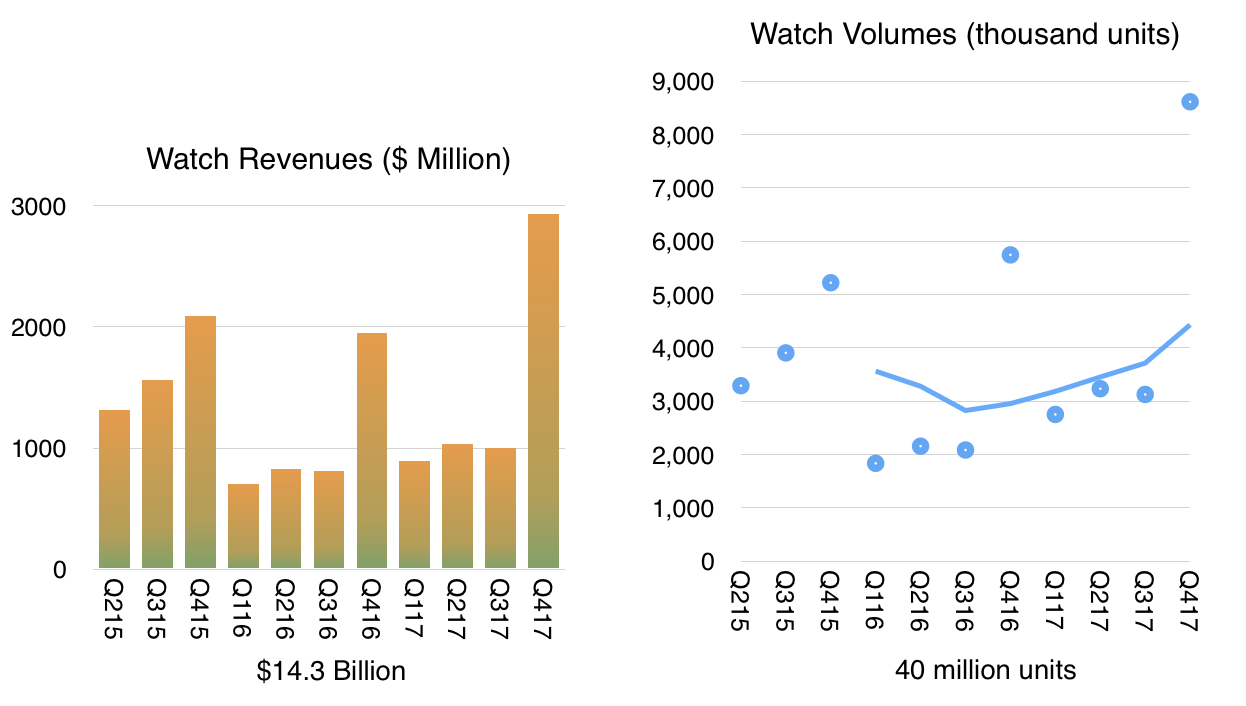
    We can take a stab at the first 6 quarters of Watch by projecting Other with some nominal growth. Thereafter Watch can be modeled using growth assumptions. Apple stated that growth was above 50% during the past three quarters. There are a few quarters where we must make guesses but overall the picture that emerges, shown below, is fairly robust. Note that I’ve included estimates for the fourth quarter of 2017 assuming continuing 50% growth. This is driven primarily by the launch of the LTE-enabled Series 3.

    The result is a cumulative sales value of $14.3 billion and a volume of 40 million units (based on average pricing assumptions).


    But what most catches the eye is the transition from iPod to Watch. Watch entered nearly at the same time as iPod bowed out. Its contribution to sales seems to mirror the iPod as well. The interesting question then becomes if the Watch will eventually match and indeed exceed the revenues from iPod.

    I’d say the better question is _when_ Watch will overtake iPod. From a revenue point of view, I believe next year’s fourth quarter will see the Watch generating higher revenues than the highest quarter for the iPod. ((That was in Q4 2007 when iPod managed $4 billion.))

    In terms of yearly unit sales it may take longer. The biggest year for iPod units was 2008 when about 55 million iPods shipped. Watch is now running at about 16million. If it could sustain 30% growth then it would take until 2022. 40% growth would mean 2021 and 50% 2020.

    It’s not easy to predict growth but my bet remains that Watch will get there eventually becoming the third most popular Apple product. Perhaps even second.

    Overtaking the iPod is quite an achievement considering that the iPod was once synonymous with Apple itself. Although Watch may overcome iPod, Apple may never be known as the Watch company. That’s perhaps for the best. I’ve noted before that Apple was once seen as the Apple II company, became the Mac company then the iPod company. Now of course it is thought of as the iPhone company though it’s no more that than it ever was any of the other things.


  3. S3X Appeal

    Research · 22 comments

    On July 3rd, Elon Musk handed over the first 30 Model 3s and tweeted

    "Production grows exponentially, so Aug should be 100 cars and Sept above 1500."

    He added,

    "Looks like we can reach 20,000 Model 3 cars per month in Dec".

    In 2016 he stated

    "So as a rough guess, I would say we would aim to produce 100,000 to 200,000 Model 3s in the second half of [2017]. That's my expectation right now."

    He confirmed this estimate early in 2017

    "Our Model 3 program is on track to start limited vehicle production in July and to steadily ramp production to exceed 5,000 vehicles per week at some point in the fourth quarter and 10,000 vehicles per week at some point in 2018.”

    Overall 2018 production guidance has been 500,000 units and 1,000,000 units in 2020.

    The company shipped 220 Model 3s in the July, August and September months. This is well below the expectation of 75,000 that the 2016 guidance would suggest ((100,000 to 200,000 for the second half of 2017 suggests an average of 150,000 for the six months or 75,000 per quarter)) or the 1,630 that might be suggested by the "production grows exponentially" July proclamation.

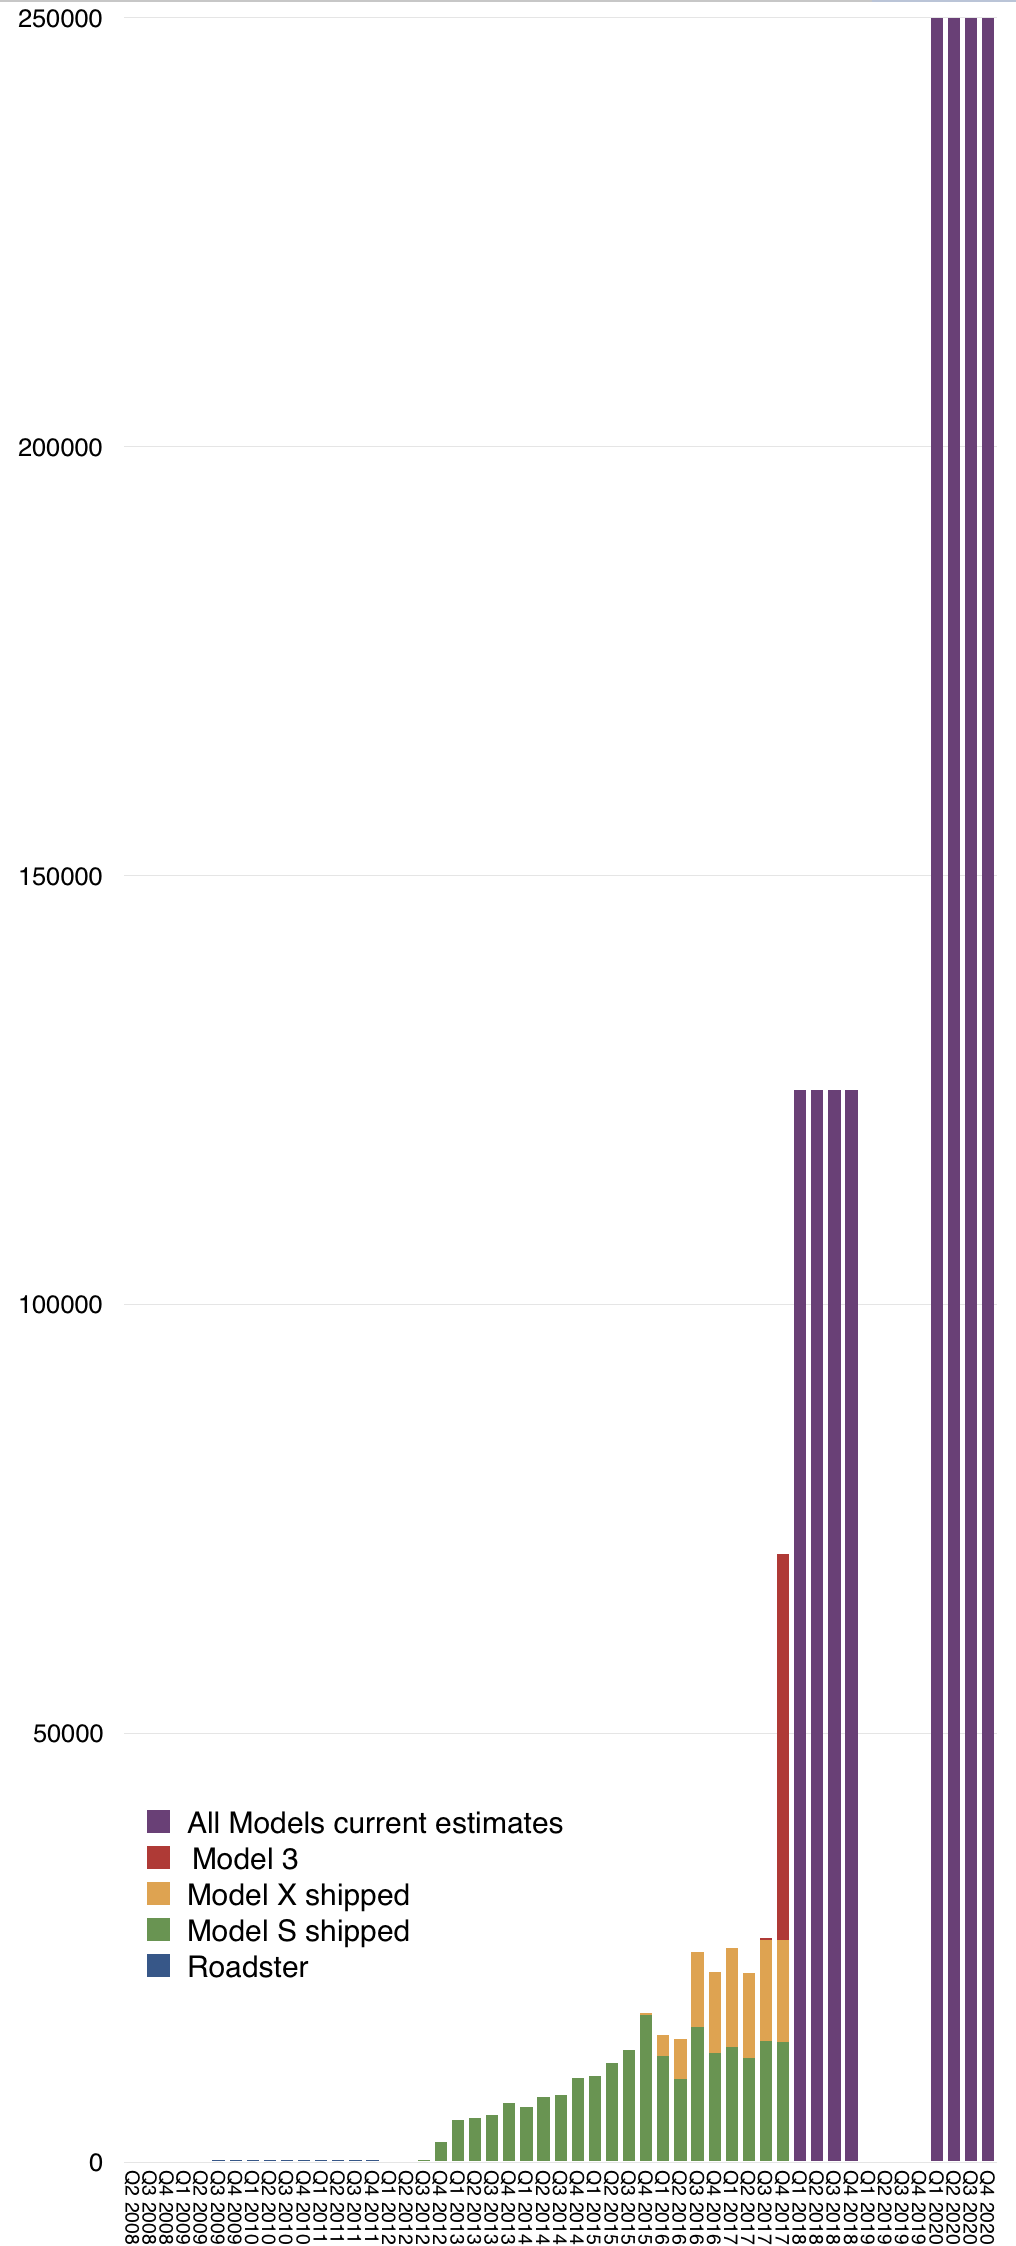
    I entered the Q3 production data and kept the previous run rate predictions for Q4 and 2018 and 2020 in the following graph.


    Note that the graph includes all previous shipments of Tesla cars throughout its history.

    The red bar represents an estimate consisting of the sum of 10,000 Model 3 in October, 15,000 in November and 20,000 in December. This is consistent with reaching the target production of 20,000 in December.

    The purple bars are distributing the planned production evenly throughout the 2018 and 2020 calendar years.

    Before asking whether these predictions can be relied upon, I'd like to focus on the history of Model S and X production/shipments. Specifically the last five quarters.

    • Q3 2016: 24,500
    • Q4 2016: 22,200
    • Q1 2017: 25,000
    • Q2 2017: 22,900
    • Q3 2017: 25,930
    • Q4 2017: 25,845 ((This is an estimate based on another point of guidance: 100,000 models X and S for the 2017 year.))

    Growth in this total figure has been remarkably low. Only about 4% y/y in the last quarter and sequentially the total has bounced in a narrow range.

    This level (about 24,000 units/quarter on average) is a distinct plateau but it's also well above the average of the previous 4 quarters of about 15,000 units/quarter. It suggests that there was a “quantum leap” in production at the end of 2016, to a new plateau.

    So the question is why, with so much pressure to produce cars to meet presumed unlimited demand, is output so limited?

    To see just how limited, consider the rate of output. For the past 15 months and near future, the output is equivalent to 264 cars per day.  If the Fremont factory is running three shifts, 11 cars are produced every hour. This is equivalent to a cycle time or takt time of 5.5 minutes.

    This would be an tragic cycle time.  Most car lines aim for run times between 1 and 2 minutes per station. For example BMW's Spartanburg plant produces 1400 units per day which yields a cycle time of 1 min. ((This assumes one line. The chassis/engine marriage step is clocked at 3 minutes so the worst case is  that there are three lines running at 3 min. cycle time each.))

    This measure of performance is so important that it drives the depreciation and capitalization schedule for tooling and the very lifeblood of the company: capital expenditures. An underutilized factory is a giant hole in a financial statement and destroys value as much as inventory does. Every manufacturer strives for maximum utilization and is sunk if it does not achieve a minimum threshold.

    So why, after a few years of Model S production, is Tesla running at one fifth the speed of a BMW or Toyota plant? One obvious answer is that the company is not running 3 shifts but perhaps 2 or even 1. But why would they shut down the line when demand is infinite? If it is finite, is it really only 25k at most per quarter? That’s a paltry number considering the size of the market they operate in. BMW alone ships 2 million vehicles a year. Tesla X/S topping out at 100k a year suggests a serious limit to their opportunity.

    Another possible explanation is that there aren't sufficient battery deliveries for continuous production. We hear about issues with battery throughput as transients that slow production. But the production data we have spans an 18 month period during which the speed has hardly budged. During this time additional battery capacity in the form of a Gigafactory has been announced.

    If this giant new factory can’t reliably deliver batteries for 25k cars/quarter then how are we to believe that it can deliver for 125k units in a few months? If it's not batteries, then what? I don't know of other subsystems that are chronically constrained that we can point a finger at. Almost all other parts in a Tesla are sourced from existing supply chains.

    The most likely suspect is that Tesla's S/X line is not fully operational. When you study production lines, generally they either work at a decent clip or they don't work at all. They are not designed to be dialed down to be as slow as 5 min for every 10 feet of car. It's much more likely that the line is idle for long periods of time. Perhaps even 2/3 of the time.

    This is what is so mystifying about Tesla's exuberant predictions for the Model 3. The X/S line is bogged down and inefficient five years after production start but we are to believe that the Model 3 line will come to operate at >5x speed within weeks, on a new product? Maybe the X/S line is a failed experiment. Maybe the company is moving to "Version 2" and leaving the cruft in Version 1 without fixing it.

    Maybe.

    Tesla's asymmetric approach to automobile product development and distribution and ownership experience are key advantages but their asymmetry to functioning best practice production systems is a key disadvantage. The big competitive question is will incumbents get good at intelligent EV experiences faster than Tesla gets good at production.

    Outsiders might ask "How hard can car building be?" and vote for Tesla winning this race.

    There is no data on how fast an incumbent learns the EV experience delivery process, as it's never been tried before, but there is data on how fast a manufacturing company learns lean production. Those times were measured in decades.

    [UPDATE]

    In the week that followed this post new claims have been made on Tesla's production system by other publications.

    • Wards Auto published a story on problems with automating the Model 3 production line.
    • Wall Street Journal published a story on claims that Model 3 production was constrained by hand-building on parts of the line.
    • Edward Niedermeyer wrote in the Daily Kanban about regulatory documents that show limitations in production of the Model 3.

    The most relevant quote to this post is the Wards claim that:

    Its current production line in Fremont, CA, can’t build vehicles at [5,000 weekly] rate unless it runs two 10-hour shifts seven days a week, which is not likely for an all-new vehicle, even if everything goes smoothly. The plant presently runs two 8-hour shifts five days a week.

    If this is true then the current Model S/X line is limited to about 50% of capacity or about 25 cars/working hour. This is equivalent to a takt time of 2.4 min/station. This is certainly much better than the estimated 5.5 and within a range of reasonableness, but one has to ask why is the line not operating more than half the time?

    When I wrote about there being "infinite demand" for the X/S, the logic was that the X/S was still a niche product at 100k/yr and the category into which is sells is assumed to have a lot more headroom for their entry.

    The observation that production is topping at 50% capacity for 18 months in a market that is quickly being targeted by competitors remains interesting to me.

  4. A small-screen iPod, an Internet Communicator and a Phone

    Research · 111 comments

    Apple is now the biggest watchmaker in the world, overtaking Rolex during the last quarter. This achievement happened less than two and a half years after Apple entered the watch market. Rolex, on the other hand, was founded in 1905, 112 years ago at a time when watches were the avant-garde of technology. Given this revelation of sales, we can test the estimates I put forward on the Apple Watch sales, shown below:

    We know that Rolex produces about 1 million watches a year and we also know that Rolex had sales of $4.7 billion in 2016. The average revenue per watch ((Includes services such as repairs)) was therefore about $4,700.

    My estimate has been that Apple sold about 15 million Watches in the last 12 months at an average price of about $330. This puts the Apple Watch revenue run rate at $4.9 billion, indeed above Rolex.

    They may be slightly high but the news makes me feel quite comfortable in my methodology. Note also that within the last quarter Apple said sales for the Watch increased by 50%. This is also reflected in my estimate of 3 million in Q2 vs. ~2 million for 2016 Q2.

    Overall, about 33 million Apple Watch units have been sold since launch and they generated about $12 billion in sales. Coupled with a 95% customer satisfaction score, altogether, this has been a great success story. But only 2.5 years in, it's still act one.

    To understand the long term trajectory, it's important to qualify this product as part of another, larger story. The Watch, even with LTE, is an accessory to the iPhone. It still cannot be activated without it. Even the coverage plan is an extension to an iPhone plan. The company is careful to address it as a companion product.

    But how long will that last?

    It used to be necessary to first attach an iPhone to a computer to activate it. That used to be cited as a reason for the iPhone not being a "proper computer", diverting attention from what it would inevitably become. Those who clung to that thin wire as a reason not to face the future were deceived. The iPhone and the iPad now stand alone of any PC or Mac. Will the Watch cut these familial links and stand alone some day?

    I think this too is inevitable. The technology trajectories are easy enough to plot. Apple has invested enormously in the silicon that goes inside the Watch and has taken it to new levels of connectivity with LTE, 85% faster WiFi, and a 70% faster processor; all with 50% better power efficiency.

    These enable independent voice entry, Siri everywhere, Find My Friends, Maps, music streaming. These breakthroughs are only possible with a new W2 processor which is more powerful than the first iPhone processors.

    This comparison is apt: the Watch is effectively stealing usage from the iPhone. At first it took alerts, timekeeping, and basic messaging away. Now it's taking basic phone calls and music and maybe maps.

    It's fitting therefore to remember how the iPhone was launched; as a tentpole troika: A wide-screen iPod, an Internet Communicator and a Phone. Today the new Watch is a small-screen iPod, an Internet Communicator and a Phone.

    So not only is the Series 3 Watch more powerful than the original iPhone but it is also poetically capable of the same tentpole jobs. But it's not just a miniature iPhone. It has a new, completely orthogonal attack on non-consumption and market creation: fitness and health. This is a key point. The iPhone was born a phone but grew up to be something completely unprecedented, unforeseen by its creators and, frankly, undescribable in the language of 2007.

    The Watch was born a timepiece but it is traversing through the early iPhone and pulling in a new direction all of its own. The fact that we are talking about "Resting Rate", "Arrhythmia" and "Atrial fibrillation" at a timekeeping launch event indicates that new behaviors will follow and so will the language we'll use to describe this child-like product once it grows up.

  5. Estimating Apple's Second Calendar Quarter

    Research · 8 comments

    Apple reports second calendar quarter results in about a week. I propose the following estimates:

    Fiscal Q3 2017:
    Rev ($B) 45.321
    EPS ($) 1.62
    iPhone (units) 41 million
    iPad (units) 9.8 million
    Mac (units) 4.35 million
    Watch (units) 2.5 million
    Services ($) 7.2 billion
    Other products ($) 2.6 billion
    Gross margin (%) 38.4

    The revenue estimate is visualized in relation to guidance (revenue between $43.5 billion and $45.5 billion) and shown in the context of previous actual revenues below:p

    The estimates are also consistent with additional guidance provided:

    • Gross margin between 37.5% and 38.5%
    • Operating expenses between $6.6 billion and $6.7 billion
    • Other income/(expense) of $450 million
    • Tax rate of 25.5%

    The estimates (and guidance) suggest modest growth of 7% in revenues and 13.7% EPS. The predictability of the quarter suggests that attention will mostly be focused on guidance for the next quarter.

    Expectations can vary quite a bit because of the effects of a new launch. The product mix, pricing and timing are all unknown at this time.

    What is known however is that the customer base for Apple is increasing and loyalty is higher than ever. What I sense, coming from very few data points, is that there are more iPhones in use than ever before. A few years ago when the market was less saturated it was easy to assume that commodity Android phones and tablets would surge and swamp iPhone/iOS usage.

    This has not happened, indeed the data suggests that iOS usage is stronger than ever and that there are many more "switchers" moving from Android to iOS than vice-versa.

    This may surprise some but if we look at the PC market, a similar phenomenon has been taking place for years. Mac usage grows and Macs are more visible and valuable than PCs.

    It's important to note that in the latter, post saturation stages, the markets for both phones and computers are increasingly driven by brand value. This resistance to commoditization is due to buyers' perceptions of quality moving beyond utility and of the prioritization by buyers of new measures of performance. These new measures defy measurement.

    Much of what is therefore required of market analysts is intuition.

  6. Predicting The Second Quarter

    Research · 51 comments

    The last quarter of 2016 was Apple's biggest ever. $78.4 billion in revenues. 78.3 million iPhones. Both records. Earnings of $3.36 ((On shares priced at the time around $105 or 3.2% yield quarterly earnings)) and cash reached new highs. The growth was modest but Services is now not just the second largest revenue but also the fastest growing, on track to doubling in four years.

    The reason for this is the vastness of Apple's user base coupled with the loyalty the brand engenders. The company reached one billion active devices more than a year ago and is quite likely to have nearly a billion users. Not just any billion either--the best billion most probably.

    The realization that Apple benefits from extreme quantity and quality of customers has led some observers to defer the imminence of Apple's demise. Share prices have risen lately to new highs and the ratios between these prices and earnings have started to come closer to the average of other large companies.

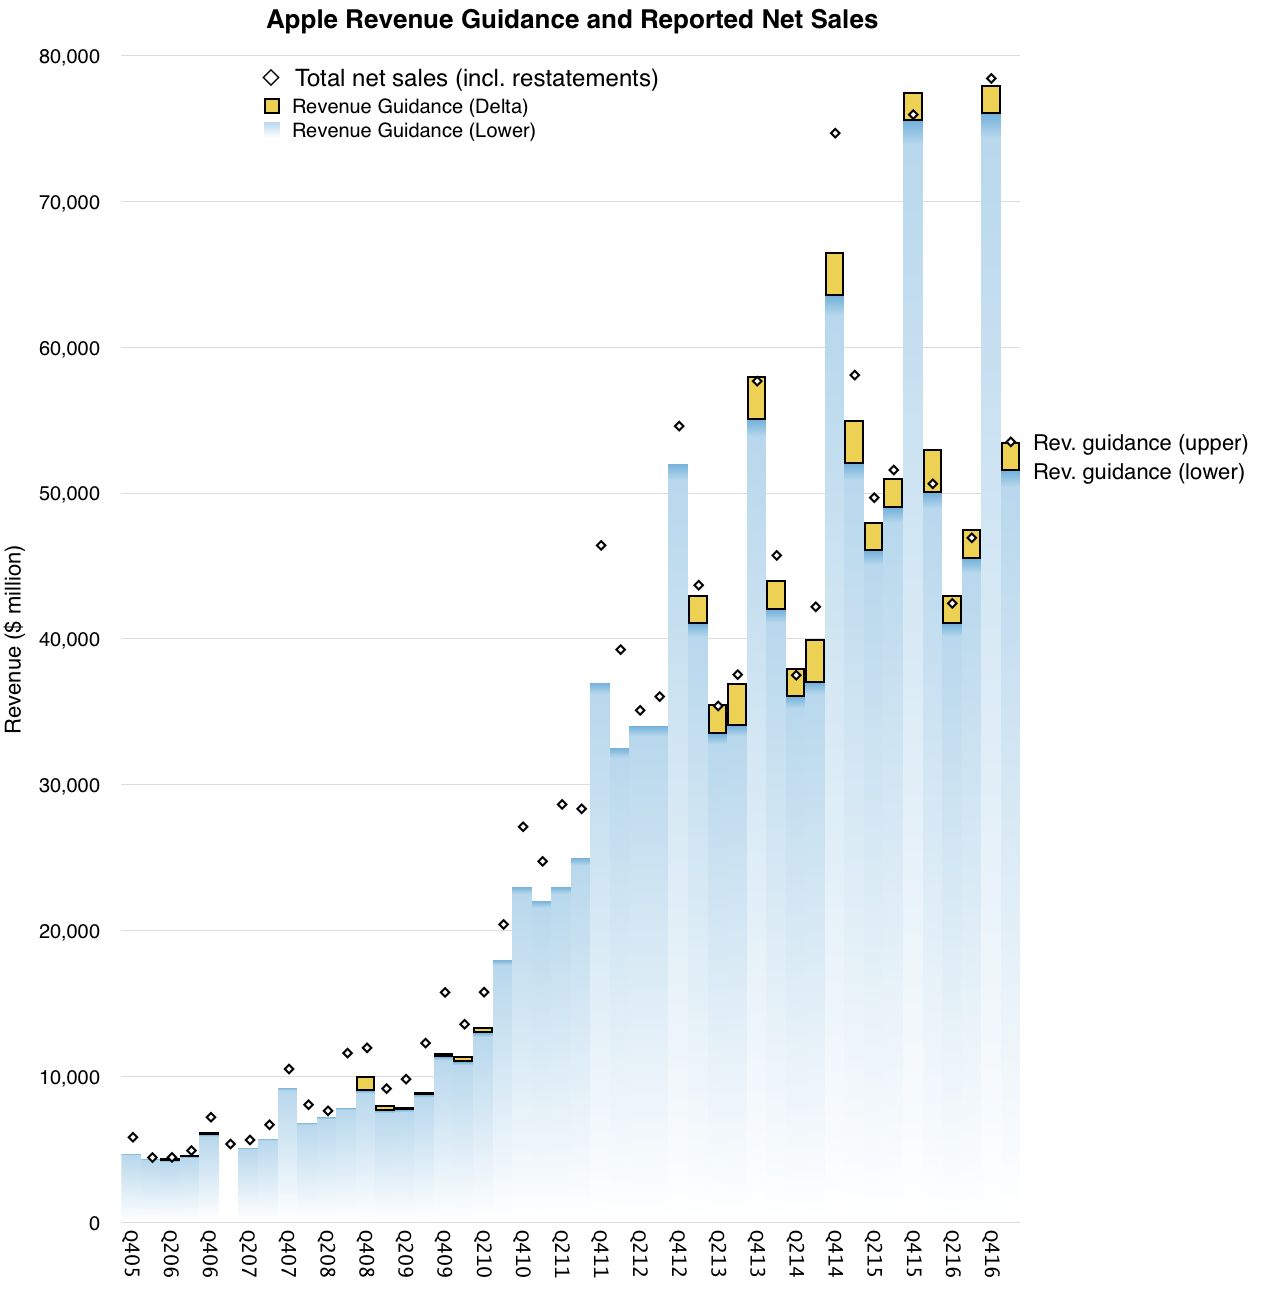
    But enough with the reductio ad absurdum. Let's look at the next quarter. The company has been very precise with its own offered predictions (guidance) so it's a simple task to make an accurate forecast. The history of guidance vs. outcomes for revenues is shown below:

    Placing the pipper on the upper edge of the guidance range was a safe targeting method for 11 of the last 17 quarters. We have never seen a drop below the bottom of the range but had a few overshoots, some huge. Doing this for the latest quarter and working backwards to the individual product contributions to revenue and using historical margin and cost patterns we can get the following core financial performance metrics:

    Fiscal Q2 2017:
    Rev ($B) 53.4
    EPS ($/share) 1.96
    iPhone (thousand units) 53100
    iPad (thousand units) 9900
    Mac (thousand units) 4100
    Watch (thousand units) 2300
    Services ($ million) 7129
    Other products ($ million) 2300
    Gross margin (%) 37.8

    I sent these estimates to Philip-Elmer DeWitt and I recommend looking at his survey of the other analyst estimates on his excellent Apple 3.0 blog.

    Overall, the quarter is shaping up to offer slight growth y/y and indicating a plateau formed after the surge from the iPhone 6 surge in '15. All eyes are on the "super cycle" for the next iPhone.

    The reason it's "super" is that the iPhone has a 2+ year cadence for form factor changes and the user base updates on a similar cycle. The demand is vast due to the user base and accumulated age of devices in use. Expectations are that supply will be offered to meet this demand.

    If history is a guide then the next iPhone will be the best iPhone ever.


  7. Apple Watch Keeps Top Gift Spot Ahead Of Black Friday

    Research · 1 comment

    The Apple Watch continues to hold the top spot among products that will be hot this holiday season, as predicted by the IBM Trend app.

    Source: Apple Watch Keeps Top Gift Spot Ahead Of Black Friday

    The Apple Watch scored 100 out of 100 on the "IBM Watson Trend Scale". According to various surveys, about 100 million people will shop this Thanksgiving weekend in the US. One wonders how many purchases by 100 million shoppers merit a score of 100/100.

    My estimate for units shipped has been 20 million in the first calendar year. About 7 million have been sold in the first two quarters. That leaves 13 for the holiday and Q1 (which includes Chinese New Year.) I still like these odds.

    To learn more about the reasoning around this estimate and hear additional supporting data, join us at Glance conference.

  8. Apple Assurance

    Research · 42 comments

    Apple is categorized as a vendor of consumer electronics. More specifically, a member of the "Electronic Equipment" industry in the "Consumer Goods" sector. If indeed this is what it's thought to be selling, there is a problem because it isn't  what its customers are buying.

    Apple's customers buy a mix of hardware, software and services under a brand that assures a certain quality of experience. This bundling and integration of otherwise disparate things is why the brand is such a success.

    This anomaly between what Apple is thought to sell and what buyers actually buy can leave the casual observer confused. As a result the company's categorization as vendor of hardware deeply discounts its shares. It is, in other words a less valuable business. This is because a seller of consumer electronics does not benefit from "system valuation" since there is minimal loyalty to the product after the sale.

    The consumer electronics vendor has no network to leverage, no ecosystem adding value after the sale, no platform and works through multiple levels of distribution to reach the customer. In contrast, a system vendor can expect benefits from network effects, ecosystems, and a coveted relationship with the end user.

    The result is that the valuation of a consumer electronics vendor is based on the momentum of individual products. Apple has always been valued this way. Each hit product is considered to be a stroke of luck/genius and the chances of recurring are discounted to about zero. Regardless of the fact that it has a track record of "home runs", Apple's hit rate is not considered sustainable. ((The P/E ratio is the primary indicator in this analysis)). Certainly Apple is not valued as being able to generate reliably recurring revenues.

    But what if we were to value Apple on the basis of what people are buying rather than what it's thought to be selling?

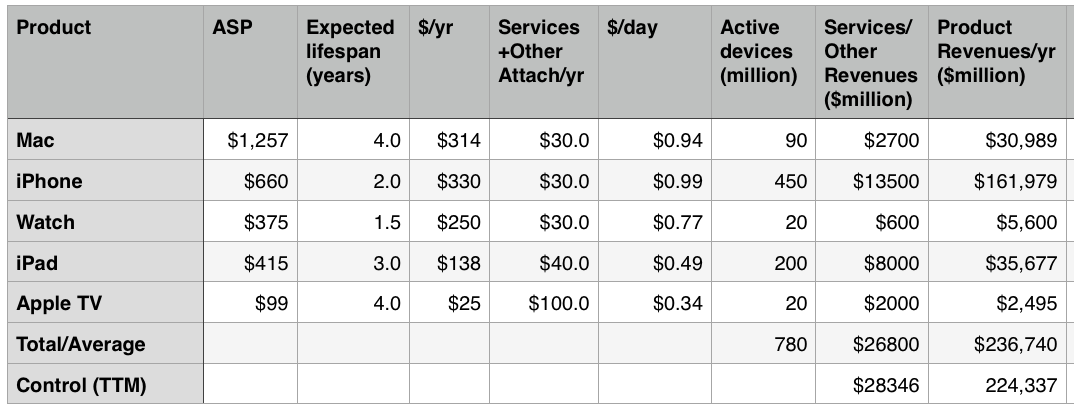
    The model is simple enough: determine the number of users, estimate the lifespan of the products, and figure out the services attached to the products; then, given the price, obtain a price per product per day. You then can get a recurring revenue figure.

    I did just that and the results are in the following table:

    Screen Shot 2015-09-15 at 5.13.27 AM

    The first column is the product, the second is the Average Selling Price (ASP), the third is the expected lifespan of the product, and the fourth column is a calculation of the end user’s “spending per year” on the product.

    The fifth column is an estimate of the revenues from Apple's Services and "Other" groups from post-sale revenues attached to the product. This Services revenue includes AppleCare, iCloud, Music, App Store, other stores, Beats, accessories, iAd, and Made for i (MFI) licensing. It also includes Google traffic acquisition revenues and other licensing.

    The sixth column is an estimate of the consumer "spend per day" on Apple's product lines taking into consideration Services.

    The seventh column is an estimate of the number of active devices in the hands of users. Note that these are expected to change over time.

    The eighth column is a calculation of Services/Other income on a per-product allocation. This is a test of the Services+Other estimate and is meant to sum to nearly what Apple currently reports as Services+Other revenues.

    The ninth column is a test of overall revenues on a per-product allocation. This should add up to total revenues (estimated for next year.) ((Naturally, the active devices estimate is the most sensitive but it should be tweaked to create a reasonable forecast for next year.))

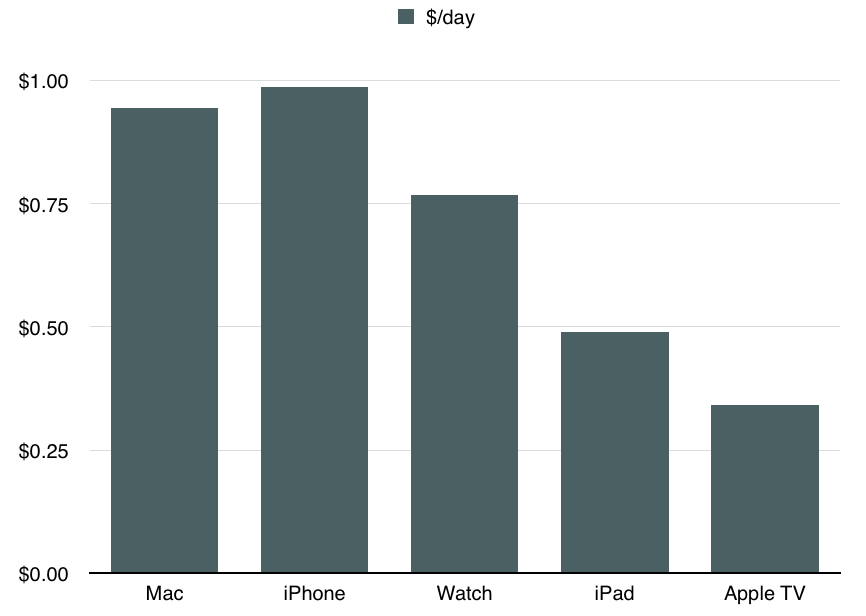
    The bottom line is the following graph which shows the revenue per device per day inclusive of Services and Other income (The sixth column).

    Screen Shot 2015-09-15 at 5.22.23 AM

    This is, in my opinion, a reasonable way to approach valuation of Apple as a business. It's also a way to inspect its strategy.

    As a valuation we can easily obtain the net present value. The model gives us sales and by estimating a net margin (which is remarkably steady around 22%) we can get the free cash flow.Iterate into perpetuity with a discount rate, and you can get the net present value of the company. With a modest growth rate leading to a billion active devices in use and a normalized revenue per device of $0.92 you can easily see cash flows equivalent to $1 trillion in present value.

    But much more interesting than this value is the notion that Apple is in business to deliver a product/service mix to loyal customers and to preserve their loyalty through constant improvement and innovation. You can see strategic intent in increasing the attach rate of services per device. You can see a strategic intent in building loyalty and the right customer base which is likely to be loyal. You can see strategic intent in the iteration of the product in a way that extends loyalty and expands the solid base but also increases the $/day rate. This analysis correctly informs almost all decisions the company makes.

    What we just saw in the launch of a new Apple TV and a new iPad is consistent with this strategy. Apple TV will have a higher service attach rate with apps while keeping pricing well below consoles thus expanding the user base. The iPad is increasing in price and getting more accessories. The developers are encouraged to build richer and more valuable apps that are uniquely enabled by the new device.

    The fact that Apple has just launched a subscription service for the iPhone  makes what was clearly their strategy all along plain to see however it has been a strategy in effect for decades.

    It isn't a difficult idea to embrace. It always surprises me that it's not more commonly held. The reason may be that Apple is mis-categorized.

    Or perhaps the entire categorization of industries and sectors is obsolete in what is a new post-industrial age. Some have figured this out already. Others will take longer.


  9. How iPad Educates

    Research · 20 comments

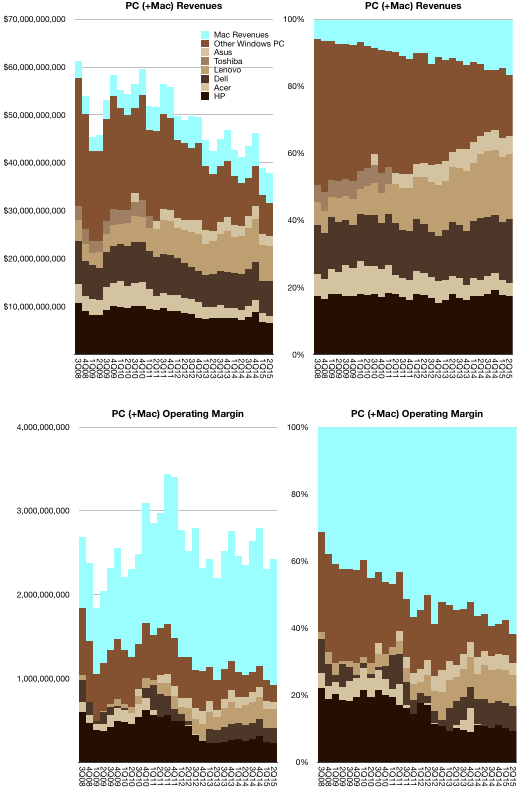
    The fact that the iPhone is contributing over 90% of the operating profits in mobile phone sales has penetrated even as far as the Wall Street Journal. However, it's not yet commonly known that the Mac captures a majority of personal computer operating profits, at least when considering the sale of hardware.

    My calculations suggest at least 60% of operating margin in personal computing hardware is captured by Apple. This is mainly due to the fact that the average Mac sells for more than $1200 while the average PC sells for less than $450.That is equivalent to $1.5 billion per quarter for Apple vs. $930 million for all the other PC makers combined.

    Screen Shot 2015-07-17 at 12.16.27 PM

    If we are to consider the iPad as a "PC equivalent" computer ((for a substantial minority of tasks)) then another $billion/quarter is contributed to the profit pool. It increases Apple's share of profits to 73%. As a result, Apple absolutely dominates computing profits.

    But, as we know, computing, even on handheld devices, is enabled by a multitude of business models. Selling hardware is one thing, but Microsoft showed that one could sweep up profits in the industry by selling enabling software. It's much harder to assign a share of profits if we try to consider all the business models associated with computing and all the form factors that computing has taken shape in.

    The problem can be acutely observed with the iPad alone. It's sold with a decent margin ((my estimate is a gross margin of around 27%)), though not one which approaches that of the iPhone ((my estimate of the iPhone gross margin is near to 48%)). It also enables an ecosystem with thousands of collaborating firms and users.

    Consider the uses of the iPad in education. 15 million iPads were sold to educational institutions. An unknown number of millions have been hired for education uses by end-users or teachers. The result is over 100,000 education apps are available in the App Store.

    The education sector's "jobs-to-be-done" has led to the product being associated with entire new processes for education. Education is not a product but a process and therefore any technologies must be hired as part of the process. In the App Store you can see the “Apps in the Classroom” guides along with impressively powerful apps being used in education. These are educator-created guides designed for other educators.

    There is no way to measure the "profit" in this endeavor.

    Nor is there a way to capture the "profit" in people engaging in exercise because they wear an Apple Watch.

    Nor is there a way to track the operating profit of HealthKit which has enabled 1000 apps to help people manage their health.

    These education and health efforts are not designed to be profitable. And yet Apple is very profitable. That is because creating valuable things generally leads to value being accrued by their creator. How that happens is not very important. Indeed, focusing of the how is actually often self-defeating. What matters is the why and the what is done.

    Understanding this leads us to understand the foundation of any great organization, not just Apple.


  10. Where are Maps going?

    Research · 311 comments

    At the 2015 WWDC Apple stated that it receives 5 billion requests per week for its maps service. It also said that Apple maps is used 3.5 times more frequently than "the next leading maps app."

    These two data points are the total number of data points we have about the global maps market. Neither Google nor Nokia provide usage or share or performance data. Regardless, commentary on the usage, share and performance of Apple Maps has been abundant for the three years since its inception.

    The data presented allows us to make a few estimates for the first time and we can hope that additional data can allow a picture to emerge of where maps are going.

    With these first two data points we can finally make some estimates. But some assumptions are still needed: We need to assume that the "next leading maps app" is Google Maps. Although there are other maps apps on the iOS platform they are probably insignificant and it's a two-horse race between Google and Apple on iOS.

    This means that the 3.5:1 split in usage results in a 78% share for Apple Maps and a 22% share for Google. If we assume that there are about 400 million iOS users of maps ((Note that not all iOS users are maps users. Maps are not used by all users)), it leads to about 90 million Google Maps users on iOS and about 310 million Apple Maps users on iOS.  This includes iPad. ((We are excluding OS X use of Maps.))

    Given that Google also reported 1 billion downloads in 2014 ((though not necessarily all of these downloads lead to active use, obviously)) we can assume between 25% to 33% Apple Maps "market share" of usage.

    At the minimum, 25% share is not insignificant and it's easily sustainable. To understand why, we should note that there is one more data point. In December 2012 I posted an analysis on the the cost of maps. It showed that maintaining maps requires an investment of between $1 billion and $2 billion/yr. With the addition of new features such as 3-D mapping, transit maps and thousands of new cities, the cost is likely to have increased. $2 billion/yr is probably the norm today.

    Apple then could be seen as spending about $6.5/user/yr on maps and Google could be spending about $2/user/yr. To be profitable Google would need to find ad revenues of $2/user/yr and Apple would need to find $6 of profit on each phone/yr. Clearly, each of these targets is achievable.

    In contrast we can see why Nokia's HERE Maps business is now worth a lot less than it was in 2007. The asset has been for sale for some time and the latest bid  has been for $3 billion, making the $5 billion lost in market value and $7 billion of investment since seem like a catastrophe. Without a business model the data is worthless--with only 30 million users the cost per user reaches $66/yr. A buyer needs to find an appropriate model for sustaining a $2 billion/yr burn rate.

    So the question of where maps are going depends on the business model for maps. In a world where maps are sustained by device value, 300 million users makes it sustainable. In a world where maps are sustained by advertising, 1 billion users makes it sustainable. What else is there?

    How about a world where maps are sustained by transportation services?

    Uber's and other auto makers' interest in HERE shows a third business model. Accurate maps are a key to making vehicles autonomous. More so even than the value of the algorithms, precise imaging of roadways enables vehicle autonomy and the value of location gathering systems should grow to meet that future.

    It's highly likely that Google's maps efforts are going to continue because they are fueled by a business model. That is also true for Apple's maps efforts, though they are fueled by an entirely different business model. Each of these business models fuels the improvement of the maps product but also of the maps gathering process. As these processes are expensive and licensing options are few there is little incentive to share the data. As a result the processes remain integral to the businesses.

    This integrated-while-fueled nature means that maps makers will find it compelling to pursue adjacent business models, i.e. transportation services. It's not a matter of whether they will or won't. It's only a matter of when and where.

  11. Schiller's Law

    Research · 9 comments

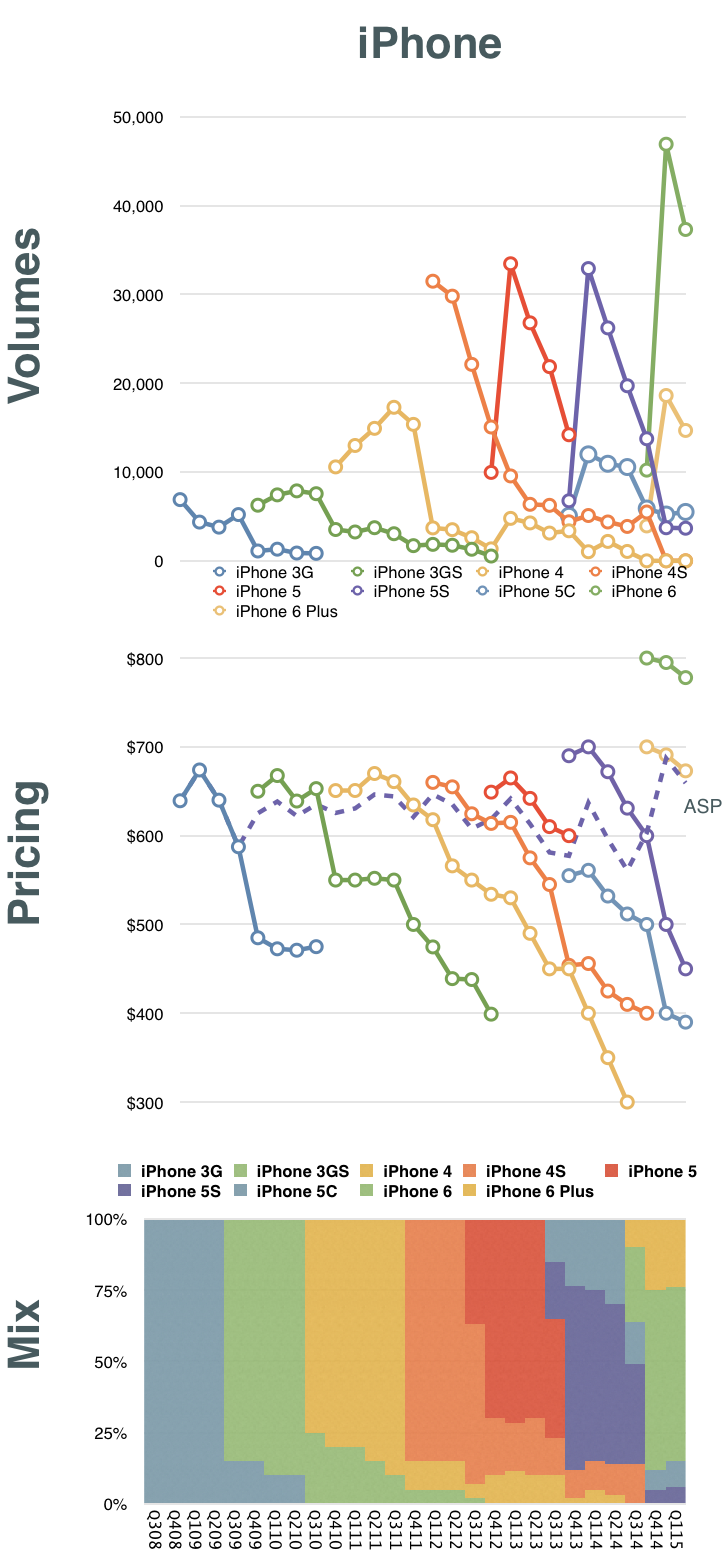
    We know how many iPhones Apple ships but we don't know exactly how many of each model. We can try to come close in such estimates of "mix" by looking also at the market pricing of the phones and the average price Apple obtains ((ASP = Revenue/Units shipped. However, note that there are deferrals in revenue as part of this.))

    Combining what we know with some guesses allows some of us to estimate the composition of iPhone models in any given quarter's sales. Here is a graph showing my estimates:


    Screen Shot 2015-05-22 at 2.53.36 PM

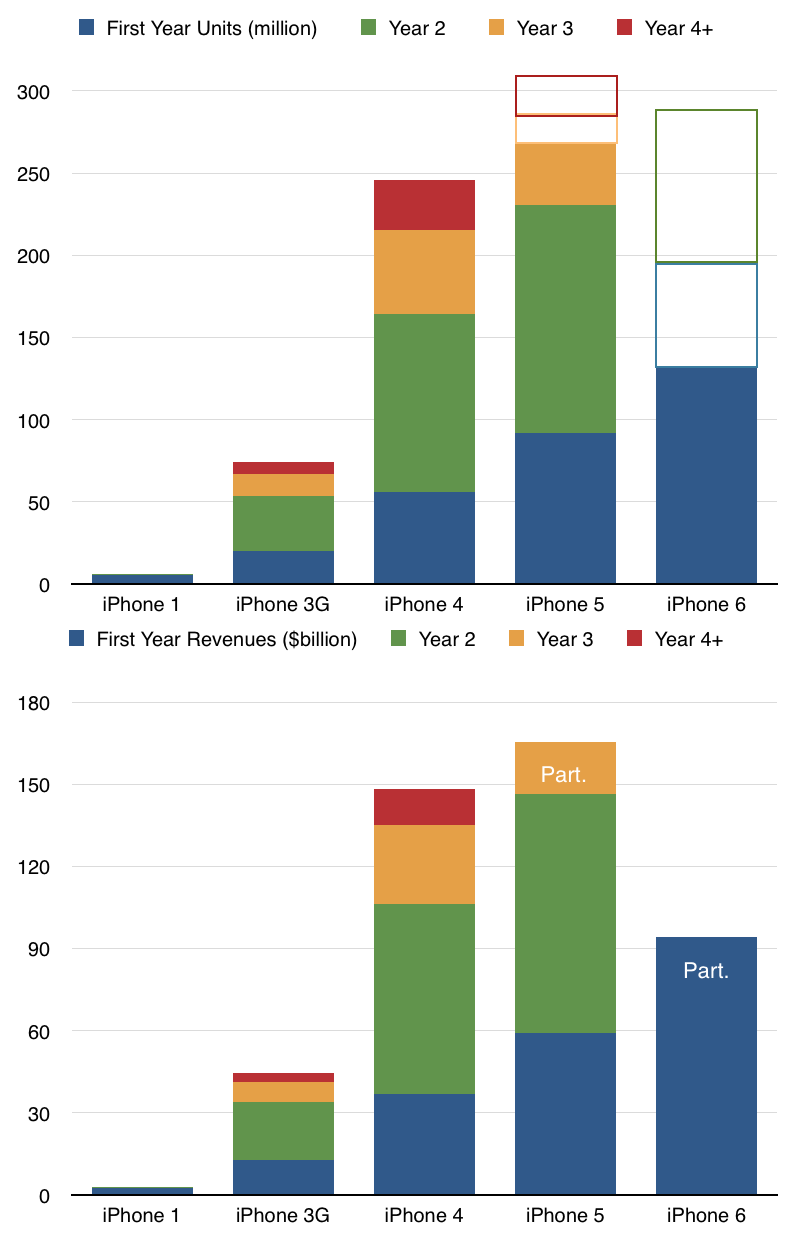
    Having this, we can then assess how each generation of iPhones has performed. Remember that although we had a new iPhone for each of the last eight years, there are only 5 generations in total. Starting with the 3G (second generation) the generations were two yearly product cycles long.

    The resulting estimates for generational growth are shown below. 

    Screen Shot 2015-05-21 at 6.41.02 PM

    I included a second graph with revenues. Note that the iPhone 5 and iPhone 6 have not run their course. History suggests at least a five year run for any one generation and the 5 is at less than three years old and the 6 is at less than one.

    The interesting question is therefore not whether each generation sells more than its predecessor but whether it does so by a substantial multiple. I drew in outline a few estimates on future volumes for the 5 through its end of life and for the 6 for the current and next year. Of course these are highly speculative but the question of how much can be expected from these generational leaps is interesting.

    Recall that

    When assessing sales for a new model of the iPhone, Apple used an easy shorthand: "Each new generation sold approximately equal to all previous generations combined."

    Phil Schiller's Testimony in Apple v. Samsung trial

    Such a pattern of growth, which I call "Schiller's Law" is extremely difficult to maintain and probably won't apply in the case of the 5 or 6. However the growth of the overall franchise is very apparent. In particular you can see how first year sales have a very healthy pattern of growth, especially when measured in terms of revenues.