BofA raised the firm’s price target on Apple to $325 from $320 and keeps a Buy rating on the shares ahead of fiscal Q2 earnings due after market close on Thursday, April 30. The firm, which sees upside to Street estimates given continued strong sales of iPhone and double-digit growth in Services revenue, forecasts Q2 revenue and EPS of $113B and $2.00, respectively.
Revenues and growth rates for iPhone, Mac, iPad, Services, Wearables, plus Net Sales, Gross Margin, Operating Expense, Other Income and Expense, Tax Rate, Net Income, Share Count and EPS with a comparison to CFO guidance.
Kevan Parekh, Apple CFO: As we move ahead into March, I would like to review our outlook, […]. We expect our March total company revenue to grow by 13% to 16% year over year, which comprehends our best estimates of constrained iPhone supply during the quarter.
We expect services revenue to grow at a year-over-year rate similar to what we reported in December. We expect gross margin to be between 48-49%. We expect operating expenses to be between $18.4 billion and $18.7 billion, which is at a similar level to what we reported in December and driven by higher R&D on a year-over-year basis. We expect OI&E to be around $100 million, excluding any potential impact from the mark-to-market of minority investments, and our tax rate to be around 17.5%.
I've seen several market reports which estimate that iPhone shipments grew around 3% to 6% in the quarter. When I plug in, say, IDC's iPhones number into my model, and assume quite aggressive growth on the other categories (including Services) I get a y/y revenue growth of 11%. This is far below Kevan's January's guidance quoted above (13% to 16%).
Are IDC, Gartner, et. al. signaling a huge miss?
I need to point out that in the preceding December quarter the iPhone grew revenues at 23%! In order for Apple to hit its targets
I'd also point out that when Kevan Parekh made his forecast, in late January, a full month was already on the books for Apple. Visibility into the next month would have been relatively good as orders from the channel are partly foreseeable. For a change from implying nearly 20% growth in sales/14% in units one third of the way in, to IDC's 3% in units for the whole quarter would imply a collapse in demand into February and March. We're talking double digit decline in order volumes.
Moreover, IDC commentary on Apple is
Apple secured second place, driven by the strong performance of the iPhone 17 series, which saw significant growth in China of over 30%. This led to a 3.3% year-over-year increase in global sales for Q1. Although demand remains robust, supply disruptions and a reduction in channel support in some key markets have hindered growth..
30% growth in China! For this to be tied to 3.3% growth globally would imply significant declines elsewhere. I struggle to see how this adds up.
Here is my complete forecast for the quarter including growth rate for revenues for iPhone, Mac, iPad, Services, Wearables, Net Sales, Gross Margin, Operating Exp., OIE, Tax Rate, Net Income, Share Count and EPS with a comparison to CFO guidance.
Much more was said of Jobs’ departure signaling the end of Apple than of Gates’ departure signaling the end of Microsoft. And much more was celebrated of Apple 50 than Microsoft 50. Why is that?
If you were to structure an experiment to determine the influence of processes and personalities on the outcomes of a company, you would be hard pressed to find a better pair to study. Apple and Microsoft were founded almost at the same time, due to the same enabling technologies (microprocessors) and led by two iconoclastic founders of the same age acting out of similar impulses.
The divergences were that one concentrated on software while the other on hardware. But rather than pairing up in a match made in heaven, both tried to outmaneuver the other in order to avoid dependency. →
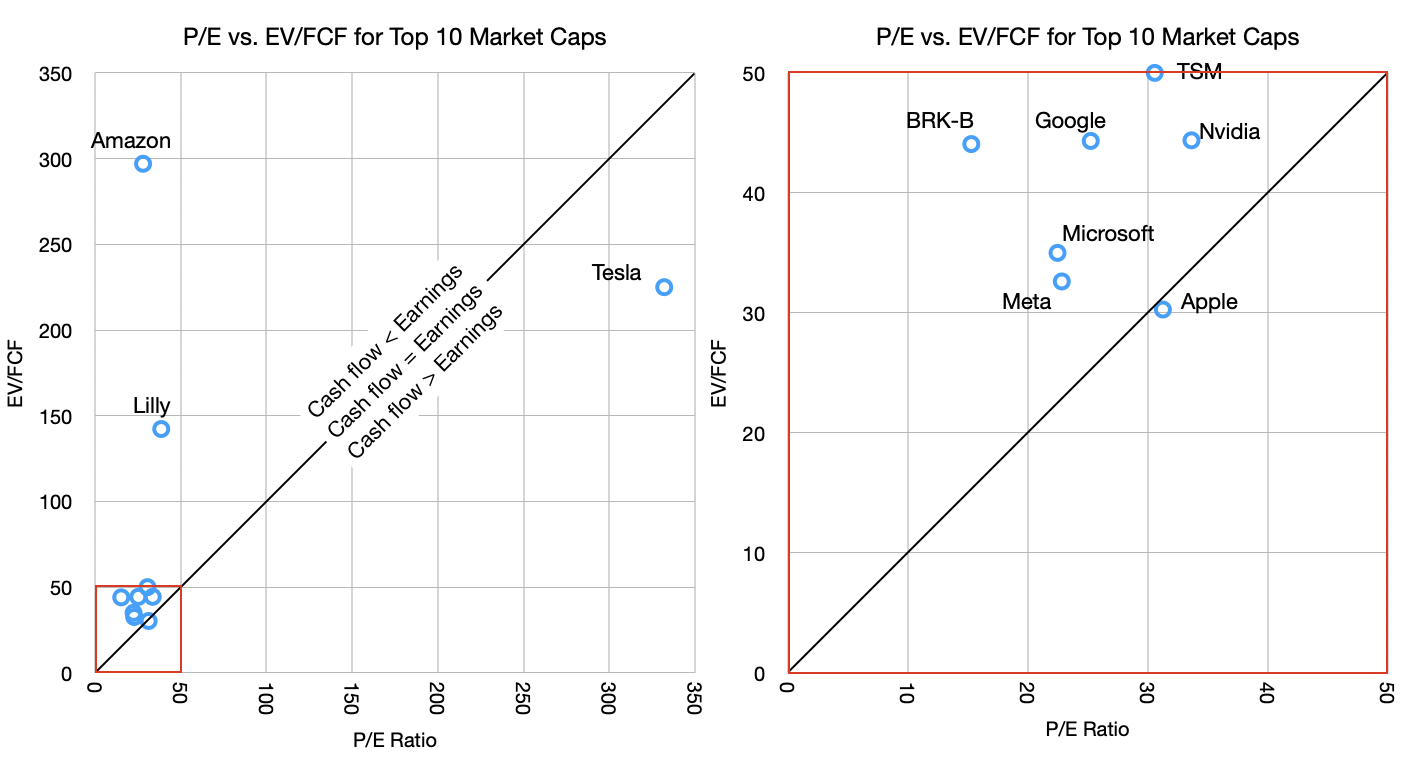
Cash flow is a fact, earnings are an opinion and share price is a dream.
A company’s total worth is the number of outstanding shares multiplied by their value. This product is called the market capitalization or Market Cap.
That’s a simplification. If you want to be more accurate, you should take the Market Cap and net out cash and debt–these are not part of the future flows of cash that can benefit shareholders.
More precisely, there is another measure called the Enterprise Value (EV) which is the total price tag of a company, representing what it would cost to buy the entire business and pay off its debts. EV = Market Cap + Total Debt + Preferred Stock + Minority Interest – Cash and Cash Equivalents.
This is the precise and complete measure of the firm’s value but we use the shortcut of Market Cap since In most cases the Preferred stock and minority interest are negligible and if cash equals debt then the result is EV =~ Market Cap. it’s easier to calculate anyways as the shares outstanding and share price are easily available. Not so for EV. →
What are the odds of it surviving another year, ten years, 50 years?
Companies don’t last long. A recent study that analyzed thousands of European firms yielded a corporate life expectancy figure of 12.5 years. The Boston Consulting Group analyzed the entry, growth, and exit dates of 35,000 publicly listed companies and determined that one in ten of all public companies fail each year, a fourfold increase since 1965.
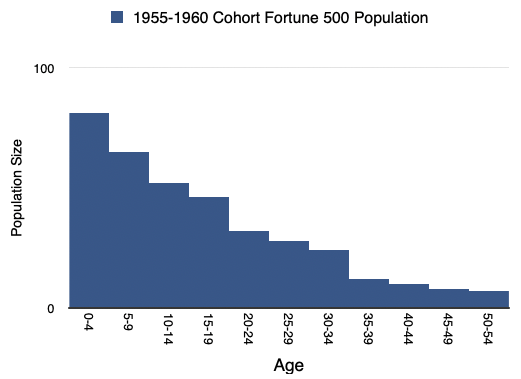
As I illustrated many years ago in a talk titled “The Unfortunate 500” most companies die not long after adolescence. Of the Fortune 500 1955-1960 cohort, the 81 companies which joined the index in those years, only 7 remain there today. One third of the corporations on the 1970 Fortune 500 list were no longer in existence thirteen years later. Broadly speaking, as a population, large companies that make it to the Fortune 500 listing have life expectancy within that group of 17 years. →
Today marks the 16th anniversary of when Apple released the first-generation iPad.
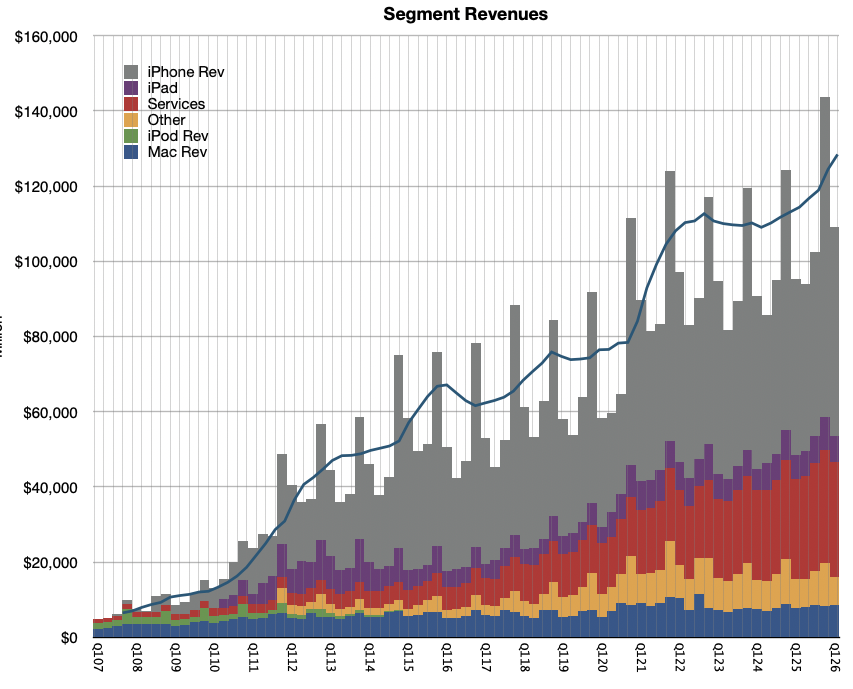
To many, including Alan Kay, the tablet form factor makes much more sense than the PC form factor. It’s more approachable, more intuitive and certainly smaller and more portable. As the graph shows, quickly after launch, the iPad overtook sales of the Mac.
The problem arose that whereas the iPad was smaller, the iPhone what smaller still–so much so that users would take phones with them everywhere. At the same time, the “PC” shrank as well so that many notebook (laptop) computers became thin, light and had day-long battery life. The Mac at least became no bigger a burden to carry than an iPad.
So the iPad was stuck in the middle between an iPhone, that did more and more, and a Mac that was very portable. At this point many said that the iPad was a dead end form factor. →
ON September 3, 1821, 37 years after James Watt invented the concept of horsepower and started charging £5/horsepower/year for the use of his steam engine, the first demonstration of the production of a mechanical force by the interaction of an electric current and a magnetic field was given by Michael Faraday in the basement of the Royal Institution in London.
1820 is, in many chronicles, noted as beginning of the industrial revolution. It marked the end of 50 years of war, whose conclusion unleashed pent-up demand. That demand was served by relatively free trade, guaranteed by British naval power, coupled with property rights and financial instruments which allowed inventions of the previous century to finally be harnessed for commercial gain. The steam engine is the canonical invention of the era and its implementation as a source of power for factories, shipping, rail and machinery is legend.
Not usually noted as coincidental to this period is the electric motor. Yet not long after Faraday’s 1821 demonstration in London, the first DC electric motor capable of turning machinery was invented by William Sturgeon. In 1832 he built on Faraday’s electromagnet by incorporating a commutator which oscillated the direction of current to ensure continuous rotation.
Nota Bene.
The Motley Fool asks: Where Will Apple Stock Be in 5 Years? → Not reading this article is probably a wise decision. Shares could perform in line with the S&P 500’s long-term average Investors can follow a straightforward exercise to try and figure out where Apple’s stock price will be in late March 2031. It’s important to consider both the valuation and profit gains. We just released a […] →
Apple’s services continue to see increased engagement, spending → The survey of 3,500 smartphone users reveals a significant rise in average monthly spend on Apple services to $13, driven by increased adoption of premium offerings like AppleCare/One, Apple TV+, and Apple Music, with notable shifts towards AI features despite muted upgrade intent, though potential US bias may affect overall accuracy. →
iPhone sales continue to surge into February – Bernstein → February saw robust iPhone sales driven by the iPhone 17 line, with global unit sales up 26% and ASP climbing 6.9%, yet January-February revenue estimates oddly lag behind projections, sparking confusion. →
Morgan Stanley has a stark message for investors in Apple → Morgan Stanley's survey indicates strong potential for Apple stock, highlighting record iPhone upgrade intentions, especially in China, improved switching rates, and significant interest in a future foldable iPhone. These factors support robust FY26 shipment forecasts and suggest a possible revenue boost from new products. Despite some concerns about declining willingness to pay for AI features, Morgan Stanley maintains an optimistic outlook with a $315 price target. The article criticizes TheStreet's editorial approach for misrepresenting the positive survey findings as negative news about Apple. →
Mac mini and Mac Studio orders booming → Apple's Mac sales are surging due to the M5 chips' enhanced AI capabilities, outpacing other platforms and driving demand despite current shipping delays. →
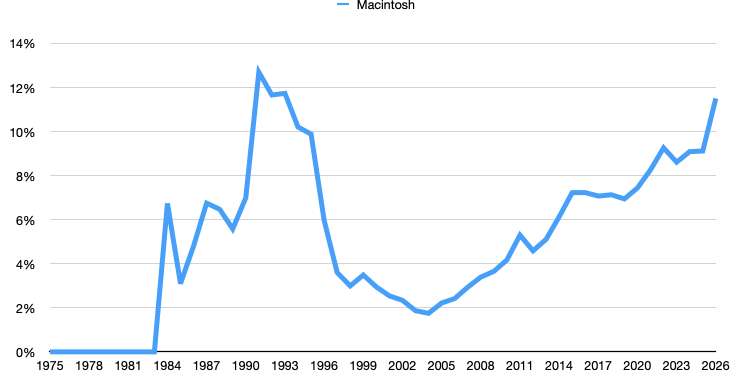
Gartner adds their Mac Q1 estimate to the pile → In Q1 2026, Apple's Mac sales surged impressively by 10.7% to 12.7% year-over-year, driven by the MacBook Neo's appeal, securing a 10.6% global market share and maintaining fourth place among PC vendors, amidst a 4% rise in overall PC shipments. →
Morgan Stanley just published survey data that makes a strong case for owning Apple stock. The firm's AlphaWise Global Smartphone Survey was released March 22. It shows iPhone upgrade intentions hitting an all-time survey high.
The data support the bank's above-consensus iPhone forecast. Morgan Stanley keeps its overweight rating and $315 price target unchanged. The stock closed at $247.99 on March 20. That target implies roughly 27% upside from that level.
The headline number is a blended global iPhone upgrade rate of 37%, up 2 percentage points year over year. That is the highest reading in the survey's history. The driver is China, where upgrade intentions surged 9 points year over year to reach their own all-time high in the survey.
On the switching side, Apple's net switching rate improved to 11%. That is a five-year high. Apple was the only major smartphone brand in the survey with a positive and improving net switching rate.
Samsung, Xiaomi, Huawei, and others were all negative. That positions Apple to gain market share in 2026 even as the overall smartphone market faces pressure.
Together, these data points support Morgan Stanley's FY26 iPhone shipment forecast of approximately 260 million units, which sits 3% above Street consensus.
The most surprising result in the survey may be the level of interest in a foldable iPhone. Morgan Stanley found that 27% of global iPhone owners are “extremely interested” in paying for one. In China, that figure rises to nearly 40%.
Morgan Stanley expects Apple to more than double the global foldable smartphone market within 18 months of launch. The base case puts foldable iPhone revenue at approximately $40 billion. The bull case reaches $60 billion.
The foldable iPhone is expected to launch in fall 2026 alongside the iPhone 18 Pro lineup. If the survey data translates to actual purchases, the FY27 revenue impact would be significant. Morgan Stanley's FY27 iPhone revenue estimate is already 14% above Street consensus. The foldable is a big reason why.
Apple Intelligence ranked seventh globally as a reason to upgrade to an iPhone.
Willingness to pay for Apple Intelligence fell. Respondents said they would pay approximately $8 per month for an unlimited subscription, down from roughly $9 per month in the prior year's survey.
Morgan Stanley flagged this as a risk worth watching. AI features remain important to smartphone buyers broadly. But Apple appears to be lagging Android competitors in consumer perception of its AI capabilities.
Morgan Stanley laid out the key variables investors should watch this year:
iPhone upgrade cycle. Record upgrade intentions suggest the aged iPhone installed base is beginning to refresh. Replacement cycles are expected to contract by 0.2 years in 2026, which supports shipment volumes.
Foldable launch execution. The survey demand signal is encouraging, but first-generation foldable adoption is inherently uncertain. The revenue upside is large if execution is strong.
Memory cost impact. Unprecedented memory price inflation is expected to push global smartphone prices higher. Morgan Stanley sees this as a bigger headwind for Android competitors than for Apple, given Apple's pricing power. But the June quarter gross margin guidance will be the first real read on how Apple is managing the cost pressure.
Apple Intelligence revamp. The 2026 Siri upgrade needs to meaningfully improve consumer perception. The current trajectory is moving in the wrong direction.
Morgan Stanley's $315 price target is based on 8.5x EV/Sales on FY27 estimates. That implies approximately 32x FY27 EPS of $9.74. Its revenue forecast sits well above the Street even as its EPS estimate is broadly in line with consensus.
The survey does not guarantee an upgrade supercycle. But the data points in that direction. An aged installed base, record upgrade intentions, strong switching dynamics, and a new form factor in the back half of the year make for a compelling setup.
Morgan Stanley thinks the market is not fully pricing that in yet.
Global notebook shipments are showing clear signs of further weakening, according to TrendForce’s latest findings on the notebook industry. Subsequently, TrendForce has revised its 2026 full-year shipment forecast downward from -9.2% to -14.8% YoY amid expectations of deteriorating end-market demand and rising supply chain costs, reflecting a deeper industry correction.
TrendForce estimates that Apple’s notebook shipments will grow 7.7% YoY in 2026, outperforming the broader market trend. This is based on Apple’s ability to expand into lower price segments, adopt a proactive pricing strategy, and maintain stronger chain control than its peers.
Attach rates for iCloud reached about 42%, while Apple Music stood near 30%
The iPhone ecosystem is showing signs of increased customer loyalty and steady demand, while its high-margin services business remains a key support to profitability, according to UBS analysts.
The bank, which maintains a 'Neutral' rating on Apple with a 12-month price target of $280, cited findings from its Evidence Lab survey of roughly 4,000 iPhone users globally. The data suggests that iPhone “stickiness” continues to improve, even as replacement cycles remain relatively stable.
UBS said the average age of iPhones in use globally was largely unchanged year-over-year at about 33 months. Outside China, device age edged slightly higher to around 38 months, a trend the analysts said could push some upgrade demand into 2027.
At the same time, customer retention strengthened, with the global iPhone retention rate rising about 200 basis points to roughly 74%. Gains were particularly notable in the United States and China, where retention increased by 200 and 700 basis points, respectively. UBS belives that this indicates Apple is maintaining share despite a competitive smartphone market.
Purchase intent also improved across regions, with more surveyed users indicating their next smartphone would be an iPhone. The UK recorded the largest increase, while China also saw a meaningful rise despite what UBS described as a challenging competitive backdrop.
The report highlighted continued growth in Apple’s services ecosystem, particularly iCloud and Apple Music. Attach rates for iCloud reached about 42%, while Apple Music stood near 30%, trends UBS said should help sustain services gross margins above 75% through fiscal 2026 and 2027.
Higher-tier iCloud usage is also increasing, even as Apple raises base storage on newer devices. Among iPhone 17 users, 77% reported subscribing to mid- to high-tier iCloud storage plans, compared with roughly 60% across the broader installed base. UBS noted that additional services uptake carries incremental gross margins of at least 90%, helping offset potential pressure from rising memory costs.
On the hardware side, consumers are also opting for higher storage configurations. UBS wrote that 56% of iPhone 17 users purchased models with more than the base storage, up about 800 basis points year-over-year. This shift could support product margins, with incremental storage estimated to generate gross margins of around 75% on roughly one-fifth of sales.
Looking at the installed base, UBS estimates about 68% of iPhones in use are from the 14 through 17 series, while around 40% are Pro or Pro Max models. The analysts said this premium segment could be a target market for a potential foldable iPhone, though they expect the opportunity to be relatively limited given the anticipated price range of $2,000 to $2,500.
UBS estimates a foldable launch could result in as many as 8 million units in fiscal 2026, contributing roughly 6 million incremental iPhone shipments, or about a 2% uplift to its forecast of 251 million units.
Apple may not have a clear trigger to push the stock higher right now, according to top KeyBanc analyst Brandon Nispel. He reiterated a Sector Weight (Neutral) rating on the stock, saying recent spending data and current valuation leave limited room for near-term upside.
KeyBanc’s consumer spending tracker showed indexed spending down 9% month over month in February, worse than the three-year average decline of about 4%. On a yearly basis, spending rose 4%, slightly above January’s 3% growth. Nispel said the data from January and February remains mixed, making it difficult to draw firm conclusions about Apple’s demand this quarter.
KeyBanc also updated its forecasts after Apple’s recent product launches. The firm now expects Apple’s Fiscal 2026 revenue to reach about $466.5 billion. It also raised its Fiscal 2026 earnings estimate to $8.52 per share and Fiscal 2027 earnings to $9.11 per share. For the second quarter of 2026, KeyBanc estimates revenue of about $108.7 billion, which would represent roughly 14% year-over-year growth.
With Apple trading close to its historical valuation levels, Nispel said he does not see a “clear near-term catalyst” that could push the stock higher.
Turning to Wall Street, analysts have a Moderate Buy consensus rating on AAPL stock based on 15 Buys, nine Holds, and one Sell assigned in the past three months. Furthermore, the average AAPL price target of $305.18 per share implies 17% upside potential.
Latest data indicates 88% of teens own and intend to purchase iPhones, marking a decade-long trend of increasing adoption. This phenomenon transcends mere functionality; the iPhone has become a cultural icon, symbolizing status and identity.
Unlike other Apple products, such as Apple TV+ or Apple Music, which struggle for traction among teens, the iPhone's appeal is deeply woven into the social fabric, partly due to generational continuity—the children of early iPhone adopters are now loyal users themselves.
In contrast, social media platforms illustrate the fickle nature of tech usage among younger demographics. While Facebook remains prevalent among older millennials, Gen Z gravitates towards Instagram and TikTok, reflecting shifts in cultural preferences and digital behaviors.
For Apple, success in services like Music and TV+ hinges on leveraging existing family dynamics through bundling.
On the Q4 call, Tim Cook highlighted Greater China’s 38% year-over-year revenue growth, fueled by record iPhone sales, strong upgrade activity, and double-digit retail traffic gains.
Europe, however, drew little attention—despite generating more revenue for Apple than China. This is peculiar.
Europe’s smartphone market shows steady structural gains for iOS. Since 2018, share has risen from 24% to 39%, while Android has fallen from 74% to 60%—a 15-point swing equal to roughly 70 million additional users. With an installed base near 459 million users versus about 300 million in the U.S., Europe combines scale with affluence.
In sum, the pattern for Apple in Europe is not saturation but share transfer, signaling durable competitive strength in a mature market and an inkling of how all markets will eventually behave in maturity.
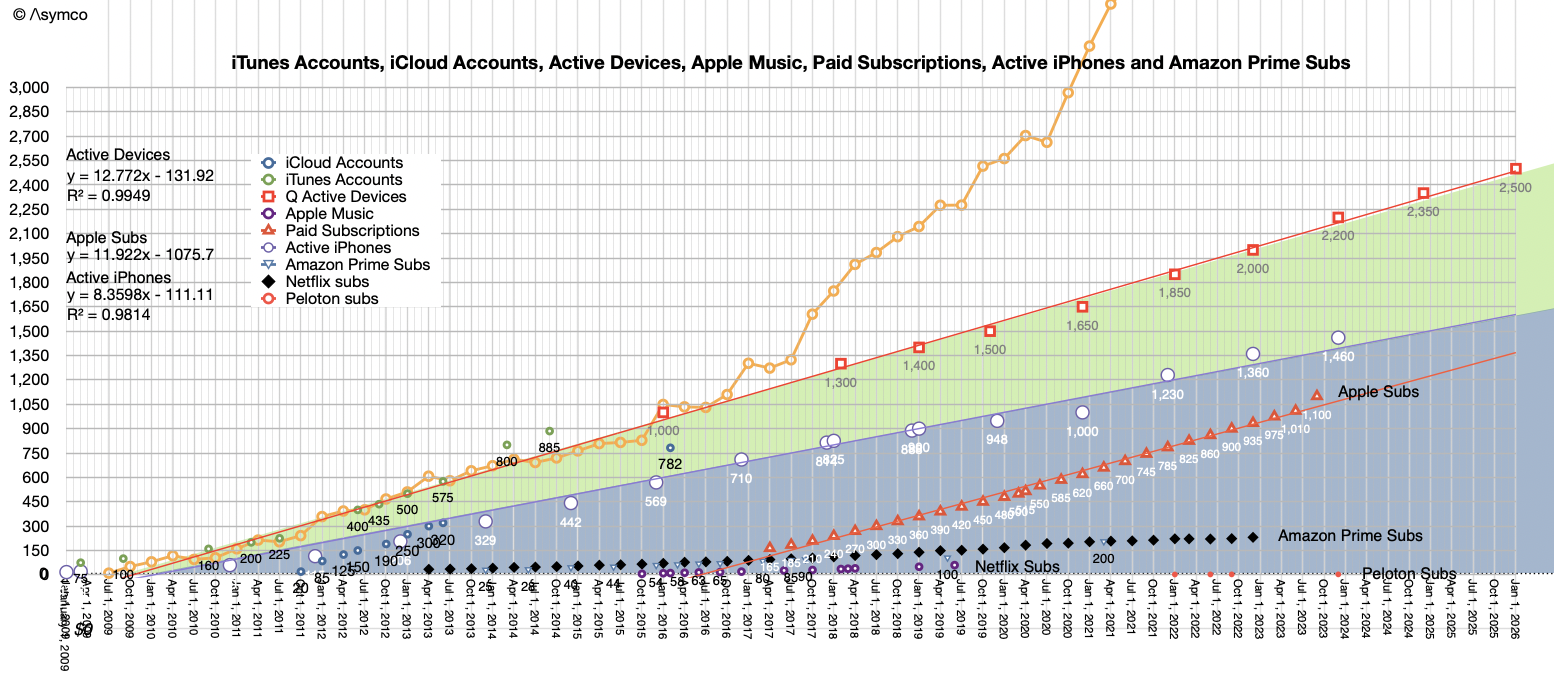
In the last quarter Apple reported 2.5 billion active devices. Of those, I estimate 1.6 billion are iPhones.
Using this as a base, I've created an iPhone installed base estimate looking forward to 2030, integrating Statcounter’s market share data, Ericsson’s global smartphone user forecasts, and BankMyCell’s smartphone install base.
The sources broadly align through 2025, though Statcounter’s historical iOS share (2017–2023) diverges somewhat, possibly reflecting Android’s heavier web traffic footprint due to usage patterns and bot activity rather.
Taken together, the data points to iPhone nearing 2 billion active devices by 2030, consistent with overall smartphone adoption. Android’s projected rise toward 4.5 billion users signals continuing headroom.
If switching dynamics and monetization trends persist, Apple’s ecosystem could expand to 2.5–3 billion users by 2035, with growth thereafter driven by switching and increased engagement depth and value extraction per user.
Apple Announces Special Event in New York, London, and Shanghai on March 4 → Apple is hosting intimate, global "Special Apple Experience" events on March 4, 2026, likely unveiling new products like the iPhone 17e and M5-powered MacBooks, marking a fresh twist on traditional live-streamed launches.
Apple adds video experience to Apple Podcasts → The "pod" in podcasts originated from Apple's iPod, with the company popularizing the medium by integrating podcasting into iTunes in 2005, and continuing to innovate with features like video podcast support and dynamic ad insertion.
Dan Ives Says Apple’s AI Alone Could Be Worth $1.5 Trillion → Apple's unparalleled distribution through its vast user base offers a significant competitive edge for rapidly monetizing AI innovations, potentially adding $1.5 trillion in value.
While big tech burns cash on AI, Apple waits → As foundation models commoditize, Apple strategically curates top AI tech into its ecosystem, prioritizing user experience over engine development.
Secure the chips, absorb the costs, and grab more market share → Apple faces memory cost inflation potentially raising iPhone prices, yet its strong ecosystem and execution provide resilience, whereas competitors like Samsung may struggle more due to lesser volume leverage.
iPhone Emergency SOS via Satellite Helped Six Skiers Survive Tahoe Avalanche → Six skiers survived a deadly Lake Tahoe avalanche by using iPhone's Emergency SOS via satellite, highlighting its transition from luxury to essential. This feature enabled crucial communication with rescuers in remote areas lacking cellular service. The evolution mirrors mobile phones but faces slower adoption due to satellite bandwidth constraints.
Bankers complain that Apple has a tight grip on mobile payments → Canadian banks struggled to compete in the mobile wallet market, dominated by tech giants like Apple and Google, due to their risk-averse nature clashing with tech's innovation-driven approach.
The all new Asymco One
Introducing Asymco One Early Bird Pricing. → Asymco celebrates 17 years of insightful Apple analysis, launching Asymco One to guide stakeholders through Apple's evolving era with comprehensive content and community engagement. →
Introducing: Asymco One Office Hours → Join Asymco One's monthly Office Hours with Horace to get live insights on Apple's business and financials, with special editions during key events.
We have a firm hold on the number of active devices as well as the number of iPhones in use. This is due to Apple reporting the data. The latest active device count was 2.5 billion and the estimate for active iPhones is 1.6 billion.
This patters also allows us to forecast the active base pretty accurately as the growth is predicted by the tight fitting linear approximation.
For more confidence it would be useful to confirm these predictions with different estimates. For this I turned to two additional sources: the Statcounter GlobalStats measure of Mobile Operating System Market Shares Worldwide coupled with Number of Smartphone Users Worldwide (forecast by Ericsson) and the Number of of iPhone Users from Bankmycell.
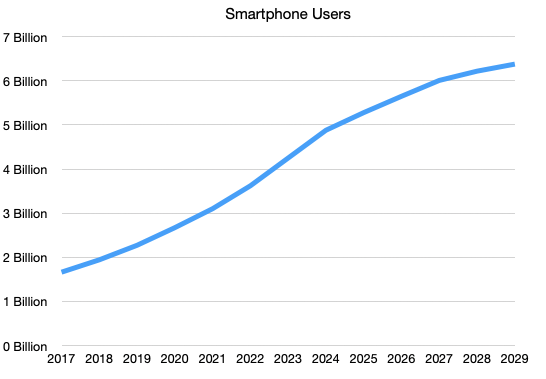
The total Smartphone Users history and forecast is shown below:
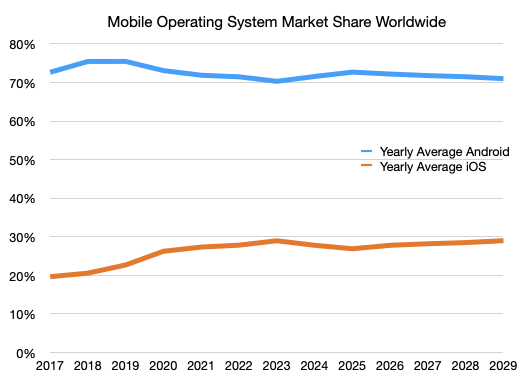
The Mobile Operating System Market Share Worldwide is shown below:
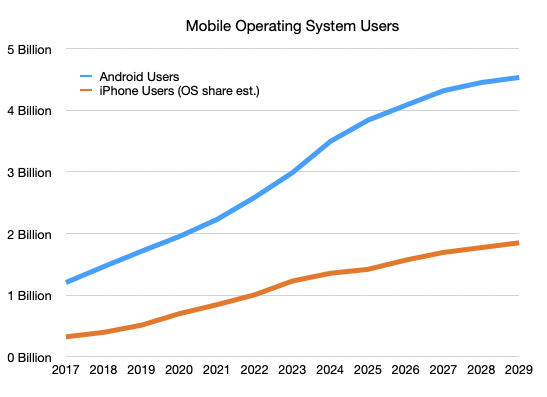
Multiplying these two yields the Mobile Operating System Users
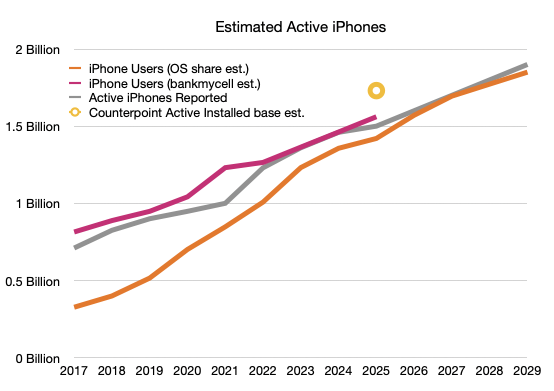
The iOS users (orange line) can now be compared to Apple's own reported active device total (grey line) and the Bankmycell estimate as well as a derived estimate from Counterpoint (24% share of install base)
The graph includes forecasts from 2025 to 2029.
Discussion:
That, coupled with value captured per customer will determine the value of the firm.
GF Securities said a recent survey on the tech giant's supply chain suggests a “solid outlook.”
“Following the earnings call on Jan. 29, 2026, we did a supply chain research which indicates strong iPhone build momentum (incl. 2H26’s models) as well as cost management aiming to keep the starting selling prices of iPhone 18 Pro/Pro Max unchanged or at [a] similar level of iPhone 17 Pro/Pro Max,” analyst Jeff Pu wrote in a note to clients.
“Additionally, [the] Gemini partnership is to work on the Apple foundational model to power the Apple Intelligence, including the personalized Siri, which is the next key to watch in WWDC 2026.”
Pu reiterated his Buy rating and upped his price target [] on the back of higher 2026 and 2027 estimates.
Delving deeper, Pu said the upcoming fiscal third-quarter should see another “strong” iPhone build, with around 54M units, which would suggest a year-over-year acceleration. “For 2H26, we note that Apple is expected to launch 3 new iPhone 18 models (Pro, Pro Max, Fold), compared to 4 iPhone 17 models a year ago,” Pu added. “Yet, we expect a solid iPhone 18 build plan in 2H26 of 82m, compared to 89m of iPhone 17 in 2H25, despite [a] much higher [average] selling price. We attribute the key drivers to the new foldable model and Apple’s strategy of keeping iPhone 18 Pro/Pro Max pricing largely the same as that of iPhone 17 Pro/Pro Max by managing memory/display cost. That said, we expect a significant iPhone ASP increase in CY2H26 driven by mix.”
On the company's recent earnings call, Apple management, led by CEO Tim Cook, said revenue is expected to grow between 13% and 16% year-over-year.
Looking to the cost of the iPhone 18 Pro and Pro Max, Pu said the recent impact of surging memory prices should be manageable. “For DRAM, we believe Apple has been negotiating with Samsung Memory and SK Hynix to reach favorable deals, considering Apple’s support in the past memory downcycle and the likely capital investments,” the analyst explained. “For NAND, we estimate the cost to be up ~70% QoQ in F2Q and suppliers are asking for 50-60% QoQ in F3Q. Overall, we expect the BOM cost of memory to increase from 9- 10% in F1Q to 12-13% in F3Q. To partially offset the cost of memory price and 2nm A20 Pro, we expect efforts on other big items such as display, cameras, etc.”