Asymco

Asymmetric Intelligence

estimate

  1. iTunes users spending at the rate of $40/yr.

    Research · 77 comments

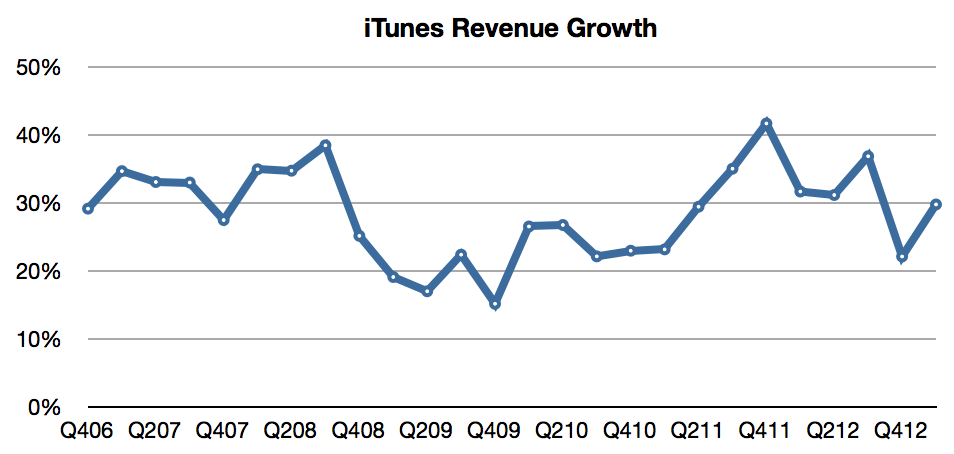
    In the latest quarter the iTunes top line grew by 32%. Additional newly reported items:

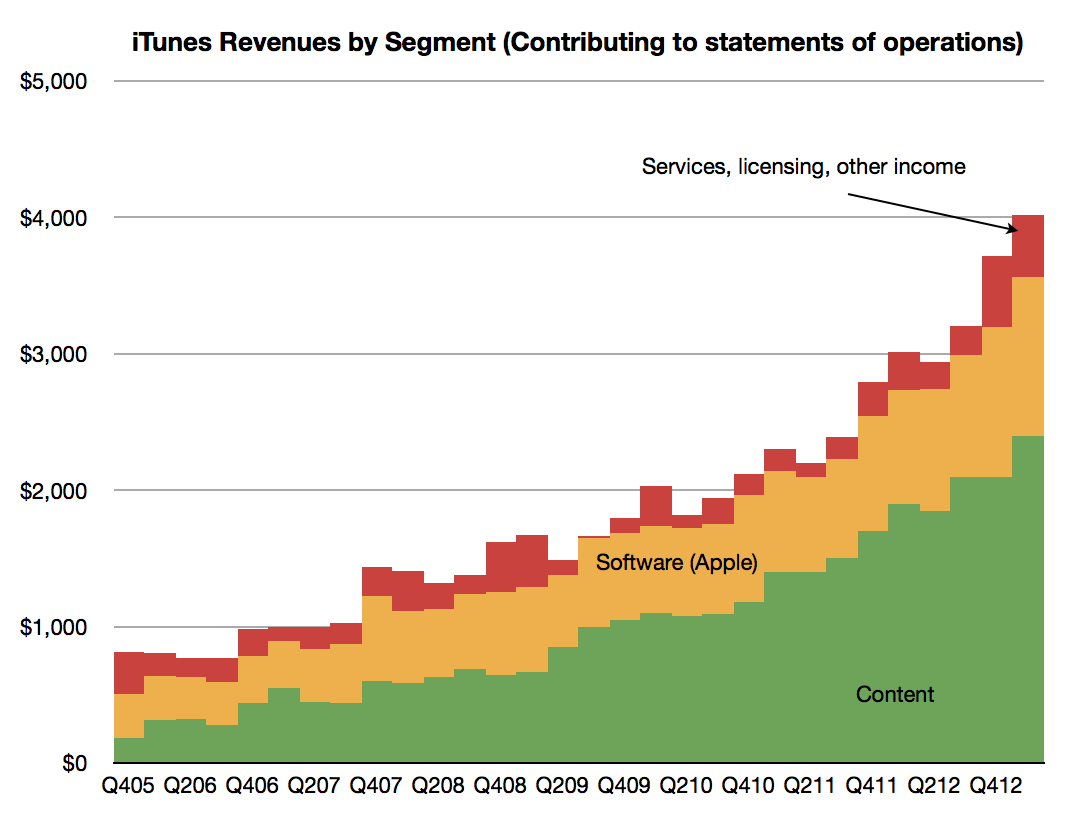
    • Quarterly revenues topped $4 billion (a new high) and the company suggests that this rate is maintainable by stating it has a “$16 billion annual run rate”. The pattern of revenues is shown below.
    Screen Shot 2013-05-12 at 5-12-8.12.30 AM
    • The content portion of iTunes revenues was $2.4 billion, up from $2.1 billion sequentially. Growth into Q1 is not unusual as many holiday iTunes gift cards are redeemed during January.
    • Revenue growth has been surprisingly steady, averaging 29%/quarter for more than six years.
    Screen Shot 2013-05-12 at 5-12-8.20.06 AM
    • Music is now available in 119 countries.
    • The Music catalog now consists of 35 million songs.
    • Movies are available in 109 countries. 60,000 titles are offered.
    • iBookstores are present in 155 countries offering 1.75 million iBooks.
    • There are iTunes App Stores in 155 countries whose residents make up about 90% of the world’s population.
    • iOS developers have created more than 850,000 iOS apps, including 350,000 made for the iPad.
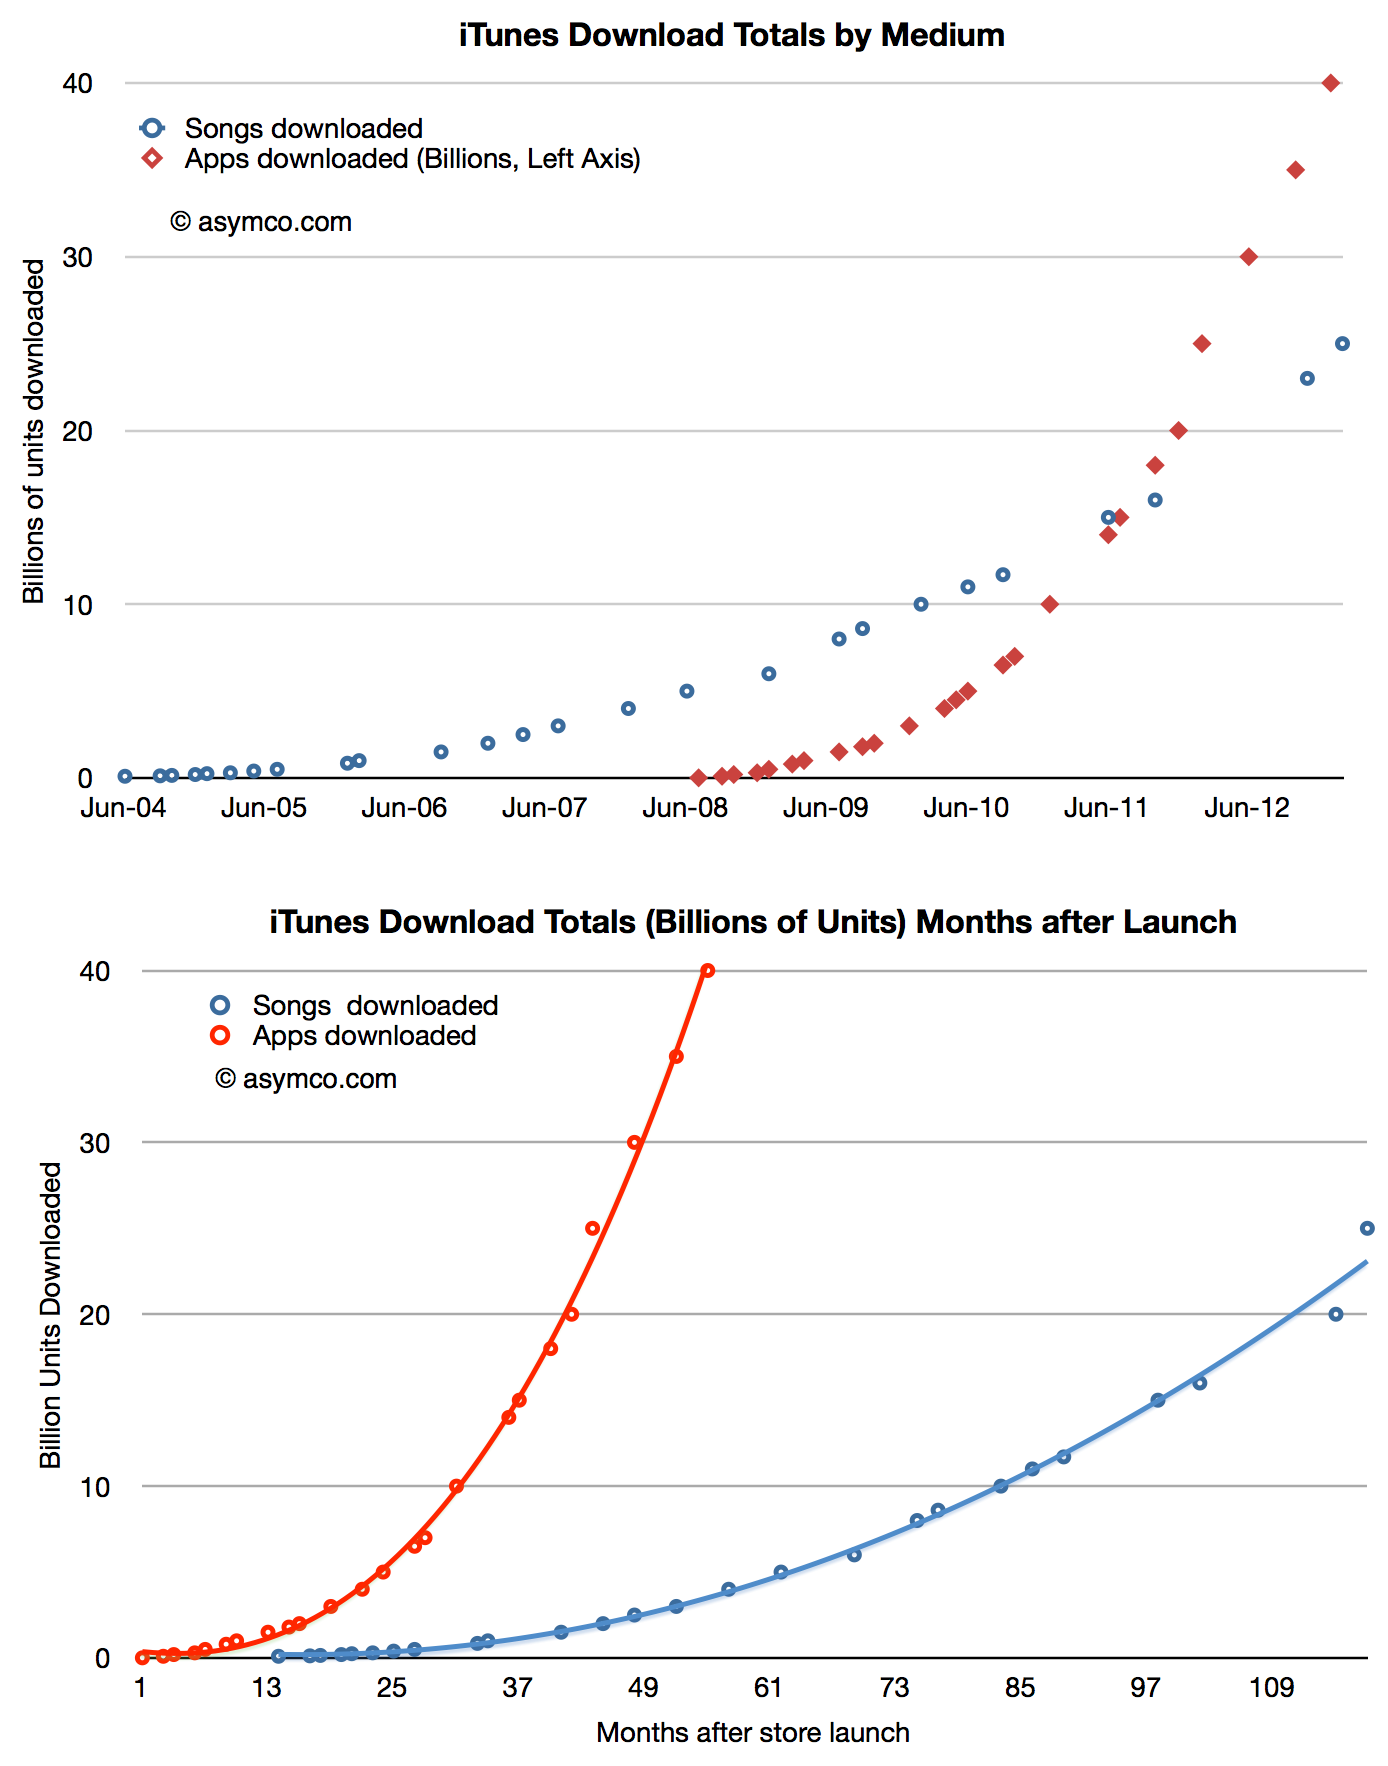
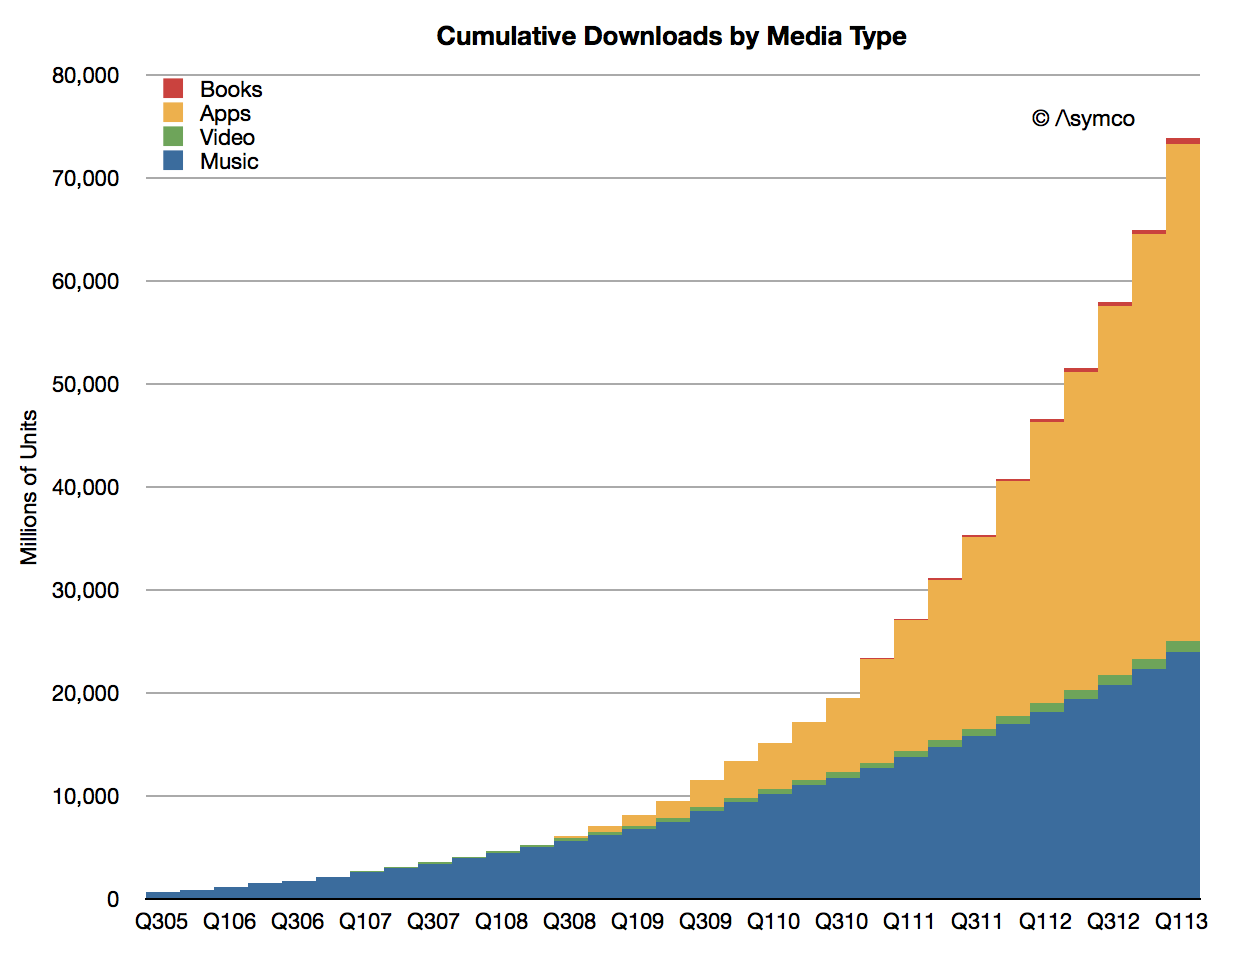
    • Cumulative app downloads have surpassed 45 billion and are on track to reach 50 billion at time of writing (estimated to be reached mid May).
    Screen Shot 2013-05-12 at 5-12-8.21.31 AM
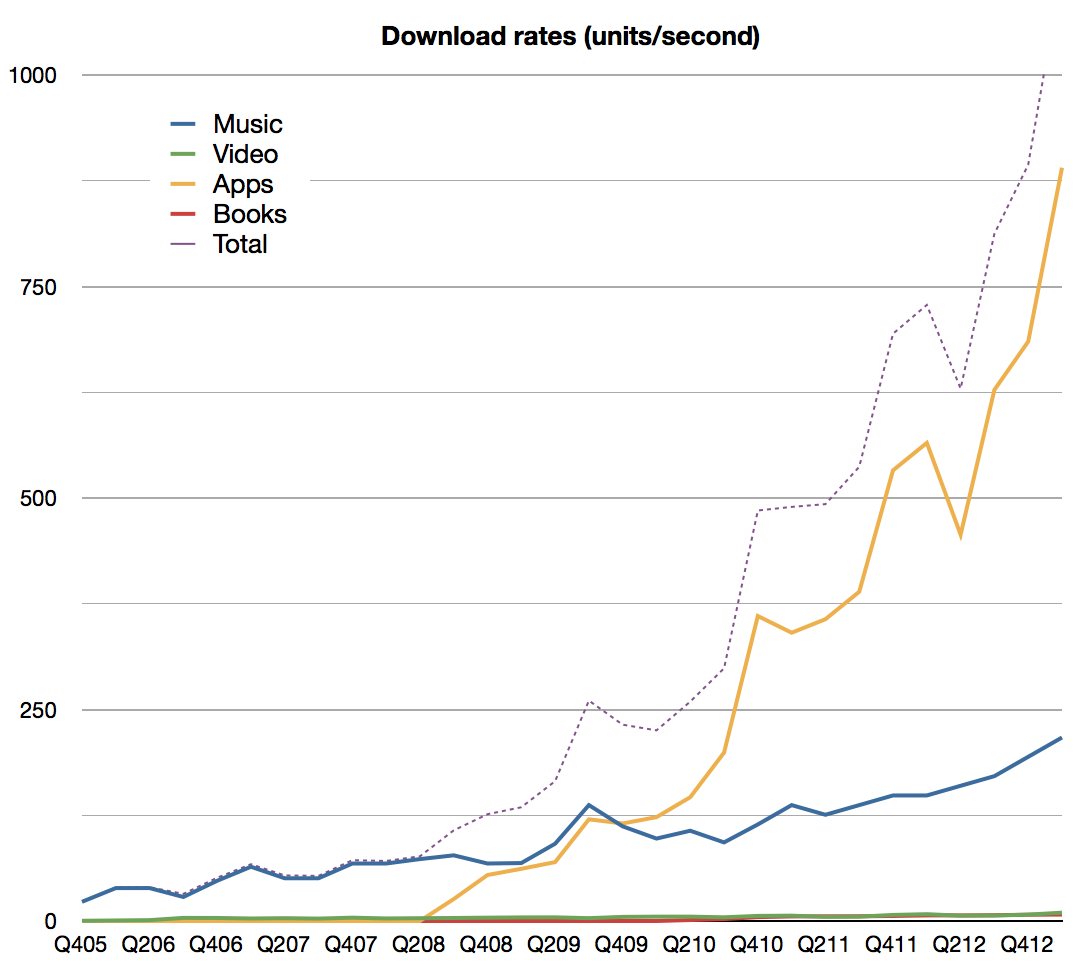
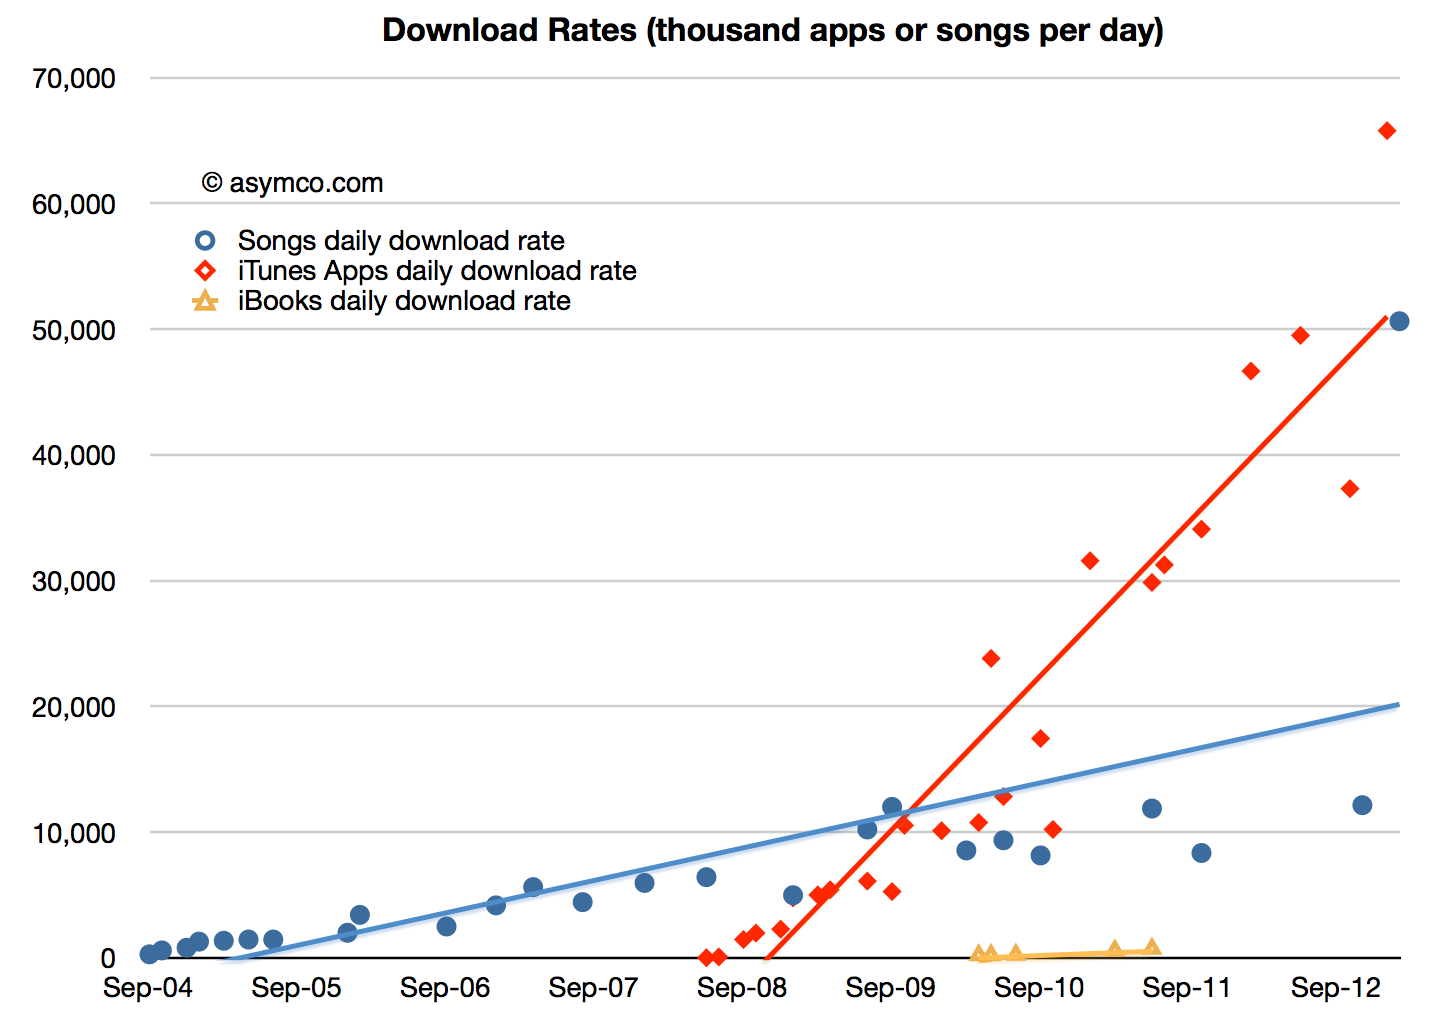
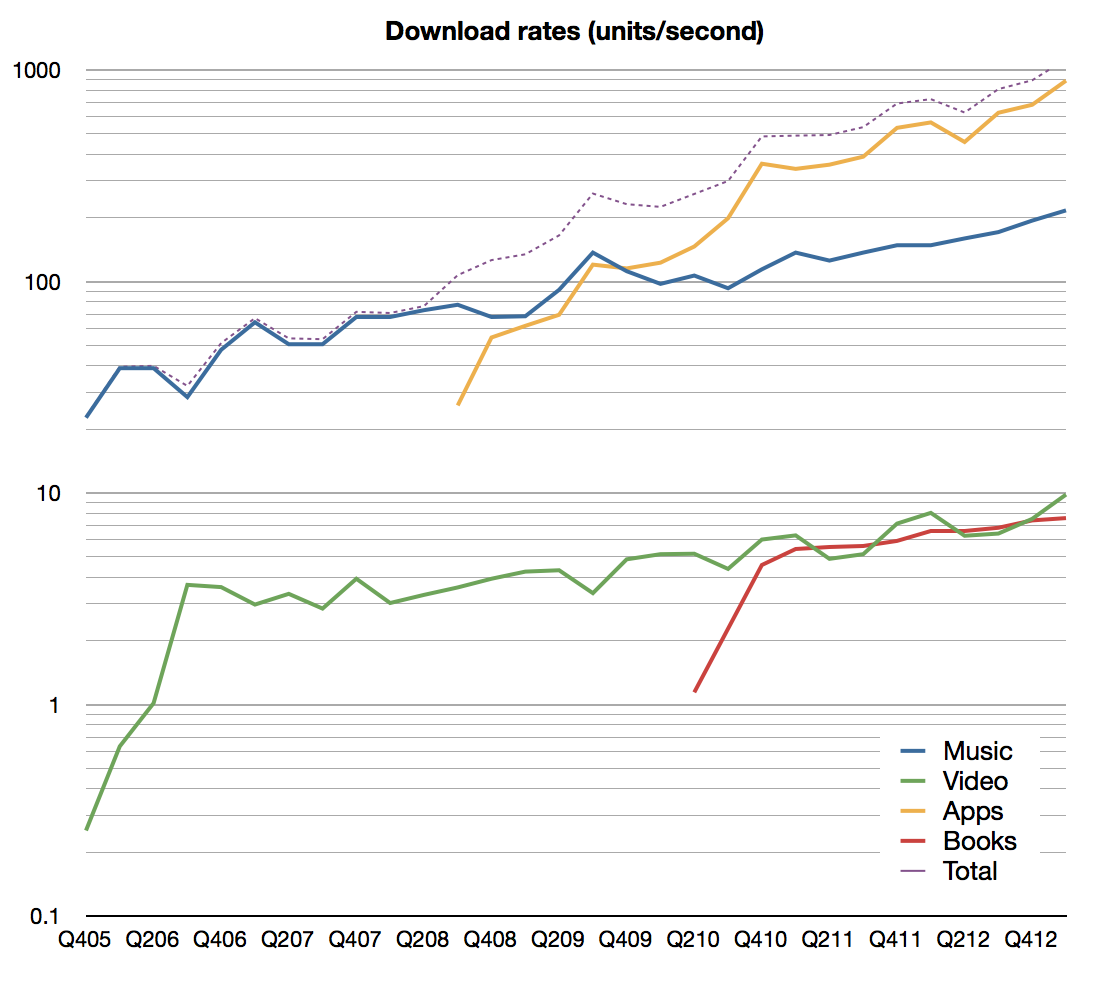
    • The company reports that over 800 apps are downloaded per second. Including all media, the download rate is now above 1000 items per second. Estimated download rates by media types are shown below (note: first graph is plotted on a log scale):
    Screen Shot 2013-05-12 at 5-12-8.34.37 AM


    Screen Shot 2013-05-12 at 5-12-9.07.49 AM


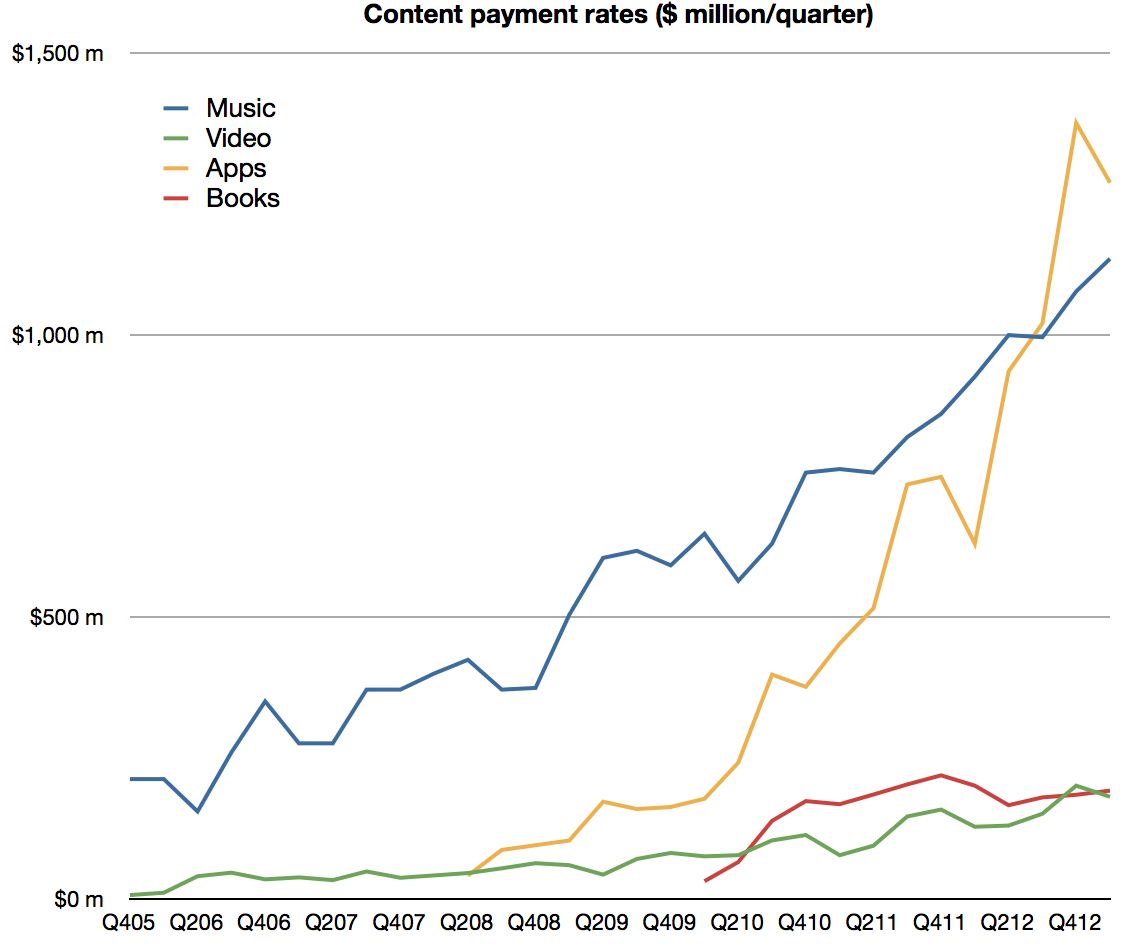
    • App developers have been paid over $9 billion for their sales through the App Store including $4.5 billion in the most recent four quarters. I estimate the split between media types as follows:
    Screen Shot 2013-05-12 at 5-12-9.13.48 AM
    • Canalys estimates that sales from iTunes App Store accounted for 74% of all app sales worldwide in the March quarter.
    • iOS app revenues more than doubled year-over-year.

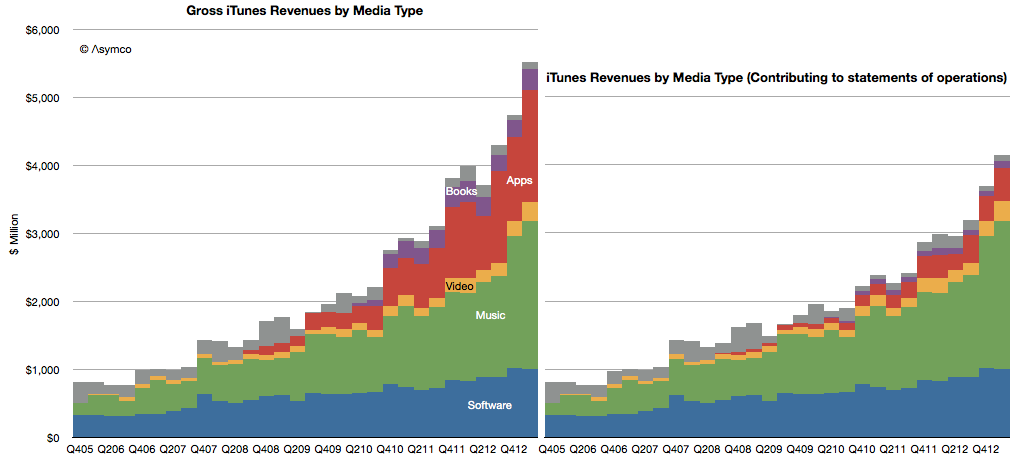
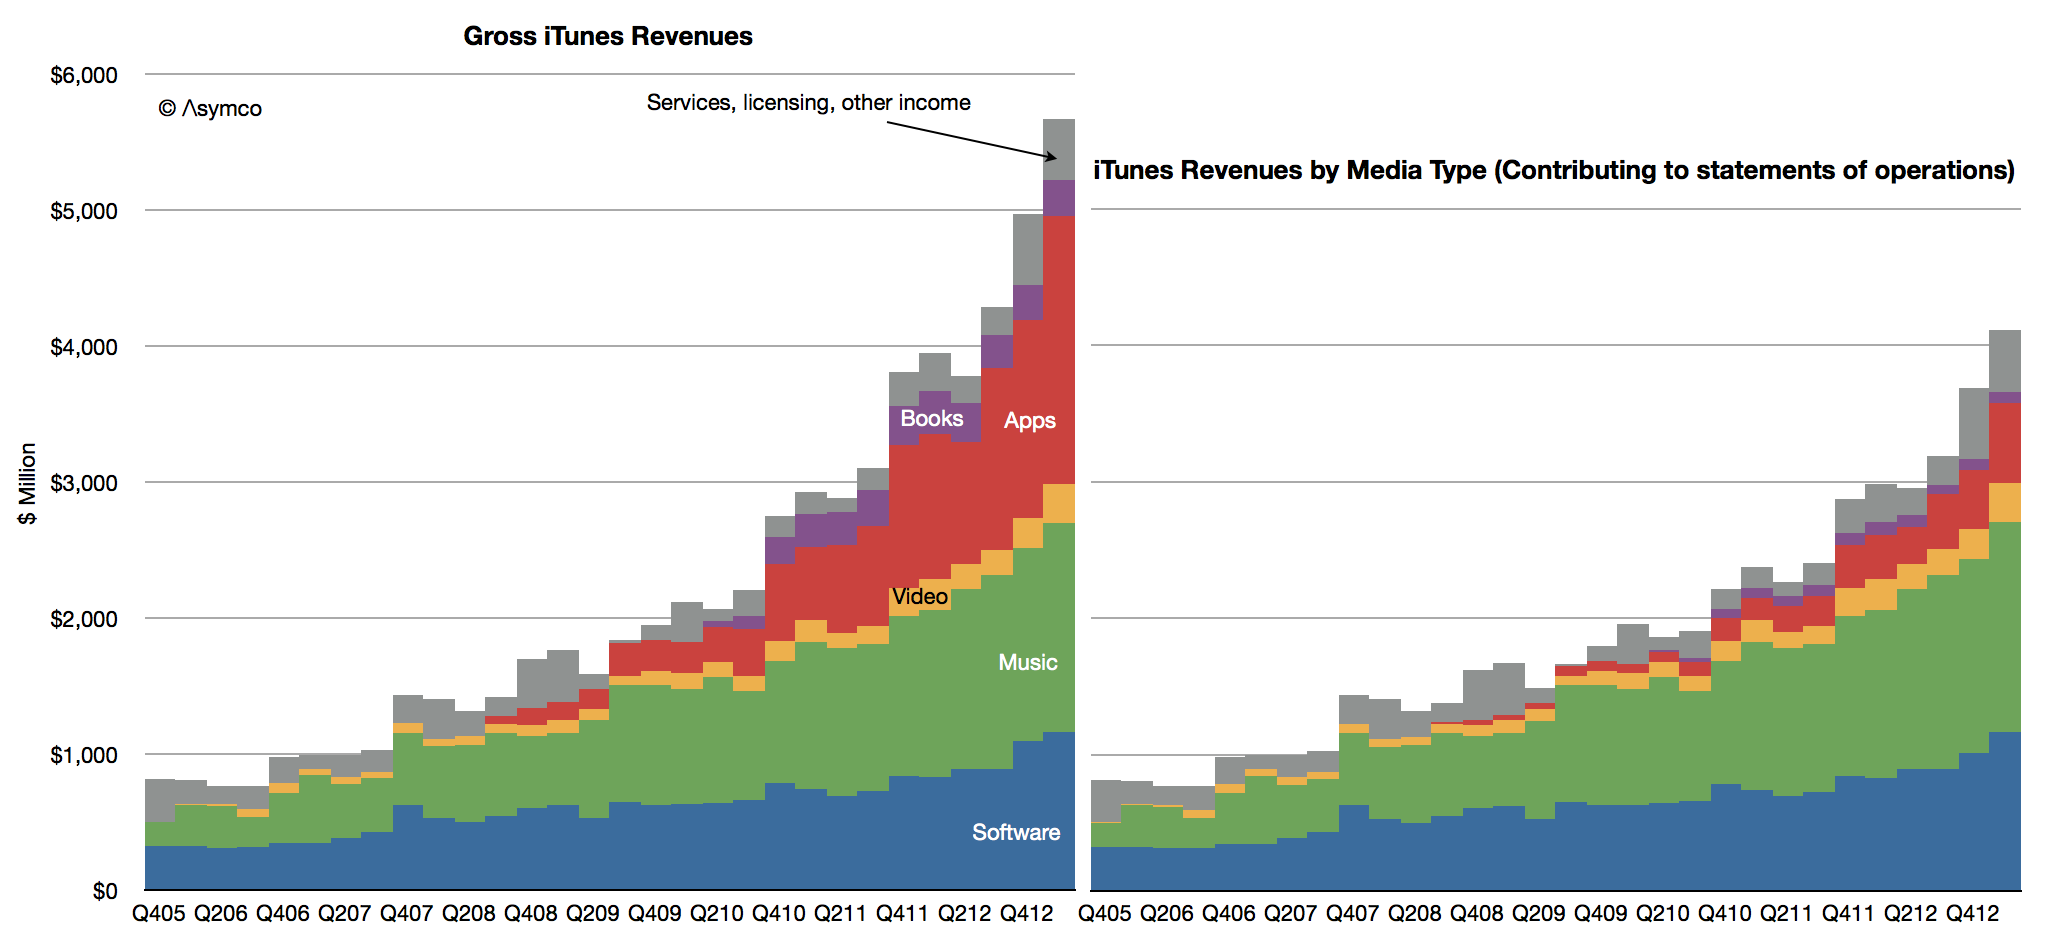
    Including all (gross[1]) content revenues, the sales rate is now nearly $5 billion per quarter ($4.94 billion). Including services, the iTunes consolidated business cleared over $5.5 billion.
    Screen Shot 2013-05-12 at 5-12-9.18.30 AM

    In March Apple reported that they have 500 million iTunes so one way to think about the iTunes business is to say that  iTunes users purchase content and services at the rate of about $40 per year.[2]

    Bless them.

    ---

    Notes:

    1. "For third-party applications sold through the App Store and Mac App Store and certain digital content sold through the iTunes Store, the Company does not determine the selling price of the products and is not the primary obligor to the customer. Therefore, the Company accounts for such sales on a net basis by recognizing in net sales only the commission it retains from each sale. The portion of the gross amount billed to customers that is remitted by the Company to third-party app developers and certain digital content owners is not reflected in the Company’s Consolidated Statements of Operations." From Apple SEC filing 10-K, October 2012.
    2. Apple users spend about $1/day for each Apple device in use making the iTunes franchise an incremental 11% marginal revenue source (assuming one device/user.)
  2. Surface Tension: The effect of Surface on Windows revenues

    Research · 34 comments

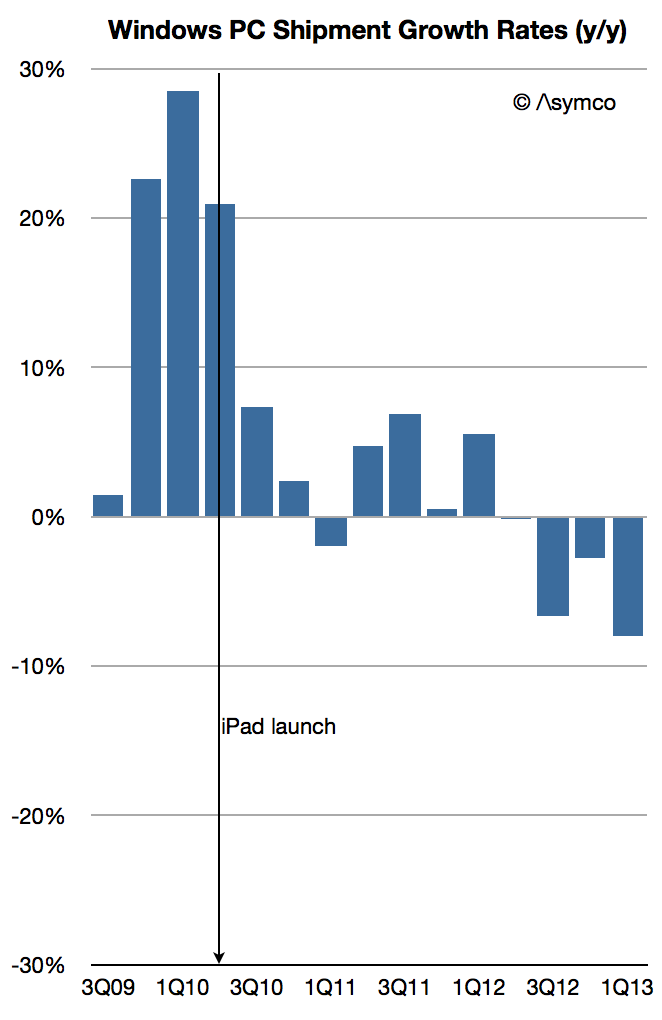
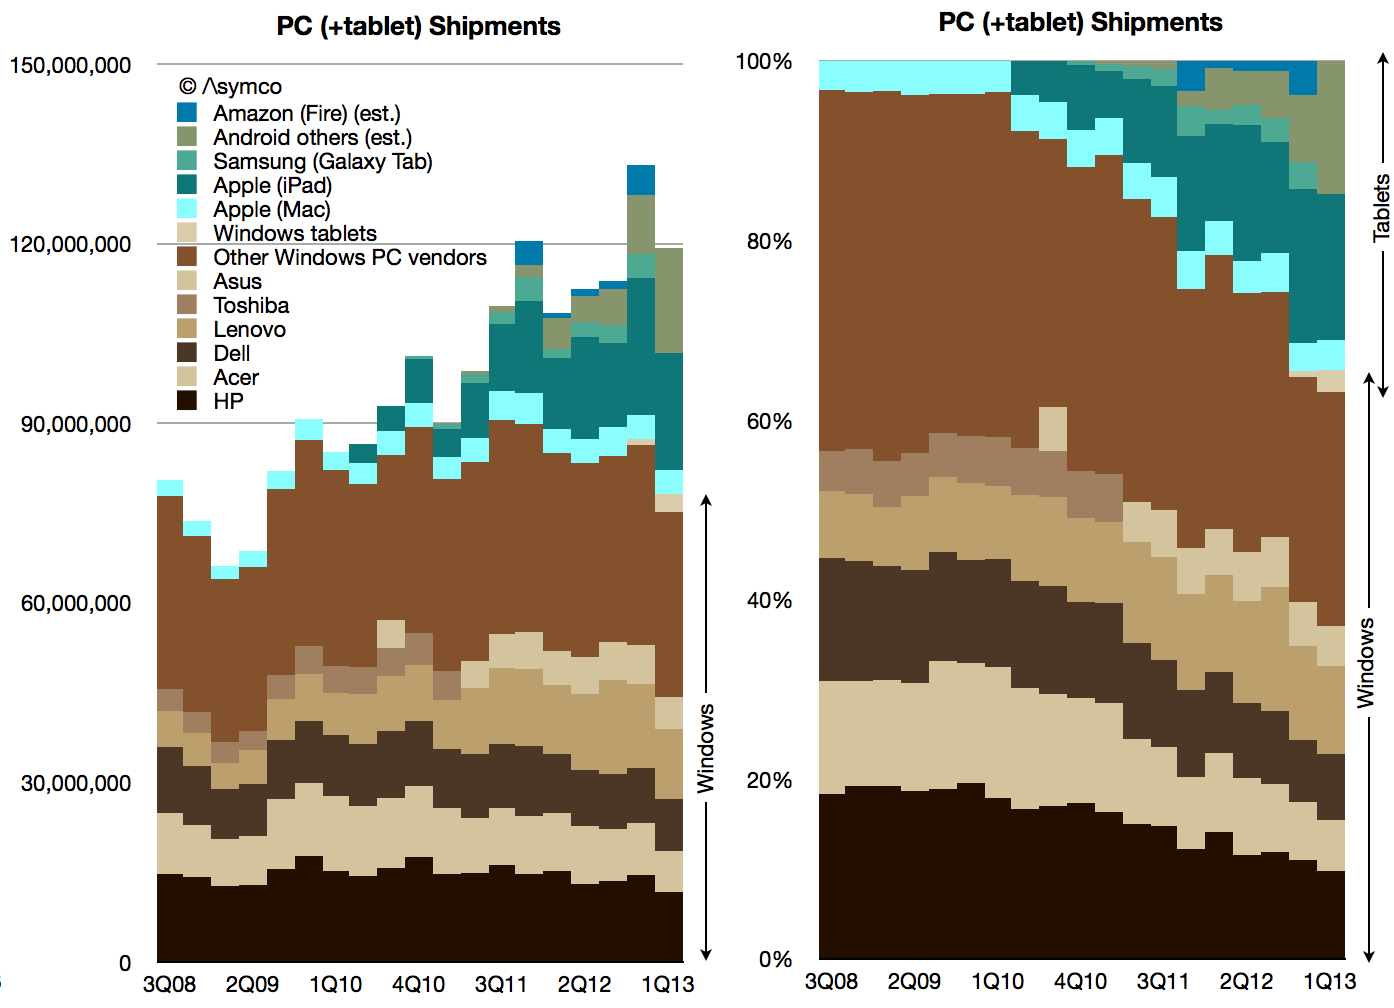
    According to Strategy Analytics 3 million Windows-based tablets shipped in Q1. That is not inconsequential. It would add 4% to the total Windows-based computers and reduce the decline in Windows PC growth to -8% (from -11%). You can see the effect of those units on share in the following graphs.

    Screen Shot 2013-05-02 at 5-2-2.06.21 AM

    Note the "boundary layer" of pale blue Macs between the brown-hued Windows and the green-hued tablets.

    Including tablets of all kinds, here is the market share growth in Windows PCs.

    Screen Shot 2013-05-02 at 5-2-2.06.30 AM

    As the post-PC disruption evolves, Microsoft has made an effort to shift its business model. I discussed this some time ago and there remain quite a few questions about the sustainability of the strategy.

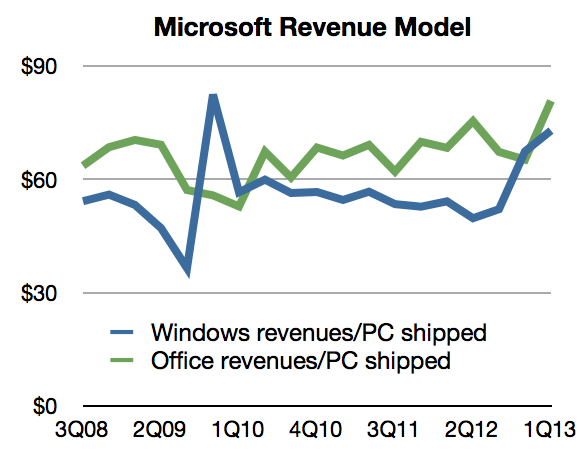
    However, there might already be evidence that it's working. The clue is in the growth in Windows revenues at a time when PC shipments (at least traditional ones) are declining rapidly. Some of that might be due to deferrals and software assurance revenues which are insensitive to shipments. However some have to be due to the Surface.

    Remember that Surface launched with an RT version priced starting at $499 (which did not sell well) but received a boost in Q1 with the Pro version priced at $899 to $999. If we assume a 80:20 mix of Pro to RT and an average price of $950 for the Pro and $550 for RT, 3 million units would generate at least $2.5 billion in gross revenues. Accounting for retail margins of 20%, Microsoft could still be recognizing $2 billion in revenues. That's a significant portion of $5.7 billion in Windows revenue.

    We can back into this figure from another direction: Prior to Surface launch, the Windows revenue per PC shipped (combining Microsoft's revenues and Gartner's estimates) was about $50. After the Surface Pro shipped the revenue climbed to $73/PC.

    Screen Shot 2013-05-02 at 5-2-2.06.38 AM

    Assuming the same pre-Surface revenue/PC and given the shipment figures for Q1 we would get about $3.7 billion for Windows. The difference to actual revenues is about $2 billion.

    So the extrapolation of Windows royalties approach yields $2 billion in Surface sales and the Price x Units estimate also yields $ 2billion. It would suggest that Surface has had a significant impact already: More than a third of Windows revenues depend on it.

    [UPDATE: I've been informed that not all the Windows tablet sales reported by Strategy Analytics are Surface products. As many as 1 million might not be. That would reduce the revenues as calculated to about $1.4 billion. In addition, not all Windows revenues are current with much of that deferred. Actual revenues were $4.6 billion. With both of these adjustments considered, the impact of Surface might be only 30%.)

  3. Happy Birthday iTunes Store

    Research · 16 comments

    iTunes (including software and services) revenues in Q1 topped $4 billion and were 30% higher than (re-stated) 2012 Q1 revenues. Accompanying this revenue figure were additional data points from the company:

    • Cumulative app downloads have surpassed 45 billion
    • Payments to developers reached a cumulative total of $9 billion
    • Payments to developers were $4.5 billion in most recent four quarters
    • Now paying $1 billion to developers every quarter
    • 800 apps are downloaded every second
    • iOS app revenues doubled since year-ago quarter
    • App Store accounted for 74% of all app sales in the quarter (citing Canalys)
    • App stores reach customers in 155 countries (850k Apps, 350k iPad apps)
    • iTunes music downloads are available in 119 countries (35 million songs)
    • Movies are sold in 109 countries (60k titles)
    • iBookstore is available in 155 countries (1.75 million titles)

    This data allows for a few inferences:

    • Nearly 70 million apps are downloaded every day
    • The average revenue per game is about 23 cents
    • Gross app revenues are about $16 million per day (of which 11 million is paid to developers.)
    • Gross iTunes revenues were $5.4 billion last quarter of which I estimate:
    •  …App revenues were $1.6 billion
    •  …Music revenues were $2.2 billion
    •  …Video revenues were $287 million
    •  …Book revenues were $312 million
    •  …Apple's software generated $1 billion
    • In addition, I estimate that Services generated $100 million

    Note that there is a difference between the amounts transacted through the store and what the company reports. The difference is shown in the following graph

    Screen Shot 2013-04-29 at 4-29-1.02.50 PM

    To mark it's 10th year, I wrote a segment for Billboard Magazine describing what iTunes has become. I suppose it's easy to become numb to these numbers, but there is perhaps one way to look at iTunes that is still compelling:

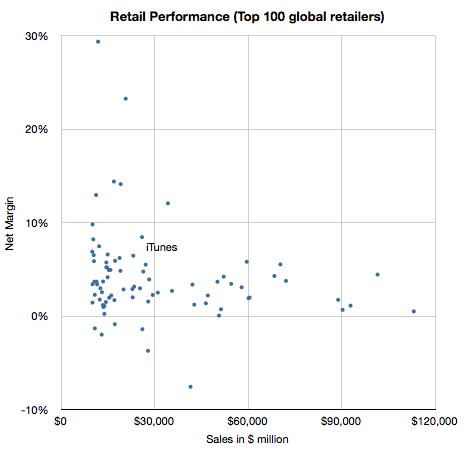
    Selling $20 billion a year would put iTunes in the top 20 US retailers and top 50 Global retailers.

    Screen Shot 2013-04-29 at 4-29-1.36.41 PM

    Not bad for a 10 year old.

  4. Margin Call 2

    Research · 164 comments

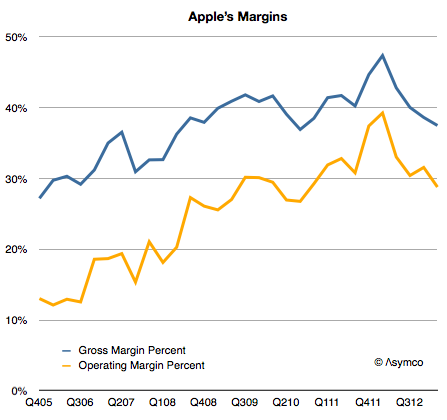
    I expected Apple's margins to improve  last quarter. They didn't and so the question I needed to answer is why. Here is a history of Apple's gross margin and operating margin as reported since late 2005:

    Screen Shot 2013-04-25 at 4-25-9.26.53 AM

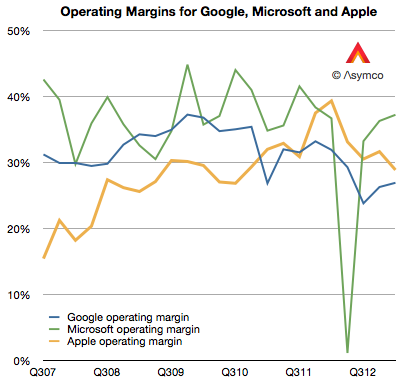
    For a company selling hardware these are extraordinarily high margins. They are higher than those of Google and have narrowed the gap with Microsoft,  neither of which has a high proportion of hardware sales:

    Screen Shot 2013-04-25 at 4-25-10.06.04 AM

    But they are not growing and the reason is to be found in the reason they grew in the first place: because of proportion of iPhones making up the total sales.

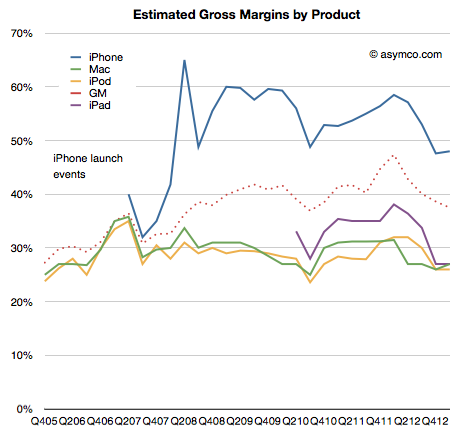
    As a reminder, the iPhone is a uniquely profitable product. I estimate that it obtains about 50% gross margins. The history of these estimates is shown below:

    Screen Shot 2013-04-25 at 4-25-9.32.34 AM

    It remains in stark contrast to the margins Apple obtains for its other products. Much of that is due to the pricing power of the product as shown below:

    Screen Shot 2013-04-25 at 4-25-9.33.13 AM

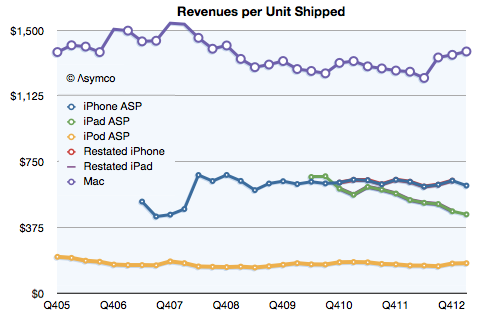
    Notice that even after the launch of the iPhone 5 and the persistence of two previous generations of iPhones (and their lowered pricing) has barely put pressure on pricing.

    Contrast that with the iPad. As its breadth of offerings increases, it causes a lower price per unit.  The iPhone is now at $613 per unit, even with two older generation products available. (The lowest price was in Q2 2012 when the average price was $608.) The iPad is at $449 per unit, down from $662 at launch three years earlier.

    So overall, margin is a function of three things:

    1. Price changes: iPhone had a small reduction (from $635 to $613) but the iPad has had a moderate reduction in price (from $531 to $449).
    2. Cost of components: This is reflected in product-line gross margins which can only be estimated. Compared to last year I estimate that iPhone gross margin dropped from 58% to 48%. iPad margins also fell from about 38% to 27%. The reasons were given by management as "Last year, our business benefited from …a more favorable foreign currency environment, and historically low costs."
    3. Mix of high and low margin products. The iPhone units grew at 7% but the iPad units grew by 65%. A year ago iPhones were 58% of revenues and this year they were 53%. The iPads were 17% and now they are 20%.

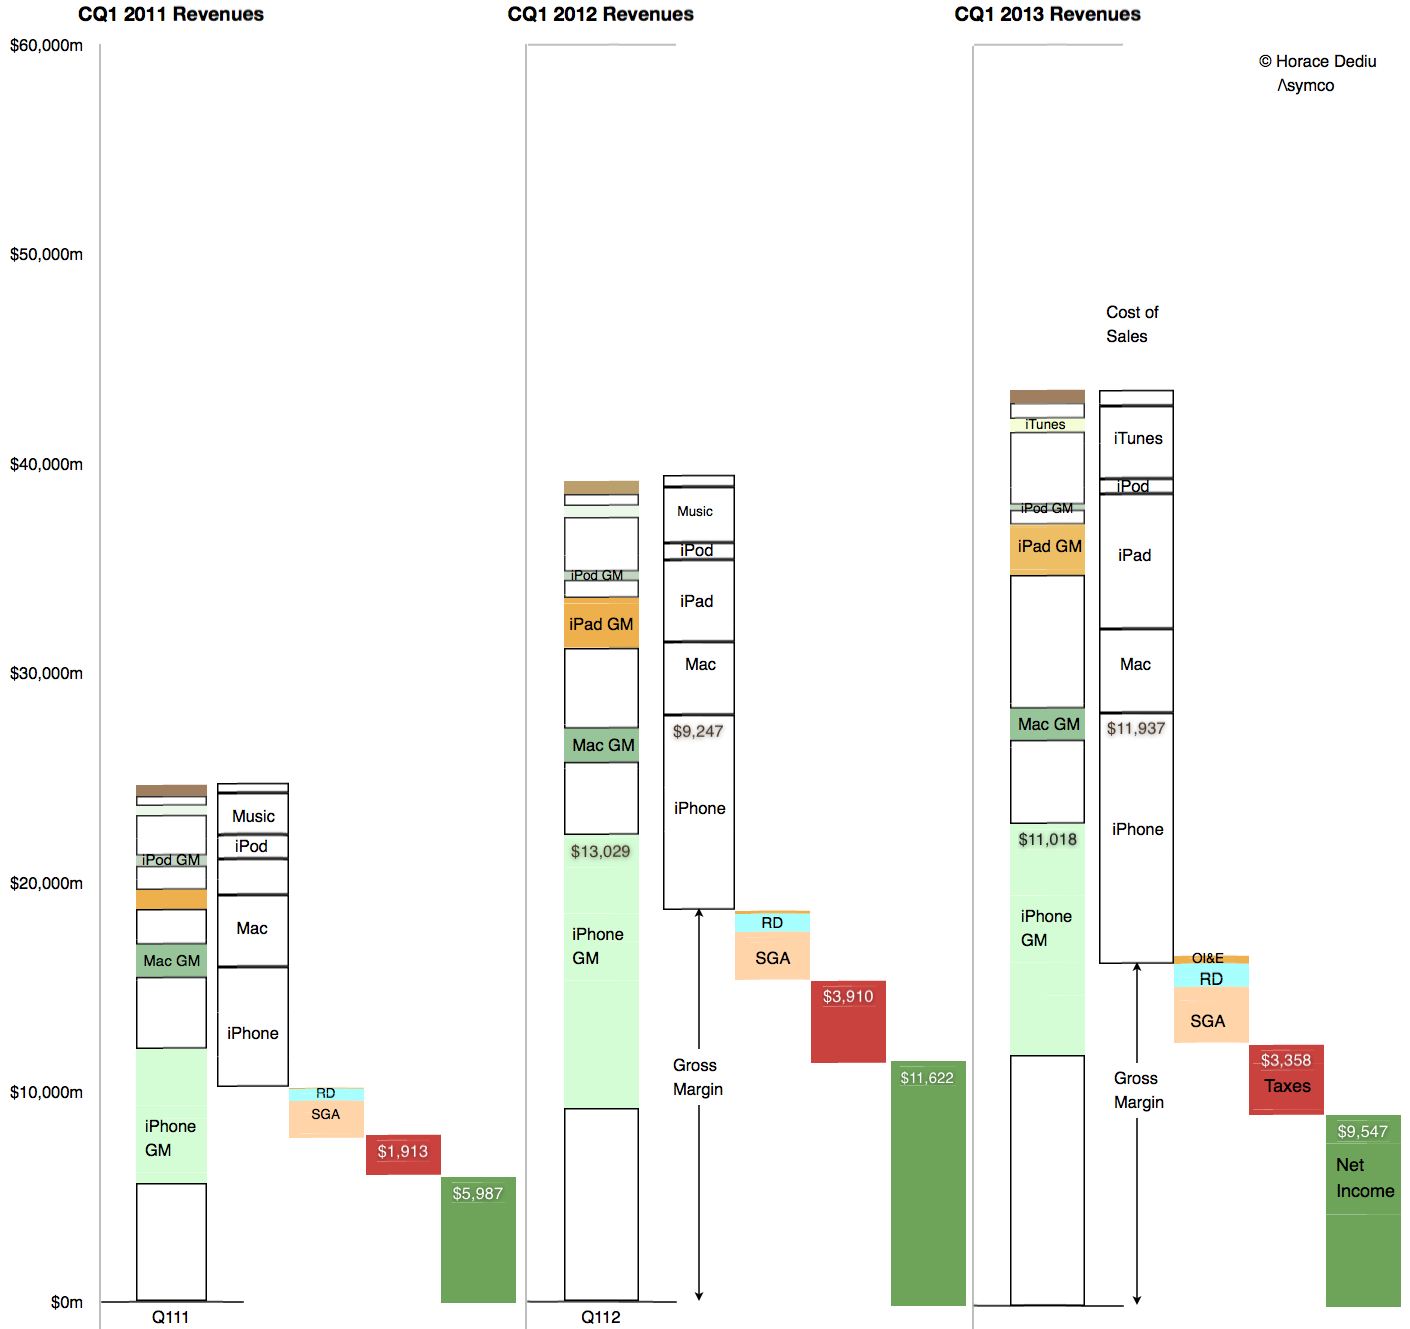
    The result is seen in this one graph showing the allocation of revenues and margins by product:

    Screen Shot 2013-04-25 at 4-25-8.46.04 AM


    So what is surprising? My expectations were met in terms of iPhone units (and exceeded in terms of iPad units). The mix was also something that falls out of the unit expectations. The pricing is also not  surprising.

    My guess is that the largest contribution to the "reduction of margin" is the increased cost of components. Note that the graph implies that even though iPhone revenues were nearly flat at 3% growth, the cost of those revenues went up by 29%! In addition, the iPad revenues grew 40% while costs went up 65%.

    Unit pricing (and implicitly competitive pressure) is still not the primary cause of the reduction in Apple's margins. Indeed, the curious thing is that margins are now at levels seen for most of 2009 and 2010, a time when the iPhone (and iPad) were seen as near monopolies in their respective categories.

  5. Escaping PCs

    Research · 279 comments

    The Windows PC market is contracting. The market data has been showing unit shipment declining for some time with the latest quarter having perhaps the steepest decline for two decades.

    What remains undocumented however is how the market looks when considering economic value. A more complete picture would be to show revenues, average selling price (or revenue/unit), operating margins/unit and percent of profit capture.

    The data is not beyond reach however. It involves combining the shipment estimates from e.g. Gartner with financial reports from the companies themselves. Some analysis is required to estimate margins but they are also not hard to obtain (e.g. from third parties.)

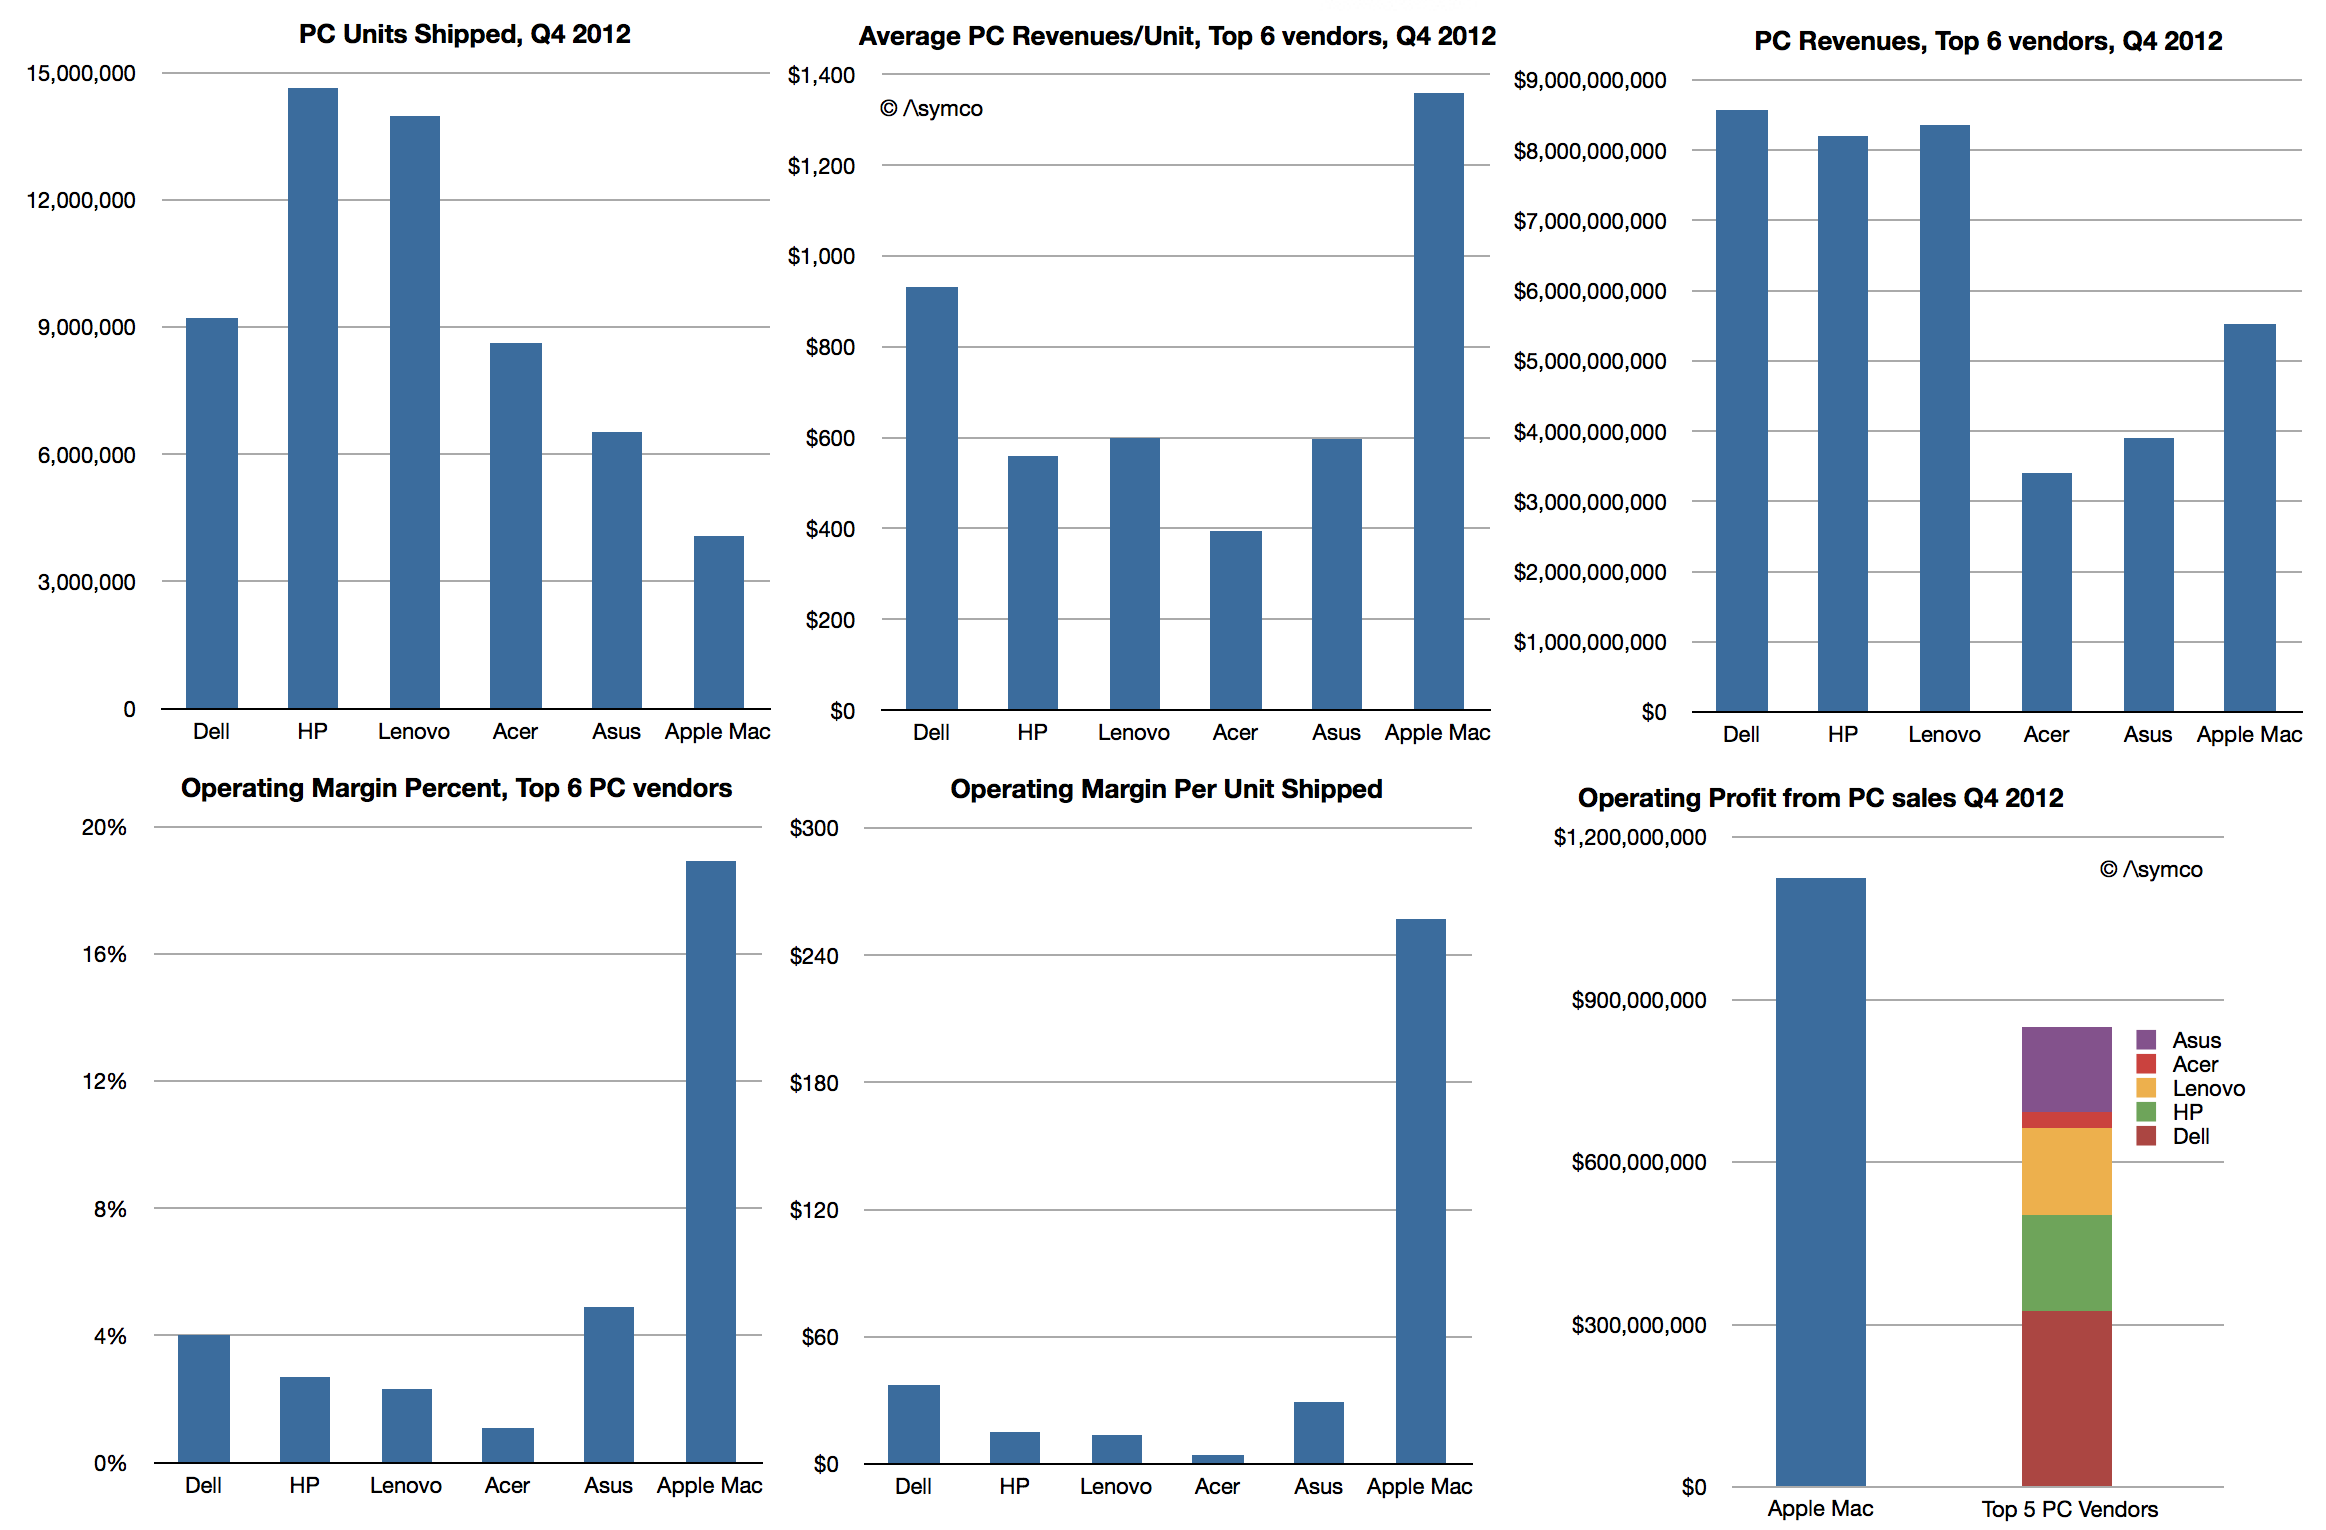
    So here is a view of the market for the fourth quarter 2012:

    Screen Shot 2013-04-16 at 4-16-4.05.57 PM

    The only inference I made was with respect to Apple's margins for the Mac. These are based on deriving a gross margin of 26% and adding an estimate of the SG&A and R&D "overhead" of 7.1% of sales, a figure which applies to the entire company. This yield an operating margin of 18.9%.

    If this estimate is considered then the operating profits from PC operations imply that Apple generates more profit than all the top 5 PC vendors combined.

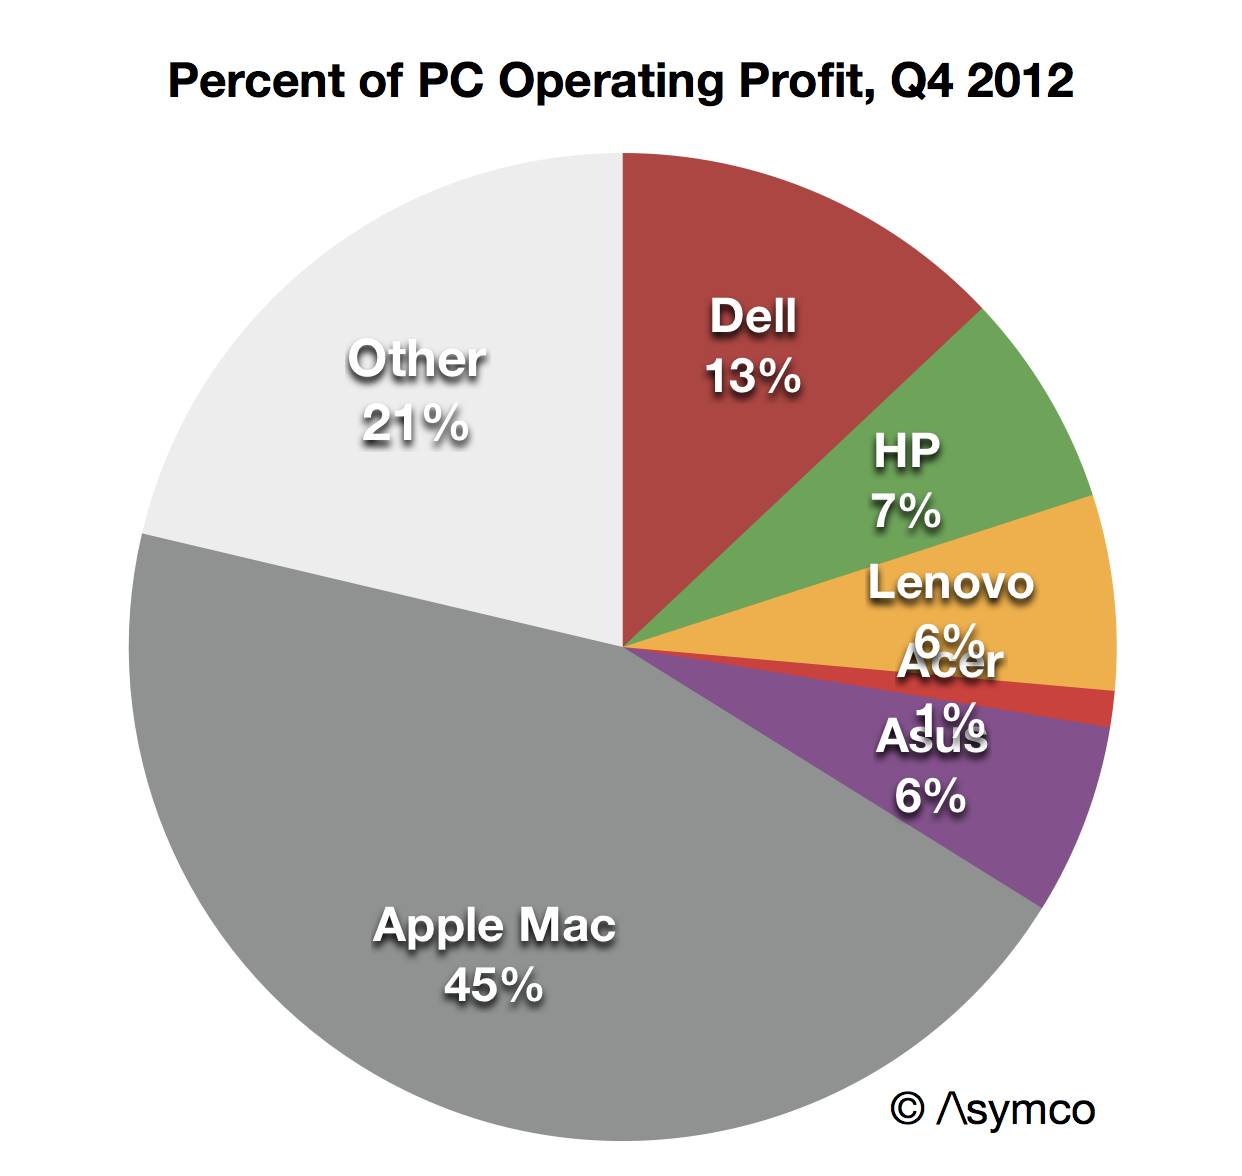
    Assuming further that "other" vendors have the same profitability ratio as the top 5 combined yields a figure of 45% "profit capture of PC market" for Apple. This is not as good as its performance in the phone market, where Apple has about 72%, but it's not bad.

    Screen Shot 2013-04-16 at 4-16-4.16.46 PM

    The real problem for the PC vendors is not that they have such low margins–they've had low margins for decades. It's that the volumes which "made up for" low margins are disappearing. Apple is not immune to a gradual erosion of Mac volumes, but they have positioned themselves for growth with devices and content commerce and services. They have essentially "escaped" PCs and indeed caused the need to escape in the first place.

    The problem is what could the others do? It seems all they can do is depend on Microsoft getting their strategy right.

    Sounds risky.

  6. Happy Birthday iPad

    Research · 34 comments

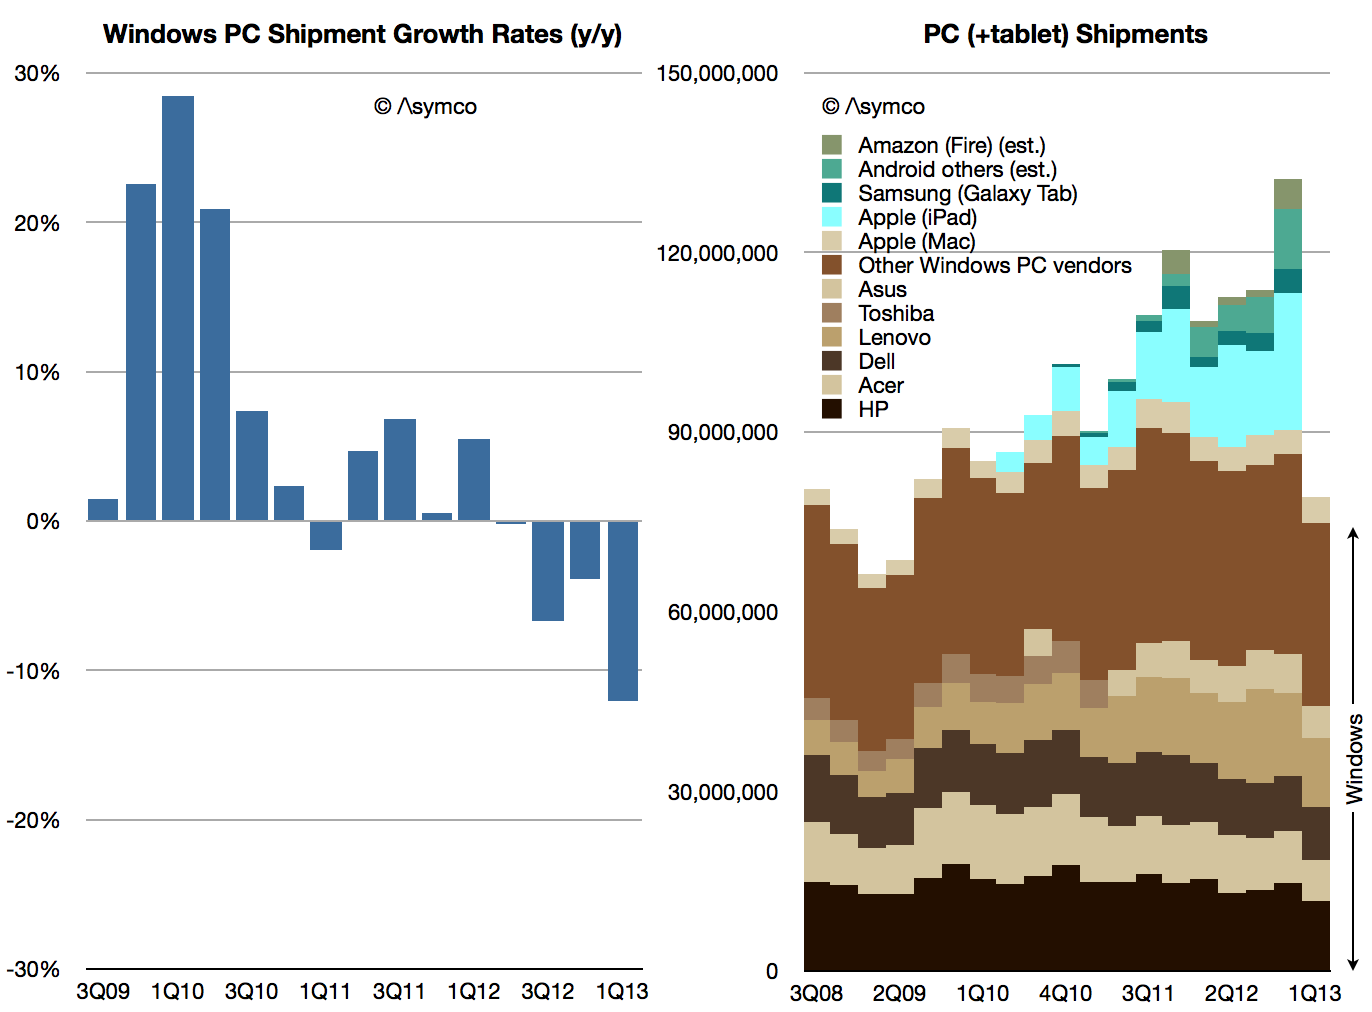
    The latest data on PC shipments from Gartner showed a decline of  11.1% from the first quarter of 2012. As we don't yet have the final data on Apple's Mac shipments, I used my estimate of 4.38 million units (14% growth as per NPD estimate for the US) to obtain an estimate of Windows PC shipments.

    That number is 74.8 million units. In the first quarter of 2012 the corresponding calculation yields 85.1 million units. That makes Windows PC rate of decline -12%.

    The historic shipment data and growth rates are shown below:

    Screen Shot 2013-04-11 at 4-11-6.07.30 AM


    Note that tablet data is not yet included in the shipments summary. Windows shipments are shown in shades of Brown and tablets in shades of Blue/Green.

    The decline in PC shipments is persisting and even accelerating.

    Coming only a week after the iPad's launch birthday, it's perhaps a fitting testament to its impact.

  7. So long, break-even

    Research · 113 comments

    The following is another excerpt from a report titled "iTunes Business Review" which will soon be available for purchase through the Asymco Store. If you are interested in the product please get in touch.

    ---

    iTunes store will be 10 years old next month. From its inception Apple has stated that it aims to run the store "at break-even".  The business has grown so rapidly however that its profit-free nature has come under severe pressure.

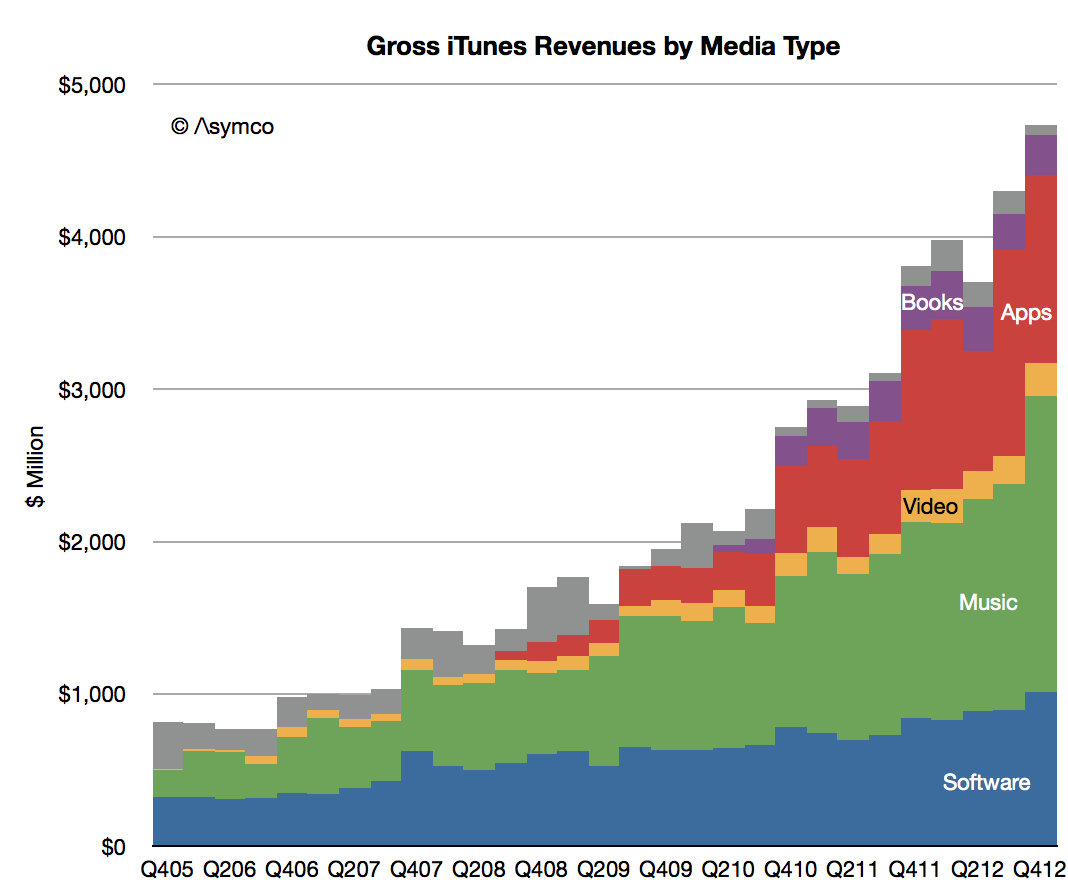
    The reasoning goes that as more media types have been added costs have increased but revenues have increased even faster. Consider the estimated gross revenue base as shown below:

    Screen Shot 2013-03-22 at 3-22-2.39.55 PM

    What is known as iTunes today has quintupled in seven years. Although cost of content sales are likely to have been preserved as a ratio (about 30%) the vastness of transaction volume (estimated at 23 billion item transactions in 2012 alone) implies that there are some significant economies of scale.

    This implies that the operating costs are spread more evenly and that therefore the possibility exists for some operating margin.

    Put another way, at break-even the cost of operating iTunes stores would be about $3.75 billion. It's hard to imagine this level of operational expense for digital content.

    For this reason, management has begun since 2010 to suggest that at least the App Store is run "a little over break-even". How little is a good question. A one percent operating margin (from gross revenues) would imply as much as $45 million margin. I estimate 2% is possible on Apps and 1% on Music.

    That's $150 million in margin content. Heady stuff.

    However, since folding its Software group into iTunes (the blue area in the graph above) the margin picture changes dramatically.

    The Software group is one of the forgotten heroes of Apple.

    Apple’s software division “Apple Software” is responsible for the following products:

    • iWork which includes Pages, Numbers and Keynote. These are available through the Mac App store at about $20 per product and the iOS App Store for $10.
    • iLife which includes iMovie, iTunes, iPhoto, GarageBand. The OS X versions are available free with new computers but they are also available as paid downloads for OS X through the Mac App Store at $15 each and for iOS devices through the App store at $4.99 per app.
    • OS products including downloads of iOS and OS X. These are mostly free but some OS X updates are not free (typically $19.99 for new version including the server version of OS X.)
    • Professional tools which include the following products: Final Cut Pro (Video editor $299.99), Logic Pro (Music editor $199.99), Aperture (Professional Photo workflow $79.99), Compressor (additional features for Final Cut Pro $49.99), Motion (video transition editing for Final Cut Pro $49.99)
    • Administration and development tools which include:  Xcode integrated development environment which is free Apple Remote Desktop which is priced at $79.99.

    All these products are now sold through either iTunes App Store or Mac App Store. They used to be sold as traditional boxed software for many years but Apple has transitioned them all to be download-only and folded them into the catalog of third party apps while lowering prices.

    My estimate is that Apple’s own software generated $3.6 billion in Revenues in 2012. As you can imagine, this is a high margin business  which grows at nearly 20%/yr. Although I estimate that the software business has been overtaken by the Apps and Music businesses in gross revenues, it keeps an operating margin similar to that of Microsoft or about 50%.

    This means that iTunes inclusive of Apple's own Software generates as much as 15% operating margin on gross revenues. That's over $2 billion a year.

    So much for breaking even.

  8. The iTunes Value Structure

    Research · 19 comments

    The International Federation of the Phonographic Industry (IFPI) reported that global digital revenues were $5.6 billion in 2012. This represented about 9% growth from 2011 and accounted for 34% of total industry revenues[1].

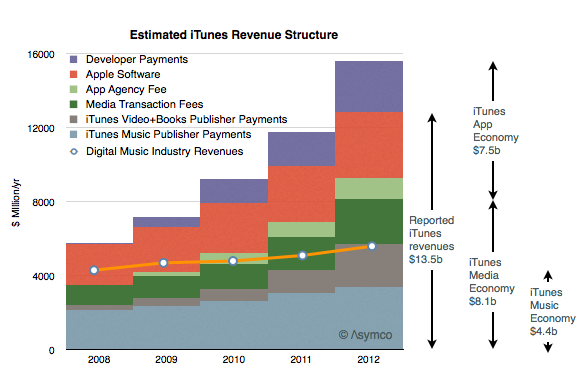
    Apple regularly reports iTunes as a separate revenue item and occasionally it also reports payments data for developers and app download rates. By interpolating the data published and combining it with some assumptions it's possible to estimate the mix of revenues (and costs) associated with iTunes.

    My yearly estimates are summarized below.

    Screen Shot 2013-02-26 at 2-26-6.04.23 PM

    Note that I also included historic digital music industry revenues (as a line). I also included the following summary items:

    1. iTunes reported revenues were $13.5 billion (including Apple's own software sales)
    2. iTunes gross revenues were about $15.6 billion (including payments to developers)
    3. The iOS and OSX "App Economy" was about $7.5 billion while the iTunes "Media Economy" was about $8.1 billion (both figures include transaction costs.)
    4. The iTunes Music economy was $4.3 billion of which $3.4b was paid to music labels.[2]

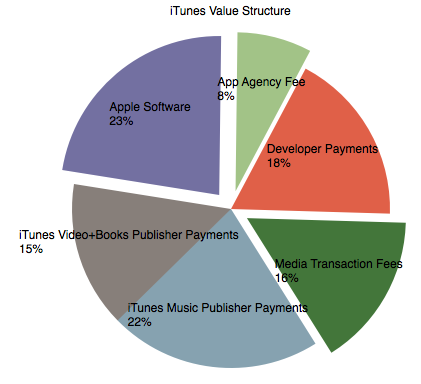
    In terms of percent of total value the components are:

    Screen Shot 2013-02-26 at 2-26-6.09.12 PM

    Looking at growth, these estimates imply that App revenues are growing at about 50% while iTunes Music is at 10% and Video+other at 90%.

    Looking at profitability, there is potential for operating margin in Apple Software and App Agency Fees and perhaps some of the Media Transaction Fees (exploded wedges above). Historically, Apple suggested that their App and Media stores ran at break-even but that may no longer be the case. Operating margins from Software may be significant.

    ---

    Notes:

    1. These revenues were from recorded music and don't include live performance
    2. My estimate for the iTunes Music payments to publishers is equivalent to about 60% of total industry revenues.
  9. Right on Cue

    Research · 27 comments

    On February 6th, 2013 Apple reported that a total of 25 billion songs had been downloaded from its iTunes music store. The previous definitive value was in October 2011 though there was mention of "more than 20 billion" in November. App download totals have recently been much more frequently updated as the following chart shows:

    Screen Shot 2013-02-12 at 2-12-2.17.06 PM

    [I estimated 21 billion for the November total.]

    The latest two data points point to a surge in iTunes song download rates. Prior to last fall the download rate seemed to be hovering around 10 million songs per day.

    Screen Shot 2013-02-12 at 2-12-2.20.10 PM

    The new data implies that the rate may be now perhaps 20 million per day however I would be cautious about this estimate given the latest point being such an outlier. One reason for the surge might be the opening of new stores in previously unserved countries. Another could be the usual post-holiday surge driven by gift cards.

    Given this data, it would be interesting to calculate the share of overall music downloads that iTunes has been able to secure.

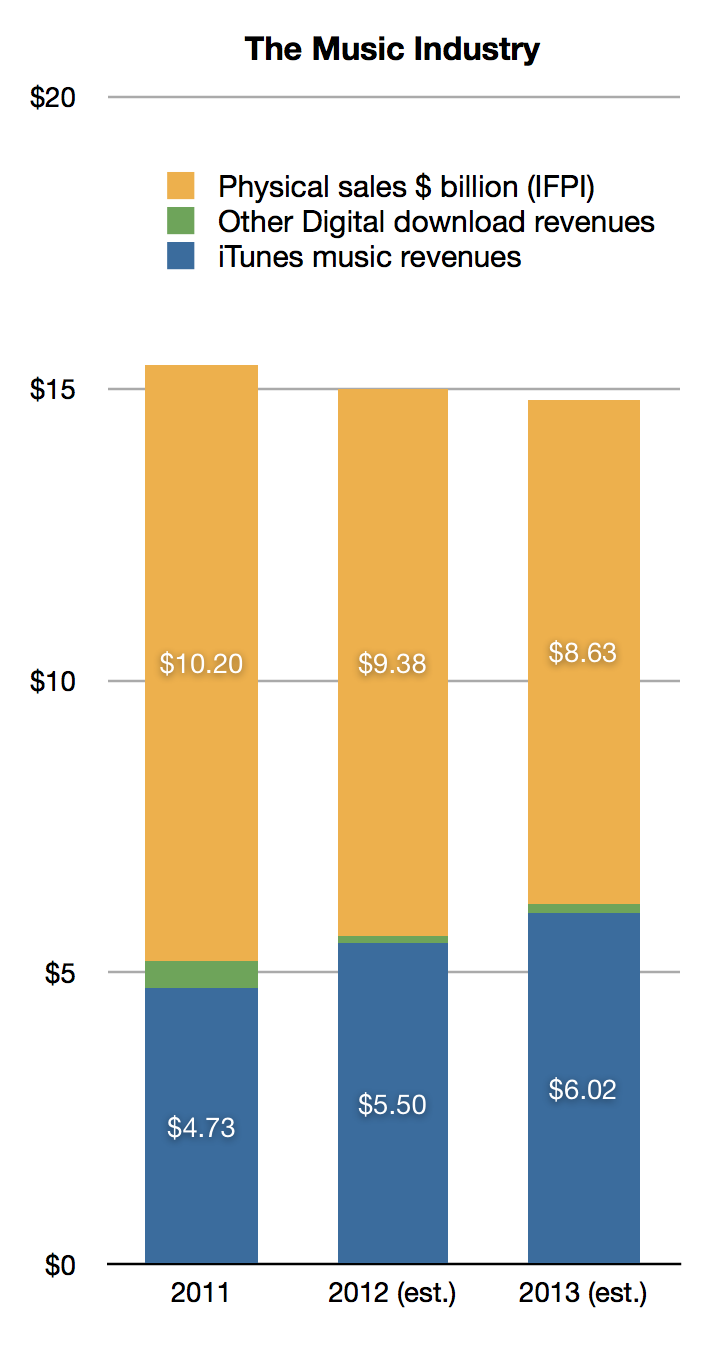
    Based on the samples offered by Apple, and the data from International Federation of the Phonographic Industry (IFPI) we can estimate that in 2011 iTunes captured 90% of digital music revenues and 31% of the total music industry. (I estimate iTunes was responsible for about 4.3 billion downloads and I applied a price per download of $1.1).

    Looking to 2012, applying a growth rate of 8% to digital sales (same as that of 2011) and an 8% decline in the physical business (vs. 8.7% decline for 2011) we get 98% iTunes share for digital and 37% share for all music. (I estimate that iTunes was responsible for about 5 billion downloads and I applied a price per download of $1.1).

    Therefore it seems reasonable to estimate that Apple will reach 97% share for iTunes music in 2013. That assumes a 10% growth in the music download business and translates into 5.5 billion downloads or about 15 million songs per day. That's well within the trajectory seen above.

    These data result in the following market overview:

    Screen Shot 2013-02-12 at 2-12-2.21.25 PM
  10. The next 100 million iPads

    Research · 56 comments

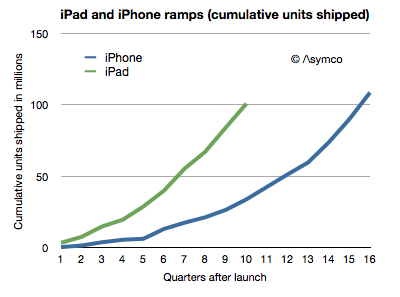
    Having reached 100 million iPads shipped in 2.5 years the natural question is how long will it take for the next 100 million iPads?

    The ramp of cumulative units shipped is shown below.


    I also added the equivalent ramp for the iPhone. [The last data point for the iPad is based on an estimate of 16.5 million units in Q3 which may need revision depending on company reporting.]

    The next 100 million will depend to a large degree on the success of the new iPad mini. To make an estimate we have to realize that there are several aspects of the tablet market which differ from the phone market and that therefore the predictive power for previous data is weak.

    First, the channels are different. Tablets are sold as media consumption or "computing" products. They are not sold as communication devices. Therefore operators have few incentives to promote and subsidize them. They do participate in the distribution but not with the same level of commitment. That means less "push" and opportunity for discovery. Apple has an advantage in this case with their stores and brand value. The lack of operator engagement and lack of points of sale might be one reason why Android tablets have not ramped as quickly.

    Second, for some competitors, the tablet itself is a loss leader and acts more as a terminal into an ecosystem rather than a product in itself. In cases where tablets are given away it's possible that consumers might own one for each platform or ecosystem. This is similar to the game console model where the cost of the console is not a barrier to many avid gamers. This means that penetration of tablets can reach above 100% of users in some markets. Although network connections (i.e. SIM cards) can and do reach well above 100%, the number of phones in use by one person simultaneously is bounded.

    Third, the lifetime of the product is as yet undetermined. Phones tend to last 2 years. This is due to evolving standards as well as high wear and tear and breakage or losses. Tablets are not as "mobile" and are less likely to be used and the basic functionality does not evolve as rapidly. It's possible that replacement rates for tablets will follow more that of notebook computers than phones. Perhaps between 2 and 4 years. I suspect most iPads purchased are still in use today, including the first version. There will be some obsolescence from system upgrades, but the older systems will keep going.

    Some of these aspects of the product could lead to slower growth and some to faster growth. That and the fact that it's a completely new category with business and consumer and educational and vertical applications makes it a difficult product to forecast.

    Having said that, the product is extremely resonant with buyers. The growth to 100 million is testament to that. The liquidity of the product, with no carrier locking and no pricing illusions means that it reaches all parts of the world quickly. So there is no obvious upper bound on the size of population who might buy it. The new price points and form factor may lead to a wave of new adoption, similar to the impact the iPod mini had on the iPod line.

    There are still many factors that can slow growth, especially production capacity, but I believe that the iPad could growth between 50% and 80% which would mean 100 million more iPads could be sold by the end of 2013.

  11. Nokia's Lumia brand strategy for the US

    Research · 29 comments

    Last July I asked the question "How many Lumia phones were shipped in the US?"

    My answer was 630k through the first half of this year.

    I revisit this question following Nokia's latest quarterly report.

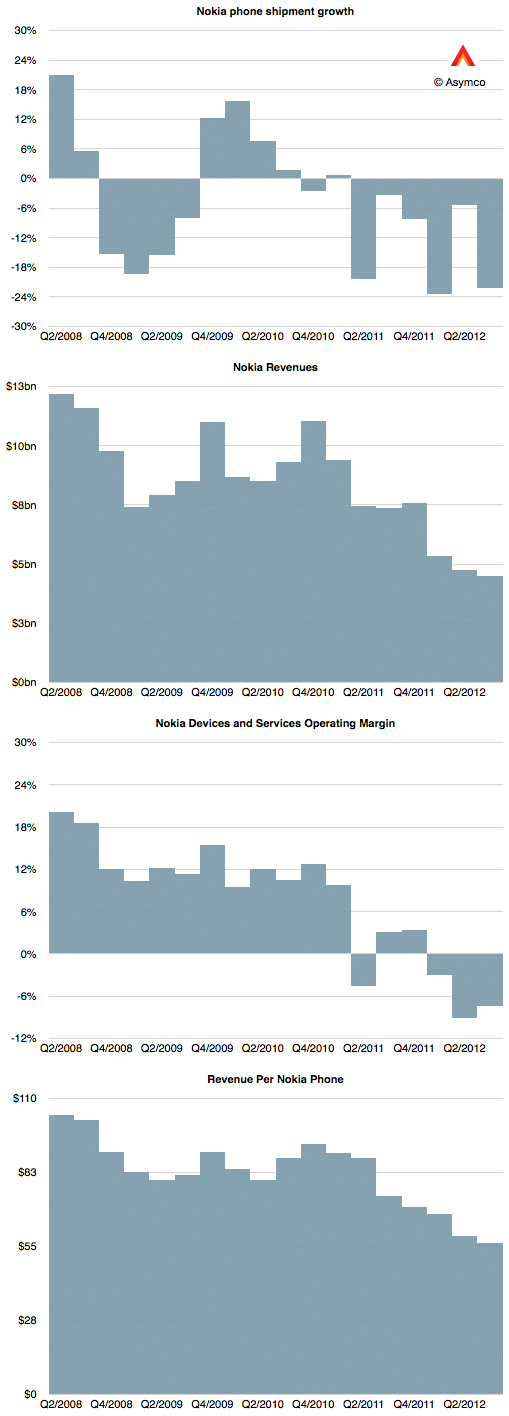
    As a quick review, Nokia reported the following performance for its mobile phones operations:


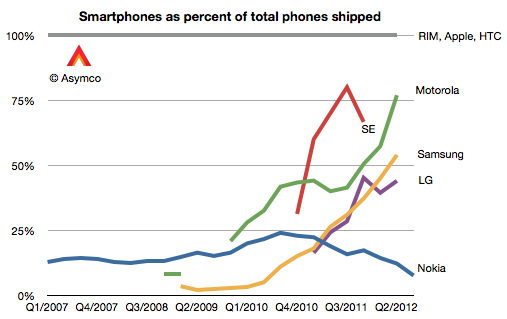
    The most worrying thing of all however is that Nokia's smartphone performance has collapsed. With only 6.3 million units shipped, the company may be the worst performer among eight competitors I track. They were below RIM's shipment total.

    The value of 6.3 represents only 7.6% of their overall phone shipments.

    As the graph above shows, Nokia is going in the wrong direction with respect to moving to a smartphone portfolio.[1]

    Of the total 6.3 million smartphones (aka smart devices, as per Nokia's reporting nomenclature) 2.9 million were Lumia Windows Phone units.

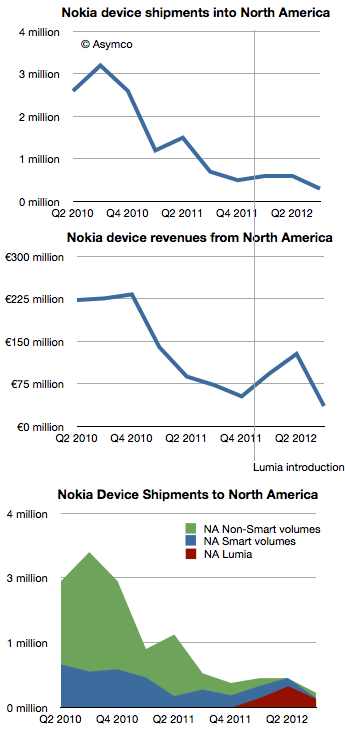
    Using information about average selling prices and total volumes into North America, I was able to estimate that there were about 180,000 units sold into North America during the last quarter.

    Since launch, my estimate is that Lumia has sold 810k units in the North American market.

    This cannot be seen as a good performance. There are mitigating factors such as the lack of upgradeability to Windows Phone 8 which probably deflated demand[2]. However, it's a poignant observation that during the last quarter the US reached 50% smartphone penetration by users. As traction is still absent from both Nokia and Microsoft in the US market, we are back to the question of how to compete.

    As the market in the US transitions from competition against non-consumption to competition among rival platforms, the Lumia brand is being forced into targeting smartphone "switchers" rather than smartphone "adopters". The switching option is expensive, requiring aggressive advertising (see Samsung Electronics' $11 billion ad budget).

    There's only one source of cash for that sort of strategy.

    ---

    Notes:

    1. The caveat is that they market some of the Series 40 phones are "smartphones" on the basis of having "smartphone-equivalent" performance. However, smartphone equivalency is and has been purely subjective. On that basis there were many times in the last decade and a half that we could have counted Java-based or BREW-based or i-Mode-based phones "smartphone-like". Smartphone has been defined on the basis of running an operating system with native APIs for developers.
    2. I imagine that the upgrade path could have been known to Nokia, AT&T and Microsoft nine months ago when the Lumia was unveiled for the US by the three CEOs and therefore expectations could have been modulated accordingly.