Asymco

Asymmetric Intelligence

estimate

  1. Using Capital Expenditures to predict Apple's share price

    Research · 96 comments

    It takes money to make money. That's a cliché. But it's also true. The interesting question is how much can be gained from how little.

    In previous articles I explained how Apple's expenditures of capital for equipment used in manufacturing affects their output of products. The relationship between capital in and product out should stand to reason.

    The more surprising aspect of that analysis is that we get to know in advance how much Apple spends (since they tell us their budget a year before it's spent.) and therefore it becomes possible to get a rough idea of how much they will produce. And since demand has generally been higher than supply we can get an estimate of how much Apple will sell.

    The only missing piece to this logic chain is to estimate how much will shareholders benefit from the capital expenditure. I'll try to establish the relationship through a build-out of graphs.

    The first graph shows Apple's share price at weekly resolution.
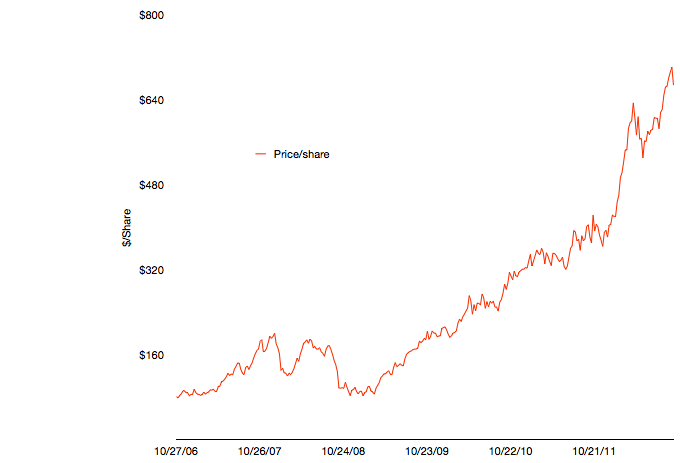
    The time frame stretches back six fiscal years. The time span includes some dramatic periods including the financial crisis and the launch of the iPhone and iPad.

    To illustrate the effect of the iPhone and iPad on this share price appreciation, I've overlaid a quarterly resolution graph showing revenues over the same time period with each product line shown separately.
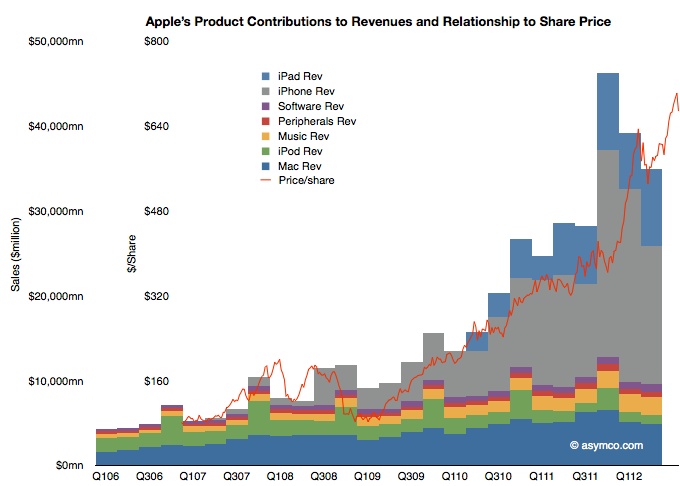
     

    Note that I've indexed the vertical scale to match approximately the highest peaks of both graphs. The two axes scales are shown separately on the left.

    The relationship between growing sales and growing share price is plain to see. Note that the iPhone and iPad account for the vast bulk of  sales growth and hence they are mostly responsible for the share price appreciation. Again, this should not be surprising. The scale gives an approximation of the relationship where $50 billion in quarterly revenue roughly yields a share price in the $700 to $800 range.

    As I've shown in the last post on forecasting production using CapEx (focus on the last chart) iOS device shipments (mostly iPhone and iPad) correlate with capital expenditures in the previous quarter. Using the historic relationship, the next two quarters could see a significant increase in iOS unit production. The sum of the low end of the range implies about 163 million units.

    If the relationship is therefore CapEx -> Production and Production -> Share price appreciation, then the transitive implication is that CapEx -> Share price appreciation.

    That relationship would be illustrated as follows:
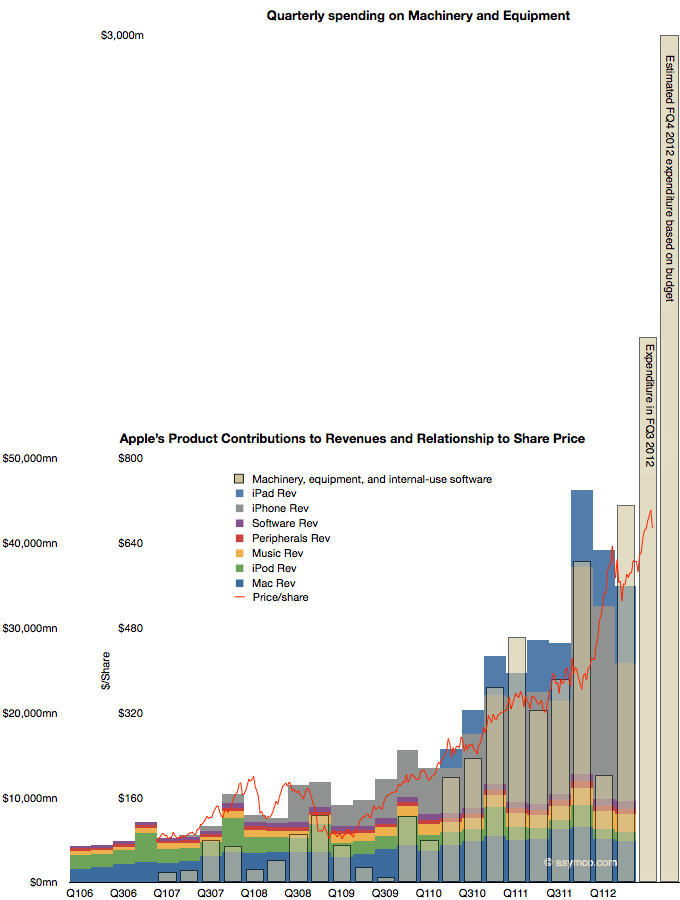
    The CapEx data shows the offset to the right due to the relationship with production being time shifted by one quarter. Recall that expenditures are booked ahead of output and therefore we have this apparent view into the future.

    The fourth fiscal quarter's spending has just ended and the output will be produced during October-December period.

    The obvious question is whether production will increase in response to spending (as it has in the past), or, put another way, will the stacked bar areas follow the beige bars and, furthermore, will share prices follow production (as they have in the past) and thus the red line will follow the beige bar.

    It takes money to make money. The relationship seems to be that $1.5 billion of CapEx per quarter yields a share price of $800. With spending reaching $3 billion per quarter will the share price reflect a similar ratio?
  2. Estimates for Apple's fourth fiscal 2012 quarter [Updated]

    Research · 74 comments

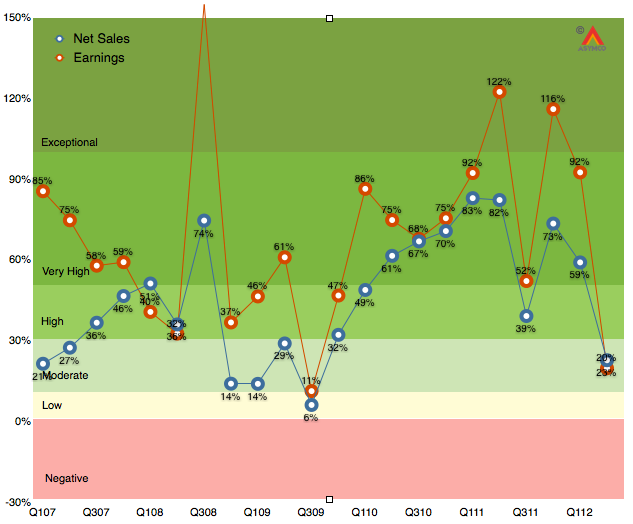
    As the chart below shows, the last quarter (second calendar 2012, third fiscal 2012) was disappointingly moderate with 20% earnings growth and 23% net sales growth.

    It was the first quarter since the iPhone launched that earnings growth has fallen into moderate (below 30%) territory. Much of that disappointment (to me) was the relatively low performance of the iPad following a launch quarter. The iPhone was weak as well, though that was expected.  As I said last quarter, the iPhone is still the most important component but the iPad is becoming increasingly decisive in overall performance. In fact, I’m projecting that the iPad will have the same revenues as the iPhone had one year earlier.

    The iPhone is going to be extremely difficult to project. On one hand we have the launch of the i5 which will account for about 10 million units in the quarter, on the other, chances are that sales were very weak prior to the launch as purchases were being deferred even more than during the last quarter.

    So with these very meager clues, here are my estimates for the quarter (with y/y growth in parentheses):

    • iPhone units: 27.8 million (62%)
    • Macs: 5.6 million (15%)
    • iPads: 18.8 million (69%)
    • iPods: 5.6 million (-15%)
    • Music (incl. app) rev. growth: 40%
    • Peripherals rev. growth: 10%
    • Software rev. growth: 15%
    • Total revenues: $39.5 billion (40%)
    • GM: 42%
    • EPS: $9.75 (38%)

    This earnings value would imply a trailing twelve months’ EPS of about $45.2. At the current price of $697/share the P/E would be 15.4. Cash and equivalents will probably increase to $125 billion or $131/share. Excluding cash, the P/E would be 12.5.

    [Update. The EPS figure above includes a tax rate estimate of 30%. Company guidance was 25.5%. Using the company's guidance yields an EPS of 10.43. TTM EPS becomes $45.9/share and at $697 the PE is 15.2. At time of this update the share price has fallen to $665 and thus the pro-forma trailing P/E ratio is 14.5).]

  3. An interview about Microsoft's Surface

    Research · 15 comments

    This interview was conducted with Bruno Ferrari Editor of Exame magazine in Brazil.

    First, do you have forecasts for tablet market share including Microsoft for next years? (Apple, Android, Amazon etc)?

    I have some guesses but I don't think it's something that is defensible. Too many things can change. Fundamentally I believe Microsoft sees the tablet as a PC and intends to migrate a substantial portion of would-be PC customers to tablet forms. If they are successful then they preserve the existing PC user base and allow it to grow a bit.

    In contrast Apple sees the iPad as a new type of device that is used for things not directly related to PC style computing. In that sense the iPad competes with PC non-consumption. It means people may own both a PC and an iPad and some will own only an iPad. The iPad will expand the market while taking share from the PC. Windows tablets will try to hold the Windows share steady.

     How do you analyze Microsoft’s strategy with Microsoft Surface? Don’t you think they’re admitting themselves that Apple was right since the beginning?

    We don't know the strategy yet. Without pricing and an idea of how the other OEMs will respond, I have more questions than answers. The fact that they are doing their own PC hardware does indicate that they see the industry architecture changing and that a large number of vendors offering hardware "choice" is not really the basis of competition in PCs. In other words, buyers are not willing to pay a premium for Windows because the hardware it's available on is offered in a wide range of options.

    Do you think MS growth at tablet market will surpass the lost at PC (desktop and notebook) market in the next years?

    This is a crucial question. It's possible that Windows 8 on tablets will create new markets, like the iPad has done and it could take the leading role in expanding computing in a post-PC era. However, to do this, Windows 8 and its successors need to be optimized to solve the new jobs people may have for mobile devices. They have to do this even though they need to sustain the old use cases and business models. To succeed Microsoft needs to "fork" the business model and create new ways of profiting from hardware and software. The rumors that Windows 8 RT devices will be sold at a loss is perhaps a hint that this is the plan.

    Did you see the rumor of a 199 dollars Surface? If it’s true, do you think is a good strategy?

    It all depends on what will be the alternate source of revenue. I assume there will be some sort of subscription service, taking a page from the telecom industry. Perhaps a mixture of Windows Live services (media, documents in the cloud and software updates). We have to see whether subscription computing makes sense for consumers.

    How do you see the problem that MS is creating with its OEM by turning itself on a tablet maker?

    There is a problem, of course. However here again the question is whether they are moving to an "ecosystem subscription" model and whether they want to offer revenue share to OEMs. If they offer something then Microsoft plays the role of the operator and device makers are paid some up-front subsidy in exchange for keeping their systems locked into the network.

     One more questions: did you already estimate the shipments of Samsung Galaxy Tab since its launch?

    Sorry, I don't have the Galaxy Tab estimate. However, here is what I found:

    A week after its release, Samsung announced that they had sold 600,000 units. On the 4 December, it was reported that the 1 million mark was reached, two months after launch. However, an executive at Lenovo claimed that Samsung had only sold 20,000 out of the 1 million Galaxy Tabs that were shipped. In January 2011 Samsung announced they had shipped 2 million units to stores. In August 2012, actual sales figures were released in the patent infringement court case against Apple showing that a total of 725,000 Galaxy Tabs were sold through Q2 of 2012.

    Source: Wikipedia.

    Note that the figure of 725k is US only.

  4. How many Kindle Fires were sold?

    Research · 71 comments

    Last September I argued against the potential of the Kindle Fire acting as a low end disruption in the tablet market.

    Now that the first version of the product has reached is end of life, it's time to review the discussion.

    The first problem is finding out how well the product did. Amazon just released a statement that the Fire accounted for 22% of tablet sales in the US in the nine months it was available. The challenge becomes knowing how many total tablets were sold in the US during this time frame.

    Fortunately we know the vast bulk of that total based on the Samsung v. Apple trial. Both Apple and Samsung submitted as evidence sales of the iPad and the Tab product lines in the US. The iPad added up to 16.14 million units (Q4'11 through Q2'12) and the Tab was 540k units. That makes the iPad and the Tab add up to about 16.7 million units. Assuming an additional 1 million units for the other (non-Kindle) total yields an estimate of 22.7 million tablet devices sold in the nine months ending June.

    Applying the 22% claim to that total gives a Kindle sales total of 4.987 million. That's awfully close to a round number of 5 million.

    Since Amazon admitted that they ended production prior to launching a replacement (and presumably did so quite early in order to drain inventory,) then we can safely assume that the original production order was 5 million units.

    Five million Kindle Fire units becomes the first reliable estimate of Kindle sales (based on Apple, Samsung and Amazon supplied information rather than guesses from analysts.)

    So the question now is whether this is consistent with the hypothesis that the Fire is disrupting the tablet business.

    Bearing in mind that this 5 million total was reached with prominent placement on Amazon.com and a loss-leading pricing, I would conclude that this is not an auspicious start for a disruptive product.

    As I argued nearly a year ago, the business model for the Kindle is limited to the footprint of the Amazon franchise, which is small internationally. Amazon itself implicitly admitted that the product was a US-only phenomenon. Further worry comes from the way the company approached production. It was not planning it as a maximization of reach into the market. What they did was order a batch production and then wait for it to be sold through.

    Perhaps Amazon is being patient for growth, but I don't see a hunger for profit in this strategy. We know that Kindle probably lost money at the price charged. Perhaps it's on the order of $40 per unit. Five million units would imply a charge against the business of $200 million. Did Amazon earn a profit on content sales of $40 on each of those five million units? The margins on content sold through Amazon are so low that I have a hard time imagining that Fire users are that ravenous in their consumption.

  5. International Tablet of Mystery

    Research · 31 comments

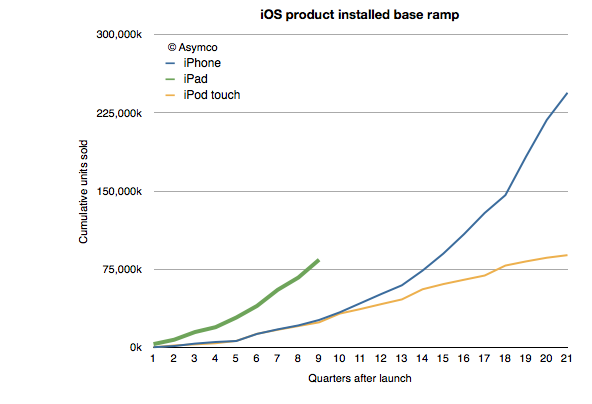
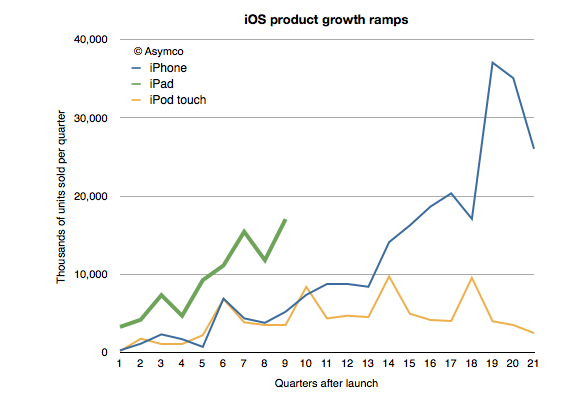
    One of the remarkable patterns associated with the iPad has been its growth rate. Looking at the ramp of the product relative to the iPhone and iPod touch reflects this sense of raised expectations:


    At the same point in time, and adjusting for seasonality the iPad is outselling the iPhone by a factor of 3 and the iPod touch by a factor of about 5. This is also reflected in the installed base of devices, where the 84 million iPads sold through its first nine quarters is more than three times the iPhone base at a similar point in time.

    Of course, the world of 2012 is different than the one from 2009 when 25 million iPhone sold. iPhones are available in far more points of sale and to many more buyers world-wide. But the interesting contrast is between the iPad and the iPod touch.

    I've always maintained that the dynamic difference between the iPad and the iPhone is that it's unrestrained (and unsupported) by the operator channel and all that it implies. The iPad is a pure computing product whose means of communication is unregulated. That means transparency in pricing and transparency in distribution.

    But so is the iPod touch.

    The iPod touch is a "nano iPad" (or as detractors put it, the converse of that.) So shouldn't the iPod touch behave as the iPad?

    We don't know exactly how the iPod touch behaves. We don't have specific figures on its sales. What you see in the charts above are my estimates for the iPod touch based on company statements that "about/above 50%" of iPods are touch versions. That and the cumulative sales totals that are occasionally reported.

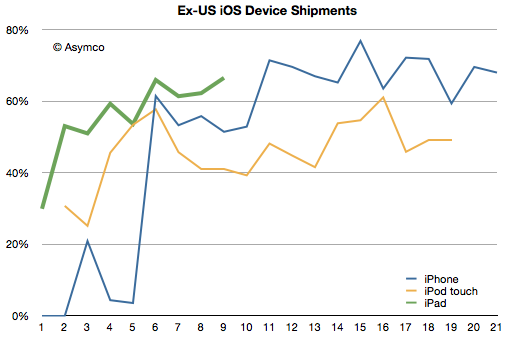
    However, we have received an unexpected morsel of data from the Samsung v. Apple trial that may help characterize the two products: US sales data. Having the US data and knowing/estimating the global data gives us an estimate of the international (ex-US) sales for all three products.

    I indexed the three products to measuring quarters since launch. The pattern here is that the iPad diverges from the iPod touch in its international appeal. Since the iPad expanded internationally even faster than the iPhone, the issue is not only one of rapidity in appeal but also a qualitative difference.  The iPod touch seems to have stabilized at 50% non-US sales while the iPhone is between 60% and 80% outside the US.

    The iPad reached 60% non-US sales in its first year. Its last quarter was 70% outside the US.

    So what's going on?

    The characteristic value of the iPad is in its appeal to "computing non-consumers". Computing has come to mean media consumption, education, communication and entertainment. These jobs to be done are casually done with much more ease on an iPad. The iPod touch can do these jobs as well, but not as comfortably. The iPod touch is "absorbable" by younger consumers and typically they have their hiring done by their parents. Those parents are less likely to indulge where incomes are lower.

    But the universal appeal of the iPad is evident in its global visibility. Like the tasks it performs, the iPad itself is becoming less of a mystery.

  6. How many smartphones did Samsung ship in Q2?

    Research · 62 comments

    50.2 million.

    That's the estimate from IDC. So why bother asking?

    Because that is an estimate. Of the 104 million Android phones shipped in the quarter (itself an estimate from another, possibly different methodology), I could only account for 7 million actually reported. That figure comes from a close reading of an investor presentation from Sony. HTC does not report their shipment numbers. It stopped some time late last year. Neither does Motorola now that it's a part of Google. Huawei is silent except for setting targets and ZTE published a press release citing IDC's estimate of its own shipments.

    But most glaring of all is the absence of any mention by Samsung of its performance. The company stopped reporting any data on either overall phone shipments or of smartphones within that total since Q3 2011. We may have been able to estimate Samsung if we had more competitor actuals, allowing us to back into a figure. But we don't.[1]

    Which leaves us with IDC's estimate[2]. But the problem is that since the industry is growing so quickly it is very sensitive to assumptions. Consider how difficult it is for consensus estimates for Apple's iPhone shipments to come near the actuals--and that's for one quarter, and knowing all the previous quarters with precision. The absence of visibility into the assumptions made by market analysts (or their methods) should lower confidence in the results.

    Consider that IDC specifies 50.2 million Samsung smartphones, implying an accuracy down to 100,000 units. Is this accuracy believable?

    There is reason for doubt.

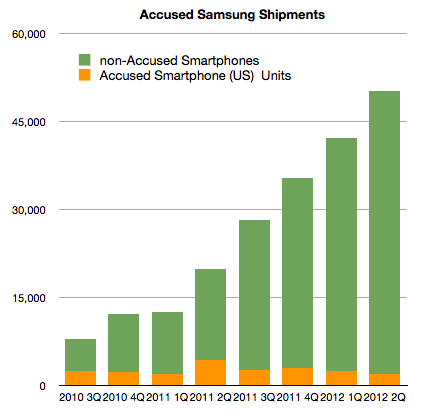
    I start with the following graph:

    It shows the estimates for Samsung global shipments (latter four quarters are estimates without the benefit of company reports.) I separated the component of shipments that Samsung reported as part of its submission to the Samsung v. Apple trial in California. Note that this (orange) segment consists of most US smartphone shipments. It's not all US Samsung shipments. It notably excludes the Note, the latest Nexus and the Galaxy SIII.

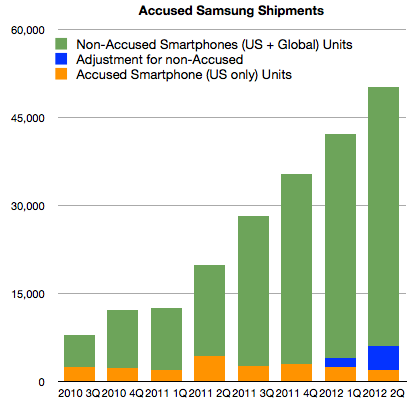
    Without these "non-accused" phones, it would appear that Samsung's US volumes dropped to 4% of global totals from a 10% average[3]. In order to return to 10%, the US totals would need to be adjusted as shown below:


    I added 1.5 million units in Q1 and 4 million units in Q2 (to account for Galaxy SIII).

    So far this seems consistent with the total estimated global shipments of 50.2 million from IDC. US units would result in 12% of global shipments.

    However, there is more data we can test against. First, we are also given pricing for the US phone portfolio, or at least we have revenue per unit sold. This allows us to get an idea of what revenues can be obtained for the smartphones in the US, and possibly world-wide[4]. Knowing prices for smartphones and knowing global sales (which Samsung reports) and finally knowing global total phone shipments allows us to price the average non-smart phone.

    Excluding the non-accused smartphones, the average revenue per smartphone in the US for Samsung in Q2 was $339. Adding in the estimated Galaxy SIII (4 million) at an average price of $470 gives a new "ASP" of $413.

    This is where the analysis goes off the rails.

    If we assume the global ASP is equal to the US ASP and knowing everything else about the mix of smartphones (54% of total) and revenues (as reported) yields a negative ASP for feature phones. Assuming the revenue figure is correct, either the number of smartphones is wrong (50.2 million) or the global ASP ($413) is wrong. The total phone number is also an analyst estimate which can be called into question.

    There are many assumptions being multiplied here so I have very low confidence in the result, but we should ask "what do you need to believe" in order for the 50.2 million figure to be real. The following scenario for example has to be true:

    1. Global Samsung phone shipments total 93 million units (which means 42.8 million feature phones sold as well as the 50.2 million smartphones).
    2. 6 million smartphones shipped into the US, equivalent to about 50% increase y/y, roughly in-line with market growth
    3. 4 million Galaxy SIII shipped (but not necessarily sold through) at an ASP of $450. This results in a US total smartphone ASP of $413
    4. The global smartphone ASP is significantly lower (at 80% of the US or $330)
    5. Global revenues of $18.14 billion is essentially all from phones
    6. Global feature phones will have an average price of $36

    If these conditions are met then it's possible that 50.2 million Samsung smartphones did ship.

    The figure for feature phone ASP is difficult to accept as it would be lower than Nokia's. Also, the low global smartphone ASP is also difficult to accept but it might be possible to find a scenario with the above variables which makes the 50.2 million figure believable.

    Unfortunately this is an unsatisfying analysis. I could propose another figure to answer the question in the title, based perhaps on more "believable" assumptions. But I have no means to defend my assumptions. The only option I have remaining is to caution that the total smartphones shipment estimate for Samsung remains precarious. The new evidence from the US trial places more doubt on it but it is not enough to disqualify it entirely.

    ---

    Notes:

    1. This cone of silence over 93% of the most popular mobile platform is somewhat puzzling in contrast to the perfect information we are used to having about iOS, BlackBerry and even Symbian. It seems that the more open a platform, the less is revealed about its market performance. This extends to the licensed Windows Phone whose shipments are only revealed through Nokia's reporting of Lumia shipments.
    2. In the PC market, vendors also selectively publish their units. The norm is, however, not to. As a result IDC et. al. are the only sources for global market data. However, the PC market can be sampled more easily than the phone market. PC retail measurement methods are more reliable compared with all the points of sale for phones.
    3. Note that Apple sells about 30% of iPhones in the US.
    4. Apple's pricing world-wide is very consistent with pricing in the US which makes sense from a channel management point of view. One would not want to create incentives for cross-border arbitrage of phones.
  7. Apple Store Operational Economics

    Research · 18 comments

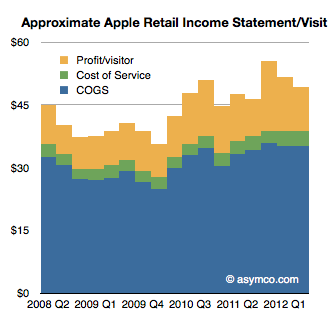
    In a footnote to my last post on Apple Retail (The face and the brand) I used data on operating performance from Apple and an assumption about employee salaries (which turned out to be low) to estimate that about 7% of Apple store sales are spent on "cost of service" or the operational expenses, which consist of mostly employee salaries.

    An updated view of this store income statement (on a per-visitor basis) is shown below:

    To summarize the logic, during the last quarter Apple received $49.2 in store revenues per visitor. Knowing the retail profit ($10.46/visitor) and knowing the time spent per visitor (14 minutes, itself derived from the number of full time equivalent employees--41,000 or 112 per store) and assuming the cost of that time in employee salaries ($15/hr including benefits), gives us an estimate of the service cost ($3.55/visitor) and therefore the cost of goods sold ($35.2/visitor).

    Now I want to focus on this ratio of service cost/sales which turns out to be about 7%[1] and ask whether this is significant or revealing.

    In order to do this we have to understand that most stores, especially electronic goods retailers, don't spend this much on salaries. They do spend quite a bit on commissions however. From a post on the subject, I gathered the following commission rates for various retailers:

    • Phone stores: $25 for activations, 10% of accessory sales
    • Beauty/handbags at department store counters: 3% to 5%
    • Shoes, appliances, electronics: 8 to 10%
    • Furniture: 2% to 6% (low rate includes salary)
    • Real estate: 2.5% to 3% (no salary)
    • Car salesmen: 30% after dealer costs

    Now 7% to 10% that Apple spends on salaries starts to make some sense, economically. It's roughly equivalent to what another retailer might spend out of their sales on the help.

    The difference is that Apple does not pay commissions and that cost is spread over a far larger headcount of staff. Roughly speaking it implies that Apple hires five times as many employees (consider how many people you might see in an Apple store where the average is 112 and in a similarly sized Polo Ralph Lauren outlet) as would be needed to "just sell stuff."

    The trade-off seems to be that Apple will pay a modest wage to a hundred employees rather than a commission to a handful. The trade-off is pretty even since the profits would be the same.

    But they wouldn't be.

    The difference is that what the customer buys is different. Or, put another way, a store bursting with staff is hired by the customer to do a different job than a store filled with a handful of "salesmen".

    Even though the economic ratios are similar, the result is that visitors at an Apple store are made to feel they're getting a service rather than being sold a product.

    And that's the key to there being very many visitors. And, incidentally, they happen to buy more things. And also incidentally they come to value the brand more.

    It also leads to a virtuous cycle. More visitors means more visibility for the store and that leads to more visitors still, and that leads to more employees.

    So a simple decision to hire in proportion of a level of service rather than a level of sales leads to completely different bottom line results.

    That's not to say that this model is transplantable. The entire system depends on having the right goods to sell and the right brand image. But if Apple had all those things and imposed a commission structure in its stores, one can be fairly certain that sales would not be as spectacular and growth itself would suffer.

    ---

    Note:

    1. Again, this is probably quite an under-estimate and the actual cost of service might range up to 10%.
  8. Estimating third and fourth quarter iOS shipments

    Research · 47 comments

    In the 2011 Annual Report(10K) published October 26th Apple states:

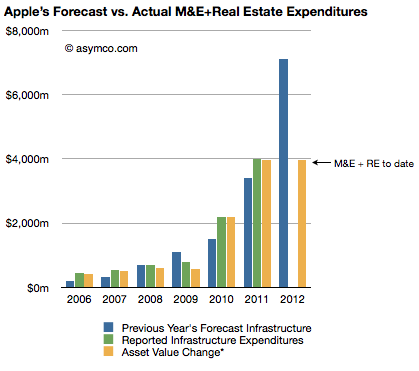
    The Company anticipates utilizing approximately $8.0 billion for capital expenditures during 2012, including approximately $900 million for retail store facilities and approximately $7.1 billion for product tooling and manufacturing process equipment, and corporate facilities and infrastructure, including information systems hardware, software and enhancements.

    The history of these expenditures is shown below (the blue bars are statements from 10K reports including the one above shown as the right-most bar):

    Three 10Q reports so far this fiscal year have given us updates on asset values and the change in these values are shown as the right-most yellow bar. The asset value change suggests $3.9 billion has been spent so far of the $7.1 billion budgeted. Thus we can estimate that about $3.2 billion remains to be spent in the fourth fiscal quarter (thus bringing the yellow bar to parity with the blue bar in the chart above--a parity that was achieved or exceeded for five out of the last six years).

    Assuming $200 million of the fourth fiscal quarter budget will be for land and buildings[1] results in an estimated $3 billion remaining for product tooling and manufacturing process equipment and data centers.

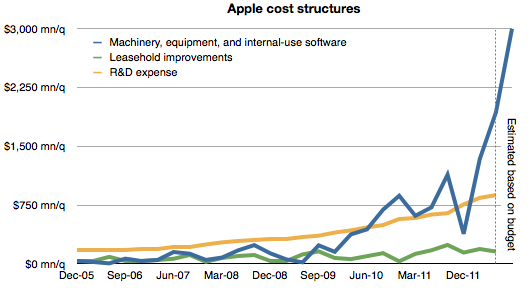
    The history of spending for various cost centers is shown below.[2]

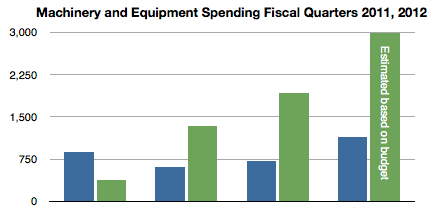
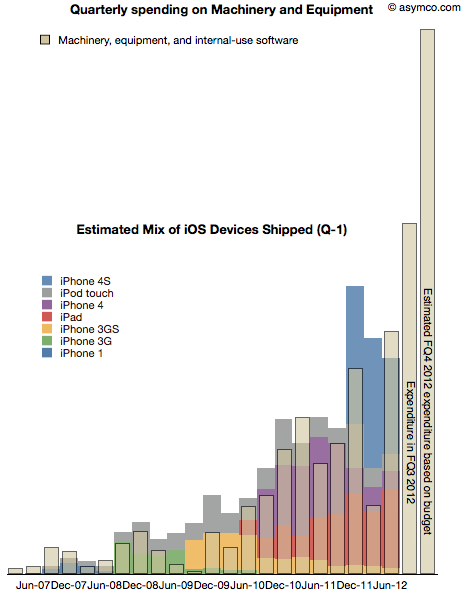
    Note again the forecast for the fourth quarter based on budget given last October. Also shown below is the spending on machinery and equipment by quarter for the fiscal years 2011 and 2012 including the estimate for FQ4 2012. (Blue bars represent 2011 quarters and green represent 2012.)

    As discussed previously, spending on machinery and equipment has shown a strong correlation with the output of iOS devices in the following quarters. The following chart shows the superposition of M&E spending in a given quarter and iOS output in the following quarter.

    Note that due to the time-shifting the Expenditure for FQ3 does not have a corresponding output--expected in FQ4--and that FQ4 expenditure is estimated based on budget.

    With this data in place, we can now begin to answer the question of what are the total iOS device shipments expected in the current (ending September)  and the following (ending December) quarters.

    Our eyes are pretty good at seeing patterns in data so perhaps it would suffice to know the scale to the graph above and thus fill in the colored output bars to match the spending. But to make it a bit more precise, I drew the following chart:

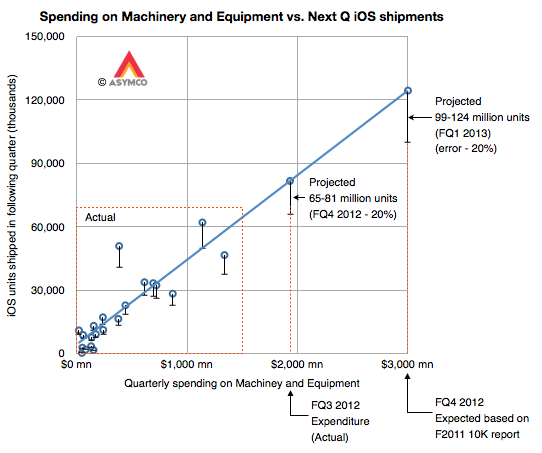
    It shows the same data but as an X-Y scatter plot where the X axis is quarterly spending and the Y axis is iOS unit shipments. Note that the actual data points are in the lower left area delineated with a dashed red rectangle.

    I drew the blue line corresponding to an assumed linear relationship between the two variables to project the iOS output based on additional expenditures for FQ3 and FQ4.

    I used error bars of -20% to show a possible conservative range.[3]

    This yields an iOS output of approximately between 65 and 80 million units in the current quarter and 100 to 125 million in the fourth calendar quarter. The sum of the low ends of this estimate is 165 million units.

    My current forecast is  53 million units in CQ3 and 110 million units in CQ4 which, together, add up 163 million. Close enough.

    Stay tuned for a padcast report with more details on this approach.

    ---

    Notes:

    1. The company spent $31 million, $66 million and $159 million for the first three quarters on Land and buildings. $200 million in the fourth quarter seems reasonable unless there is a pending large land deal closing in the next two months.
    2. I added leasehold improvements as a proxy for store openings and R&D expense as a proxy for overall product development. These are in contrast to expenditures for product production and support which are represented by Machinery and Capital Equipment.
    3. Note the other data points' error bars
  9. Scoring my performance on the third fiscal quarter forecast

    Research · 21 comments

    Did I get anything right in last forecast?

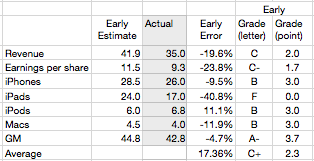
    The table below shows the scores for my various estimates[1]

    Last quarter I managed a B+ overall but this quarter was a C+. The iPad estimate was a complete failure mitigated slightly by a, directionally at least, correct call on the iPhone. The failure on iPad dragged down revenue and EPS while the accuracy on iPhone improved the gross margin. iPod and Mac estimates were consistent with recent performance.

    The error on iPad is a harsh lesson which shows how the category is still unpredictable. With only four quarters where we could measure y/y growth, and with those quarters showing 183%, 166%, 111% and 151% growth, I assumed that the 150% growth was sustainable.

    That turned out not to be the case. The iPad slowed to 84% unit growth and 51% revenue growth. It's perhaps unrealistic to expect 150% growth for more than one year. This is the main learning for the quarter and I will adjust my expectations accordingly. Overall, the product has sold 84 million units since launching in early 2010. I now expect it will sell approximately 80 million this year and 150 million units in 2013.

    ---

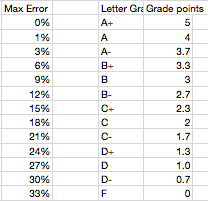
    Note: Grading algorithm is based on this table:

  10. How many Lumia phones were shipped in the US?

    Research · 41 comments

    The US is a crucial market for both Nokia and Microsoft's strategies. This importance was highlighted during the launch at CES in January when not one but three CEOs (Microsoft's Steve Ballmer, Nokia's  Stephen Elop, and AT&T's Ralph de la Vega) were on stage to launch the Lumia. Knowing how well this strategy is working would be very useful to understanding how this market behaves.

    My first take on this was when I asked the question How many Lumia phones were sold in the US? The answer suggested through the combination of survey data from Nielsen and comScore[1] was 330,000. The figure is quite small compared to expectations. As it's so extraordinary, it should be supported by good evidence. Unfortunately the methodology used is weak. The figure itself is probably close to the margin of error of such sampling techniques. It would be nice to have another way to calculate this.

    Today Nokia offered another set of data which might help determine how many Lumia phones were shipped in the US. (Note the shipped versus sold distinction. Companies report shipments while surveys nominally measure consumption or usage.)

    Unfortunately, Nokia did not offer specific data on US shipments. What they did offer was:

    • Global Lumia shipments were 4 million in the last quarter
    • Global average selling price was €186 for a Lumia phone
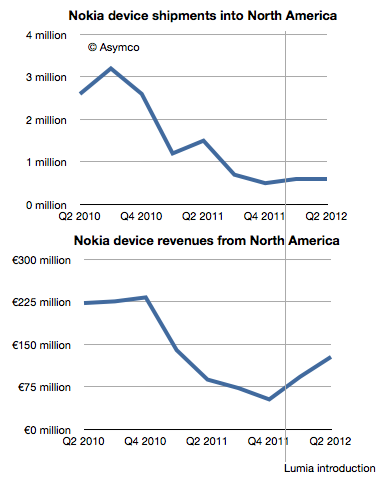
    • North American[2] phone shipments were 600k. This includes all phone types and all operating systems.
    • North American sales were €128 million.

    That's all we have. So how can this help with the question of US shipments?

    As often happens, it helps to look at the data historically. The following charts show North American shipments and sales with the Lumia launch date highlighted.

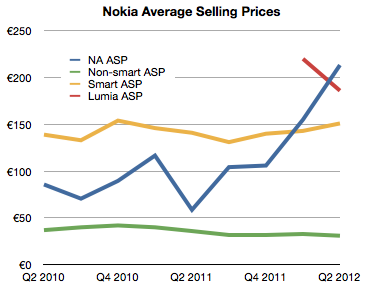
    While unit shipments were flat, revenues increased significantly. This suggests that we could plot the average selling price of phones in North America (NA) specifically. I did that in the following chart:

    Here the effect of Lumia is clear. The average revenue per phone in the US (blue line) jumped dramatically after the launch. So much so that it actually overtook the average global ASP for Lumia.

    What we need therefore is a way to estimate the "mix" or percent of smart and non-smart phones sold into North America and derive perhaps the US portion of that and then finally try to separate the Lumia from all the smart volumes.

    To help, I plotted the historic ASP for Smart and non-Smart devices as provided by the company.

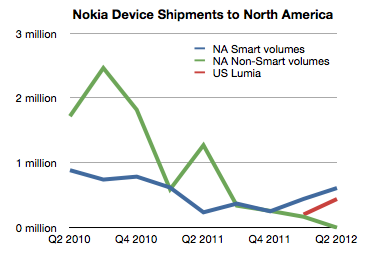
    Using a simple formula[3] it's possible to derive the mix which is shown as Green and Blue lines in the following chart.

    Getting estimates for smartphone shipments (blue line) is pretty close to Lumia shipments, but we still have to correct for US/Canada split (estimated at 90:10) and Symbian/WP split among smartphones (estimated 50:50 in Q1 and 20:80 in Q2).

    The result is the red line showing US Lumia shipments. The sum of the two quarters then comes to 630k.

    This is nearly twice the estimate from consumer survey data however I would not draw too many conclusions from this. Mainly because there are many assumptions place in both estimates, but also because there is the distinction between shipments and usage.

    However, it might be safe to say that US install base is somewhere between 400k and 1 million users. Is this good or bad?

    It's good because it's progress and there is some growth. It's bad because it's frightfully small relative to the competition. Nokia itself acknowledges the challenge and states that "We believe the Windows Phone 8 launch will be an important catalyst for Lumia."

    It seems that what Nokia needs most today is time. That is a very expensive asset. Perhaps infinitely so.

    ---

    Notes:

    1. A practice neither company would condone, principally because they are competitors, but also because they use different sampling methods.
    2. North America I take to mean US and Canada. Although geographically, Mexico is part of North America it's usually grouped as part of Latin America as a category. I'd like to get this confirmed.
    3. There are a few implicit and explicit assumptions: (a) Global ASPs are roughly comparable with NA ASPs but (b) smartphone ASPs are higher in NA by about 30%
  11. Waiting for Godot

    Research · 46 comments

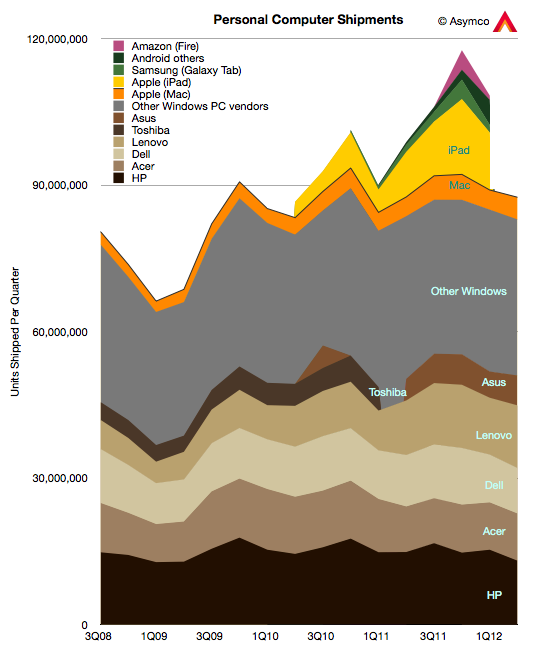
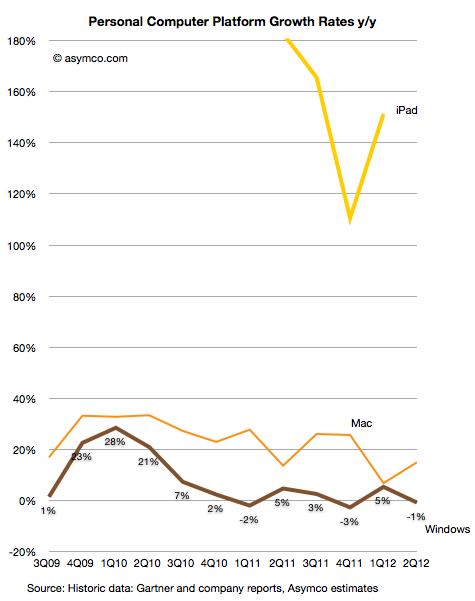
    Gartner has published preliminary PC unit sales for Q2. The data from Apple's Mac sales has not been published yet but based on some estimates, we can draw a partial picture of the personal computer market.


    My estimate is that the Windows PC market fell by 1% while the Mac market grew by 15%. Gartner reports an overall flat market. I'll leave out the iPad for the time being, and show the growth of the Mac vs. Windows:


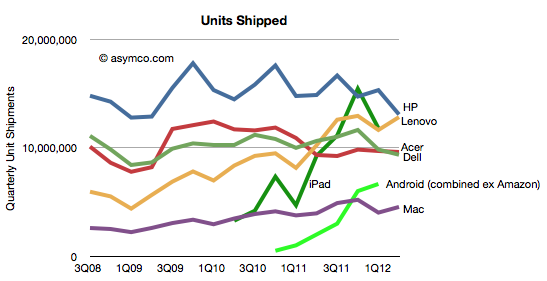
    In terms of individual vendors vs. each other, the patterns are as follows:

    It's perhaps a bit early to tell, but if the Windows PC market continues to slow or contract, it may be possible that HP and Dell will cede their market share leadership positions to Lenovo and Acer. Already "Others" account for as many units as HP and Dell put together.

    If we are to believe the analyst community reflects consensus, the industry, in the aggregate, continues to treat the potential for disruption from devices as unlikely. There always seems to be a wrinkle, a quirk, or an exceptional circumstance that is to blame. I won't get into all the excuses given by analysts for the slowing of PC sales but will point out that there's been a series of initiatives put forward by the industry to act as "catalysts" for growth. So far they have not worked. The current expectation is that Windows 8 will reverse this trend.

    Perhaps. But perhaps the relief, if it comes at all, will be temporary.

    [UPDATE: Due to a data error, the drop in Windows was overstated in the initial version of this post as 10%. It's been corrected to a drop of 1%]