Asymco

Asymmetric Intelligence

estimate

  1. When will smartphones reach saturation in the US?

    Research · 36 comments

    Nielsen has already noted that more than half of US consumers have smartphones. comScore's data seems to point to that threshold being crossed sometime this year.

    If that point is crossed then it would mark the smartphone as one of the most rapidly adopted consumer technologies of all time. I plotted the time it took for a set of technologies to reach 50% penetration of US households.
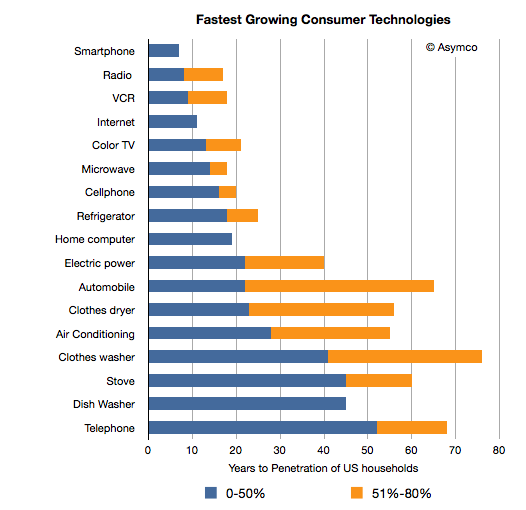
    I also showed the time it took for some of the technologies to reach 80% penetration. 

    The obvious question is how long will it take for smartphones to reach saturation in the US. Saturation level would be above 80% for individuals but closer to 100% for households. A conservative estimate would be another seven years. An aggressive estimate would be five years. That implies that between 2017 and 2019 smartphones will be the only mobile phones Americans will use. That would be equivalent to a user population of about 300 million.

    Note that some like Internet and home computers have not reached 80% penetration in the US.[1] [2] When or whether smartphones will overtake computer penetration in the US is an open question. I believe that, like cellphones have in other markets, smart devices will overtake computer consumption and thus penetration and even bandwidth consumption.

    There are significant technical and marketing challenges for reaching the "second half" of the market, but, as in all the other technologies listed above the incentives are in place to overcome these challenges. What's most remarkable about smartphones is the speed with which obstacles are overcome. For such a complex and inter-dependent technology, the speed of adoption and value creation is unprecedented.

    The value network creation rate is also staggering. The App Industry went from inception to billion dollar valuations in a matter of three years. Entirely new business models and experiences are being created almost daily. What used to be a glacial process of innovation diffusion can now be observed in near real-time.

    ---

    Notes:

    1. The question of when smartphones began penetrating the US is somewhat debatable. I contend it was either 2004 or 2005 when the BlackBerry and Treo brands began to be widely available. Although there were smartphones in production as early as 2001 (or even 1998 if we choose to include the GeOS based Nokia Communicator) their availability to US consumers was very limited.
    2. Source for consumption data: New York Times.
     

  2. The value of the OS X monopoly

    Research · 40 comments

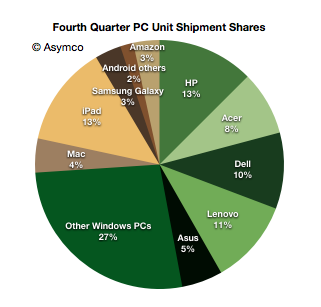
    In January I noted that there were more iPads sold by Apple than PCs from HP, the largest PC vendor in the fourth quarter. Including all tablets, this is the distribution of market shares by units shipped.

    Note the different color palettes for Windows and non-Windows.

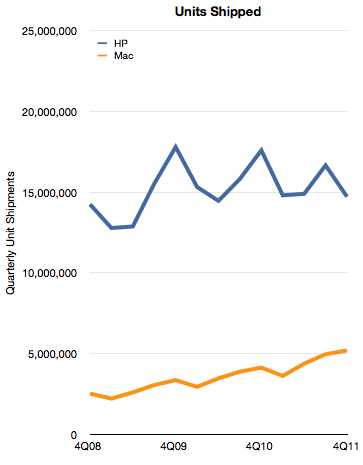
    By the metric of tablets+PC's Apple appears to be the leading vendor. However, if we consider only the Mac, Apple is still well behind. The historic unit volumes of the two is shown below:

    Although Apple has nearly doubled its shipment volumes since 2008, it's still only one third that of HP. In addition to comparing volumes, we can also measure profitability. In this case HP's PSG (Personal Systems Group) reports operating profits and we can estimate the same from Apple based on a gross margin estimate and an operating expense estimate (as percent of sales).

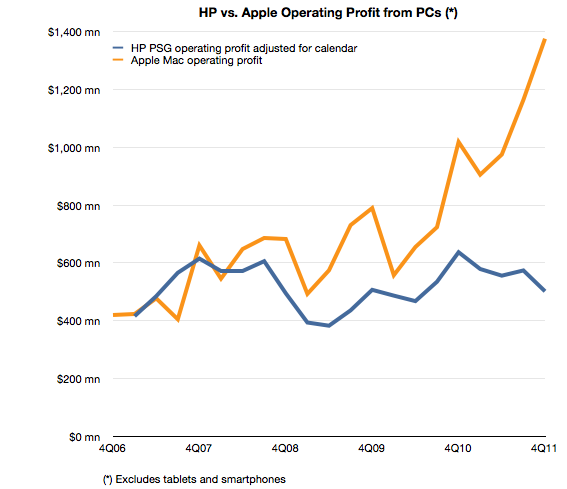
    The comparison looks like this:

    The operating profit for Apple is 2.7 times higher from a third the units. This gap is a result of a vast difference in profitability. HP's operating margin for PCs is 5% while Apple's is 21%.

    A few days ago I highlighted that Apple's iPhone yields disproportionate profits because of the way it performs the jobs its hired to do by consumers and operators.

    With the Mac the story is that Apple's OS X is primarily responsible for delivering quadruple hardware margins vis-a-vis the most successful PC vendor.

    Both iPhones and Macs are sold as hardware products and the entire econometric analysis of Apple depends on hardware cost structures. This is because hardware lends itself to easy measurement. However, a casual observer would be stumped by a comparison with competitors which cannot come near the profitability Apple enjoys. How can the same bundle of components (admittedly mostly off-the-shelf) be sold at triple the margins?

    It comes down to software. Apple has a monopoly on iOS and OS X and charges for it through its hardware. That's a very valuable monopoly. It's worth at least $1 billion per quarter.

  3. iPhone sine qua non

    Research · 82 comments

    Last week I made an attempt to measure the iPhone's manufacturing cost given new data points from the Foxconn field trip. The post generated a great amount of new knowledge and the feedback was very valuable.

    The main value to me came from stepping back and looking at the entire cost and value structure for the iPhone. Putting costs into perspective is as valuable as knowing what they are.

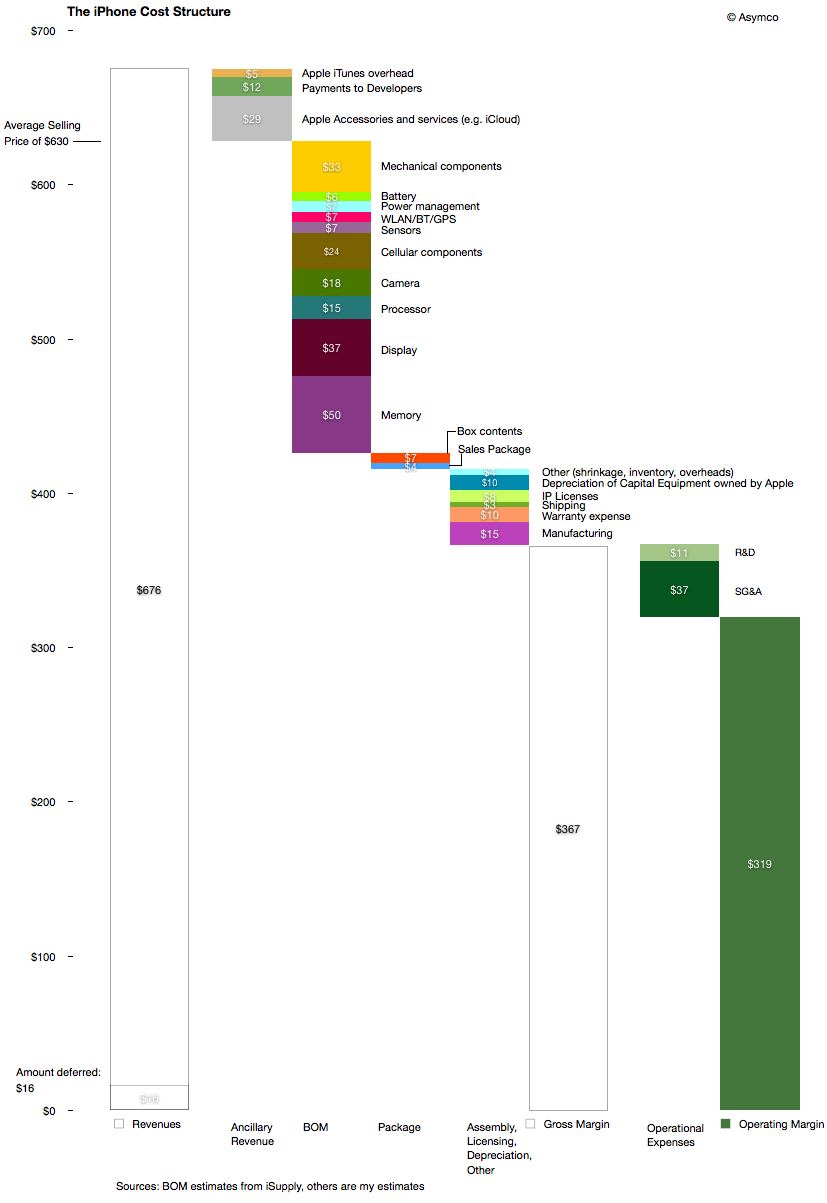
    The following diagram shows my estimates for this cost structure for the fourth quarter given both bill of materials estimates and the other parts of the cost of goods sold and operational expenses and even ancillary sources of revenue.

    Source for BOM estimate: iSupply.

    There are several observations easily made from this view:

    1. The manufacturing cost ($15 may be very generous i.e. high) but it still amounts to a tiny fraction of the device cost and hence value-add. The direct labor part of that cost is tinier still.
    2. Depreciation on capital equipment (Apple owned) amounts to $10 per device, probably higher than the direct labor cost.
    3. External developers as a group receive more app income than the salaries and costs associated with Apple's own developers working on the product.
    4. The gross margin percent is 58%.
    5. The operating margin is estimated at 51%

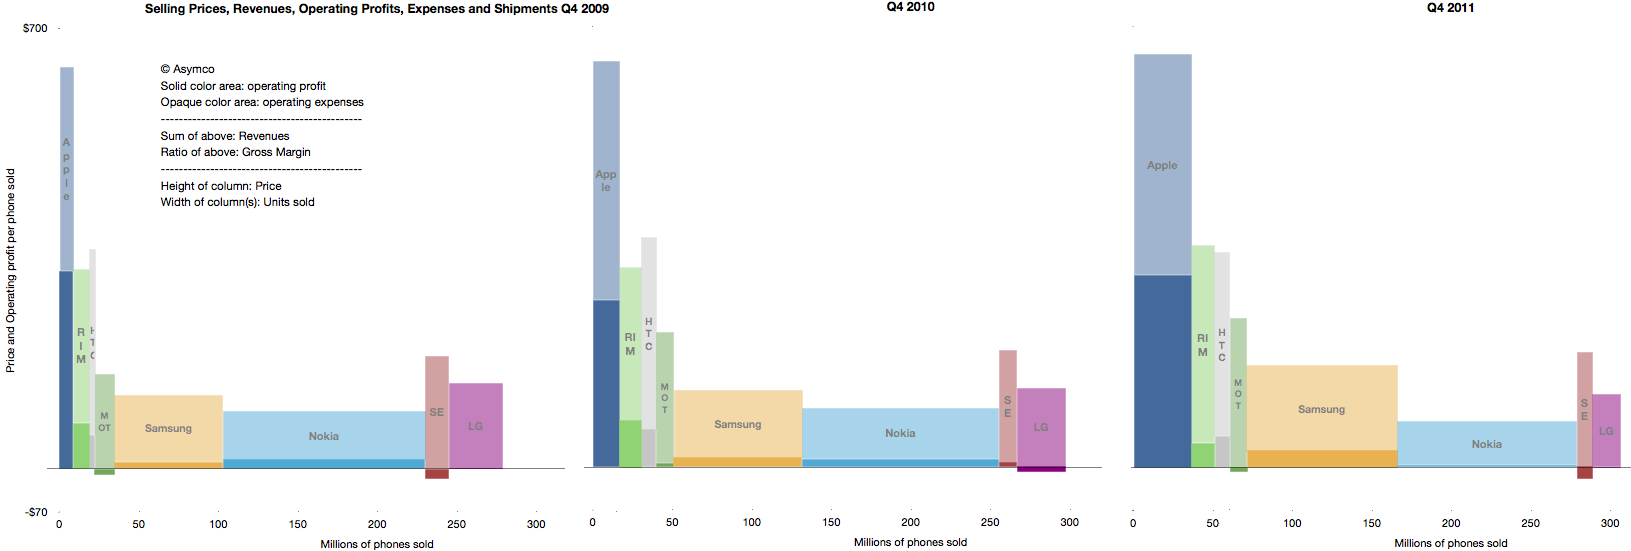
    The high margin that the product generates is even more surprising given the industry average as seen in this summary view of the industry's performance over three years' fourth quarters.

    The operating margin is the ratio of solid colors to the entire bar.

    As someone pointed out on twitter: one of these is not like the others.

    The question should be: How is this possible? What does this product have that gives it such a pricing advantage? Note the the ratio was preserved through the three years shown and has persisted for nearly five years.

    The answer to this paradox is in data that is not visible in any of the diagrams above: The largest revenue attached to the iPhone comes into the mobile network operators. We don't have global averages but the revenue the iPhone generates over its lifetime is probably two to three times the revenues that Apple directly receives. The ARPU iPhones are attached to allows for a substantial subsidy, but more importantly, loyalty (or churn)

    As seen in the small but clearly visible US market, being an operator having  iPhone exclusivity generates above-average growth and being the only operator to be excluded from the product generates above average subscriber losses.

    It quickly becomes obvious that ranging the iPhone has moved from being an advantage to not doing so becoming a serious disadvantage. The product and its high up-front costs are "hygiene factors" for operators. The sine qua non status means that it can still be priced with the extraordinary built-in margin shown above.

  4. How much does it cost to manufacture an iPhone?

    Research · 103 comments

    An iPhone generates approximately $650 in revenue for Apple. This figure has remained fairly steady over time. Using deduction from overall margins, it's possible to estimate the gross margin on the product to be around 55%.

    That means that the cost of goods sold (COGS) for the iPhone is about $293. Is that a lot? Where does that money go? What else does it tell us about how the company operates?

    To find out we need to understand the cost structure of phone building.

    Typically there are four main categories of costs for a phone:

    1. Bill of materials (BOM). This represents the cost of the components that go into the device. These are paid to suppliers.
    2. Transportation/warehousing. This is the cost to transport and store the product before sale. This is paid to shipping companies and warehousing.
    3. Manufacturing cost (including labor). This is paid to contract manufacturers.
    4. Warranty expense. This is paid back to customers for returned product that can no longer be sold.

    We can estimate a device's BOM through a teardown analysis and there are firms that do this. Usually this offers enough competitive insight into the cost structure and hence gross margin because the other items are predictable in that they do not vary greatly from product to product.

    In the case of the iPhone the BOM has been fairly steady around $200 for a new model. That leaves quite a big gap to the overall COGS of $293.

    Could transportation, manufacturing and warranty costs really add up to $90 for an iPhone?

    The manufacturing costs are not usually discussed in detail openly because the processes used are secret. However, thanks to and ABC Nightline report,  some clues have emerged about how iPhones are built and, although incomplete, they offer some interesting bounds.

    One data point recently published is that the iPhone takes 24 hours to be built. Of that 6 to 8 hours is spent in "burn-in" to install and test the software and components automatically. This leaves about 17 hours unaccounted for in the throughput time. Could this time be spent in labor intensive operations? In the ABC report the wage of workers on the line is given as $1.78/hr[4]. 17 hours of labor input would imply $30 labor cost per iPhone. That seems a lot higher than the industry (i.e. iSupply's estimate is $8 for manufacturing cost.)  This is an upper bound. Obviously, those 17 hours could be spent in automated operations which were not shown or simply sitting idle, waiting for a process to begin.

    Is there another way we can check this?

    There is. The ABC report also mentioned that there were 141 (presumably labor) work steps in the production for an iPhone. If we knew the time each step took we could obtain another estimate. For example, if each step in the human assembly process took 3 minutes[2] then human hands will touch the iPhone for 423 minutes or about 7 hours. This would imply a labor cost for an iPhone of about $12.5. If each step was longer or shorter, the cost would vary accordingly.

    Unfortunately we can't be sure of the exact cost. However, these recent clues offer some interesting bounds and observations[3]:

    • Manufacturing costs for the iPhone are likely to be much higher than comparable devices. This is partly because of the design of the product and partly because of the quality testing needed.
    • Those costs are likely to range between $12.5 and $30 per unit.
    • The iPhone manufacturing costs are likely to be twice or three times the average.
    • Labor costs are still a small part of the overall cost structure at between 2% and 5% of sales price.
    • The high level (141 steps) of human interaction in the process could be automated however, the fact that it isn't implies that the cost of automation would be higher and the flexibility of the automated process would be lower. It's much more likely that the process is a mixture of labor and robot intensive sub-processes.
    • Even if we assume a $30 manufacturing cost, there is still $60 that needs to be allocated to transportation and warranty expense. These require sanity checks as well.

    ---

    Notes:

    1. Note that R&D (engineering and development) and Sales, General and Administrative (e.g. Marketing) costs are not part of this cost structure. They are considered fixed costs and are not allocated to individual units of production.
    2. Note that during the ABC video there was mention of automated instructions being broadcast to the line. This implies that each worker is working on a "clock cycle" and each work stage is timed to take an equal amount of time. This clock cycle time is crucial in understanding the cost structure. One further clue to this cycle time comes from the iPad output rate per worker. This was mentioned in the slide show to be up to 6,000 units per day. Assuming 10 hours of working time per day means 600 units per hour or 10 per minute. This seems extremely high as the worker would have to handle the product for only six seconds. [UPDATE: Apple clarified this point: "In manufacturing parlance this is called deburring. Her line processes 3,000 units per shift, with two shifts per day for a total of 6,000. A single operator at Ms. Zhou’s station would deburr 3,000 iPads in a shift"]
    3. As this post shows the amount of information that can be obtained from observing operations can be significant and lead to competitor advantage. It should be clear why this is not something done willingly.
    4. UPDATE: In a statement Foxconn clarified wages as "We have over 75 percent of the employees in the category of earning at least 2,200 RMB ($349/month) basic compensation standard. That means they are earning 13.75 RMB ($2.18) per hour".
  5. What did I get right (and wrong) about the fourth quarter?

    Research · 40 comments

    I've been publishing my estimates for Apple's business performance for a few quarters (see here, here and here). My estimates have been collected along with those of dozens of others by Philip Elmer-DeWitt at the Fortune Apple 2.0 blog.

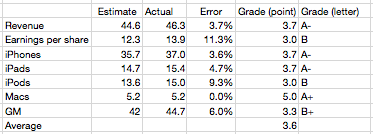
    I've also been scoring my performance and discussing the causes of errors. Here is the analysis for the fourth quarter 2011.

    My estimate for Mac growth was very precise. It was based on a 27% growth estimate. It turns out that growth was well within historic range and thus quite predictable.

    iPhone and iPad error was very modest at less than 5%. This led to a very low error on Revenues (as I also did not expect ASP to change).

    I was too pessimistic on the iPod, expecting 30% decline and 13.6 million units. In reality the business declined by only 21% and Apple still sold 15.3 million units at an average selling price of $164.

    Due to an underestimate on margins which are highly sensitive to iPhone margins my gross margin estimate was off by 6%. This led to a relatively poor EPS error of 11%.

    Nevertheless, the "grade point average" for the quarter was 3.6 which is nearly an A-. This is an improvement from the B- from the last quarter.

    Because the accuracy was good, there is little to be learned from the quarter. Perhaps the most important observation is that the iPhone recovered from two outlying quarters. The second quarter where it overshot expectations and the third quarter where it undershot. These were hard to predict because the product went through a delayed transition which whip-sawed both production and sell-in.

    What we saw in the fourth quarter is a  return to the predictable historic growth of nearly 100%.

    To give a perspective on the performance of other analysts, a motion chart showing their errors is here.

    See also the video PED published of the same data here. (This video was produced from the same motion chart shown above, selecting bars instead of bubble as the chart type).

    Notes:

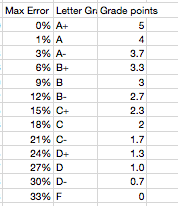
    1.  The scoring of the error is according to the following table:
    1. The results can be seen for all the other analysts as a table here (with data since mid 2008).
  6. Apple as top personal computer vendor

    Research · 131 comments

    "Yes. I think it’s possible if you integrate tablets"

    - Meg Whitman, HP CEO in response to the question of whether Apple could overtake HP in computer sales in 2012.

    via HP CEO Meg Whitman Admits Apple Could Surpass HP in 2012 | MacTrast.

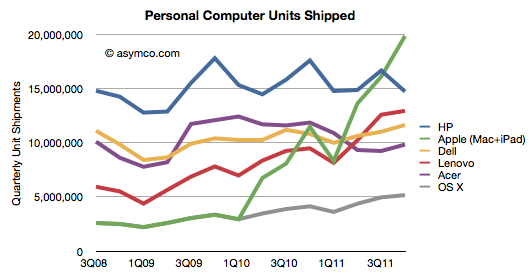
    However, according to Gartner, HP shipped 14.7 million PCs in the last quarter. While we don't have the total global figure for Apple, my estimates are 5.2 million Macs and 14.7 million iPads, for a total of 19.9 million computers in the same period.

    There might be an error in both Gartner's and my numbers, but the gap of over five million in Apple's favor is unlikely to disappear.

    The history of shipments from these vendors  is shown below.

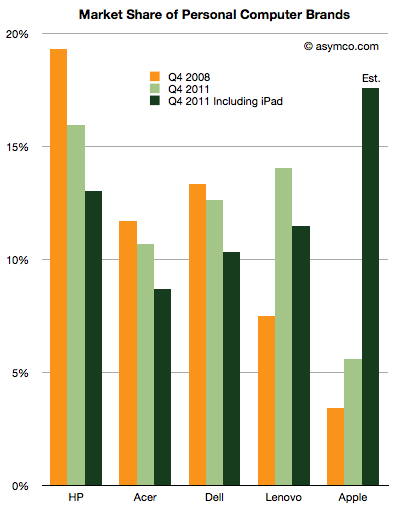
    The market shares are also shown here:

    I included the market shares thee years ago, and the rankings with the iPad excluded.[1] Apple went from 3.42% share at the end of 2008 to 5.6% share today excluding the iPad or 17.6% including the iPad. HP went from 19.3% in 2008 to 16% today or 13% if iPad is included.

    Apple is ahead of schedule on their taking[2] the top spot in terms of units.

    Notes:

    1. Although vendors other than Apple also sell tablets, their totals are unpublished and I am not aware of any estimates so. If anyone has seen estimates I would be happy to amend the data.
    2. Throughout the history of the industry, Apple never held the top spot.   The Apple II peaked at 15.8% in 1984 and the Mac at 12% in 1992.
  7. Is the iPad a PC?

    Research · 127 comments

    Gartner published its estimates for "PC" shipments during the fourth quarter. As I've done in the past, I combined their estimates with known shipments from Apple and separated Apple's performance from the Windows-based market.

    I also take into consideration the iPad as a potential competitor for computing purchases. Apple will report fourth quarter results including Mac and iPad shipments in less than two weeks but I am using my own estimates until then.

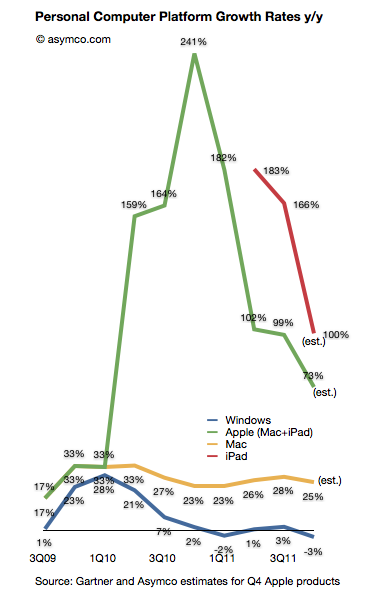
    Here is how the platforms grew over the last few quarters (all figures are global):

    The Gartner data implies a 3% decline in the size of the Windows PC market during the last quarter. This is the fourth quarter of disappointing Windows performance. If you observe the pattern for the Mac vis-a-vis  Windows there is a similarity in the overall cycle but a divergence in terms of growth. The "spread" between Windows and Mac OS X is increasing and has reached an all-time high of 28 points.

    But the more interesting story is that the decline in Windows seems to be coincident with the growth in the iPad. The green (Mac + iPad) shows the effect of the new category while the red line (iPad only) shows that growth in isolation (year-on-year).

    Coincidence?

    Ever since the iPad launched the hypothesis that it has an impact on PC has been hanging in the air. Most analysts (including Gartner) argued that there was no effect from iPad and that the problems with Windows were all due to one-time circumstances. We hear the same about the last quarter with floods in Thailand being blamed.

    However, in the latest quarter Gartner began suggesting that "consumers' attention was diverted toward other product categories, especially smartphones and media tablets."

    One wonders if these "media tablets" are not PCs and yet they negatively affect the purchase of PCs whether they are indeed competing with PCs.

  8. Enter, Prise

    Research · 80 comments

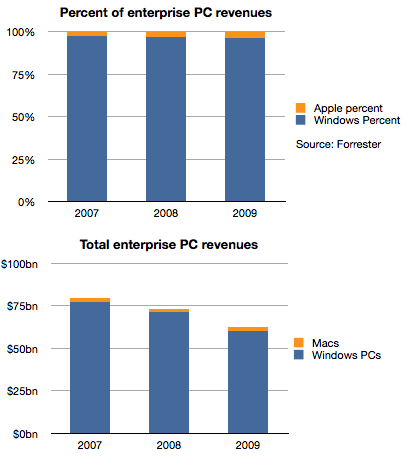
    Historically, Apple's sales to business and government buyers of personal computers have been, in a word, minuscule. To put a number on it, Forrester published data where the estimated value of those sales in 2007 were 2.8%. A figure lower than Apple's overall market share of PCs in that time frame.

    Things did not improve much in the years following. The following chart shows the split between Windows and Mac OS X for the value of enterprise computers sold in 2007 through 2009.

    Apple's share of value went from 2.8% to 3.7%, an increase of 1 point of share, but one which in real terms was not very valuable because the overall market declined due to recession. Revenues for Apple were basically flat at around $2 billion each year as shown in the second chart.

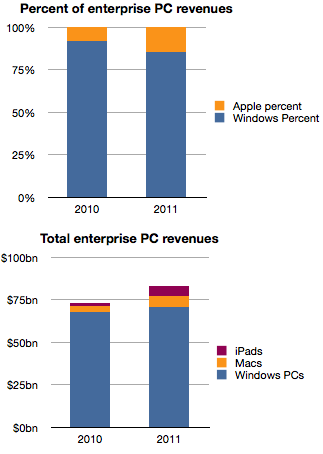
    However, the situation changed very rapidly in the last two years.

    Apple's share of enterprise revenues doubled from 3.7% to 7.8% in 2010 and nearly doubled again to 14.6% last year. A large part of that acceleration was due to the iPad which generated an estimated 6 billion in sales in 2011, triple what Macs were grossing in 2007.

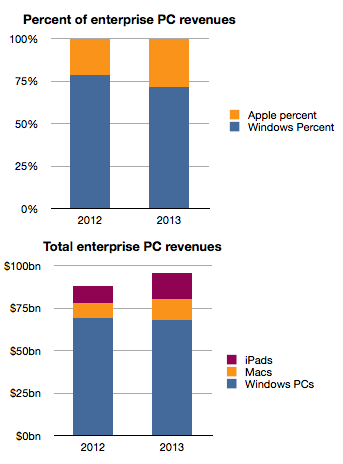
    Forrester goes further and estimates the same data for the next two years.

    The estimate seems to be an extrapolation of the last two years which may or may not happen and we should treat it with caution.

    However, if the pattern emerges as an extension of the near past, Apple's position in the market at nearly 30% share next year would be a sea change. It may challenge for the top spot among all vendors to the sector.

    It's been said many times that "if only Apple put more emphasis" on Enterprise sales, imagine how much more growth they would obtain. However, I believe that this reversal of fortune did not come about from paying more attention but rather from paying less attention to Enterprise.

    Enterprise buyers are demanding customers. They have highly specific requirements and ask vendors to conform to multiple layers of dependencies. As a result, enterprise vendors (led by Microsoft) have done all they could to make their software and hardware conformable to these needs. For decades this was the modus operandi and, due to the early adopter nature of businesses in personal computing, the resulting product was passed on to consumers as the "standard". Consumers accepted it as it was better than having no computers at all.

    The problem is that customers, especially demanding ones, don't realize that a new basis of performance might be more beneficial. Apple and mobile devices in general presented this "low-end" alternative not in response to requirements from business but in response to requirements from consumers who had been much more eager in the last decade to adopt new technologies with fewer strings attached. All the security, conformability and legacy issues of the early business adopters turned them into late adopters as technology shifted.

    So a company focused on an asymmetric market led with new solutions to problems that enterprises did not think they had. Mobility was something few IT managers asked for and was granted begrudgingly to only those "most valuable" who needed it due to cost and security considerations. As Apple willfully ignored these Enterprise needs it, paradoxically, created exactly what they needed.

    It pried entry into the most difficult of markets by not even wanting to enter.

    In thinking about how this market will evolve, I hear about "consumerization" and cost reduction as benefits and justification of this shift. But fundamentally, what is happening is a classic low end disruption. Enterprises increased their demands beyond what the users in those enterprises could absorb. Instead of ultra-secure, locked-down and immobile computing, users were looking for flexibility, agility and mobility. That's what Apple was listening to.

    Apple's best strategy today would be to persist on this trajectory and listen to the under-served consumer rather than the over-served and over-demanding IT manager.

  9. The effect of smartphone growth on share prices

    Research · 17 comments

    Data on Q4 performance is starting to trickle in. Last week Motorola, as part of a profit warning, revealed their Q4 smartphone shipments were 5.3 million. RIM had reported 14.1 million units (quarter ending November). HTC has also warned that their shipments of smartphones (and tablets) totaled 10 million. Samsung provided guidance on overall sales but since they don't report data on smartphone (or phone) sales, the estimates are ranging between 32 and 35 million.

    Many have forecast Apple's performance but there are many other companies which are not easily estimated (Sony Ericsson, LG, Nokia, ZTE, Others.) But rather than dwelling on the specific quarter, we can make some long-range estimates of performance based on the historic data.

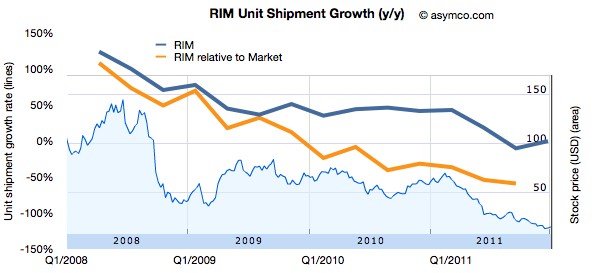
    One method I use is to look at patterns of growth. Growth is the first derivative of market performance and it sometimes shows patterns which the performance itself does not. Consider the following chart showing the growth pattern for RIM.

    The blue line shows the absolute year-on-year quarterly growth based on reported numbers of smartphones shipped. I've also shown the growth "relative to market" which is unit growth with market growth subtracted. This orange line represents how much faster (or slower) the company is growing relative to the market. If the orange line is above zero, the company gained share. If it's below zero, it lost share.

    I also overlaid the performance of the share price (right scale).

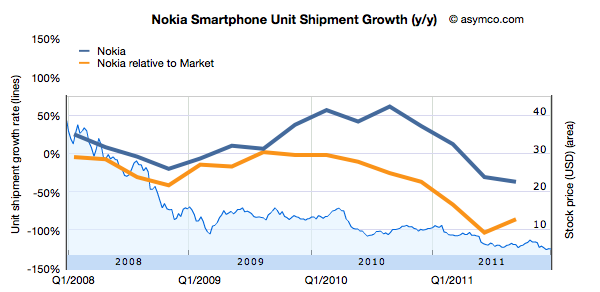
    Now compare that with another long-term incumbent in the smartphone market, Nokia. 

    Bearing in mind that the scales are identical, Nokia's relative performance has been negative since early 2008. Persistent negative smartphone performance relative to market growth causes persistent loss in share price.

    What about other, more recent competitors?

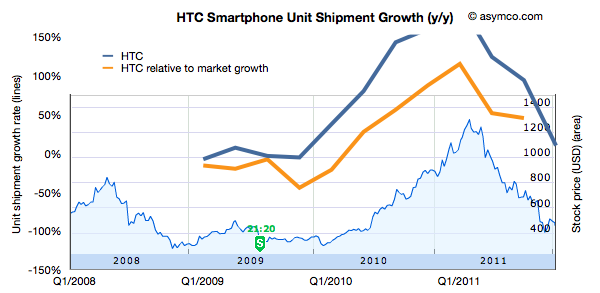
    HTC is not a recent entrant in smartphones, and has gone through a phase of growth with Windows Mobile in the 2000's. This is its pattern of growth (and its share price).

    Keeping the scale for growth consistent with the other companies leads to a bit of clipping but the pattern of rise and fall also seems correlated to share price performance.

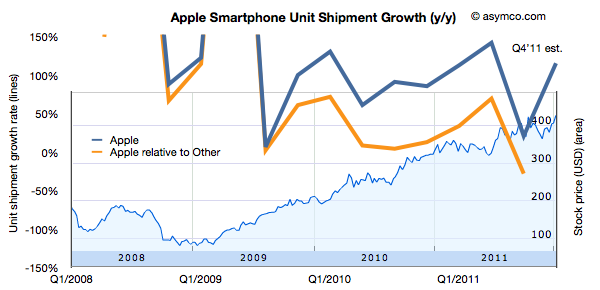
    Finally, the following is the same analysis applied Apple.

    Again, keeping the growth scale consistent leads to some clipping, but the pattern remains observable.

    What seems to be rewarded to various degrees is consistency in growth of smartphones for companies which are primarily engaged in the market. However, failure to grow is punished with severe share price declines.

    Being able to forecast smartphone growth seems to be useful, at least in the time frame of one or two years.

  10. Estimating iPhone sales in the US during Q4

    Research · 56 comments

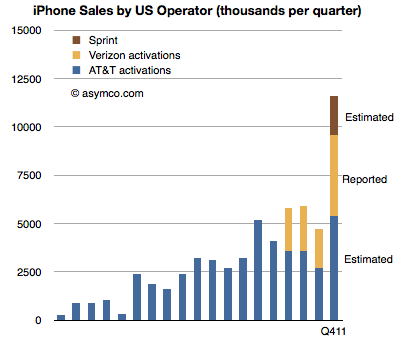
    Verizon has been the first source of data on iPhone sales for Q4. They reported 4.2 million iPhones sold. The first quarter of Verizon iPhone sales had 2.2 million units, followed 2.3 million in Q2 and 2 million in Q3. The total for the calendar year came at 10.7 million.

    The total for AT&T during the first three quarters has been 9.9 million. If we assume the same 2x sequential increase in Q4 relative to Q3 as observed by Verizon we obtain an estimate of 5.4 million iPhone for AT&T.[1]

    The quarter also saw the addition of Sprint to the US iPhone distribution network. Sprint is rumored to have committed to buy 30.5 million iPhones over the next four years. My estimate for the first year was 7 million, placing first quarter sell-in at about 2 million.

    An approximate total for Q4 US iPhone activations results in 11.6 million. The following chart illustrates these estimates:

    Notes:

    1. AT&T reported that smartphone sales during October and November totaled over 6 million units. Assuming only 2 million for December and a 70% iPhone mix yields 5.6 million units.
  11. Apple's commoditization discount

    Research · 81 comments

    When asked where Apple's growth will come from, most analysts or observers will cite new products. As long as there are new products, then there is growth. Conversely, if there are no new products, then there will be no growth. This is such a commonly held belief that it's axiomatic: Apple is being valued based on short-term foreseeable growth.

    To be more precise, analysts value the wave of growth of every new product and heavily discount the post-growth phase assuming commoditization. There is no value assigned to Apple for extending market reach to the mass market.

    Consider: Analysts currently forecast an operating income (or EBIT) of $43.3bn for 2012 and $49.7bn for 2013. That implies growth of 28% in 2012 and 15% in 2013. These growth rates are modest in light of Apple's recent historic growth and especially 84% in 2011 on EBIT level. Much of this growth has been due to iPhone which quickly captured 4% market share in four years. To suggest 15% growth in 2013 is to suggest that Apple will not increase its phone market share by an appreciable amount. The implicit assumption in that growth figure alone is that Apple will remain a niche player.

    Bear in mind that 15% growth is so low as to be half the the growth in the Mac business and below the likely growth in the overall phone market. Considering the risk premium on equities, this growth forecast assumes essentially a no growth scenario. But even with no growth, Apple's cash flows are huge and thus they should add up to some significant present value. Since we know the value as reflected in the current price, we can work backwards to determine the discount rate being applied to those future flows. In other words, we can calculate how risky Apple's existing product cash flows are seen to be.

    Based on  assumptions originating from analysts' consensus, we can construct a simple model that will approximate the discount the stock market puts on Apple's future cash flows. Let's have a look at an adjusted Gordon or dividend discount valuation model on EBIT basis:

    Shares are valued based on the projected future cash flows of a company. Discounting EBIT with Weighted Average Cost of Capital and subtracting growth will yield enterprise value (= market capitalization - cash).

    Applying analysts’ assumption of close to zero growth to Apple's post 2012 EBIT means EBIT stays constant for 2013 and beyond. Let’s solve for the implied capital costs. Right away we can eliminate growth (g) as it equals zero. EBIT reflects operating cash flow since in a zero growth scenario CapEx will equal deprecation and there are no changes in net working capital. As Apple has no debt but a cash surplus, WACC will be equal to cost of equity[1].

    Solving for capital cost (WACC) with available analysts' EBIT estimates reveals a discount rate of 15%.

    But let’s remember that analysts have consistently and by a large margin missed Apple's financial performance. So let’s dial in a more aggressive estimate of around $56bn of EBIT for the fiscal year 2012. The discount rate goes up to 19% and implies an EBIT multiple of 5.3x.

    In other words, Apple's cash flows for a zero growth scenario are being discounted at a rate of 15% to 19%. This places the company in an extremely risky category of investment. It is certainly not something that can be categorized as a value stock.

    The discussions on this blog regarding Apple’s valuation have been insightful, but only danced around the triangle of price, earnings and growth. When the growth forecasts are considered vis-a-vis current pricing, the assumptions built into 'consensus' forecasts for Apple are condemnations of the company.

    They present a view of a company that is extremely vulnerable and can neither preserve its current cash flows nor find new sources of growth. It is, quite plainly, a company doomed to commoditization.

    ---

    Notes:

    1. Or one can even assume that cash has a positive effect lowering costs of equity (less indirect bankruptcy costs).