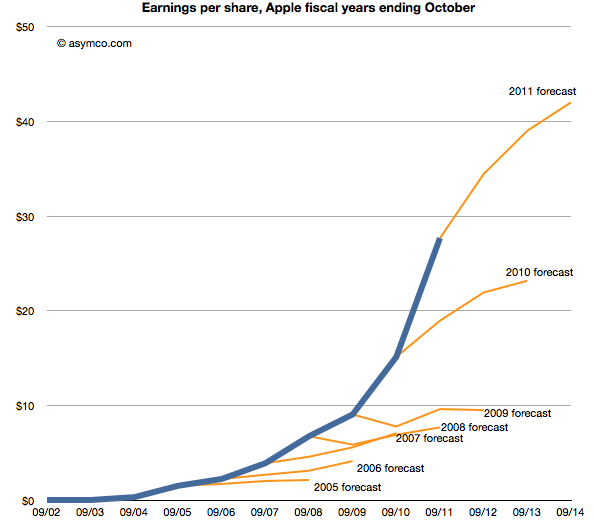
Last week Horace wrote about the apparent "reasonableness" of analyst Apple estimates. He explained how the consensus for Apple's growth was always deeply pessimistic because its performance could be argued to be anomalous. It was just too good to be true. We reproduce the chart here:
The estimates look like characteristic "tell-tales" of a company running strong into the wind.
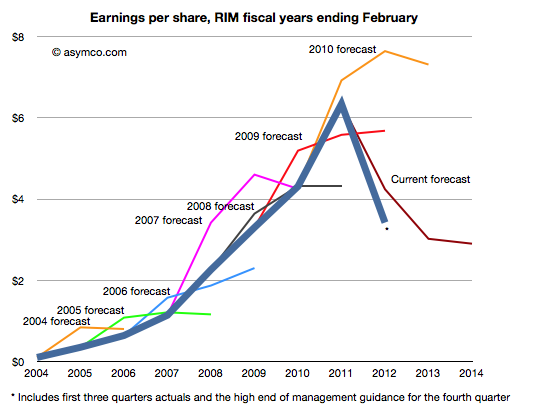
This conservatism in the face of rapid growth sounds "reasonable" but is it always practiced? And what about the ability of this conservative strategy to predict dramatic changes in growth? To test, we started to look at the predictions for RIM. RIM has also enjoyed strong growth over a similar time frame as Apple. How did analysts predict its performance? The following chart was prepared using the same technique as the one for Apple[1].
Surprisingly, the "tell-tales" look very different.[2] For every year we looked at the first year estimates were over-optimistic with a decline expected after one or two years. This pattern is remarkably consistent within the RIM data and remarkably inconsistent when compared to Apple.
It's as if there was nothing in common with the methods used. This is perhaps appropriate, but the "quality" of predictions are not much better. With RIM they were too optimistic in the short term and too pessimistic in the medium term. With Apple they were far too pessimistic consistently.
More worrisome, the 2010 forecast did not offer any hint of the dramatic decline which followed only a few months later. And after three quarters of really bad news, the consensus is still higher than what will likely happen (ensuring an uninterrupted string "misses").
The study of these two companies' forecasts is a study in contrasts. We can say that the forecasting is disturbingly consistently inaccurate but we can also say that there seems to have been a bias of pessimism for Apple and optimism for RIM. We can only guess at the cause, but the consistency of bias points to something institutional.
---
Notes:
The three year forecast consensus (sourced from Bloomberg) was sampled one month following the end of each fiscal year. This should offer the analyst enough time digest the year passed and deeply contemplate the future.
If we may stretch the analogy, these are indicative of an imminent stall.
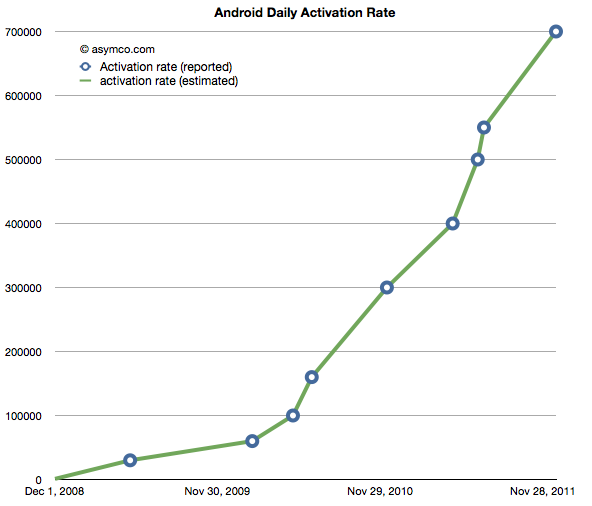
The following chart shows the reported (circled points) and estimated (lines) for Android activations. The resolution of the sampling is every seven days.
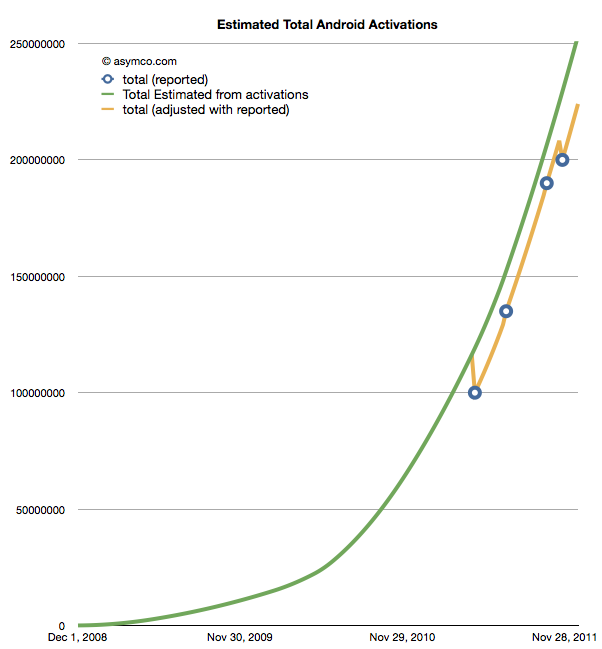
If we take these estimates and then compile a cumulative total of activations we get the green line in the chart below.
The wrinkle in the picture is that Google also occasionally reports cumulative estimates of total Android shipped. They are shown as the blue circles in the chart above. There is some room for error as the cumulative totals may not be reported the same day they happen and the assumptions in the activation rates may not be reflecting occasional slowing.
However that leads to a problem. By adjusting for the reported totals we get the orange line. The trouble with it is that it has these improbable "kinks" where the total is adjusted down, something that is not happening in reality. It's a kludge we need to make estimates fit reality. Normally, this is something we can sweep under the carpet, but with the size of the market, the errors creep up to tens of millions of unitis.
The first downward adjustment would have been 19 million in May. Today, the difference between the green line and the orange is about 25 million.
So the best we can say right now is that there have been between 224 and 253 million Android devices activated to date. Why Google does not report this data regularly and consistently remains a mystery.
Update: The data used in the charts above is available as a Google Docs spreadsheet here.
There are several methods I turn to when estimating device sales.
Top-Down Demand analysis
The first is to look at so-called top-down views of the demand. This method takes a view of the overall phone market and assumes share for smart devices and, further, shares for individual platforms. There are several estimates out there. The most recent is Ericsson's Traffic and Market Data Report, released November 7 2011.
It concludes that in five years' time mobile subscriptions will reach 8.4 billion of which smart devices (incl. tablets) will total 6.2 billion. As iOS has approximately a 250 million install base at end of 2011 and as the total base from Ericsson's estimate for 2011 is 1.44 billion then Apple's share is approximately 17%. If we assume that Apple will be able to increase smart device share to 20% (3 percentage points in five years) then by 2016 Apple will need to have 1.24 billion iOS subscribers.
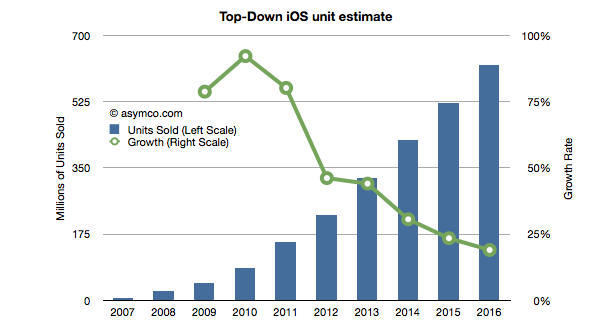
Assuming that half the installed base upgrades every year and Apple adds devices required to reach the install base necessary (1.24b or 20% share) leads to the following unit sales projection (I've added 2008 through 2010 actuals and 2011 estimates based on my own current Q4 projections).
This Approach yields an estimate of 225 million iOS devices to be sold in 2012. Note that the growth is linear which is not usually the case. Typically this growth is in the form of an S-curve which front-loads the volume in the more recent periods.
Production Estimates
The second approach is to look at supply. I use this method for Apple as I consider their devices to be supply constrained and thus look at historic performance to forecast their production ramps. Put another way, I try to answer the question of how quickly Apple can sustain growth in production given their yearly product cycles. I can also use capital expenditures (which the company releases in advance) to forecast device production as the two have been closely correlated in the past.
Using this method I currently estimate 260 million iOS units for 2012.
Customer behavior estimates
The third approach is to attempt to measure customers' loyalties and competitiveness of vendors. If we know the probability of upgrades and the historic split between "new" and "existing" users then we can roll the forecast forward.
To start, we need a probability of upgrade which can be obtained from surveys which measure "loyalty" by asking the intention of sticking with the brand on the next purchase or a measure "satisfaction". iOS product score in the high 80% to 90% range.
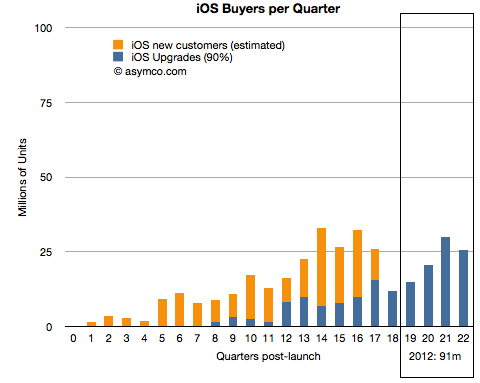
The following chart shows total iOS units sold and the ratio of upgrades (assuming 90% upgrades for 2 year old purchases). It also forecasts upgrades based on current installed base.
If 90% of iOS users upgrade two years after their device purchase then next year will result in 90 million iOS devices sold to existing users.
Given the ratio of new users to upgrades in the past, and if we assume some reduction in that ratio over time, we can obtain a measure of "new users" on top of the upgrades. (In other words we forecast forward the ratio between the dark blue and orange lines above).
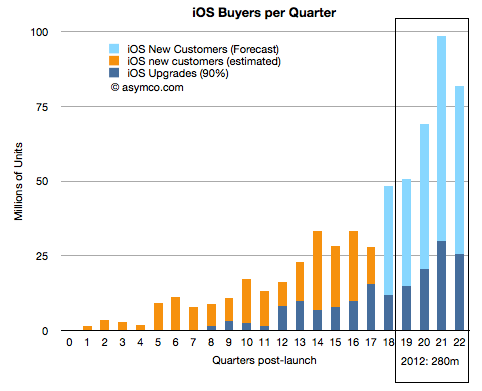
The ratio of new to upgrades has varied significantly from 30x to 0.8x upgrades. I created a schedule where the next quarter will be 2.1x, then 1.44x, 1.36x, 1.28, 1.2x for the quarters of next year. The result is shown below:
This yields a forecast of 280 million iOS devices to be sold in 2012. The forecast is very sensitive to the ratios shown above so obviously this is not going to be very accurate but it's interesting to note that the three methods yield growth rates of 46%, 69% and 82%. All three are far above the growth forecast for Apple (about 25%).
There is finally enough information to try to give an estimate of the smartphone market as a subset of the overall phone market.
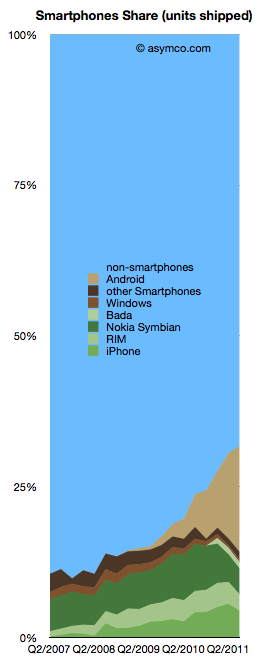
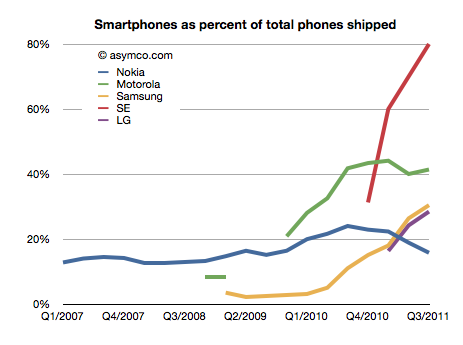
The chart to the left shows the overall picture.
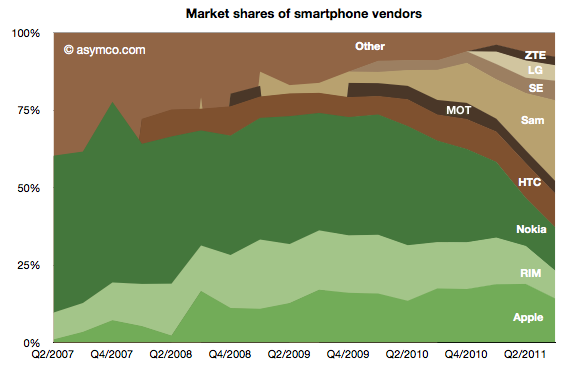
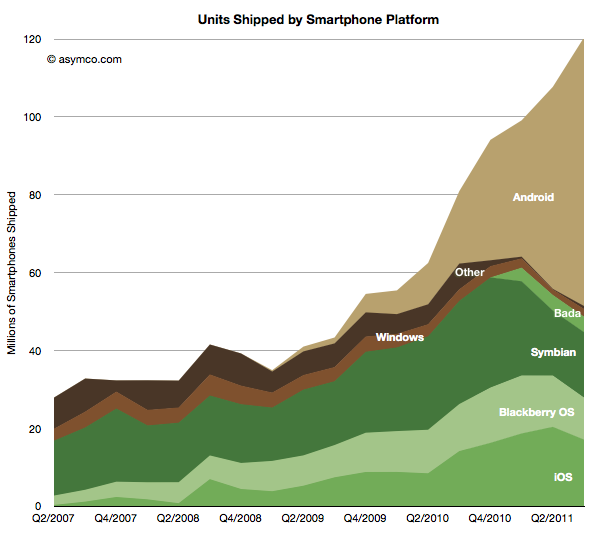
To sum up: The smartphone market has now reached over 30% of shipments. Non-smart devices are at 69% of total. The individual phone platform shares are as follows:
Android (and Android-like): 17.6%
iOS (iPhone only) 4.4%
Nokia Symbian: 4.3%
BlackBerry: 2.76%
Bada: 1%
Windows Phone 0.5%
The past quarter was the first where there is evidence of significant non-seasonal decline in incumbent platforms. Both RIM and Symbian saw two sequential drops in volume. The iPhone had a seasonal (or, more accurately, transitional) decline. Windows Phone had a very modest increase in share from 1.3% to 1.7% share though this is well below a margin of error in the estimate.
Android (and Android-like) shipments ballooned to nearly 70 million but sell-through could be about 10 million less. Nearly one in five phones sold is now powered by an Android variant. A remarkable story since the share was zero less than three years ago
Of the vendors involved, here is the division of share:
Samsung achieved 26% share, nearly swapping share with Nokia over a single year. Nokia reached below 14% while Apple maintained above 14% but down from 19% the quarter prior. HTC overtook RIM with 11% vs. 9%. Sony Ericsson is around 6% and Motorola probably slipped below LG with 4% vs perhaps 5% respectively.
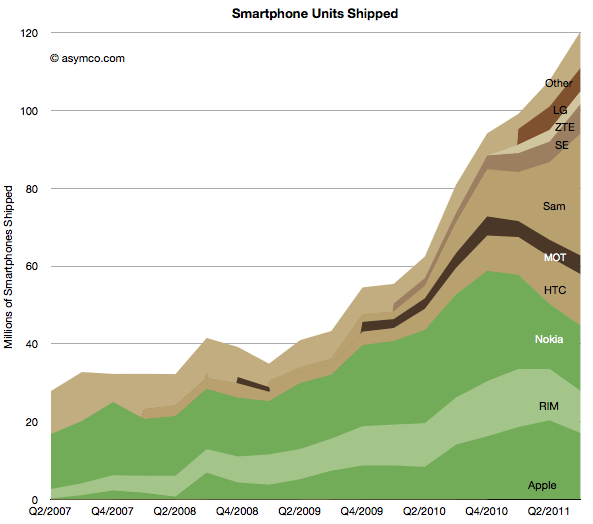
The absolute performance of shipments by vendor and platform follows:
I maintained the historic distinction between integrated (green) and modular (brown) OS strategies to show how the value chain evolved. As Nokia swaps its share to a licensed Windows Phone the share held by integrated vendors is likely to shrink even further.
Does this mean it's the end of integration? Or even more importantly, as I have previously suggested the link, is this the end of innovation in the mobile phone market?
It would appear that with 30% smartphone share, the vast majority of phone vendors are ready to abandon any ambition to obtaining extraordinary profits from mobile devices.[1] Apart from Apple, there seems to be complete capitulation to being manipulated by platform orchestrators with unpredictable or opaque intentions.
The thesis of perpetual innovation rules this out. While new input methods offer a clue that visual interaction and the platforms that depend on it are not permanent, the fact remains that cloud computing and the coupling of additional intelligence that comes with it will enable new points of integration and the positioning of these points on new jobs to be done.
Stay tuned as we discuss the future of mobile computing. The best is yet to come.
Notes:
By extraordinary I mean margins above what a component assembler and distributor would be able to obtain--see the PC industry.
Samsung no longer reports mobile phone shipments. The company's phone market performance reporting is limited to the following:
Shipment : High-20%↑YoY (low-20%↑QoQ)
ASP : Slight increase QoQ
As the company did not report volumes or ASP last quarter either, the QoQ (Quarter on Quarter) growth estimates are almost useless. The only fragment that might be useful is the "High-20% YoY" given that they did publish units for Q3 2010: 71.4 million. This leaves the question of what "High-20%" means. Here are some ranges and what the result would be:
92.1 million assuming 29% YoY growth
91.4 million assuming 28%
90.1 million assuming 27%
The "best guess" might be 91.4 million.
As the company also provides revenue for its mobile division (14.42 trillion Won) we can therefore estimate the average selling price: $142. Is this a slight increase? By a similar approach, last quarter's ASP was $139, and assuming exchange rates did not vary widely, this increase is small enough to be called "slight".
We also have a figure for the operating margin for the entire Telecom group (16.9%) which gives an operating profit of $2.2 billion.
The last piece of the puzzle is the number of smartphones Samsung shipped. Samsung said smartphones grew "more than 300%" year over year. That would imply 31.4 million. One estimate is from Strategy Analytics that suggests 27.8 but it's coupled to an overall volume estimate of 88 million (well below the 91.4 million estimated above). The Wall Street Journal published an estimate of 28 million.
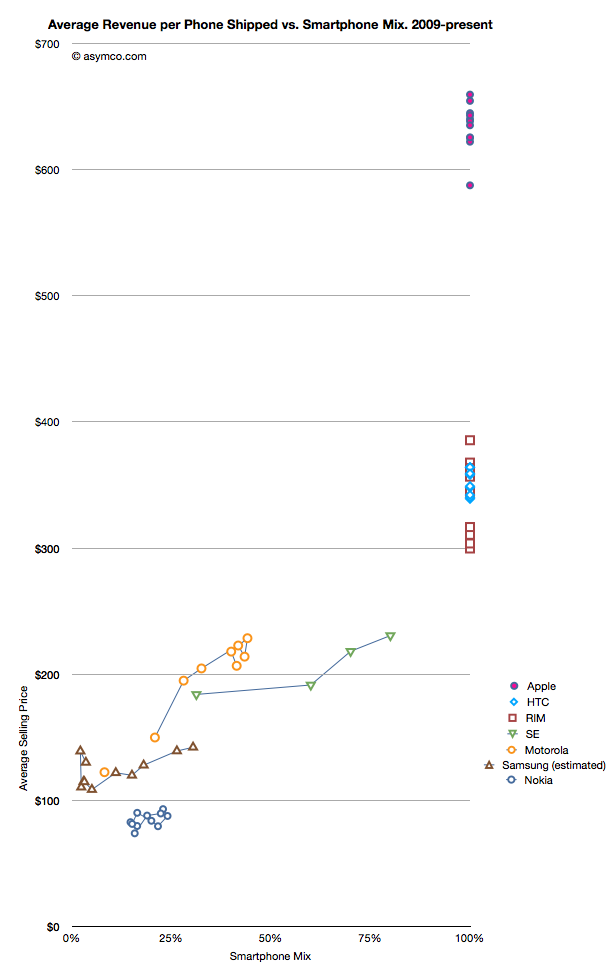
I have no idea how to narrow down this estimate, but if we go with the one that claims the highest precision (27.8 million) we get an estimate of about 30.4% of Samsung's volumes being smartphones (what I call the "smartphone mix"). That is an interesting basis for comparing Samsung's smartphone business to other companies' smartphones. I prepared a graph showing how pricing is affected by the increasing mix of smartphones in vendor portfolios.
What the graph shows is the movement of prices as companies have increased their smartphone mix since Q1 2009. For example Sony Ericsson moved from 31% smartphones to 80% smartphones in about a year. Their ASP increased from $184 to $231. Some companies have not changed their mix. Apple, HTC and RIM have maintained 100% smartphones in their portfolios so their pricing has been consistently high ($650, $354 and $357 over last 12 months, respectively). Conversely, Nokia has struggled with its smartphone portfolio and as a result its pricing has remained stubbornly clustered below $100.
But the most interesting companies to watch are Samsung, Sony Ericsson and Motorola. You can see how their "vectors" or price migration point toward the sweet spot where HTC and RIM reside. Ideally, they would be very much better off with pricing in the $300 range.
Samsung is moving quite rapidly toward the sweet spot but the slope is not as steep as the others. That's may be because SE and Motorola have much smaller volumes but it's still an open question why, with an estimated 30% mix of smartphones, the pricing remains $60 lower than when Motorola was at the same mix or $40 lower than Se.
Some of the answer might be due to the number of "low end" smartphones (Bada?) that Samsung is selling or maybe their non-smartphone pricing is trending down a lot more rapidly.
Keep in mind that if we change the assumption of the number of smartphones to a lower number (i.e. below 27 million) then the trajectory of the Samsung line in the graph would increase and may match more closely the slope of the other two vendors.
I don't have any reason to believe that it's lower than 27 million but I don't have any reason to believe that it's above 27 million either. It's an estimate.
If we believe it then we have to say that with a near tripling of smartphone mix (from 11% to 30.4%), the company grew its overall units by 28% and its revenue by 39% and pricing by 17%. Profits also grew by 130%.
It would follow then that switching to a 100% smartphone mix would make a lot of sense.
Analysts have to count things in order to measure value. It sounds easy but it can be tricky. As I pointed out with PCs vs. iPads, if you count an iPad as a PC you can get into a lot of trouble with your clients. But if you don't you end up directing them away from confronting an existential threat. Only very rarely is a market report published in contradiction to widely held sustaining beliefs. More often than not analysts bow to the source of their paychecks and in so doing show their rear end to the truth.
This comes up again now with respect to how to count tablets. Consider that there is little difference in architecture, software or design between an iPhone and an iPad. They run the same OS, use the same microprocessors and have similar communication methods, inputs and sensors. However they are considered completely different products and counted as part of separate markets. The only physical attribute that differs is the screen size. So we have to conclude that the size of the screen is a huge determinant factor in deciding whether a product is a tablet but not a smartphone (or music player).
But what about tablets themselves? Their screen sizes vary widely. A 10" screen is certainly a tablet device, but a 4" screen certainly isn't. Where is the boundary exactly? It seems that a 7" device is still a tablet but a 5" may not be. The Dell Streak 5 device is presumably not a tablet. The arguments then descend into an arbitrary definition of tablet based on whether it fits in one hand or in a bag of a certain size.
This begins to sound academic. Why should it matter what size is or isn't a valid tablet? Buyers are not in the market for screen sizes. They are in the market for products that can be hired to do jobs or address pain in their lives. So as far as consumers are concerned, these categories are meaningless. If you want to design something you'd better segment according to jobs to be done.
However, buyers are not the target audience for the analyst. Nor are product designers (hopefully anyway.) Part of the reasoning of offering market research is that it presumably helps ecosystem participants (vendors, developers, retailers, etc.) decide where to invest their time and money. They are the target audience. They don't spend their lives reading tech blogs. For them it's important to understand "which way the wind is blowing" and that's where an analyst should be helpful with data.
But then if we are to measure ecosystems, we have more difficulties.
The iOS ecosystem is pretty well understood. Apple publishes the number of devices it sells and the number of apps on its store and downloads, etc. We can assume Microsoft will do the same with Windows 8 as they do already for Windows in general.
For Android, it's a challenge. Google measures activations, but that may not cover the actual units sold. Google admits that it does not know how many Android devices are sold or even how many are for sale. It's in the nature of open source that it's not controlled and hence not measurable.
But analysts still try. Consider the estimate that about 27% of all "tablets" shipped are Android. That's not something Google helped with. Google can report the number of activations of a certain version of the OS, but they themselves don't know what the device looks like or what size screen it has. A device vendor can put any version of Android on a device of any size. To find out how many tablets run Android, you need to try to estimate "bottom up" by adding the output from various vendors.
However, it's clear that a large number of these devices are not exactly Android. Consider what Kevin C. Tofel writes for GigaOm:
I asked Strategy Analytics to clarify both of those points and received the following email response from Neil Mawston, the analyst who wrote the report: ”Yes, the press release refers to shipments, not sales. All sub-versions of Android are included. Yes, the B&N Nook Color tablet is included in the tablet figures.”
So the B&N Nook is counted as an Android tablet and part of the 27% share of Android. But Google itself does not count the B&N Nook as an Android tablet. It's not something that can even use the Android brand. From Google's own documentation:
We define an "Android compatible" device as one that can run any application written by third-party developers using the Android SDK and NDK. We use this as a filter to separate devices that can participate in the Android app ecosystem, and those that cannot. Devices that are properly compatible can seek approval to use the Android trademark. Devices that are not compatible are merely derived from the Android source code and may not use the Android trademark.
In other words, compatibility is a prerequisite to participate in the Android apps ecosystem. Anyone is welcome to use the Android source code, but if the device isn't compatible, it's not considered part of the Android ecosystem.
So to summarize, whereas the Nook is counted as an "Android tablet" it...
cannot be called an Android device without violating the trademark
may or may not compatible with Android Apps
does not include Google Services like Google Maps
cannot license the Android Market client software or brand
is not considered to be a part of the Android ecosystem by Google
All this is also true for the Amazon Kindle Fire and whatever Baidu, Alibaba and other Google competitors will be selling. Furthermore, Google can define compatibility and therefore what "being Android" means arbitrarily and can change that definition at will. It can even withdraw compatibility on the basis of business priorities.
It matters because these devices might end up very popular (see Amazon's reporting of Fire's pre-orders in its quarterly earnings call) and in aggregate could even be the majority of "Android tablets".
The result is that most analysis of the Android ecosystem (and by comparison, all mobile ecosystems) depends on classifying as Android devices those that compete with Google, and indeed, with Android. For the purpose of assessing value, growth and opportunity for third parties such reports fall short.
So what should be done?
The solution is simple: Count as Android devices those that are allowed to be called Android as per Google's own definition. It makes clear that developers can reliably sell their software through the Android Market. It makes clear that those devices are designed to use Google services and it makes clear that those devices are not designed to compete with Google.
Those devices which are using "derived" Android source code and are not compatible (as per Google's definition) and are not allowed to be called Android by their vendor should be called something else. Maybe "Android-like" or "Android derivative" or "Non-Google Android" or just "Other".
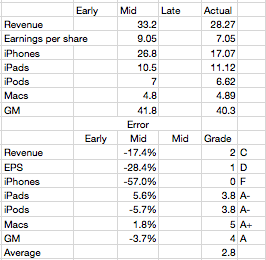
Last quarter I was wrong because I thought Apple would throttle production of the iPhone 4 in the fourth quarter post-launch. "The reason growth would moderate was that Apple slowed production of the old model in order to switch out to the new model--we saw the same thing happen with the slowdown in iPad 1 and transition to iPad 2."
As a result I seriously under-estimated iPhone volumes in the second quarter (FQ3). That failure led me to question whether the theory I was using in forecasting was still valid. When it came time for a new estimate I hesitated.
I had to choose whether to apply the old seasonality theory or to assume that the game had changed and that the product would now grow organically.
The first assumption would put the iPhone growth at 100%+ while the second would place it in the 60% to 80% range. I decided to dial in a figure somewhere in between at 90% but I’m not very confident in this
The result was an over-estimation by almost the same error as that of the previous quarter. Most of the other product lines were accurately predicted, but again, as a always, the whole forecast rides on the iPhone.
So where does that leave the theory?
I now believe that the iPhone behaves far more consistent with the original theory. Namely that...
Overall production capacity is increasing at approximately 100%/yr.
There is significant seasonality due to production ramps as the product is updated on a yearly cycle. These cycles are tuned to reach maximum throughput during the US holiday period. I discussed this theory here.
Demand is practically unlimited and is throttled by both production schedule and distribution agreements
The first point is not controversial. The iPhone continues to grow at triple digits rates. The second quarter's 142% growth and the first quarter's 113% growth more than makes up for the 21% of the third. Fourth quarter promises to be exceptionally strong with management clearly guiding for a blockbuster.
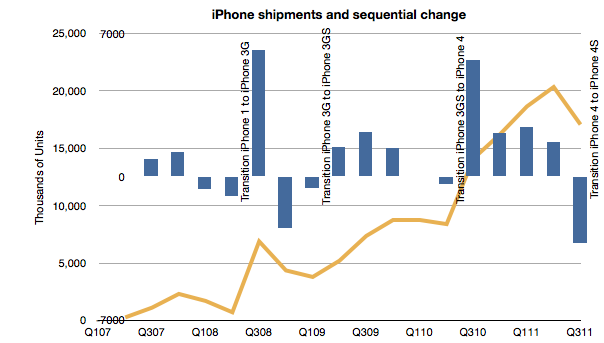
The point of contention was number 2. If we look at the following chart, we can observe that it still holds:
Each new iPhone launch was preceded by a quarter where units went down sequentially. The same has happened with the iPad for the one tradition we've had so far.
Regarding the third point, Balance sheet analysis shows that investment in manufacturing process equipment installation slowed in the March quarter. That was not matched by a decline in the June quarter sell-out however it does correspond with a slowing in the September quarter. Using the PP&E line is something I'm still exploring but it does seem that there is support for the theory.
Mea Culpa
I made an error in abandoning my theory. I thought I had discovered an anomaly that made it invalid. I was wrong. I read too much into the late in cycle boom. I bought into the notion that the product was in a new pattern of behavior--due to expanded channel or broader portfolio. This was a mistake.
Footnote
There was one other bit of data that was offered to us which we ignored. At the 4S launch Tim Cook gave us a warning. He announced that 250 million iOS units had "just been shipped". After the announcement it turns out that the total was around 254 million. This came up in comments on this blog. I noted that if the number is correct I should shave 13 million off my iPhone number. I even went into my model and adjusted it to see the effect. I did not "correct" my estimate as I felt that this new data could be disguised and not meant to signal to us. This was another error.
In the last two posts (How much does an Apple store cost?, The down payment on iCloud) I discussed two line items in the PP&E asset class on Apple's Balance Sheet. In isolation, the data is interesting as it gives us an idea of the cost structure of stores and facilities being developed to sustain its current business model. In aggregate, it provides insight into Apple's strategic intent.
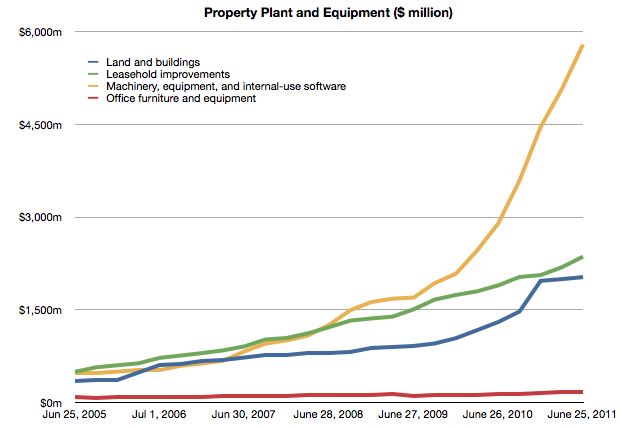
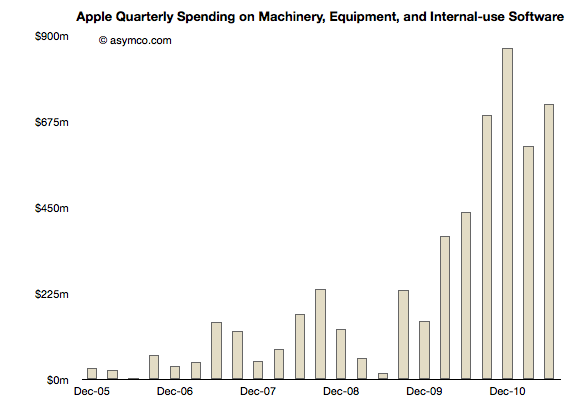
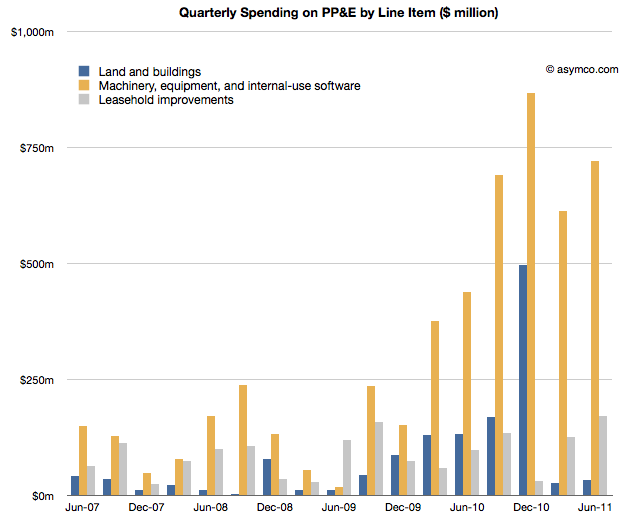
To complete the picture, I will look at the third asset: "Machinery, equipment and internal use software." It's the yellow line in the chart below:
It's plain to see at first glance that it's the most significant asset. What does it represent and what conclusions can we draw about Apple's strategy?
Before I begin, I should make clear what this asset represents and what it does not represent. These expenditures cover equipment used in production. They do not include components used in the production nor loans to suppliers for purchasing equipment. These are fixed assets that can be depreciated on a schedule and have specific tax treatment as a result. These are, in plain language, instruments used for producing things to be sold. They are things Apple owns.[1]
Using the same method as in the other asset analyses I took a measure of the sequential change in that asset over the time period and tried to see if there is a correlation between that spending and some other measure of output from the company.
Here is the sequential change chart since the end of 2005:
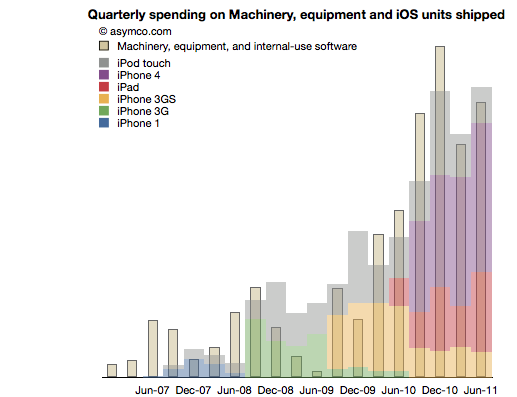
I noted that the pattern seems to relate closely with the increase in shipments of iPhones. More specifically, iOS devices. To test this I overlaid the overall volumes (with estimates of product types) of iOS shipments. This is a modified version of the chart published here.
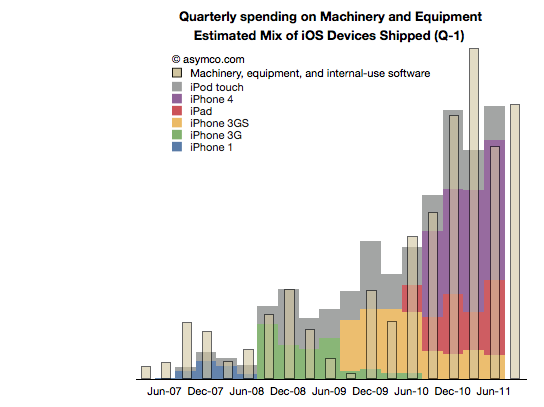
There is a broad similarity. But again, as in the other analyses, the spending on assets typically predates the "output" from that asset. As we saw in land and buildings, the operational start of a facility may happen many quarters after the purchase is made. Similarly, stores open some time after the spending on fitting them out.
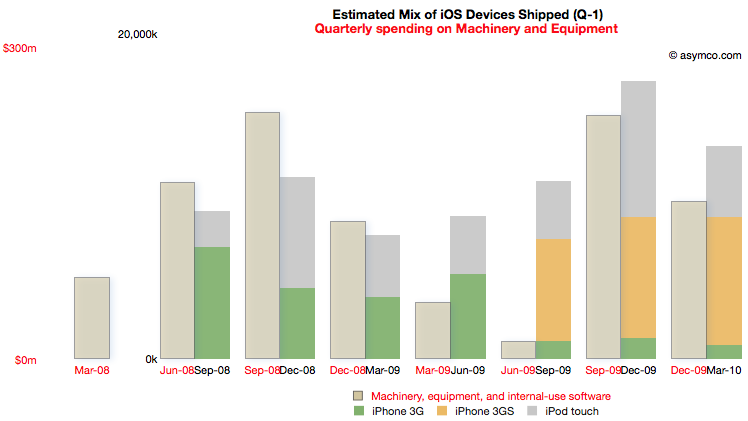
So it is with Machinery and Equipment. If we time-shift the output one quarter to account for spending before production we have a better fit (note the change in the title with "Q-1" indicating that the dates for the iOS shipments are offset by 1 quarter to the left).
We can even take the analysis further by breaking the spending and output into Phases corresponding to specific product cycles and introductions.
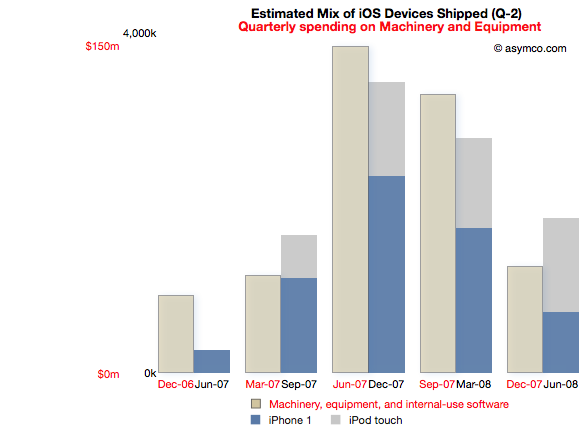
Phase 1: The original iPhone
Spending on M&E prior to the iPhone launch began two quarters in advance of sales. The following chart reflects this delay. Note that the M&E payments are marked with quarters ending six months earlier than the shipment schedule. Note also the scale (red denoting the M&E spending and black the units shipped). I also separated the two product types (iPod touch are my estimates, iPhone numbers are published by Apple).
This Phase corresponds to the first "bump" in the expenditure chart but offers more detail. There is an evident relationship between the "input" expense and the "output" of units shipped.
The cost of Phase I was $408 million.
Phase II: The iPhone 3G series
Phase II covers spending from the quarter ending March '08 to December '09 and production from September '08 to March '10.
For this Phase the time shift is only one quarter but there is a quarter's worth of spending that is initiated prior to any shipments. I chose to demarcate this Phase to cover production for both the 3G and 3GS as they probably shared a lot of common equipment. Some spending on new production lines however still had to happen as volumes increased during 3GS production.
Note the scale change from the first Phase. Whereas the maximum in Phase I spending was around $150 million per quarter, the peak is nearly twice as much in the second Phase. The peak output is 5x higher.
The cost of Phase II was $1 billion.
[I had to guess whether the Sep 09 and Dec 09 M&E spending was for 3GS or whether it was to prepare for the ramps in the new products about to be launched in the third Phase.]
Phase III: The iPhone 4 and the iPad
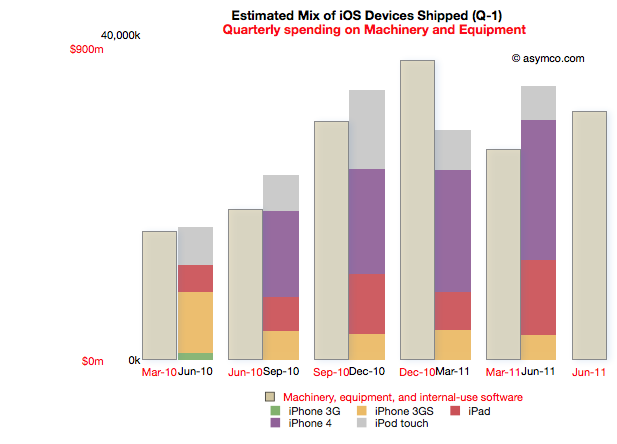
Phase III begins with spending prior to the launch of the iPad 1 (March '10) to the last quarter (ending June 2011). Coupled to this is production starting in quarter ending June '10 and ending in the last quarter.
Note that due to the time offsetting on production, the output from the spending on the quarter just ended will not be known until Apple publishes their shipments for the June quarter (scheduled for October 18th).
The relationship between pre-dated spending and production one quarter later holds quite well. There is a "surplus" of spending in December 2010 but that could be seen as the ramp being prepared for the second iPad.
Phase III cost is $3.7 billion so far.
Note again the change in scale from the previous two Phases. Peak M&E expenditures are around $900 million per quarter while production peaks at around 35 million units. This is a tripling of spending coupled to about a doubling of output.
Observations
The data suggests spending on equipment is correlated with the volume of production of its iOS devices. However, Apple is understood to be a company that outsources its production and does not "own" its own factories. Claiming that it keeps equipment used in the production of iOS devices on its books is an extraordinary claim.
I make a further claim that the scope of spending itself is extraordinary.
The following chart shows the three asset classes discussed in the three latest posts relative to each other (quarterly change in asset value).
In How much does an Apple store cost? I noted that the spending on leasehold improvements of $2 billion over a few years is significant and sustaining and largely asymmetric to competitors. You can see that spending in the grey bars above.
In The down payment on iCloud I noted that spending on Land and Buildings is significant and sustaining to iOS but not on a scale many can match. Those costs are shown in the blue bars above.
If, as I claim here, the yellow bars show the spending on Machinery and Equipment used in the production of iOS devices, then the commitment Apple has made to controlling production is even higher. In December 2010, M&E expenses were 50% higher than the spending on the data center and the new Cupertino campus put together.
The M&E assets have cost a total of $6 billion. The Apple stores have cost $2.3 billion and land and buildings $2 billion. In other words, Apple's machinery and equipment is worth much more than all its buildings and stores put together.
Compared with what Apple spends on other fixed assets, M&E is spectacularly significant.
In the twelve months ended June, Apple will have spent $2.9 billion in M&E to manufacture 118 million iOS devices. To put that in perspective, Nokia, which manufacturers a large (if not majority) of the 340 million phones it sells, expects full year 2011 capital expenditures of $1.1 billion.
Correcting for amortization and depreciation and deducting some spending on Mac M&E, it's very likely that Apple spent twice as much as Nokia on the instruments of production for one third the number of devices.
Conclusions
It may be too early to draw conclusions from this analysis. The claims should be debated and the claims should be tested, but I can suggest some tentative strategic implications.
Last December I wrote that I thought Apple should use its capital to own the means of production for iOS. I reasoned that device supply was its biggest deficiency and that perhaps ownership would allow them to become better at it.
Indeed, Apple has used capital to ensure it has better control over the supply of components and to also perhaps ensure capacity of production of those components.
But this analysis shows that Apple has gone much further toward integrating its value chain. It suggests that a large part of the tooling in its supply chain is owned by Apple. It suggests that those tools are put out of reach of its competitors.
The implications could be profound but given the length of this post, I'll leave that discussion for another day.
---
Notes:
Some of the capital expenditures were also allocated to servers or "information systems hardware, software and enhancements." From the Annual Report 2010: Capital Assets. The Company anticipates utilizing approximately $4.0 billion for capital expenditures during 2011, including approximately $600 million for retail store facilities and approximately $3.4 billion for product tooling and manufacturing process equipment, and corporate facilities and infrastructure, including information systems hardware, software and enhancements.
Last week I proposed that there were two significant markets for the new iPhone: 1) the existing iPhone user base 2) smartphone "non-consumers". Today I want to dig a bit deeper into the first market to get an idea of what it amounts to.
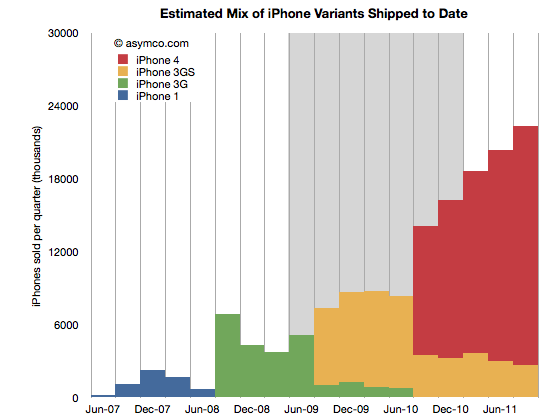
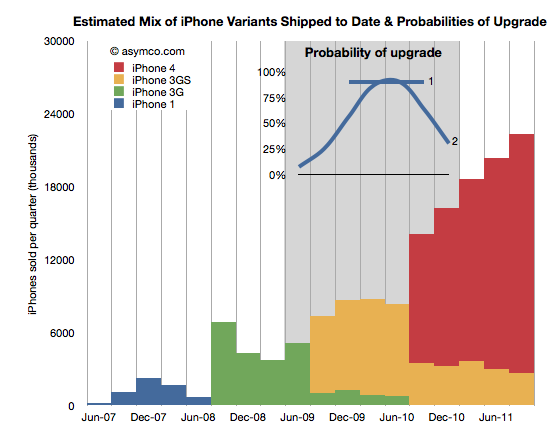
The following chart shows the total iPhone shipments over time with an estimate for the mix of models during the last two years.
The way I calibrated the mix is by taking into account the statement that Tim Cook made that half of all iPhones shipped were iPhone 4. I first estimated that this past quarter (ending September) included about 22.3 million units. That makes the total iPhones to end of Sept 151.3 million. Half would be about 75 million. Therefore the red area needs to add up to that total. The remainder must therefore be the yellow, 3GS volume.
This mix implies that the following shipments by variant (through end of Sept 2011):
iPhone 1: 6.1 million
iPhone 3G: 24.4 million
iPhone 3GS: 45.4 million
iPhone 4: 75.4 million
I also highlighted in grey the most likely target market for upgrades during the next 12 months. What I'm assuming is that recent buyers will not be likely to upgrade but those having purchased an iPhone two years hence will probably be looking to replace it. The naive approach is to assume all the iPhones beyond a certain age will be automatically upgraded. That would give almost 70 million units. However, not all those phones are in use and many of those phones may have already been upgraded to iPhone 4s. 70 million is a theoretical maximum. We have to be more specific.
In order to get a better figure for this I created a probability distribution (PD) which suggests the likelihood that the phones purchased in that quarter get upgraded in the next 12 months. I created two such PDs illustrated in the inset chart below:
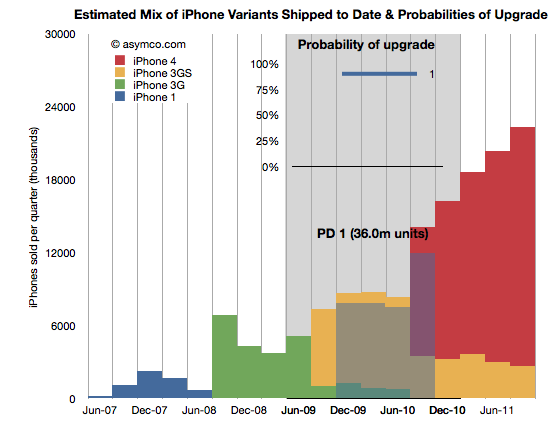
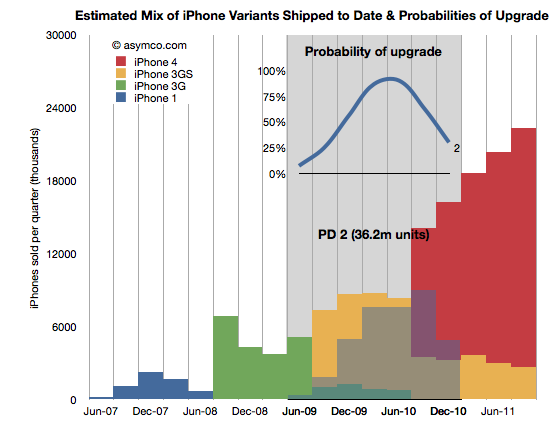
PD 1 is the simplest. It assumes that 90% of two year old iPhones will always be upgraded. PD 2 is a bit more nuanced where it assumes that there is a range of probabilities over a wider period, but with a peak in the 2 year old zone. These PDs are guesses but consider them starting points for debate.
By multiplying the probability in the line chart (PD1) with the area below it (the units it covers) we get get the shaded area indicating which phones (and variant) will be upgraded next year.
The areas not shaded are either left un-upgraded or represent phones which were already upgraded to iPhone 4's last year. The PD1 assumption yields 36 million units.
Doing the same with PD2 yields a different upgrade set shown below:
This assumption leads to about 36.2 million units upgraded in the next 12 months. Very similar to PD1 but approached from a different angle. Are these figures credible? I don't know. The real PD may be quite different but I think these are pretty conservative figures. They are about half of the theoretical maximum.
Why is this Interesting?
This is interesting because of two reasons.
Firstly, it lets us calibrate our forecast for iPhone sales next few quarters. My own estimate stood at 140 million prior to this analysis. Is it reasonable? Remember that the target market includes non-consumption or non-iPhone, non-Smartphone users. Given the "guaranteed" market above at least 36 million, it makes the non-consumption target about 104 million. Does it sound reasonable?[1]
Yes. Primarily because most iPhones sold during the last 12 months were sold to non-consumers. And there were 76 million of them. Apple's distribution has increased since and will continue to increase[2]. That means that Apple does not need to stretch much more than it already has to get the additional growth from un-penetrated markets. We know that this market is still measured in the billions of users. The demand is there.
Secondly, this is interesting from a competitive point of view. When competitors like Microsoft claim that Apple left open an opportunity by not launching a new iPhone "5" they are not looking at the world through the lenses shown above. From their point of view each new phone sold must come from their installed base or non-consumption.
But they don't have any installed bases over 2 years old looking to upgrade. There are few Galaxy users who are yearning to upgrade since they just bought their first units. There are no Windows Phone users (and no Windows Mobile users) who are ready to upgrade to Mango. Since they don't don't see the world through upgrade "lenses" they see their marginal buyer as somebody who might have bought an iPhone 5 because it was the latest and the greatest in terms of specs or novelty.
However they cannot be hopeful that any existing iPhone buyer will switch because they know the satisfaction scores are above 90%. They also know the legendary Apple brand loyalty that keeps Mac and iPad and iPod users glued to their devices. They are also aware of the moats of iTunes, iCloud, hundreds of installed Apps and iMessage all designed to preserve Apple's customer base.
Competitors have none of these things. They don't have upgraders, or switchers to target. They can only target non-consumers. There their odds are better but Apple's are at least as good.
---
Notes:
The 140 million target for next 12 months is probably well above consensus. It assumes a growth rate of 84%. I've seen a few estimates where the growth is forecast at less than 30%. If we are to believe the analysis above, the consensus begins to appear catastrophic.
Apple's distribution measured as number of carriers and countries covered is still about half that of RIM and about a third that of Nokia or Samsung.
I began comparing Microsoft and Apple's financial performance with a review of "top line" or revenues by product lines over a four year period.
This post is about the "bottom line" for the same companies and products.
Before I jump in I would like to make sure there is no confusion about the terms. I will be comparing "operating income"[1] as a measure of "bottom line". This is a common way to compare the profitability of companies because it excludes taxes and interest income. These non-operating expenses/income can distort a comparison of performance because they can be the result of investment activity or changes in tax law or where the company is domiciled. One should not make judgements of comparative performance on those non-operational bases.[2]
Another challenge is that some companies report operating income by division while others don't. We can usually compare overall operating income but usually not on a division or product-level. This is the challenge I will try to overcome in this analysis between two very different operating models.
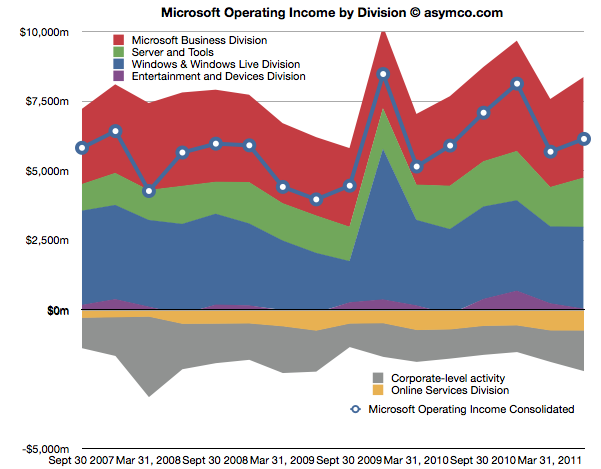
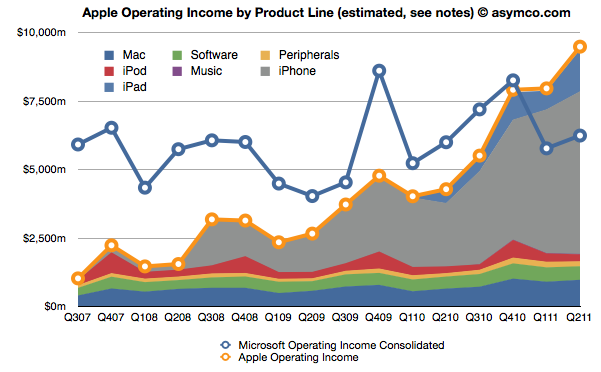
The first chart shows Microsoft's Operating Income by Division as reported by the company.
Each area represents a business division. Note some are showing negative income (losses).I've added a line representing consolidated operating income which is the sum of all areas (including the negatives).
The same line from the chart above is super-imposed on the chart below and is comparable to the orange line that represents the operating income that Apple was able to obtain over the same time frame. Note that both axes are using the same scale.
The Blue and Orange lines are indisputable but the allocation of the areas under the orange line may be open to debate.
As Apple does not report a break-down of each product line or division, getting the areas in the Apple chart is a matter of analysis and estimation. The method I used was to estimate gross margins per product (the overall gross margin is known) and assigning a portion of OPEX (also known) in a ratio equal to the sales level of that product. [3][4]
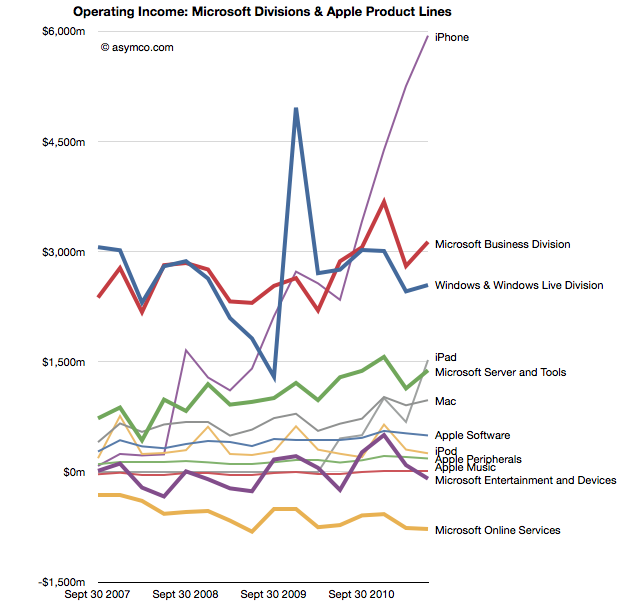
To make the contrast sharper (though more cluttered), I took all operating incomes from all product lines and divisions of both companies and laid them out as time series line charts in the following chart. I allocated Corporate Level Activity as an expense proportionate to each business unit in a ratio proportional to its sales. This allows comparison of product lines individually.
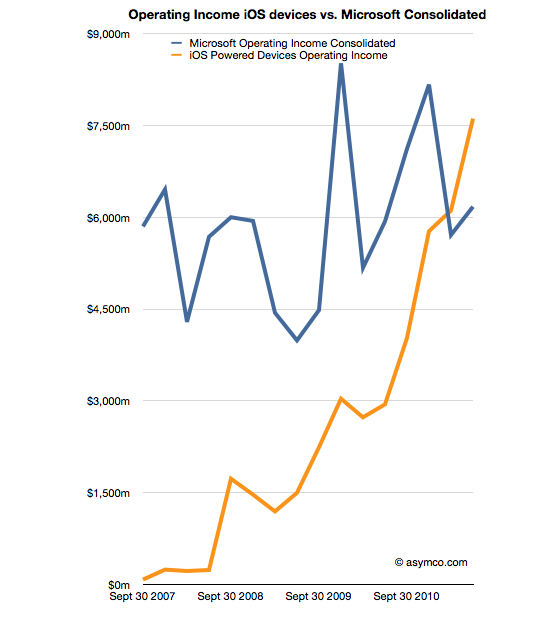
Finally, I combined all the iOS product lines (iPhone, iPad and iPod touch est.) as one line and laid it alongside overall Microsoft Operating Income (consolidated).
The second chart in this post showed that Apple has reached higher operational profitability than Microsoft by the end of last year. This fourth chart shows that iOS products combined are more profitable than Microsoft as a whole.
Microsoft invented the software business and built it to become the world's most valuable business by the year 2000. It's still been growing since and after 35 years it is reaching a profit of $27 billion per year. It did this while maintaining enormous margins and a highly disruptive monopoly business model the likes of which the world had never seen before.
It is scarcely believable then that a device business has been created to overtake it in four years.
On the other hand, one should not use Gross Margins alone. The crucial difference between Gross Margin (Sales Revenue - Cost of Goods Sold or COGS) and Operating Income is that fixed costs are also accounted for. These fixed costs are typically Selling, General and Administrative Expenses and Research and Development Expenses (commonly summarized as Operational Expenses or OPEX) which can be allocated to a particular business or division. For different business models, gross margins can be widely different. In the case of Microsoft for example, software has negligible direct variable costs. A CD or download is of tiny cost compared to the price of the license to use it. As a result software often has 80% gross margins. Hardware on the other hand can have very thin margins in single digits (e.g. PCs). Conversely, Microsoft will have very high fixed costs to pay for developers, product management and sales forces. A hardware vendor may have few engineers and sales could be handled through resellers. Thus Microsoft will have very high OPEX and a PC company will have very low OPEX.
So, for example, In Q2 '11 the iPad had an estimated gross margin of $2.06 billion (which assumed 34% margin on published revenues of $6.06bn). As it also was 21% of total revenues that quarter, I assigned 21% of OPEX to the iPad. That means 21% of $2.54bn or $540 million was the operational expense allocated to the iPad. This results in operational income estimate of $1.52bn for the iPad in Q2.
To summarize, the assumptions this estimate depends on are gross margin estimates and the allocation of OPEX in proportion to sales. Gross margin analysis has been a matter of iteration and peer review for some time and I'm fairly confident in my estimates. The allocation of OPEX is more arbitrary. Chances are that these expenses vary greatly with each quarter where more work is done nearer to launch of a new product and less in late season. If there are better methods available to allocate expenses by product, I'm open to suggestion.
In an Harvard Business Review post Rob Wheeler makes the case for the Kindle Fire as a disruptive innovation. I believe that it is but crucially I disagree that the Kindle Fire is a low end disruption.
My assessment of the Kindle Fire is based on the two attributes which Amazon highlights as the key selling points which offer a basis of differentiation and potential for asymmetric competition: a low price and a new browsing model. I believe that these two attributes result in two opportunities: one for low end disruption and another of new market disruption. I reject the first and tentatively support the second.[1]
The price
It's immediately obvious that the price point of the Kindle Fire is well below alternatives. That forms the basis of disruptive potential, but before we jump to analyzing the disruption hypothesis we should determine whether and to what extent Amazon profits from the device directly. Profitability gives us a clue to where Amazon will apply resources and thus establish its trajectory of improvement.
We know the margin on the Fire is low because we can calculate the bill of materials for 7" tablets. Gene Munster of Piper Jaffray estimates that Amazon "loses" $50 for each unit sold. We also know that the design Amazon used is essentially very similar to the RIM PlayBook and was sourced from the same ODM. RIM priced the product at $499 but has struggled to find buyers and is reluctantly dropping the price. We also can estimate that Apple with a product having more than twice the screen size is keeping modest (~30%) gross margins for at a price point approximately double that of the Fire. It does seem that Amazon does not have much or any margin to dip into.[2]
So the Fire can be classified as a low price product. Does that make it a low end disruption?
Disruption requires asymmetry but it also requires the ability to go up a trajectory of improvement along the basis of performance that a majority of users demand. The first condition is met, but what of the second? In a combined system where one asset is used to leverage another--the subsidized being sacrificed to benefit the profitable--success is conditional on one element being "good enough" while the other "needing improvement". Investment follows accordingly.
But investment decisions have consequences. The subsidized device is starved of investment while the profitable service is nurtured. We see evidence of short cuts in investment in the off-the-shelf nature of Kindle products: from a second-hand (unsanctioned) OS to a second-hand (ex-RIM) hardware. Meanwhile, Amazon spends heavily on capex for the infrastructure that delivers the profitable content.
If the hardware is indeed commoditized and cannot be usefully improved, then this model works. If, on the other hand, the hardware and systems software can benefit from dramatic improvements in technology then the model fails. The very asymmetry of a service vs. a product turns into the latter having all the advantages and the former failing to gain traction.
I'll give three examples of this how service model creates limitations which lead to a failure to disrupt a product model.
The Game Consoles
The first is the game console business. In consoles, the vendors maintain long hardware product life-cycles to recover their hardware investment and subsidy by maximizing the number of games attached to each console. If you plot product cycles you realize that the bigger the subsidy, the longer the hardware lifecycle. The result is a very wide turning circle which prevents innovation in new dimensions.
Consider that the Playstation or the Xbox could have been a low end computing disruption. The original Xbox was in fact a PC. It was supposed to bring PC dynamism to the console business and create a cottage industry of new developers building games on commoditized hardware. However by the second generation the Xbox was a locked down, custom architecture, pure gaming machine. Gone was Intel, gone was the PC architecture and gone was any dream of cheap development.
This is entirely due to the economics of subsidized hardware. It compelled Microsoft, the world's greatest software company, built on the open and cheap PC architecture to make closed, expensive hardware. Sony followed in kind as did Nintendo. Each generation of consoles was a sustaining improvement on gaming and had no ambition beyond gaming[3]. The subsidy and the dependence on an integrated content value network led to a distinct lack of disruption and an insular industry which continues to seek out increasingly immersive experiences for increasingly demanding customers while itself being disrupted by casual, mobile gaming.
The Set-top boxes
The second example is the TV set-top box business. There again, the vendors maintain long hardware cycles in order to recover subsides. There too, the main value driver is the content and its distribution which stipulates the architecture, and through subsidy, defines its evolution. This offers the vendor no motivation to improve the user experience[4], secondary uses or the absorption of new streams of content (like those the internet can offer.)
Again, the set-top box could have been a budding disruptive opportunity for Microsoft. They invested billions in the 1990s to acquire placement of software on set-top boxes in an attempt to penetrate the living room. And again Microsoft was not alone. Since then Tivo, Google and Apple and many others tried to attach cheap hardware to video streams. They all failed to get on a disruptive trajectory. And again, the blame can be placed on the stifling effect of subsidies and dependencies on services or content which dictate where the value and hence the investments should go.
The Blackberry
The third example is the RIM Blackberry. Although RIM made most of its money on hardware and was by no means subsidizing it, the differentiation of their product was undoubtedly its service value. Both as a corporate device with BES and as a consumer device with BBS, customers "hired" the product as a service. By being committed to this model RIM management became blind to the hardware and client OS software innovations coming down the pike.
Through their own admission, they could not accept a touch screen because it would make the messaging experience too slow and it is messaging that sells Blackberries. They could not accept apps (and hence platform orchestration) as a differentiation because their customers did not hire Blackberries for "lifestyle apps". Merely being differentiated as a service leads to blindness and enough hesitation that you run off the disruptive rails.
People ascribe myopia or incredible absence of mind to RIM's management but the opposite is true. They were deeply committed and observant of the things which made the Blackberry successful. It just happened to be something that stopped being relevant.
The iPhone
I'll add one more "bonus" example on this. The iPhone is also a subsidized product and it seems very successful. How come it won? The answer is in details. As I mentioned, the other products ended up in poor life cycles or incorrect motivations. The iPhone differs in that the lifecycle of the product is much shorter (2 years ownership with 1 year for product updates). The shorter lifecycle works for the iPhone because it has a very high service revenue base to dip into to offset the subsidy. Something none of the content models above could count on.
Consider that each game console subsidy needs to paid off by a handful of game titles whose royalties to the console maker are modest. Or that the TV box needs to ride on top a service that also has thin margins from a stable or slightly shrinking user base. In contrast, the iPhone enables vast new consumption worth thousands of dollars to the operator. This is the famous ARPU uplift that smart phones enable. Users are doubling their telecom spending when they move to smartphones.
The margins for Kindle content are thin. Very thin. Apple runs its content business at break even though it transacts billions of items per month. The amount of content that needs to pass through the Kindle ecosystem (with lower prices than Apple charges) will need to be astronomical to make it profitable on the shortened cycle time the iPhone enjoys. Thus the Kindle is likely to languish in a leisurely update cycle with users encouraged to hang on to their devices for years. This is the case at least with the original e-Ink Kindles. How eagerly awaited are new generations? How many users stampede to update the hardware or even upgrade the software? How many users have owned every version of the Kindle?
Service Scale
Finally one last point about services. As Amazon asserts, they see Kindle as a service, which, I concede, is asymmetric to a product business. The problem is that services don't scale as well as products. Consider that none of the content streams that Amazon will depend on are available outside the US. The Kindle has not been a strong seller internationally. This is because book rights are limited to national boundaries as are movie rights and song rights. Apple has only this week finally completed the rollout of iTunes music to all of Europe! A process that took almost a decade. And they are still unable to sell music in most of Asia and forget about movies or TV shows.[5]
The reality is that there are no global service brands. Not in telecommunications (operators are, at best, regional), not in Media (TV, radio, publishing are a local businesses), not in Banking (not even in commercial banking) and not in Retail (even Wal-Mart was humbled trying to export its disruption). The internet has not broken down any of these boundaries and even Amazon has modest reach outside the US for any of their franchises. Services are local but products can be global.[6]
To wrap up, this discussion on the asymmetry of device-based services to product models leads me to conclude that the Fire will not have the opportunity to disrupt the iPad or tablets in general. Amazon sees the hardware and software of a device as a commodity and the content and its distribution as valuable. This assumes that the device is "good enough" and will not require deep re-architecting or that new input methods can be easily absorbed. In short, they see the tablet as at the end of its evolutionary path. Apple sees the exact opposite. The iPad is 18 months old, and as they say in the ads, they see it as only the beginning.
---
Notes:
Due to length of discussion, in this post I will make the case against the low end disruptive potential and use a second post to make the case for it being a new market disruption.
Presumably, Amazon will also distribute only through Amazon.com and thus not incur channel mark-ups. This means that comparisons with other tablets should be at a price nearer to 70% of retail.
Gaming networks and video streaming are extensions but neither leveraged open architectures.
Apps are another story. Because it controls the medium, Apple can and does sell apps in every country where the iPhone or iPad or iPod touch is available.
Note also that because of distribution through Amazon.com, the Kindle cannot reach as many buyers as a tablet selling through the tens of thousands of points of purchase that operators and retail shops offer.