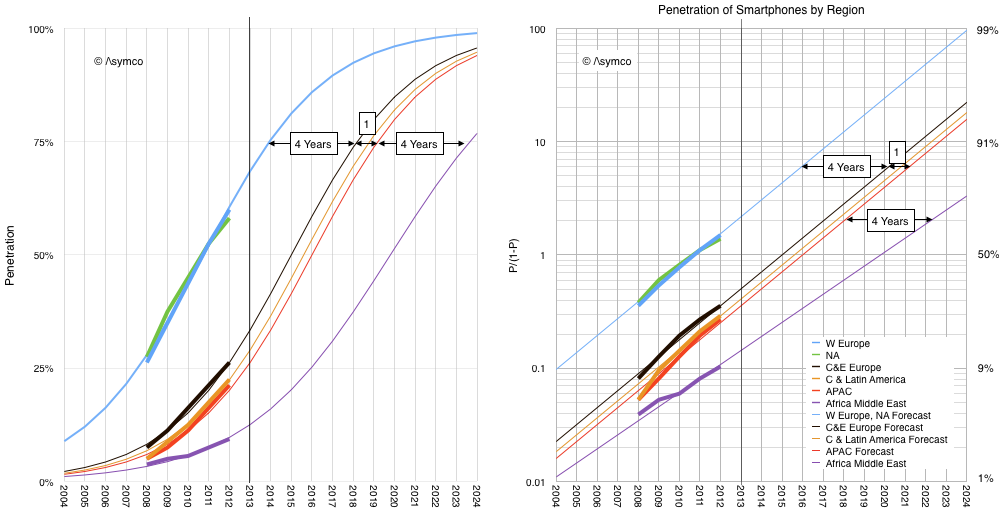
GSMA Intelligence reports provide valuable statistics on the growth of mobile networks. One in particular shows the history of regional smartphone penetration.
I took the historic data and plotted it as follows:
If we believe that smartphones in parts other than US and Europe will behave the same way as all the other technologies listed above then the forecast penetration is likely to follow the thin lines in the graphs above. ((This is a big if, and, judging by their forecast, one which the GSMA Intelligence team seems not to believe will happen.))
With the exception of Africa and Middle East, note that the primary difference between regions is not the rate of growth in penetration but rather the delay in adoption. I marked this delay as 4 years between US/EU and Central & Eastern Europe. An additional one year delay to Asia Pacific region and 4 years more to Africa/Middle East adoption.
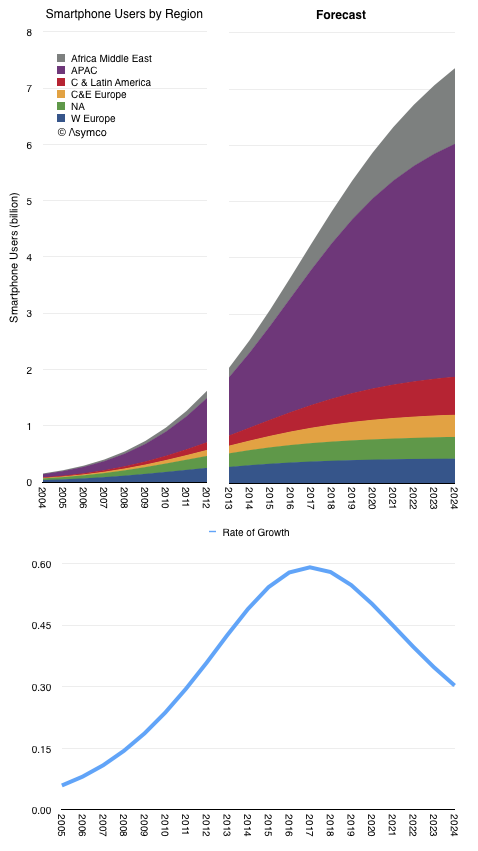
The resulting smartphone user forecast is shown below.
Although 2013 was often cited as the year when smartphones saturated ("everybody that wants one has one"), the total population of users will likely take another decade to reach maximum. The point of inflection in global growth could be expected in 2017.
What most observers sensed was the point of inflection in growth in North America and Western Europe. Those regions are 11% of the world's population.
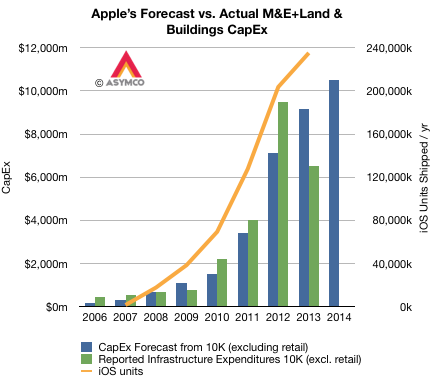
Apple's capital expenditures for product tooling, manufacturing process equipment, corporate facilities and infrastructure has followed very closely their production of iOS devices. The pattern is shown in the graph below.
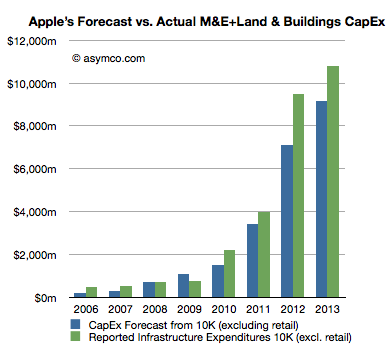
Note that although reported expenditures did not match forecasts for 2012 and 2013, the differences nearly cancel each other. ((I suspect that the difference might be caused by a payment being brought forward in 2012.)) The company's forecast for fiscal 2014 is shown as well.
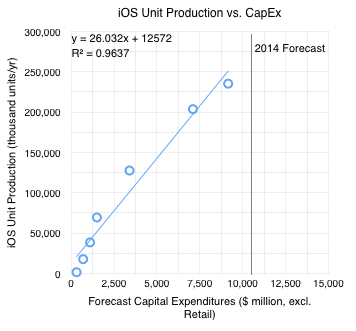
The orange line shows iOS unit production ((Technically, shipments)) with the scale on the right-side axis. Note the correlation with forecasts on CapEx. The relationship can be seen more clearly in the following scatter plot.
I added the 2014 Forecast ($10.5 billion from the latest 10-K filing). If the relationship holds into next year then the iOS unit shipments should be between 250 million and 285 million. ((The equation for the trend line shown suggests 285,908,000 units)).
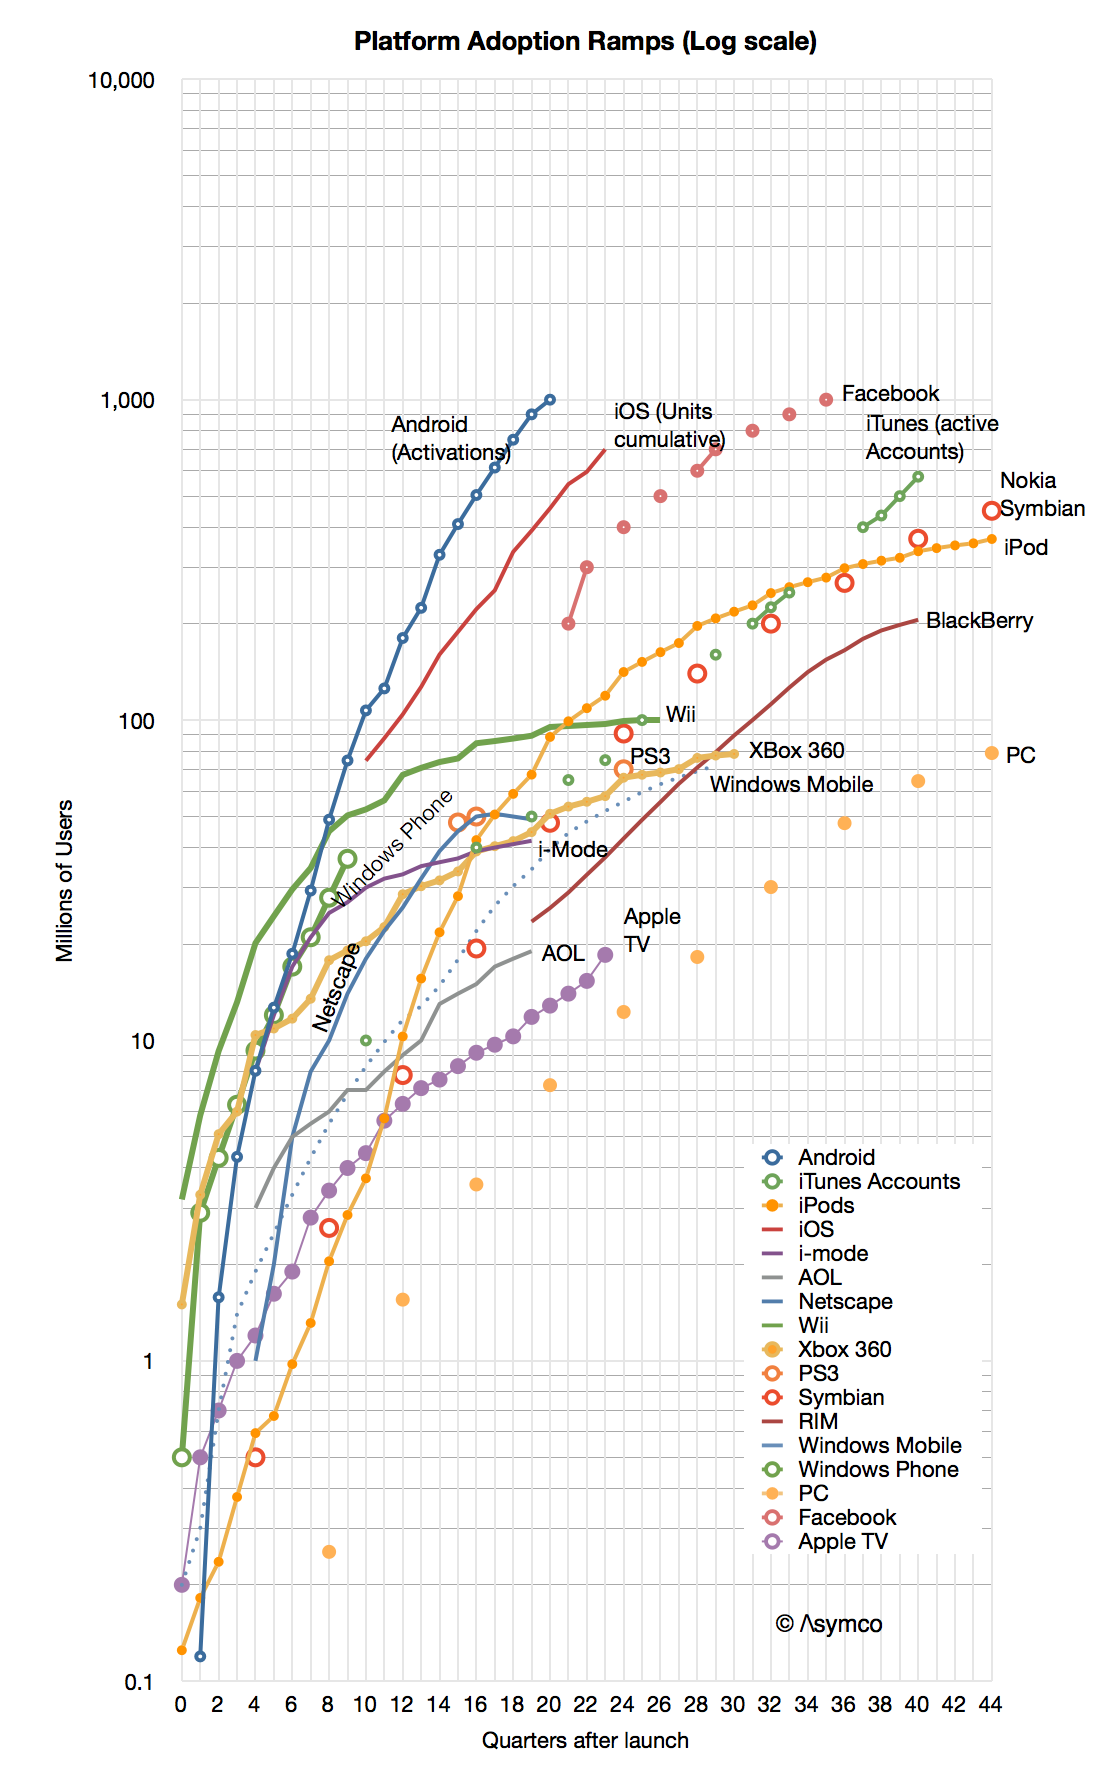
When looking at the Race to a Billion data I noticed that some platform adoption ramps look quite different from others. It's not just a matter of "slope" or rate of growth but a distinctly different shape.
If you look at the graph below you might see the difference yourself.
First, note that the graph is logarithmic. A straight line on a log chart implies exponential growth (the y values are a constant to the power of the x value). However, none of the graphs show straight lines. None of the platforms follow exponential growth ((Except perhaps in the very early periods)).
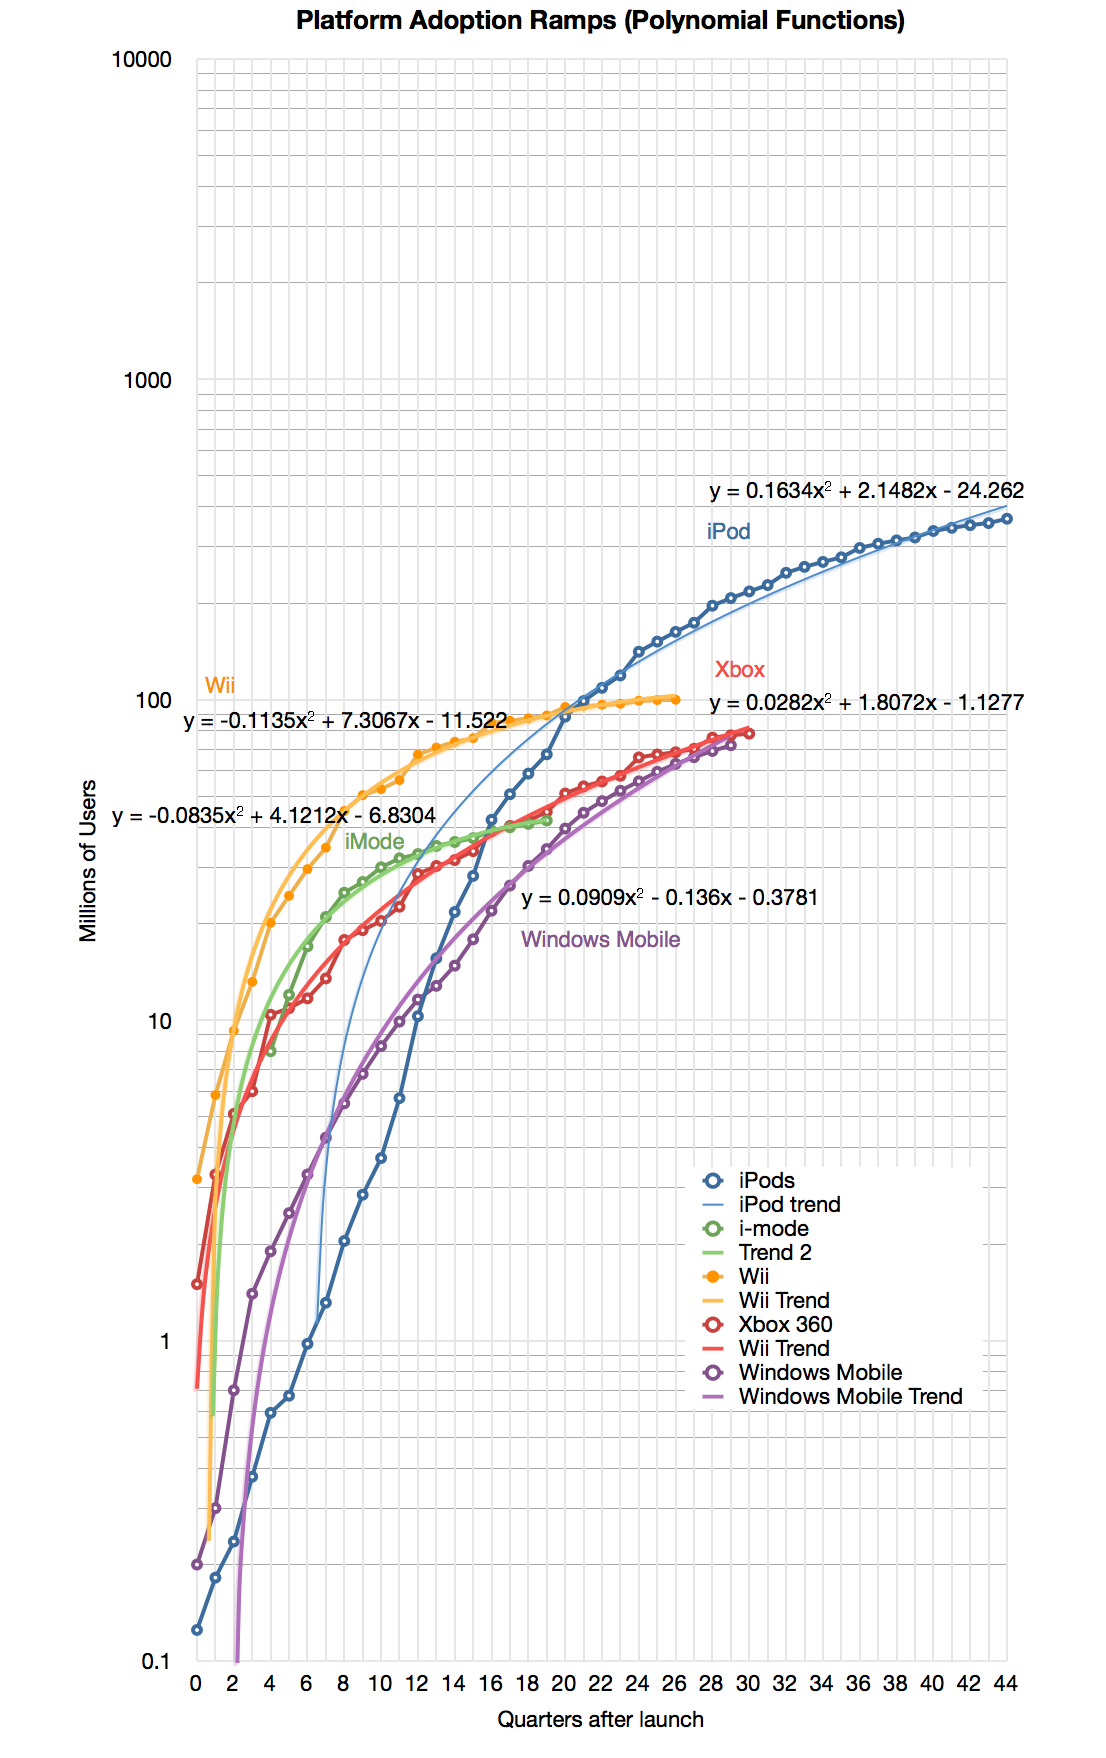
Second, we can eliminate linear or logarithmic functions. They simply do not fit.
That leaves: polynomial or power. It's easy to test these alternatives for all the functions and it becomes clear that most of the platforms split into one of these two classes.
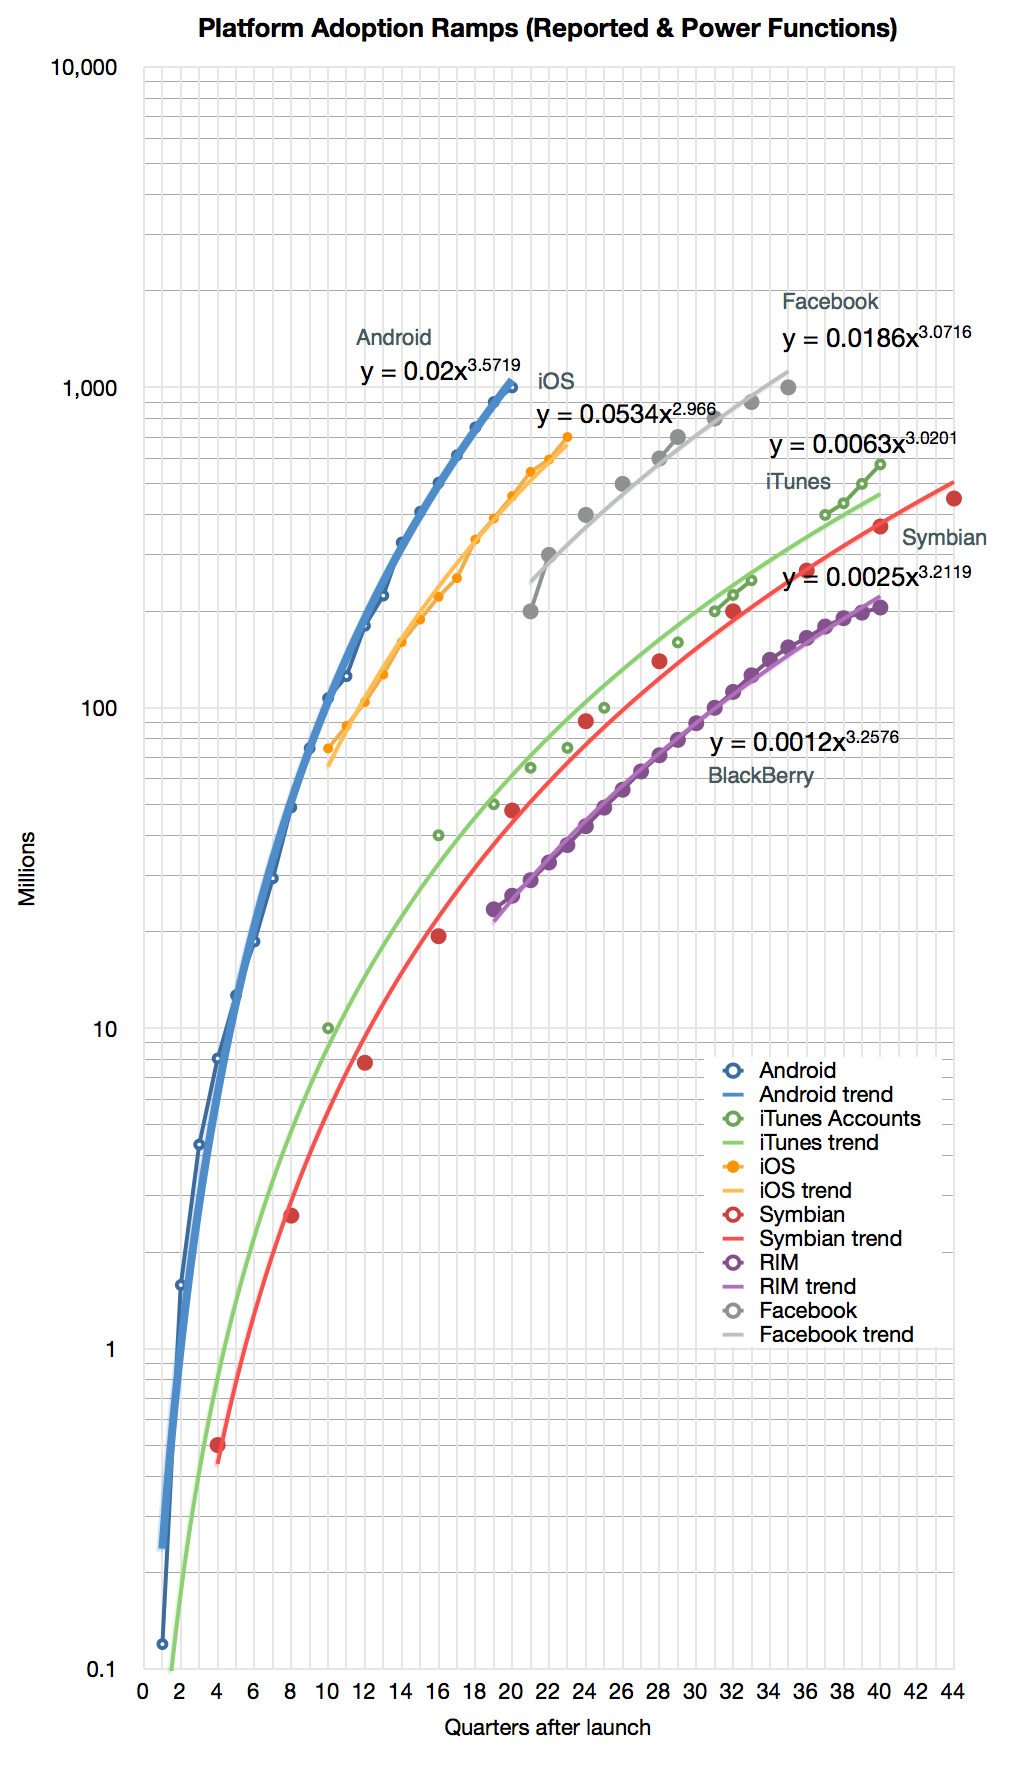
Here are the classes ((Some of the platforms had to be dropped because there was no easy fit. My observation is that some of these platforms went through some crisis or change in strategy during their history which caused the pattern of growth to change)):
Note that I added the formulas for the selected platforms.
I named these classes after their function types: "Power platforms" or "Second Order platforms" ((Note that all Polynomial functions found above are second order)).
This classification has two benefits:
It allows a clearer distinction in scope. Both may exhibit signs of network effects, but Power platforms seem to exhibit "global" or unlimited reach while Second Order platforms may have a strong upper bound on reach.
It allows more reliable forecasting. If a platform classifies as Power, the forecast could be created with fewer data points.
It allows us to guess at the causes of entry into each class for any potential platform challenger.
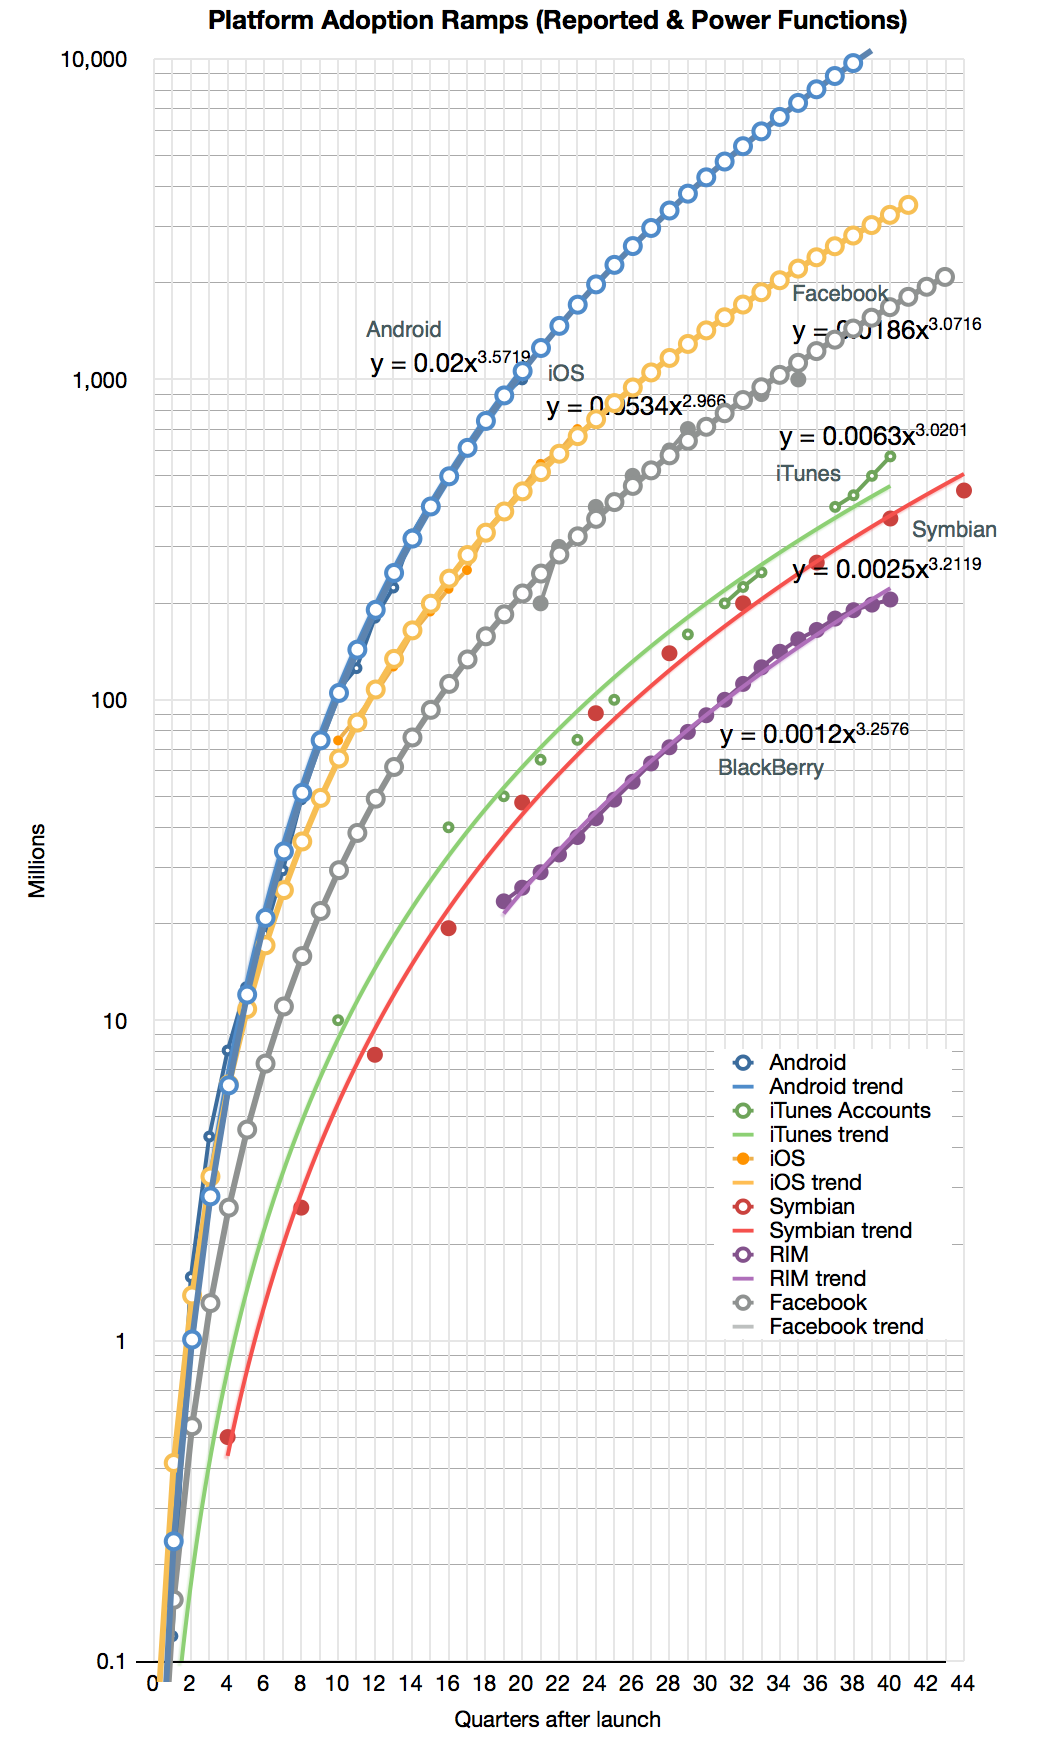
To illustrate the second benefit, I took the Android, iOS and Facebook power functions and modeled (i.e. extrapolated) them for a few quarters into the future. The result is shown below:
The forecast shows the following:
Android will reach 10 billion activations 10 years after its release (mid 2018)
iOS will reach 1 billion units sold by end of next year and 3 billion units by its 10th anniversary in 2017.
Facebook will reach 2 billion users by 2015 after the end of its 10th year.
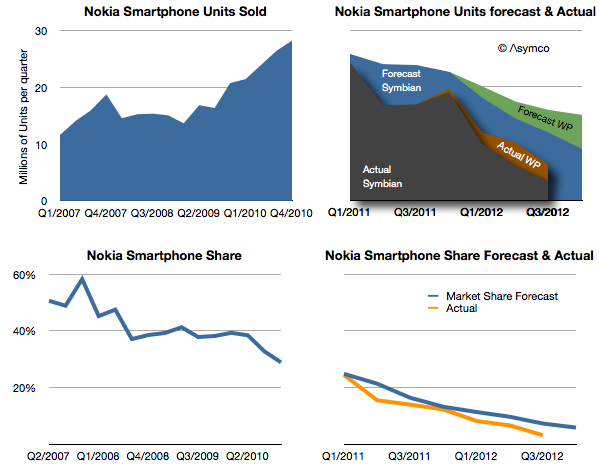
Nokia announced 4.4 million Lumia smartphones were shipped in Q4. That's about 14 million since the Lumia line was launched a year earlier. It isn't however nearly enough to replace the lost sales from Symbian. One year earlier Nokia shipped 19 million Symbian phones in the fourth quarter and the year before 28.3 million. The history of smartphone sales from Nokia is shown below:
I repeated the forecast I drew up in February 2011 when the platform switch was announced. That forecast was based on the company stating that 150 million Symbian phones would still be shipped. Symbian fell far more rapidly than I (and Nokia) expected and to date only 98 million have shipped. The last quarter's 2.2 million seems to be so low that it will be hard to imagine the platform lasting more than a few quarters.
My forecast for Windows Phone was 15 million (through Q4/2012) and the 14 million actually shipped is not far off. However, note that the sequential growth into the fourth quarter was lower than the same period last year. For the holiday quarter Nokia received almost no boost. If there is reason to be optimistic it's that there wasn't a decline in overall smartphones into Q4.
The overall result is that Nokia remains in an operating loss status and it's going to be very hard to recover. No phone vendor has successfully recovered to date. The company managed to book a €50 million one-time payment for IP rights (presumably from RIM) and is sustained by royalties and platform support payments from Microsoft. But even so it's barely breaking even.
The prospects for Windows Phone may be improving however. Operators in the US continue to talk about it. We don't have a split for AT&T's push this past quarter and estimates suggest that 80% of smartphone from AT&T were still iPhones but Verizon will also push the platform and there are suggestions it's doing well in Germany. HTC has also launched some WP flagship phones and may have had a good December as a result.
That translates into steady progress. But the growth of Android and iOS continue as well. Windows Phone needs to continue to persevere in adverse conditions for years to come. The Finns know a thing or two about that.
I've postponed my estimates for the fourth calendar for a long time. The reason is that there have been conflicting data to deal with and I've been hoping for some clues to give clarity. Unfortunately, even though I waited, I have not received many clues. Here are the challenges we have to deal with in this quarter:
Management gave very low guidance for the quarter's earnings and sales. Normally this should not be a concern since the long-term pattern has been for them to "sandbag" significantly. For example last year's fourth quarter was guided at $9.3 EPS while the company delivered $13.87, a 49% "beat" to their guidance. However Q2 and Q3 beats were only 7% and 13% respectively and if we assume a similar number (10%) for Q4 we get about $13/share which would be a year-on-year decline in earnings (down from $13.9). This has not happened for many, many years. Management explained this through a lengthy set of reasons including a shorter quarter (13 weeks vs. 14 weeks), new product launches, currency fluctuations, deferrals and unfavorable component pricing. Then again, similar explanations were used in the past with no reflection in what actually happened.
Management also launched a large number of new products. This normally leads to a surge in sales. In fact, 80% of revenues would come from a new portfolio of products. Having such a broad launch quarter into a holiday, would normally imply huge growth. Not only is this a critical launch quarter for many products but they also rolled out the iPhone to more markets more quickly than ever: 100 countries in three months. The broad roll-out implies a steeper ramp in production and thus more volumes. This would also contradict the lowered expectations from the CFO. However...
Production was constrained. It was quite a long time before waiting times decreased for the iPhone--longer than what we saw last year. In the earnings call Tim Cook said "It's difficult to predict when supply and demand will balance, but I'm feeling very confident on our ability to supply quite a few iPhones". This again implies significant acceleration but did they achieve the targets? He did also announce that they met their target of 100 countries during the quarter but it's not clear if this was as quickly met as they would have liked.
Margins are complicated. Launch quarters have lower margins typically and this is well understood. However, we have new products in the form of a new iPad at a new price point as well as the new iPhone which may have had some difficult manufacturing issues (i.e. yield). So how much faith do we put in the perennial pessimism in guidance?
There was a vast increase in CapEx in the prior quarter. Normally CapEx spending "leads" production and is in proportion to it. However, the surge in Q2 and Q3 seemed to be unmatched by vast new production, at least that's what we are led to believe by both consensus and by management guidance. Did this CapEx differ in character from previous CapEx? Was it more "strategic" and less "tactical"? Will the disconnect continue?
There are also the deeper questions:
Why there are no new operators being signed? The addressable market has not increased in the last 6 months. Why?
Is there a faster product cycle in the works? Is there a shifting of gears to a new product development process?
What's the nature of the relationship with Samsung as a supplier? Is their replacement characterizing the new type of CapEx spending?
All these currents make this quarter doubly difficult to forecast. And it does not help that it comes on the back of two weak quarters which were argued away as exhibiting transition effects.
So I'm very uncomfortable with my forecast and find it hard to defend this quarter. I considered not publishing one at all because it gives too much confidence when none is warranted. However, I received so many requests to publish that I relent and offer the following:
iPhone units: 55.5 million (50%/62%)
Macs: 5.0 million (-4%/+3%)
iPads: 24.4 million (58%/70%)
iPods: 11.2 million (-27%/-22%)
Music (incl. app) rev. growth: 25%/38%
Peripherals rev. growth: 10%/19%
Software rev. growth: 5.5%/14%
Total revenues: $60.0 billion (30%)
GM: 39.8%
EPS: $15.74 (13%)
I included two growth figures (in parentheses). The first is a straight y/y value and the second is adjusted by assuming there were 13 weeks last year (and that sales were evenly distributed over those weeks).
[We'll get a chance to go over this forecast and what is actually reported at Asymconf. Don't forget to sign up.]
The latest yearly report from Apple includes, as it has in the past, the forecast of Capital Expenditures. I've been tracking this data as an indicator of both strategic intent and potential forecasting tool for iOS device production.
Before exploring Apple's own forecast, we should look at how they met expectations for fiscal 2012.
In October 2011 the company forecast was as follows:
The Company anticipates utilizing approximately $8.0 billion for capital expenditures during 2012, including approximately $900 million for retail store facilities and approximately $7.1 billion for product tooling and manufacturing process equipment
The Company’s capital expenditures were $10.3 billion during 2012, consisting of $865 million for retail store facilities and $9.5 billion for other capital expenditures, including product tooling and manufacturing process equipment, and other corporate facilities and infrastructure. The Company’s actual cash payments for capital expenditures during 2012 were $8.3 billion.
There are two points that need to be highlighted:
Expenditures overall were $2.3 billion higher than forecast. Nearly all of the over-spending was for "product tooling, manufacturing process equipment and infrastructure". Retail was planned at $900 million and actual was $865 (an under-spend of $35 million). As no major real estate assets were acquired (change in those assets was $380 million, less than 2011 or 2010) the "deficit" in budgeted expenditures can be attributed entirely to product tooling and manufacturing process equipment.[1] The $2.3 billion spending over expectations amounts to 34% of forecast.
The cash payments for capex were $2 billion lower than expenditures. This is a curious situation which was not highlighted in previous 10 K reports. What this implies is that much of the "over-spend" was not paid for though cash and since no new debt was booked it's likely to have been paid for through some form of vendor financing. I'll explore some explanations below.
So it's important to note that the company spent a great deal more (one third more) than expected and paid for some of the acquisitions through uncharacteristic or unorthodox means.
The historic budgeting for Machinery & Equipment (+Land & Buildings) is shown in the following graph:
I included the forecast for 2013 ($9.15 billion) and added 18% to estimate 2013 actual spend.
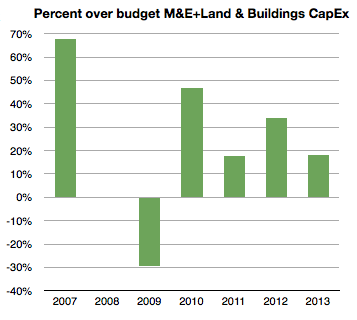
The percent over/under budget (percent difference between green and blue bars above) is shown below:
[Again, note that I took the liberty of forecasting 2013 over-spending at 18% or $10.8 billion.]
Note that 2008 and 2009 were either on target or below target. The recession of 2008/2009 might have had something to do with that. The under-spending situation of 2009 was made up for during 2010 with over 45% extra spending. 2011 came in at 18% over and 2012, as already noted, was 34% over budget. I then suggest that 2013 will be at 18%, same as in 2011.
When seen in this historic context, the increase of 2012 is even more dramatic. Apple overspent in 2012 more than it spent overall two years earlier. 2012 spending on M&E (and Land) was up 138% sequentially and nearly seven times the level of three years ago.
With this splurge in mind it's necessary to think about that second noteworthy point above. There is evidence that at least some of the $2.3 billion over-budget was unanticipated and came late in the year. We saw the surge in spending in FQ4 from the gross asset value change data. The question is what was it spent on and why did it not go through the cash flow statement?
Circumstantial[2] evidence points to the asset being production equipment (or even a whole plant) previously owned by Sharp. Sharp is a key supplier of screens to Apple but is also in financial distress. Sharp has also been the object of an intended investment by Foxconn [Hon Hai]. That deal fell through as Sharp's finances deteriorated. My guess is that these attempts to shore up Sharp are directed by Apple to ensure both continuity of supply and a balanced supplier base (offsetting Samsung, another supplier.) If Sharp were to enter into some form of bankruptcy, the key plant(s) used in producing screens for Apple might be "up for grabs" by creditors and they might be taken off-line, jeopardizing Apple's production capacity, irrespective of contractual obligations. I believe that Apple's late and unprecedented expenditure was to secure this asset. I further believe that the financing for this deal was done through a swap of "pre-orders". Stepping even further into the hypothesis, I believe Apple arranged to move a Sharp screen production line onto its books and "paid" for it through a pre-payment of components. This being a pre-payment it would be in the form of an "off balance sheet" commitment. Apple reported that "As of September 29, 2012, the Company had outstanding off-balance sheet third-party manufacturing commitments and component purchase commitments of $21.1 billion" [my emphasis]. This is a significant increase from earlier years and allows for a huge "slush fund" to cover asset swaps.
If we take the timing of this expenditure into consideration, I consider it reasonable to assume that 2013 spending is lower by this amount. In other words, I think that about $2 billion, including the Sharp plant, may have been "brought forward" by a few months from 2013. If the company had spent more on schedule and on budget (i.e. with an over-spend of 15% rather than 34%) it would have spent about $8.2 billion. Therefore, as next year's forecast is for $9.15 billion and as I would also expect an over-spend of 18% or $10.8 billion total, adding the brought-forward $2 billion would imply sequential growth from $8.2 to $12.8 or 56%.
This is in contrast to the indicated change of $9.5 billion (actual) to $9.15 billion (forecast), or decrease of 4%.
So, recapping the CapEx story, the company over-spent far more in 2012 than anticipated. It did so late in the year. It did it while a supplier was in distress and another's supplier's efforts in rescue failed. Furthermore, it indicated a modest and thus uncharacteristic increase in the next year's CapEx budget. My take is that the trajectory of investment is not being altered dramatically but it's had an adjustment in timing, a kink in the line. The overall story remains that Apple is still injecting vast and growing amounts of capital into production and placing those assets on its own balance sheet.
---
Notes:
I track this spending through asset value changes in the balance sheet. That change in value excludes depreciation which turned to to be substantial in 2012: $2.44 billion.
What follows is strictly hypothetical and based only on pieces of evidence that have become public hinting at an explanation but there is no proof.
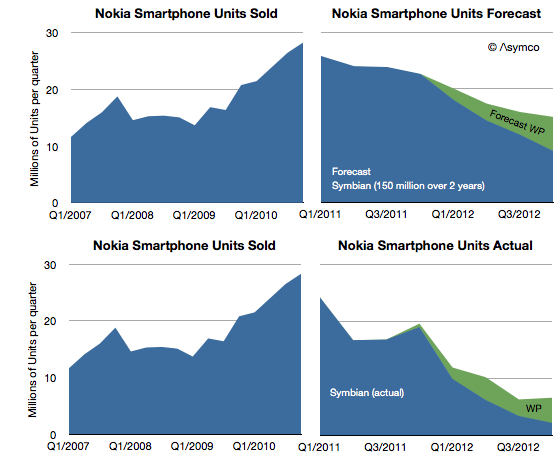
Days after Nokia announced the end of life for the Symbian platform I wrote a post titled Who will buy the next 150 million Symbian smartphones? The reference was to claim by management that before there would be a complete transition to Windows Phone, 150 million legacy Symbian phones would be sold, keeping the company financially stable before the new ecosystem took root.
I reproduce the original forecast I made below with the addition of what actually happened.
[Note that the Actual stack area chart is independent of the forecast area chart as indicated by shading.]
My forecast in early 2011 was based on the 150 million Symbian phones being sold over a two year transition period. The implication with the forecast for Windows Phone was that this would still lead to a difficult contraction of volumes.
As it turns out, only 96 million Symbian devices have been sold in the 7 quarters since the platform was deprecated. It's unlikely that there will be ever by 150 million units sold as last quarter only 3.4 million shipped. In any case, management has already retracted that claim.
What about the Windows Phone forecast? It turns out that by this point in time (Q3 2012) I had expected Lumia shipments to total 9 million. Actual shipments reached about 9.5 million, so not bad. However, the market grew faster than I had expected and overall Nokia smartphone market share turned out to be slightly lower (6.3% in Q2 vs. 10% estimated.)
The just ended quarter shares are not yet available but it's quite possible that overall Nokia smartphones could be well below 5%, and may slip to 3% during the transition period.
My warning in February 2012 was that 150 million Symbian units would not ship since I expected there would be a stigma associated with the products among distributors, even if consumers were fine with them (which they weren't).
The public execution of Symbian (and any other alternative being developed inside Nokia) will probably be a classic case study in disruption management. To wit: even if a platform needs to be led out to pasture, there are ways of managing decline other than suicide. Nokia's failure is not so much having chosen the wrong alternative to Symbian, but having chosen exclusively.
However, there's a twist. The company did not accept exclusivity of one supplier without a concession: In exchange for exclusivity, Nokia negotiated $250 million every quarter in the form of "platform support payments" from Microsoft. Nokia has to date received over $1 billion in such payments. (For the last quarter that amounts to $86 for each Lumia phone shipped.)
The tragedy comes from this $1 billion/yr not being enough. The foregone revenues from Symbian (assuming they had been able to maintain the decline to the level of 150 million units that they had originally forecast) would be about $9 billion. This means that had Nokia not knifed Symbian and had sold the shortfall units at an average price of $200 they would have received an additional $9 billion in sales. Furthermore, assuming a margin of 33% for those units, Nokia received from Microsoft one third from of what she gave up for exclusivity.
In other words, the net cost of the Microsoft exclusive relationship is at least $2 billion in operating profit.
This turns out to be the difference between being profitable and being distressed.
We will never know if this scenario would have ever happened, but the forecast management made 21 months ago suggests that at least they thought this was what they were going to get out of the bargain.
This reminds me of another article posted around the same time.
Phil Schiller stated (under oath) that when assessing sales for a new model of the iPhone, Apple used an easy shorthand:
Each new generation sold approximately equal to all previous generations combined.
That's a helpful gauge. Did it hold and will it continue to hold?
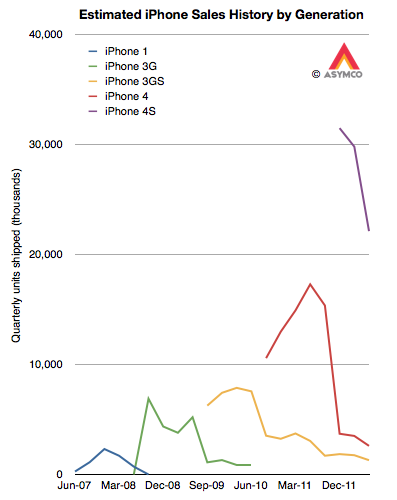
In order to test this rule of thumb we need to know generational sales. Although we know overall unit sales for a given quarter, since Apple has been selling several versions simultaneously, we need to make some guesses about the ratio of generations in the mix. My guess is about 10% for 3G vs. 90% 3GS and 5% 3GS vs. 10% 4 vs. 85% 4S. That results in the following pattern:
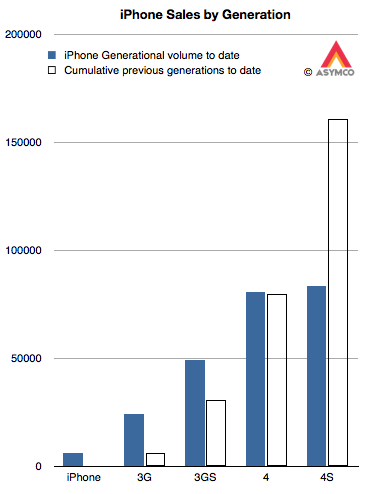
The cumulative totals for these generations can then be generated and they appear as follows:
The solid bars are the shipments for each generation (to date) and the outlined bars are the cumulative shipments of all prior generations. The assumptions show that:
The 3G easily outsold the original iPhone. In fact, it sold nearly four times as many.
The 3GS also handily beat the 3G+original total by a factor of 1.6
The 4 also beat the 3GS+3G+original. As the 4 may continue to sell into the future, the beat will only grow larger.
The 4S is only half way through beating the 4+3GS+3G+original. Assuming the current quarter's sales roughly equal the last quarter's, the total for 4S will reach two thirds of the sum of the previous generations (i.e. 100 million) by the end of September. Bearing in mind that the 4S is likely to remain in production at least one more year means it has a potential to come close to the target of 162 million.
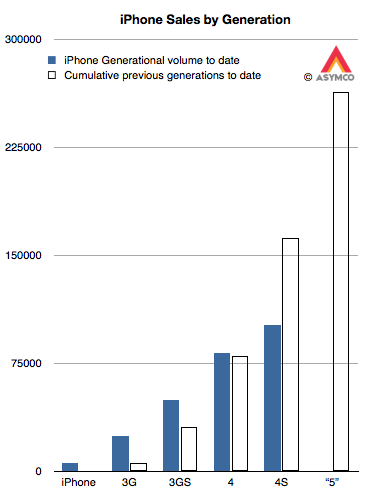
This leaves us with the question of how many iPhone "5"s will sell. As it stands today, the cumulative total would have to be greater than 263 million units (including assumptions for the current quarter.) That target is shown below:
Is that a reasonable target?
Unfortunately, this is a moving target. As the 4S (and maybe 4) remain in production, the target continues to increase with time. However, we can still take a stab at this.
Recall the analysis of production based on budgeted CapEx spending. It resulted in a best guess of about 165 million iOS units sold in the following two quarters. I further forecast iPhones in isolation to be about 102 million over the same period. Taking that forecast forward and assuming a 60% growth rate, I currently have about 200 million iPhones over the next twelve months. If 85% of those are the next generation, that yields about 170 million iPhone "5"s through mid 2013.
This is well short of a target of 265 million. But that's only over the next four quarters. If the iPhone "5" remains in production for at least as long as the 3GS then it might cross 200 million. There is also the question of whether the "mix" will begin to favor the older generations more. If that's the case, we might see version "5" meet its target.
Underlying all this is the question of a change in strategy toward more penetration (vs. current skimming.) That might allow for sustaining the 100% historic growth rate. If so then Apple will easily sell 250 million iPhone "5"s.
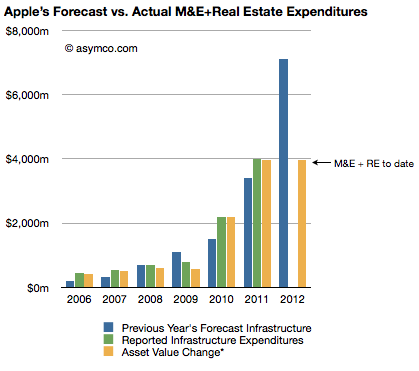
The Company anticipates utilizing approximately $8.0 billion for capital expenditures during 2012, including approximately $900 million for retail store facilities and approximately $7.1 billion for product tooling and manufacturing process equipment, and corporate facilities and infrastructure, including information systems hardware, software and enhancements.
The history of these expenditures is shown below (the blue bars are statements from 10K reports including the one above shown as the right-most bar):
Three 10Q reports so far this fiscal year have given us updates on asset values and the change in these values are shown as the right-most yellow bar. The asset value change suggests $3.9 billion has been spent so far of the $7.1 billion budgeted. Thus we can estimate that about $3.2 billion remains to be spent in the fourth fiscal quarter (thus bringing the yellow bar to parity with the blue bar in the chart above--a parity that was achieved or exceeded for five out of the last six years).
Assuming $200 million of the fourth fiscal quarter budget will be for land and buildings[1] results in an estimated $3 billion remaining for product tooling and manufacturing process equipment and data centers.
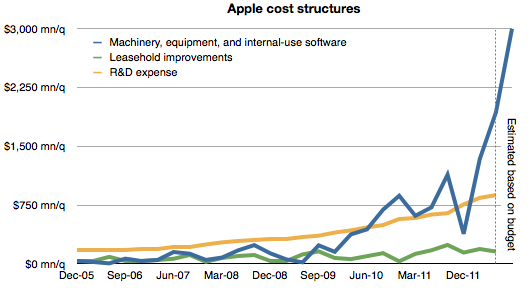
The history of spending for various cost centers is shown below.[2]
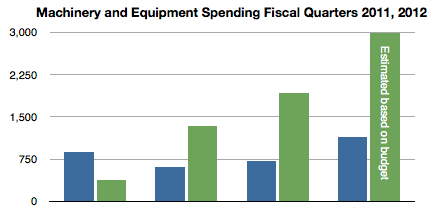
Note again the forecast for the fourth quarter based on budget given last October. Also shown below is the spending on machinery and equipment by quarter for the fiscal years 2011 and 2012 including the estimate for FQ4 2012. (Blue bars represent 2011 quarters and green represent 2012.)
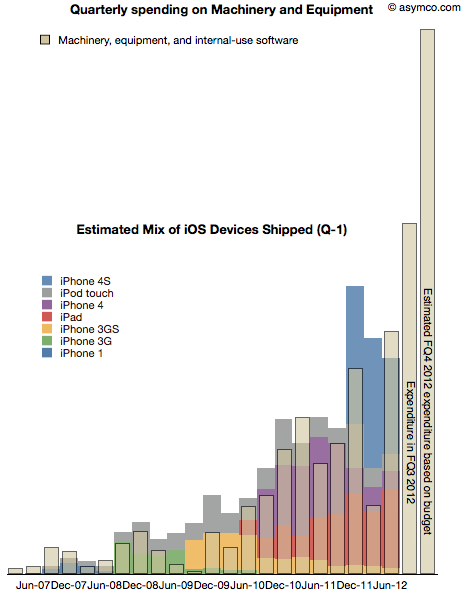
As discussed previously, spending on machinery and equipment has shown a strong correlation with the output of iOS devices in the following quarters. The following chart shows the superposition of M&E spending in a given quarter and iOS output in the following quarter.
Note that due to the time-shifting the Expenditure for FQ3 does not have a corresponding output--expected in FQ4--and that FQ4 expenditure is estimated based on budget.
With this data in place, we can now begin to answer the question of what are the total iOS device shipments expected in the current (ending September) and the following (ending December) quarters.
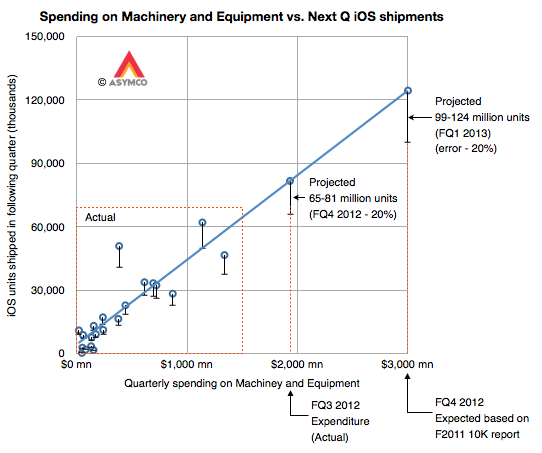
Our eyes are pretty good at seeing patterns in data so perhaps it would suffice to know the scale to the graph above and thus fill in the colored output bars to match the spending. But to make it a bit more precise, I drew the following chart:
It shows the same data but as an X-Y scatter plot where the X axis is quarterly spending and the Y axis is iOS unit shipments. Note that the actual data points are in the lower left area delineated with a dashed red rectangle.
I drew the blue line corresponding to an assumed linear relationship between the two variables to project the iOS output based on additional expenditures for FQ3 and FQ4.
I used error bars of -20% to show a possible conservative range.[3]
This yields an iOS output of approximately between 65 and 80 million units in the current quarter and 100 to 125 million in the fourth calendar quarter. The sum of the low ends of this estimate is 165 million units.
My current forecast is 53 million units in CQ3 and 110 million units in CQ4 which, together, add up 163 million. Close enough.
Stay tuned for a padcast report with more details on this approach.
---
Notes:
The company spent $31 million, $66 million and $159 million for the first three quarters on Land and buildings. $200 million in the fourth quarter seems reasonable unless there is a pending large land deal closing in the next two months.
I added leasehold improvements as a proxy for store openings and R&D expense as a proxy for overall product development. These are in contrast to expenditures for product production and support which are represented by Machinery and Capital Equipment.
Nokia currently estimates that Devices & Services net sales in the first quarter 2012 were EUR 4.2 billion, comprised of Mobile Phones net sales of EUR 2.3 billion (71 million units), Smart Devices net sales of EUR 1.7 billion (12 million units),
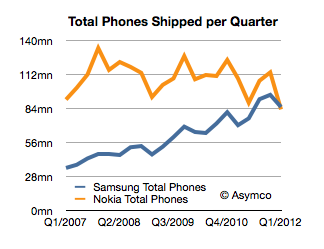
We don't have the total number of Samsung shipments, however estimates exist. They range between 41 and 44 million smartphones and 44 and 47 million feature phones. The low end of that range would imply Samsung shipped 85 million phones.
Nokia's press release indicates that it shipped 83 million.
This would be the first quarter that Samsung beat Nokia in total phone shipments. It had already overtaken Nokia in sales volume and profitability last year but this is the most cited metric of market performance: being the biggest in volume. Here is the tale of the shipments:
How did this happen?
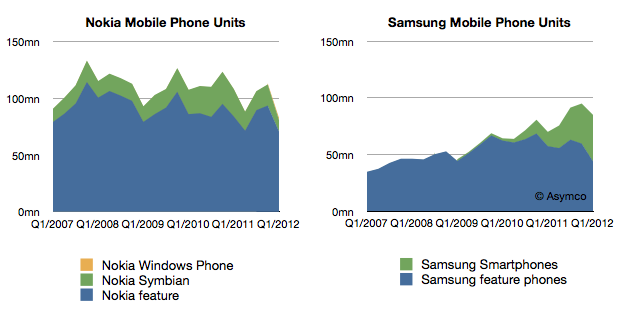
The answer should become visible when we look at at another set of data. If we split the smartphones from feature phones the charts look like this:
Looking at product mix, Samsung growth is shown to be almost entirely due to smartphones while Nokia's stagnant growth seems to be a failure to have any smartphone traction.
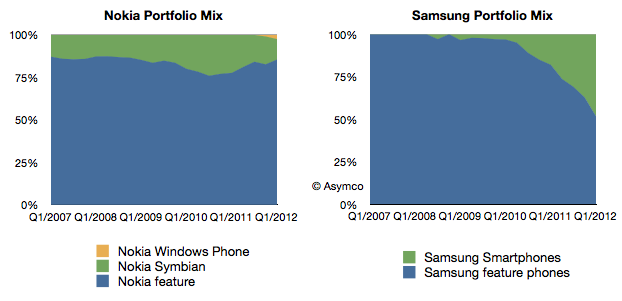
It's even more clear when showing the above mixes of devices as percents of total.
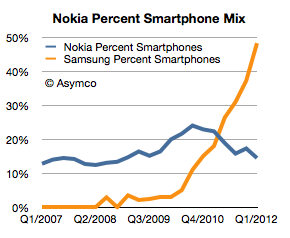
As a percent of total, Nokia has shrunk its smartphone business from a peak of 24% in Q3 2010 to 14% last quarter. In the same time frame Samsung's smartphone share of portfolio has exploded from 10% to nearly 50%.
Note that both companies have seen non-smart device volumes contracting. Samsung's level is approximately the same as it had in late 2007 and Nokia's is lower than at any point in the last six years (perhaps longer).
So the answer to the question of how Samsung beat Nokia is told in the following chart:
Samsung was able to convert its portfolio to smartphones while Nokia failed to do so. This is the sort of transition that can only come about from an explicit strategic intention on the part of management. Market demand can steer you in any number of directions, but a vision of a future should provide the compass for making the big bets.
The bet Nokia made many years ago was that there would be a continuing, substantial business in the "low end". And low end meant feature phones. This strategy was still in evidence last year under the moniker "the next billion" users. The decisions were not driven by whether the products would be hired for different jobs, but that they would hit different price points. In other words, segmentation of customers by their ability to pay for devices rather than categorization of the jobs they hired mobile devices to do.
Perhaps Samsung was no wiser, but they were more pragmatic. Being non-dogmatic meant being flexible. They ran with off-the-shelf technologies and managed a transition to smart devices faster than anyone expected. It may not be a perfect strategy but it beat a bad strategy.
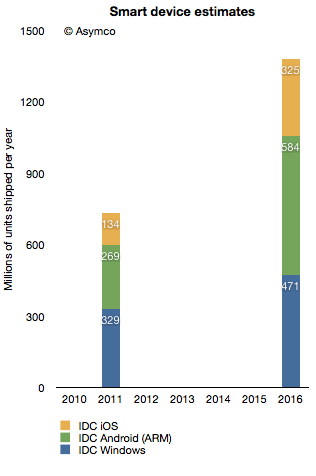
In terms of platforms, IDC expects a relatively dramatic shift between 2011 and 2016, with the once-dominant Windows on x86 platform, consisting of PCs running the Windows operating system on any x86-compatible CPU, slipping from a leading 35.9% share in 2011 down to 25.1% in 2016. The number of Android-based devices running on ARM CPUs, on the other hand, will grow modestly from 29.4% share in 2011 to a market-leading 31.1% share in 2016. Meanwhile, iOS-based devices will grow from 14.6% share in 2011 to 17.3% in 2016.
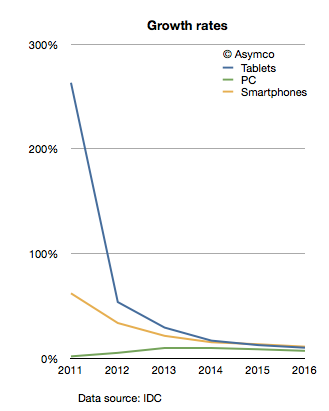
The company provides a stacked bar chart (follow link above) to illustrate their view of the market. I took the data they included and measured the implied growth rates for the product categories:
IDC is implying that in four years the tablet market will be growing at 10%, the Smartphone market will grow at 11% and the PC category will grow at 11%. In other words, five years from now the PC market is expected to grow faster than the tablet market and just as fast as the smartphone market!
What's more remarkable is that this situation is not going to happen in four years. The slowdown in growth is actually expected much sooner. The growth rates two years from now are expected to be: Tablets 17%, Smartphones 15% and PC 10%. IDC is unequivocal: by 2014 the good times will come to an end to the post-PC challengers. These growth rates would be catastrophic for share prices and the value propositions of the new platforms to developers, partners and consumers.
What's more, these growth rates are striking not only because they predict a collapse in the value of most market challengers but that they also predict a strongly resilient PC market. How can we test this forecast?
I tried to reconcile this doomsday scenario with what is known about the components making up the data. I.e. what "bottom-up" data is IDC using? In the quote above, IDC offers some insight into this market participant data. Based on the category and share data they published it's possible to infer the following:
Bearing in mind that neither iOS nor Android existed five years ago, we can observe they are bigger together than the PC market. And yet, IDC predicts a compounded average yearly growth rate of 16.7% in Android, 19.4% in iOS and 7.5% in Windows between today and 2016.
In aggregate, IDC forecasts that in the next five years Android will not manage to double and that iOS will only increase by a factor of 2.4. Is this believable?
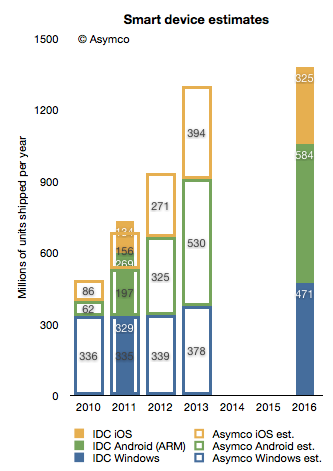
I try to stay away from long term forecasts, but I do maintain a short term forecast based on recent growth data. My forecasts for this year and next year are shown below.
I super-imposed my short-term forecast (outline bars) on IDC's long term forecast (solid bars) and a several differences become apparent.
First, my 2013 forecast is nearly the same as IDC's 2016 forecast. To see why we need to look at each platform separately.
Perhaps we might (with difficulty) agree on Microsoft's potential. I believe Windows 8 will have a catalyzing effect and that Microsoft will begin to see its platform grow again. However, my expectations are modest. To increase Windows sales rate by 100 million units/yr between 2013 and 2016 is possible but ambitious.
The real problem is that our Android and iOS forecasts are outside any zone of possible agreement. Maybe there is a difference in what we measure. For a hint, we seem to disagree on the number of Android devices shipped in 2011. I used Google's own reports of activations to work out the yearly shipment estimates. Perhaps IDC is including versions of Android that are not Google sanctioned.
We also disagree on the 2011 iOS figures. I obtained 156 from Apple's own reports. Again, perhaps the difference is the inclusion of the iPod in my case.
Nevertheless, the difference in the long term cannot be accounted for only through these categorization differences. I would put the cause of the difference down to the methods used in forecasting. As can be seen from the first chart above, IDC's growth rate reductions are extraordinarily steep. Perhaps the approach used by IDC was to forecast the overall market growth and then assignment of shares to participants. This can be called the "top-down" approach. In contrast, my approach is to forecast growth rates based on recent growth rates and moderating these rates gradually. This can be called the "bottom-up" approach.
My experience and all the data I've ever collected about historic disruptions tell me that the entrants tend to win these types of paradigm shifts. They win through a vast expansion of consumption and the recruitment of non-consumers. Markets tend to experience vast shifts in composition. If we believe this to be true then the bottom-up approach focused on entrants is likely to be more effective vis-a-vis the top-down approach of projecting steady state markets and the implicit assumption of incumbent share preservation.