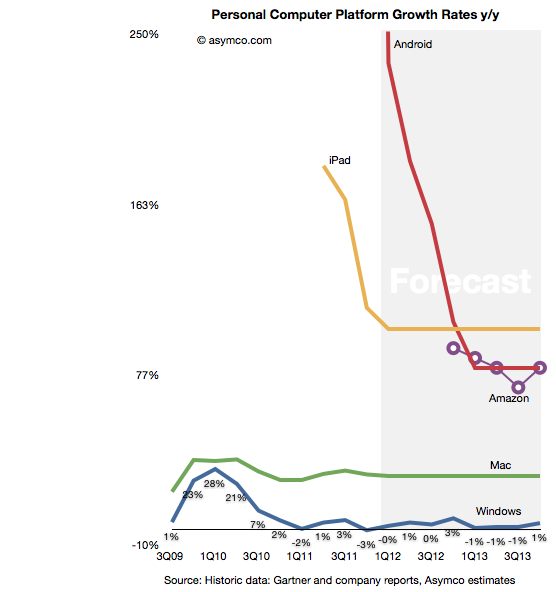
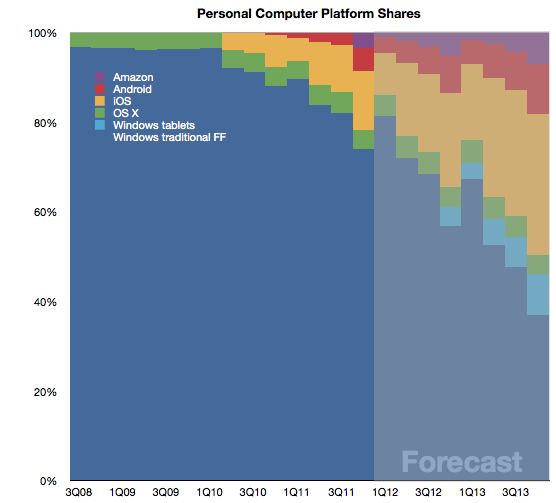
I began by projecting growth rates of various market participants including the leading Windows PC makers (HP, Acer, Dell, Lenovo and Asus), the combined "others" and the Mac. I also added the iPad, Samsung's tablets, other Google sanctioned Android tablets and Amazon. I also projected a split between traditional and tablet Windows shipments.
The underlying assumptions are:
Mac growth continues at 25% as it has on average for a few years
Windows grows slightly in 2012 with the introduction of Windows 8 late in the year. However I anticipate Windows 8, including tablet versions, to mostly be upgrades with slow enterprise take-up within this time frame.
The tablet versions of Windows begin shipping in Q4 2012 with 7% of total Windows shipped. The ratio reaches 20% by end of 2013.
iPad growth will flatten for '12 and '13 at 100%, similar to iPhone's historic performance.
Android tablet growth will be significant in the current year and follow iPad growth pattern though settling at 80% during '13.
Amazon growth will be approximately 80%.
Building the platforms combined growth bottom-up gives the following forecast for the next two years (and historic growth shown for perspective.)
[FF = form factor]
Given these assumptions, the day when the tablet market (by units) will exceed that of traditional PCs will come sometime in the fall of 2013.
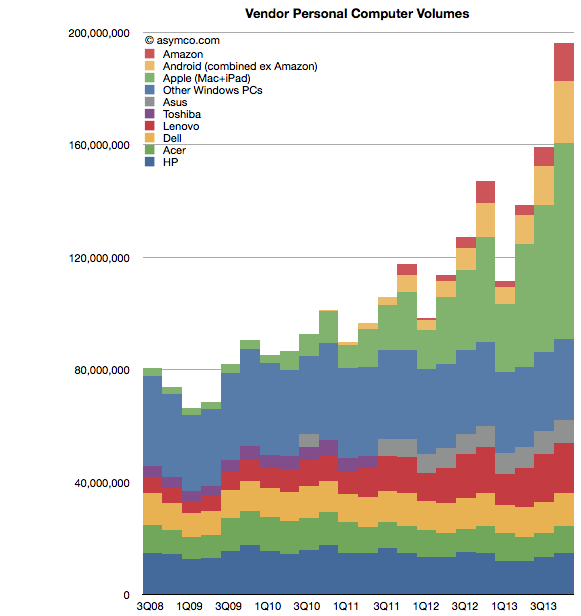
As yesterday's post noted, the tablet market will be additive. This can be seen in the vendor shipments forecast that accompanies the model:
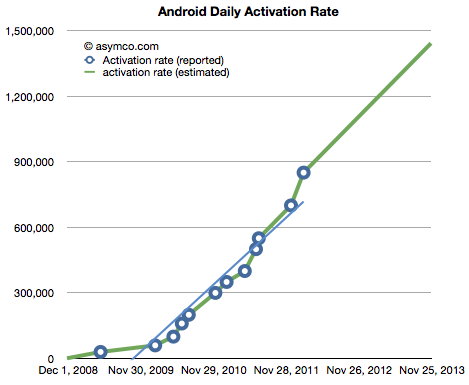
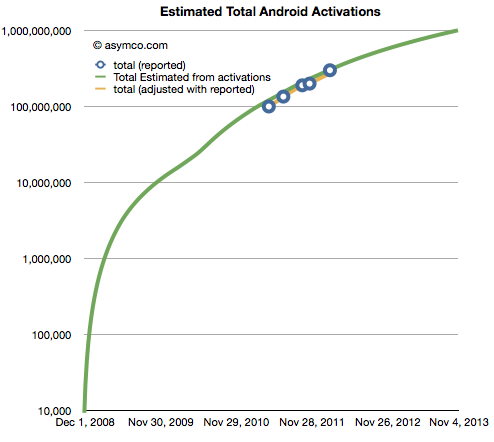
The latest data from Google shows that the Android activation rate is increasing at a relatively steady rate (i.e. acceleration is constant). The data provided so far is in the blue circles below. The green line is the interpolation and extrapolation of that data.
As the graph is projected forward we get an activation rate of one million per day by mid August of this year. If it continues then we could see 1.5 million per day by end of 2013.
The corresponding number of cumulative activations is shown on the following log chart (with blue circles showing the actual data and the green estimates.)
The forecast is therefore that Android activations will cross one billion by November 2013.
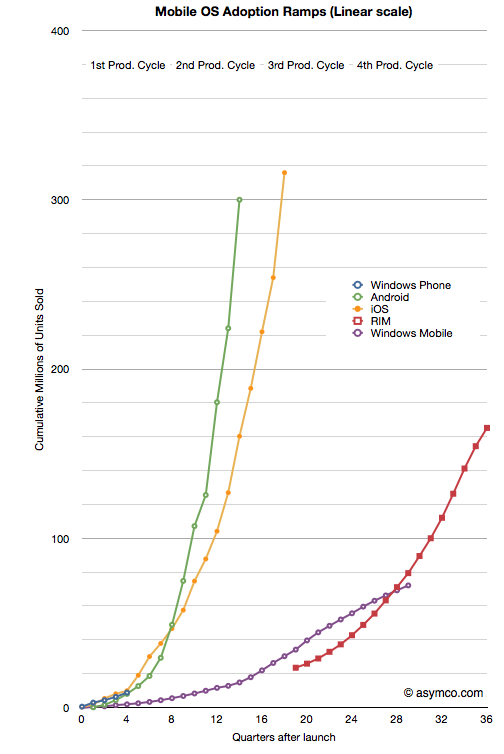
The following chart compares the growth ramps of the various mobile operating systems indexed from the same starting points (measured in quarters after launch).
If Android does keep accelerating at the same rate then it will reach a billion users in five years. Of course, this total will not be a unified ecosystem in that many versions of Android will be co-existing. There will also be additional variants of Android which will not include Google services (these are not included in the totals above) which will compete to some degree with this platform.
However, it's still an amazing story. The crucial question is whether the billion Android phones will have an effect on the opportunity for new entrants like Windows Phone and future BlackBerry variants as well as Bada and other Linux-based platforms.
The answer is that there will be well over 6 billion mobile "connections" by the end of 2013. ITU reports that "By the end of 2010, there will be an estimated 5.3 billion mobile cellular subscriptions worldwide, including 940 million subscriptions to 3G services." It follows then that if this forecast is correct then by the end of 2013, Android will have about 17% penetration of the connections market.
Data on Q4 performance is starting to trickle in. Last week Motorola, as part of a profit warning, revealed their Q4 smartphone shipments were 5.3 million. RIM had reported 14.1 million units (quarter ending November). HTC has also warned that their shipments of smartphones (and tablets) totaled 10 million. Samsung provided guidance on overall sales but since they don't report data on smartphone (or phone) sales, the estimates are ranging between 32 and 35 million.
Many have forecast Apple's performance but there are many other companies which are not easily estimated (Sony Ericsson, LG, Nokia, ZTE, Others.) But rather than dwelling on the specific quarter, we can make some long-range estimates of performance based on the historic data.
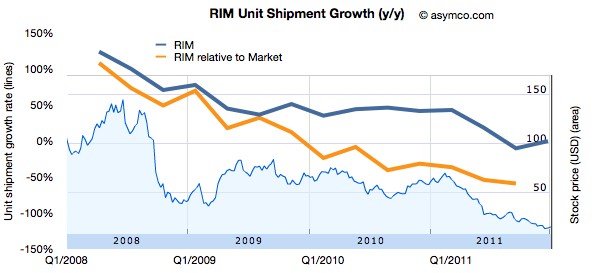
One method I use is to look at patterns of growth. Growth is the first derivative of market performance and it sometimes shows patterns which the performance itself does not. Consider the following chart showing the growth pattern for RIM.
The blue line shows the absolute year-on-year quarterly growth based on reported numbers of smartphones shipped. I've also shown the growth "relative to market" which is unit growth with market growth subtracted. This orange line represents how much faster (or slower) the company is growing relative to the market. If the orange line is above zero, the company gained share. If it's below zero, it lost share.
I also overlaid the performance of the share price (right scale).
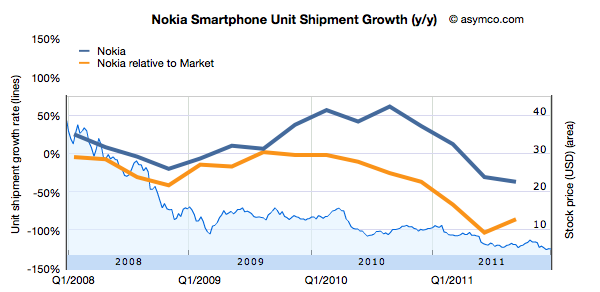
Now compare that with another long-term incumbent in the smartphone market, Nokia.
Bearing in mind that the scales are identical, Nokia's relative performance has been negative since early 2008. Persistent negative smartphone performance relative to market growth causes persistent loss in share price.
What about other, more recent competitors?
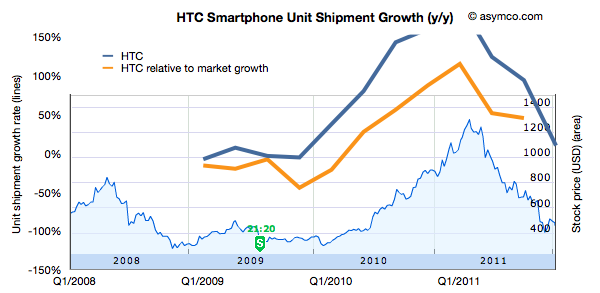
HTC is not a recent entrant in smartphones, and has gone through a phase of growth with Windows Mobile in the 2000's. This is its pattern of growth (and its share price).
Keeping the scale for growth consistent with the other companies leads to a bit of clipping but the pattern of rise and fall also seems correlated to share price performance.
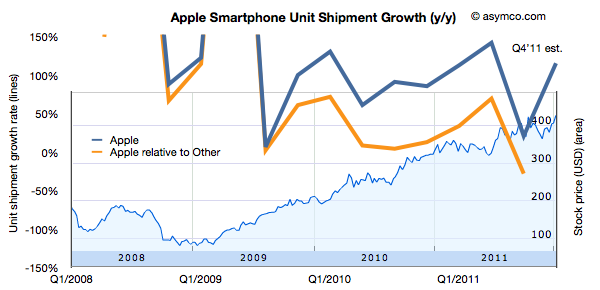
Finally, the following is the same analysis applied Apple.
Again, keeping the growth scale consistent leads to some clipping, but the pattern remains observable.
What seems to be rewarded to various degrees is consistency in growth of smartphones for companies which are primarily engaged in the market. However, failure to grow is punished with severe share price declines.
Being able to forecast smartphone growth seems to be useful, at least in the time frame of one or two years.
It may sound strange to hear me say that I don't make predictions even though I often talk about how things will change and even provide some forecasts. The difference is one of degrees. A prediction to me is a very specific, time-sensitive and materially valuable recommendation. An observation about the future is an imprecise, intuitive hunch based on pattern recognition. It's mushy. It's theoretical. It's the difference between saying a company is great and recommending to buy its stock with a price target in a time frame.
But it gets even weirder.
One of the recurring themes in Apple analysis has been that independent analysts, as a group, have been, on average, more accurate in quarterly forecasting than highly paid Wall Street Analysts. Many have asked why. I believe that the answer is because independent analysts are theorists who make observations while professionals are data gatherers who make predictions.
First, we should understand the reasons why each group does what it does. Wall Street sell side analysts are rewarded for making Buy/Sell recommendations that cause clients to retain the services of the firm they work for. They are not paid to be accurate with specific forecasts in fundamentals. They are paid to predict how stocks move. The objective is not to be accurate in the quarterly but to support the "call" or prediction. The disconnect from accuracy comes in trying to sustain the call with a "conservative" forecast.
For example, an analyst with a "Buy" recommendation (and a prediction in the form of a price target) thinks Apple could ship 30 million iPhones this quarter and generate EPS of $10. But he also thinks the stock looks cheap even if they only ship 28 million iPhones and report EPS of $8.50. In this scenario he's incentivized to publish the lower (less accurate) number. That way he supports his prediction. By dampening expectations, the stock rises on the "surprise".
Because an analyst sells predictions, he self-censors what he believes.
Contrast that with the motivation of an independent analyst (aka blogger). His motivation is to (presumably) gain a reputation of accuracy and insight. He sells his reputation as a keen observer. Precise predictions or recommendations can turn out wrong quite often. Getting caught with these errors exposes the independent to instant negative feedback. The risk is far greater than the opportunity.
So here is the difference: Analysts have an incentive to put forth a version of the future that supports their call on the stock. Bloggers have an incentive to put forth the most accurate version of the future. By taking the prediction out of the picture, accuracy in describing the future improves.
So I don't have any predictions or recommendations. I just hope to help you see patterns that lead you to making your own predictions.
When asked where Apple's growth will come from, most analysts or observers will cite new products. As long as there are new products, then there is growth. Conversely, if there are no new products, then there will be no growth. This is such a commonly held belief that it's axiomatic: Apple is being valued based on short-term foreseeable growth.
To be more precise, analysts value the wave of growth of every new product and heavily discount the post-growth phase assuming commoditization. There is no value assigned to Apple for extending market reach to the mass market.
Consider: Analysts currently forecast an operating income (or EBIT) of $43.3bn for 2012 and $49.7bn for 2013. That implies growth of 28% in 2012 and 15% in 2013. These growth rates are modest in light of Apple's recent historic growth and especially 84% in 2011 on EBIT level. Much of this growth has been due to iPhone which quickly captured 4% market share in four years. To suggest 15% growth in 2013 is to suggest that Apple will not increase its phone market share by an appreciable amount. The implicit assumption in that growth figure alone is that Apple will remain a niche player.
Bear in mind that 15% growth is so low as to be half the the growth in the Mac business and below the likely growth in the overall phone market. Considering the risk premium on equities, this growth forecast assumes essentially a no growth scenario. But even with no growth, Apple's cash flows are huge and thus they should add up to some significant present value. Since we know the value as reflected in the current price, we can work backwards to determine the discount rate being applied to those future flows. In other words, we can calculate how risky Apple's existing product cash flows are seen to be.
Based on assumptions originating from analysts' consensus, we can construct a simple model that will approximate the discount the stock market puts on Apple's future cash flows. Let's have a look at an adjusted Gordon or dividend discount valuation model on EBIT basis:
Shares are valued based on the projected future cash flows of a company. Discounting EBIT with Weighted Average Cost of Capital and subtracting growth will yield enterprise value (= market capitalization - cash).
Applying analysts’ assumption of close to zero growth to Apple's post 2012 EBIT means EBIT stays constant for 2013 and beyond. Let’s solve for the implied capital costs. Right away we can eliminate growth (g) as it equals zero. EBIT reflects operating cash flow since in a zero growth scenario CapEx will equal deprecation and there are no changes in net working capital. As Apple has no debt but a cash surplus, WACC will be equal to cost of equity[1].
Solving for capital cost (WACC) with available analysts' EBIT estimates reveals a discount rate of 15%.
But let’s remember that analysts have consistently and by a large margin missed Apple's financial performance. So let’s dial in a more aggressive estimate of around $56bn of EBIT for the fiscal year 2012. The discount rate goes up to 19% and implies an EBIT multiple of 5.3x.
In other words, Apple's cash flows for a zero growth scenario are being discounted at a rate of 15% to 19%. This places the company in an extremely risky category of investment. It is certainly not something that can be categorized as a value stock.
The discussions on this blog regarding Apple’s valuation have been insightful, but only danced around the triangle of price, earnings and growth. When the growth forecasts are considered vis-a-vis current pricing, the assumptions built into 'consensus' forecasts for Apple are condemnations of the company.
They present a view of a company that is extremely vulnerable and can neither preserve its current cash flows nor find new sources of growth. It is, quite plainly, a company doomed to commoditization.
---
Notes:
Or one can even assume that cash has a positive effect lowering costs of equity (less indirect bankruptcy costs).
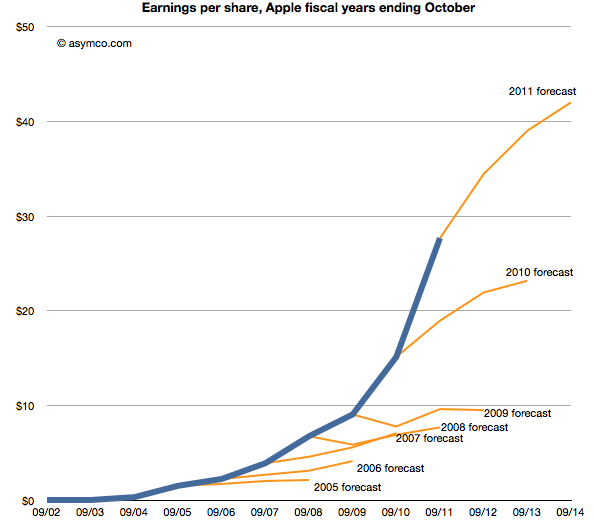
Last week Horace wrote about the apparent "reasonableness" of analyst Apple estimates. He explained how the consensus for Apple's growth was always deeply pessimistic because its performance could be argued to be anomalous. It was just too good to be true. We reproduce the chart here:
The estimates look like characteristic "tell-tales" of a company running strong into the wind.
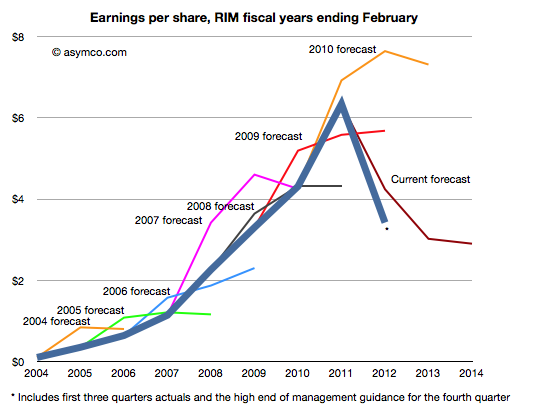
This conservatism in the face of rapid growth sounds "reasonable" but is it always practiced? And what about the ability of this conservative strategy to predict dramatic changes in growth? To test, we started to look at the predictions for RIM. RIM has also enjoyed strong growth over a similar time frame as Apple. How did analysts predict its performance? The following chart was prepared using the same technique as the one for Apple[1].
Surprisingly, the "tell-tales" look very different.[2] For every year we looked at the first year estimates were over-optimistic with a decline expected after one or two years. This pattern is remarkably consistent within the RIM data and remarkably inconsistent when compared to Apple.
It's as if there was nothing in common with the methods used. This is perhaps appropriate, but the "quality" of predictions are not much better. With RIM they were too optimistic in the short term and too pessimistic in the medium term. With Apple they were far too pessimistic consistently.
More worrisome, the 2010 forecast did not offer any hint of the dramatic decline which followed only a few months later. And after three quarters of really bad news, the consensus is still higher than what will likely happen (ensuring an uninterrupted string "misses").
The study of these two companies' forecasts is a study in contrasts. We can say that the forecasting is disturbingly consistently inaccurate but we can also say that there seems to have been a bias of pessimism for Apple and optimism for RIM. We can only guess at the cause, but the consistency of bias points to something institutional.
---
Notes:
The three year forecast consensus (sourced from Bloomberg) was sampled one month following the end of each fiscal year. This should offer the analyst enough time digest the year passed and deeply contemplate the future.
If we may stretch the analogy, these are indicative of an imminent stall.
The discussion on why Apple is cheap was very useful. The debate brought into focus the possible causes for pessimism in the face of overwhelming evidence to the contrary. But maybe there is yet another explanation. The way the data was presented was as a difference between historic and projected growth rates. Is this the way analysts actually think?
Perhaps they don't project growth based on historic growth, but project earnings given historic earnings. In other words they don't look at the first derivative (change in earnings) but the shape of the actual data.
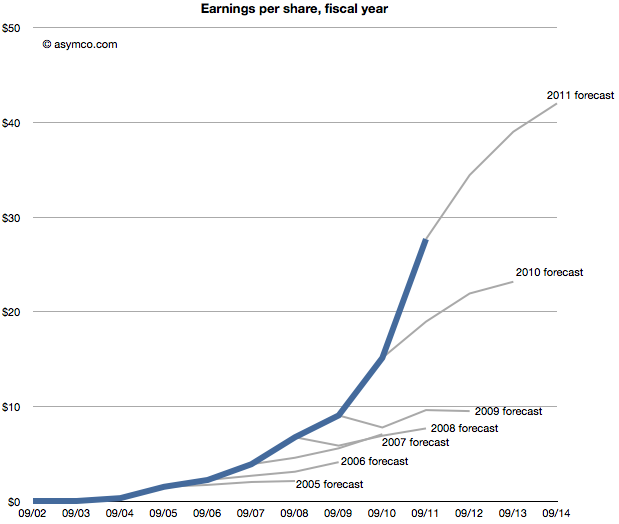
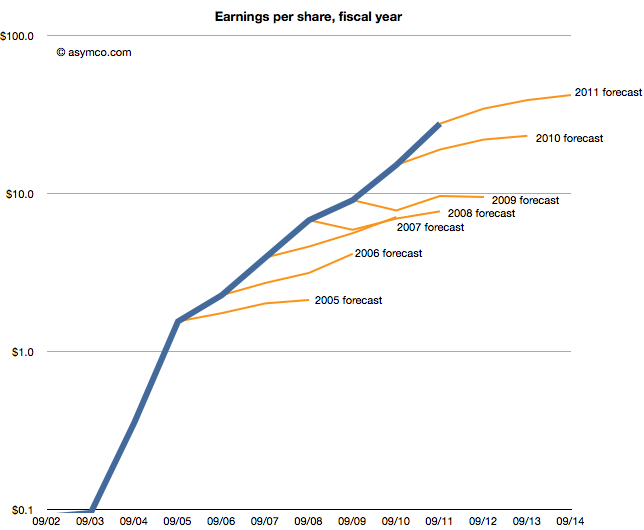
The following chart shows that data, i.e. forecasts as an extension of a sales trajectory. The blue area are actuals and the grey branches show projections at a given end of fiscal year.
Seen this way, we can imagine how the projections can be considered "reasonable". Some appear to be linear extrapolations while others show up as the end of "S-curves".[2]
What none of them imply is exponential growth. But would forecasting exponential growth be considered reasonable? Clearly not since it's never been consensus. But disruptive companies do follow non-linear growth. In fact, every company that has gone from being small to being big (which is to say all large companies) went through non-linear growth phases. The "natural" shape of growth is exponential.
The failure is therefore not of reason but of failing to use a model that assumes acceleration of sales. I believe that institutional financial advisors are conditioned (or coerced) into assuming that nothing unreasonable ever happens. That seems like a completely flawed foundation to stand on.
---
Notes:
This post is inspired by the New York Times chart showing budget forecasts.
Imagine it's late 2005. Apple's fiscal year just ended and they reported their performance. You're an analyst whose job includes forecasting the company's performance for next year. This is a weighty responsibility. Your forecast will be blended with those of your peers and used as a "consensus" average. That consensus for the next year will be used to measure the current value of the shares in a ratio called the forward PEG or Price/Earnings/annual earnings Growth. You are supplying the earnings and hence growth forecast while the market offers a price. As a stock is meant to measure future earnings, your forecast is a crucial and frequently cited figure about whether a stock is priced fairly.
There is some comfort in knowing that there will be many others who will offer such a forecast and your contribution is thus not the only way investors can calibrate the price. However, you should think hard about what you are predicting as it also will reflect your skill in predicting such a visible company.
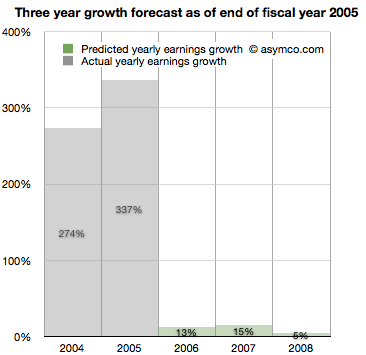
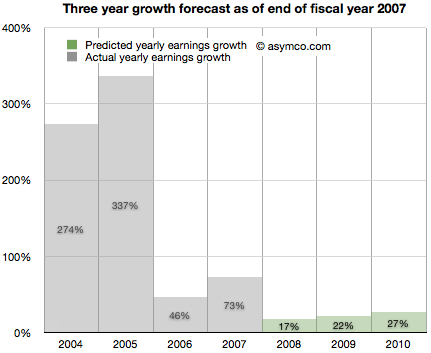
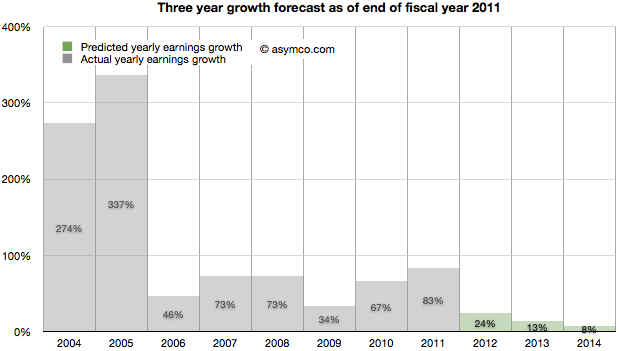
Apple just had a tremendous two years. 2004 and 2005 saw EPS grow at 274% and 337%. This is largely due to the runaway hit iPod. Given all that is known about the company, what will you put forward? While you're at it can you also forecast two years forward, namely provide a growth forecast for 2006, 2007 and 2008?
Here is what you and your cohorts publish as a consensus:
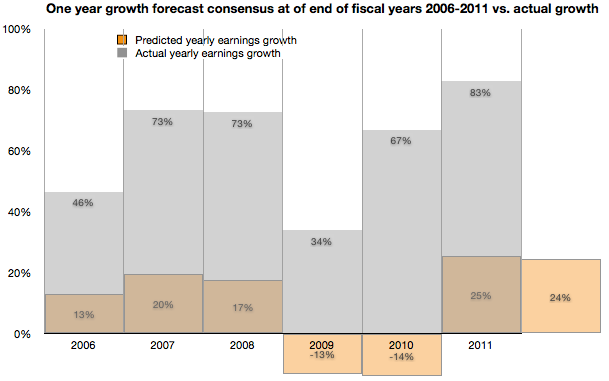
You go with a 13% growth for 2006, 15% for 2007 and 5% for 2008. The chances are, you reason, that the iPod will not carry the company's growth much longer. The competition is sprouting all over and Microsoft is rumored to be launching its own music player.
It makes sense to be conservative and offer a modest growth of 13%. At the same time you can rate the stock a buy as it is still growing. The stock just doubled in the last 12 months and the law of large numbers says that growth cannot last at the same rate as we've just seen.
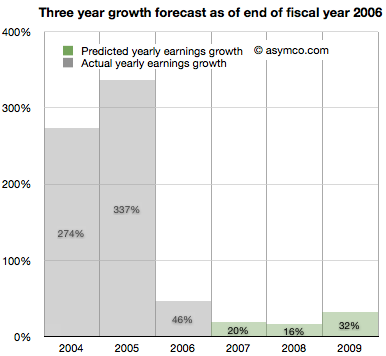
It's now late 2006. Apple just closed out another big year. Contrary to your forecast last year, the company grew at a rate of 46%, more than three times faster than you expected.
It turns out the iPod still has some legs and the company's Mac business seems to be growing. Looking forward you take your 15% growth for 2007 and increase it to 20% and suggest 16% for 2008 and 32% for 2009.
There are rumors of Apple getting into the phone business.
It's now late 2007. Apple just launched the iPhone and even though it was available in limited numbers on one carrier for one full quarter, the company still turned in an amazing 73%. Again more than three times faster growth than you forecast. What do you do about 2008?
It might make sense to increase the previous 16% estimate to 17% but since there is a real estate bubble brewing, the 32% growth for 2009 should come down to 22% and defer that growth out to 2010, dialing in 27%.
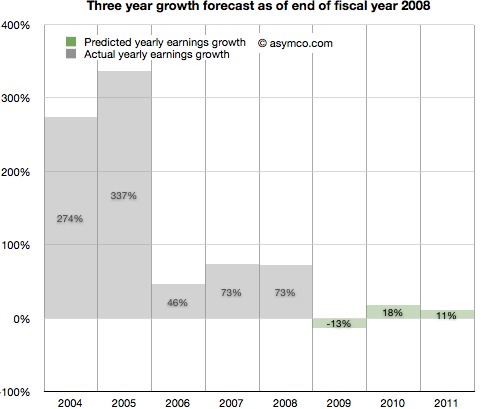
It's now late 2008. Apple closed out another huge year. 73% growth was once again more than triple your forecast of 17% growth. It's clear that the iPhone is a huge hit.
However, there is a credit crunch and talk of a huge recession, even depression looming. Apple is a luxury/premium brand and it is unlikely that those expensive products will sell well into these "macro headwinds". You predict a decline in the earnings of 13% in 2009, inline with many other tech stocks. You are optimistic however that 2010 will be a year of recovery and predict 18% increase from recession lows followed by a more reasonable 11% growth in 2011.
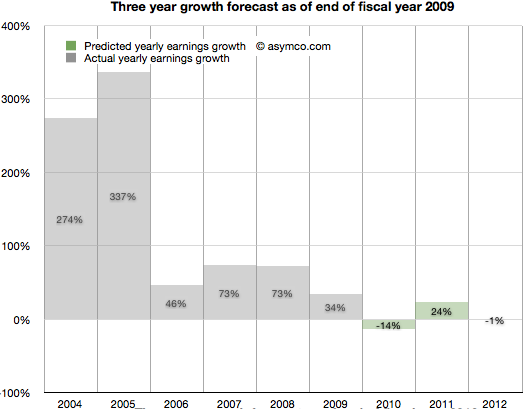
It's now late 2009. To everyone's surprise, Apple grew through the credit crisis. It turned in 34% growth (vs. your predicted 13% decline). The success is hard to believe but the iPhone had a lot to do with that. There are new competitors coming and the recession has proven resilient. With unemployment still high you predict 2010 will still be a tough year. You go with -14% growth for 2010 and postpone recovery out to 2011 with 24% "bounce". Longer term you see 2012 as a flat year, with Apple earnings shrinking slightly by 1%.
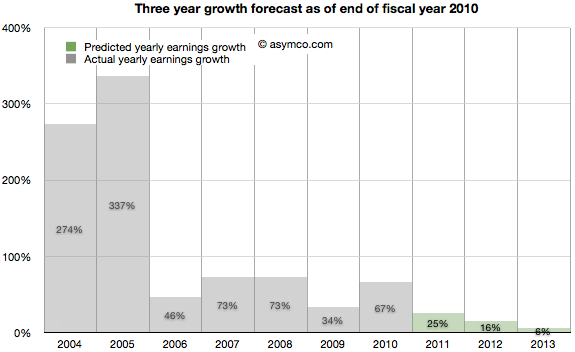
2010 ends with Apple achieving 67% growth. Shocking relative to a -14% growth forecast. But then again, Apple launched the iPad and who could have thought that was a hit? Apple achieved growth throughout the recession and it looks like it might keep going. Your 2011 forecast of 24% looks weak so you increase it to 25%. The 2012 decline thesis is abandoned in favor of 16% growth and, given the likely competition in smartphones, you tone down growth in 2013 to 6%.
It's November 2011. The company turned in 83% growth. It's more than three times faster than your forecast. Some people are suggesting that Apple may have a lot of headroom with the iPhone and iPad but the law of large numbers is what it is. The company became the largest by market cap in the world and Android is gaining huge market share. However, in deference to their strong recent performance you increase the 2012 forecast from 16% growth to 24% growth. 2013 goes from 6% to more than double: 13% and 2014 is when growth begins to slacken, though still a healthy 8%.
As the following chart shows, look ahead one year accuracy has not been all that great, but you are at least consistent. In any case, everything you based your decisions on showed remarkable consistency with consensus. You're just reflecting common sense.
Note:
Though the numbers are all real, the narrative is fictitious. I suspect however that the truth is actually stranger than this fiction.
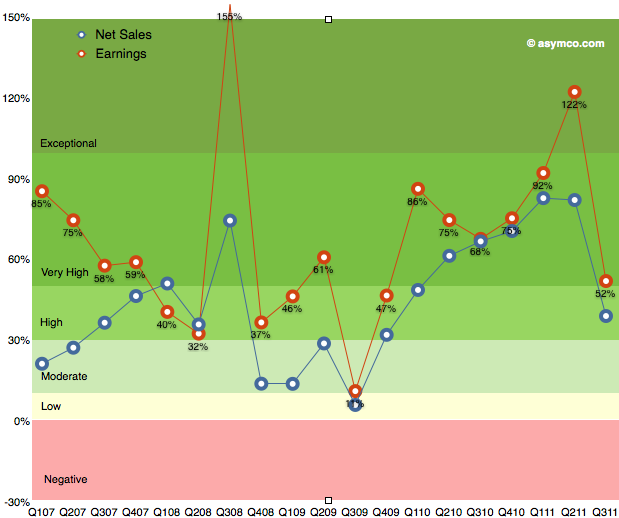
As the chart below shows, the last quarter (third calendar, fourth fiscal 2011) was slow with only 52% earnings growth. The discussion centered on the (surprisingly) disruptive effect of the iPhone transition. Surprising since most analysts, myself included, were lulled into thinking that the portfolio of iPhones and their wider distribution would create a smoother sales pattern vis-a-vis the more cyclical pattern seen in the first three years of production.
The second quarter was surprisingly strong and the third was surprisingly weak. So how do we estimate the fourth?
We have the pent-up demand for the new iPhone, we have the dynamics of holiday spending and we have a question mark on pattern of growth for the iPad. I'll discuss each assumption in turn:
The first assumption remains that iPhone growth is approximately 100% for the full year. Last calendar year there were 47.5 million iPhones sold. A 100% growth would imply about 95 million for this year. So far 56 million were sold. To reach a doubling then 39 million would need to ship in Q4.
Another approach is to look at quarterly growth rates. Thus far, we've had 113%, 142% and 21% for the first three quarters. To reach an average of 100% for the year then the fourth quarter would need about 120% or 36 million units.
36 to 39 million would be a good bounding range if there were no other mitigating factors. The information published so far shows no particular problems with either production or access to markets so I'm going to go with 35.7 million.
The second major assumption relates to the iPad. The iPad has been a challenge to predict since launch. Not only is it a new category but it comes with a different launch cycle than the iPhone and has significant constraints on production. There have been only two quarters where we could measure y/y growth: 182.8% in Q2 and 165.6% in Q3. I was initially tempted to dial in 150% for Q4 but the question of transition comes up. The first iPad model grew well into the holiday quarter but dropped dramatically into the first as it went through the transition to the iPad 2.
Are we going to see the transition effect earlier this year? I'm being cautious and suggesting only 100% iPad growth or 14.6 million units this quarter. This is still a very challenging product to forecast.
So here are my fourth calendar quarter forecasts (with y/y growth in parentheses):
iPhone units: 35.7 million (120%)
Macs: 5.2 million (27%)
iPads: 14.7 million (100%)
iPods: 13.6 million (-30%)
Music (incl. app) rev. growth: 22%
Peripherals rev. growth: 25%
Software rev. growth: 25%
Total revenues: $44.6 billion (growth: 67%)
GM: 42.0%
EPS: $12.3 (91%)
This earnings value would imply a trailing twelve months' EPS of about 33.5. At $390/share the P/E would be 11.6. Cash and equivalents may increase to $90 billion.
There are several methods I turn to when estimating device sales.
Top-Down Demand analysis
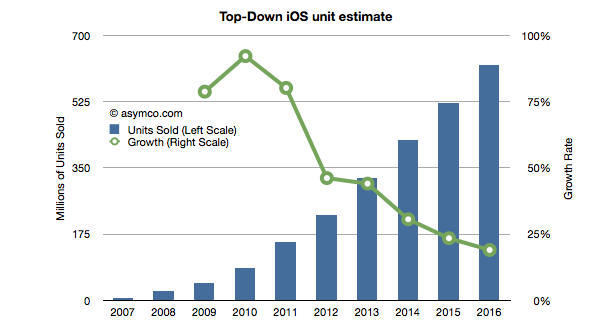
The first is to look at so-called top-down views of the demand. This method takes a view of the overall phone market and assumes share for smart devices and, further, shares for individual platforms. There are several estimates out there. The most recent is Ericsson's Traffic and Market Data Report, released November 7 2011.
It concludes that in five years' time mobile subscriptions will reach 8.4 billion of which smart devices (incl. tablets) will total 6.2 billion. As iOS has approximately a 250 million install base at end of 2011 and as the total base from Ericsson's estimate for 2011 is 1.44 billion then Apple's share is approximately 17%. If we assume that Apple will be able to increase smart device share to 20% (3 percentage points in five years) then by 2016 Apple will need to have 1.24 billion iOS subscribers.
Assuming that half the installed base upgrades every year and Apple adds devices required to reach the install base necessary (1.24b or 20% share) leads to the following unit sales projection (I've added 2008 through 2010 actuals and 2011 estimates based on my own current Q4 projections).
This Approach yields an estimate of 225 million iOS devices to be sold in 2012. Note that the growth is linear which is not usually the case. Typically this growth is in the form of an S-curve which front-loads the volume in the more recent periods.
Production Estimates
The second approach is to look at supply. I use this method for Apple as I consider their devices to be supply constrained and thus look at historic performance to forecast their production ramps. Put another way, I try to answer the question of how quickly Apple can sustain growth in production given their yearly product cycles. I can also use capital expenditures (which the company releases in advance) to forecast device production as the two have been closely correlated in the past.
Using this method I currently estimate 260 million iOS units for 2012.
Customer behavior estimates
The third approach is to attempt to measure customers' loyalties and competitiveness of vendors. If we know the probability of upgrades and the historic split between "new" and "existing" users then we can roll the forecast forward.
To start, we need a probability of upgrade which can be obtained from surveys which measure "loyalty" by asking the intention of sticking with the brand on the next purchase or a measure "satisfaction". iOS product score in the high 80% to 90% range.
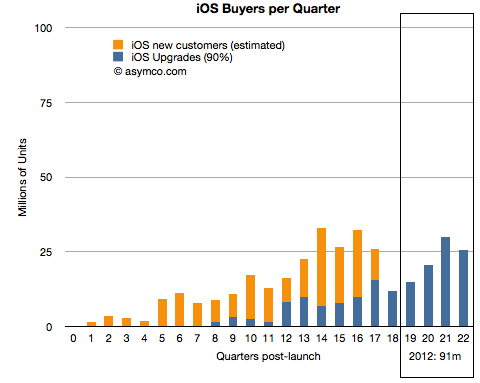
The following chart shows total iOS units sold and the ratio of upgrades (assuming 90% upgrades for 2 year old purchases). It also forecasts upgrades based on current installed base.
If 90% of iOS users upgrade two years after their device purchase then next year will result in 90 million iOS devices sold to existing users.
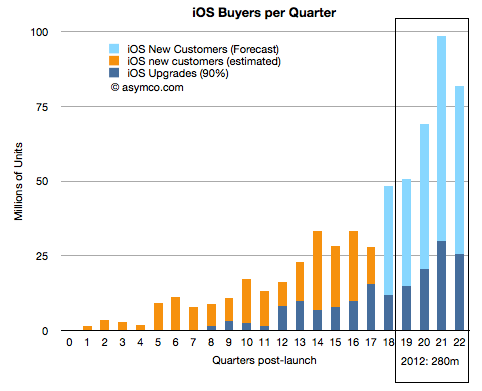
Given the ratio of new users to upgrades in the past, and if we assume some reduction in that ratio over time, we can obtain a measure of "new users" on top of the upgrades. (In other words we forecast forward the ratio between the dark blue and orange lines above).
The ratio of new to upgrades has varied significantly from 30x to 0.8x upgrades. I created a schedule where the next quarter will be 2.1x, then 1.44x, 1.36x, 1.28, 1.2x for the quarters of next year. The result is shown below:
This yields a forecast of 280 million iOS devices to be sold in 2012. The forecast is very sensitive to the ratios shown above so obviously this is not going to be very accurate but it's interesting to note that the three methods yield growth rates of 46%, 69% and 82%. All three are far above the growth forecast for Apple (about 25%).
On October 27th, Nintendo published half year results for the fiscal year ending in March 2012. Management stated that the company lost over $900 million with a negative outlook. Nintendo cited weaker than expected sales of Nintendo DS hardware and 3DS software and Yen appreciation as the main reasons for the miss. Is this the end of Nintendo?
Before we look more closely, here is a quick summary: The company is exclusively involved in selling game hardware and software. Their console platform is the Nintendo Wii, which will be followed by the Wii U late in 2012. The Nintendo DS and Nintendo 3DS are the company’s portable game consoles. The Wii and the DS are nearing the end of their product cycles. On the software side, the company is known for gaming titles such as Super Mario and Zelda. Nintendo also pioneered the licensing model to allow third-party developers to produce games for its hardware products.
A closer look
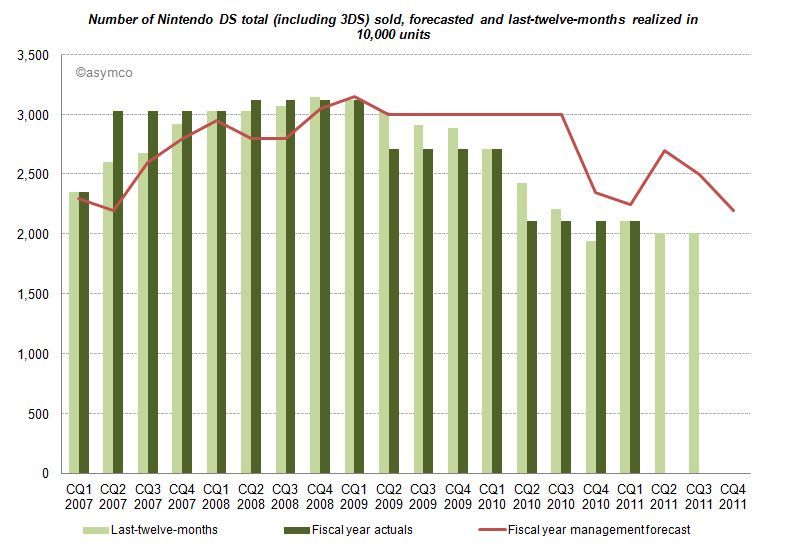
The good news for analysts is that Nintendo publishes their estimates for hardware and software unit sales. This allows us to measure management predictive accuracy. The red line (management forecast) should be as close as possible to the dark green pillars (realized unit sales in the fiscal year).
Until CQ1 2009 devices sales grew in excess of forecasts. A similar pattern can be found for consoles and game titles. After Q1 2009 forecasts have been always higher than results, and more worryingly, the deviation between forecast and sales is widening. Management missed and lowered forecasts for two consecutive years. Management's hope for an increase on the back of initial 3DS sales in the launch quarter (CQ1 2011) did not come to pass and they subsequently lowered forecasts again in the following two quarters.
Looking at all categories, management lowered forecasts almost continuously. The deviation remains the largest in the portable hardware business segment indicating that management was largely surprised about the development.
What caused this reversal of fortune?
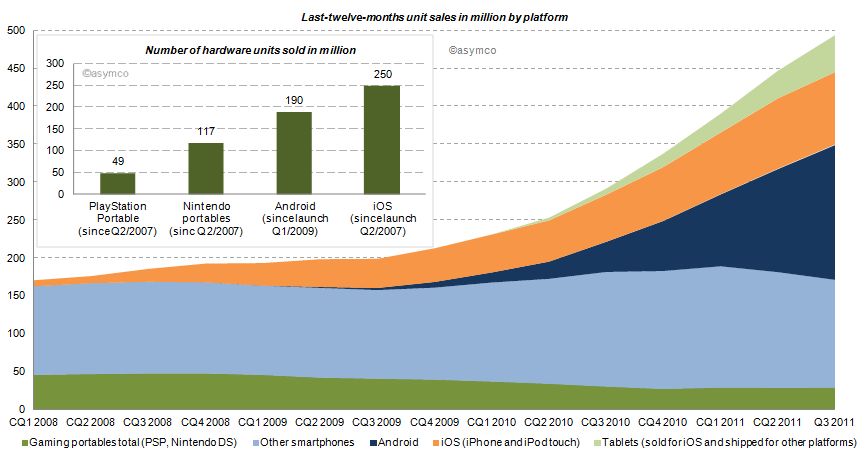
Two years earlier the iPhone had launched and by CQ1 2009 iOS reached an installed base of about 38 million, half the number of Nintendo portables in the same period. Furthermore, in CQ1 2009 Android phones came to the market. Smartphones (light blue area of the chart below) sold before (and after) the debut of iOS, but the iPhone redefined the category and an avalanche of smarter phones running iOS and Android followed (blue and orange area). Portable gaming devices from Nintendo and Sony declined ever since: 17% in 2009, 31% in 2010 and already 16% in the last twelve months.
How do the game players stack up?
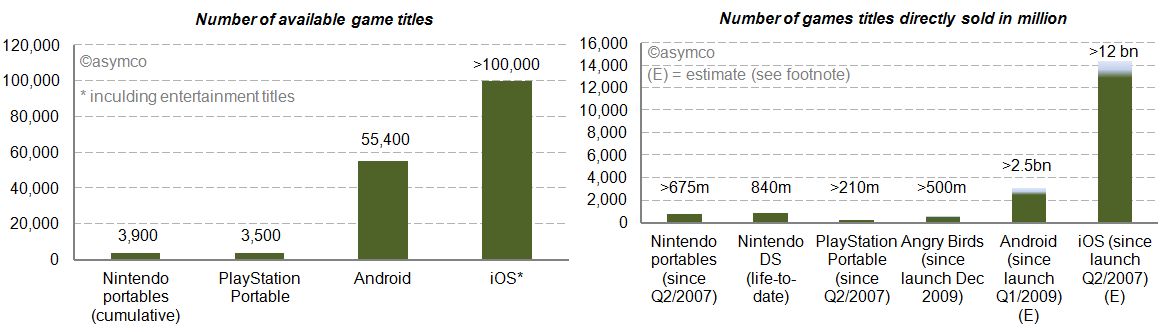
We already looked at the installed base in the chart above. iOS and Android have outsold Nintendo portable units by a factor of 2.1x and 1.6x. Furthermore, we can see (in the charts below) that the two main mobile platforms have 14 to 26 times more game (and entertainment) titles available. Nintendo and Sony also publish unit sales of directly sold software titles. For Android and iOS we know the cumulative app download statistics. By taking the share of Septembers’ paid and free app downloads as a proxy, we can conclude that also by this measure Android and iOS dwarf Nintendo and Sony [1]. The reach of iOS and Android is further underlined by the more than 500 million downloads of Angry Bird game titles - first released only two years ago - for any platform having sold more than twice the amount of Sony’s cumulative portable game titles and almost as many as Nintendo’s cumulative games titles since Q2/2007.
Who else has skin in the game?
Besides Nintendo, Sony, Apple and Google, who else is making a push into mobile gaming? Before investigating, let’s first have a closer look at Sony. Sony, just like Nintendo, is also active in stationary gaming segment with the PlayStation franchise. The Sony group also has access to entertainment most notable through Sony Pictures Entertainment and Sony Music Entertainment. Furthermore, Sony recently decided to buy Ericsson’s stake in the mobile phone joint-venture Sony Ericsson and is making a push with Android to bring its gaming titles as a differentiator for its own products to the platform. And the other major suspects? Microsoft, also active in the stationary gaming segment with its Xbox franchise, is pushing to bring the Xbox experience to mobile phones with Windows Phone. Amazon has retailed software and games for years and has started to distribute software and games via direct download on its own Kindle devices but also for the Mac. On the Kindle, Amazon is relying on a forked Android version on which it leverages its eBook and other entertainment assets. And then there is Facebook, a social network that wants to be on any platform or device. Out of 800 million users, 350 million access Facebook via a mobile device. Around 50% of Facebook members play games on the desktop. With Project Spartan, Facebook is aiming to bring the desktop experience to the mobile device including a stronger focus on gaming and video.
The competition between Apple and Google is already asymmetrical. Including the other contestants in the competitive landscape reveals Nintendo’s key weaknesses in the portable gaming market: attraction as a platform for developers in terms of ease and reach, pricing of hardware competing with operator-subsidized mobile phones and the jobs-to-be-done or value preposition. The new generation of mobile devices is standing against Nintendo’s dedicated approach. Although slowly adding features such as a browser and “app store” to its portables, Nintendo devices fall short in the variety of jobs-to-be-done compared to smartphones, let alone making a call.
Average selling prices and financial impact
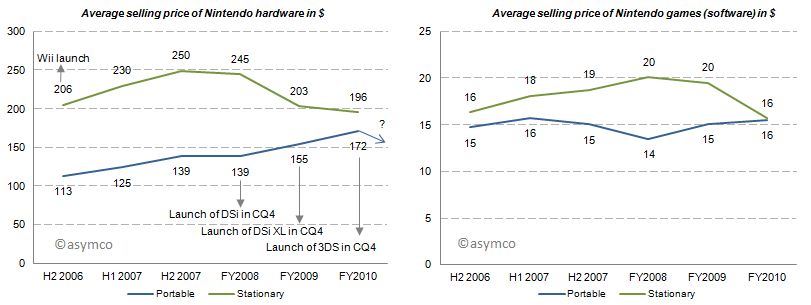
With this market pressure one would imagine that average selling prices decreased for Nintendo portables. But for the last three fiscal years average selling prices for portables have increased, all things equal, mainly due to new product launches. Game title’s average selling prices have remained relatively flat. Note that these are wholesales prices for hardware and a mix of retail and wholesale prices for games. In 2011, for which we do not have data yet, the price of the newest portable, Nintendo 3DS, was lowered from its U.S. debut of 320 250$ in February to 170$ in July which will have a negative impact on ASP going forward.
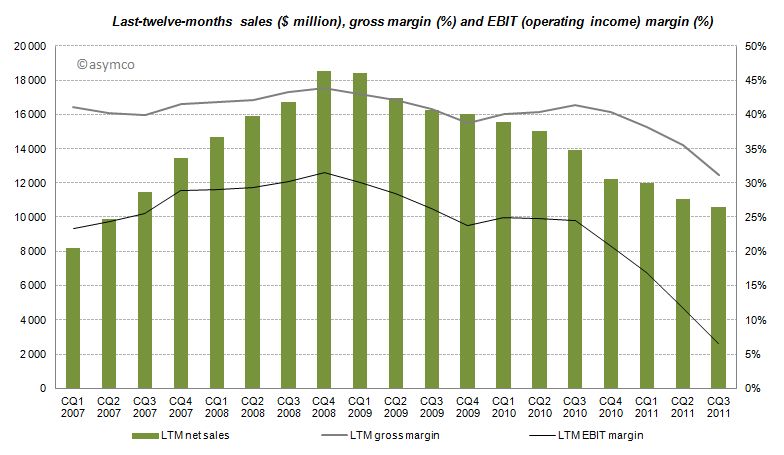
The effects of Nintendo’s rigid strategy and the fast changing competitive landscape are manifested in the devastating financial performance over the recent quarters with LTM sales, gross margins and EBIT margins declining starting from CQ4 2008 and even accelerating to decline after CQ3 2010.
Furthermore, even though the company has recognized its own difficulties, Nintendo has no intention of adjusting its strategy:
CEO Iwata on the question of whether Nintendo plans to bring its game library to other platforms:
This is absolutely not under consideration. If we did this, Nintendo would cease to be Nintendo. Having a hardware development team in-house is a major strength. It’s the duty of management to make use of those strengths. It’s probably the correct decision in the sense that the moment we started to release games on smartphones we’d make profits. However, I believe my responsibility is not to short term profits, but to Nintendo’s mid and long term competitive strength.
Although realized and obvious, the disruption’s invisibility is often manifested in the paralysis of the incumbent.
Conclusion
According to Isaacson, Steve Jobs apparently always worried who could eat Apple's lunch. The lunch of the iPod, he concluded, was ripe for mobile phones. Subsequently, Apple entered the mobile phone space. Google followed. Since then more powerful mobile phones have eaten the lunch of the dedicated gaming device. The jobs-to-be-done and their priorities in people’s life have not changed, but the tools people use to get them done have. Permanently.
---
Notes:
Estimated by multiplying total cumulative app downloads with September’s share of game downloads: For iOS ranging from 72-80% based on Top 150 free and paid app downloads, for Android ranging from 38-47% respectively. This is a very crude estimation, but the gist of it is that 4% for iOS and 11% for Android game downloads as percentage of cumulative app downloads would outsell Nintendo.