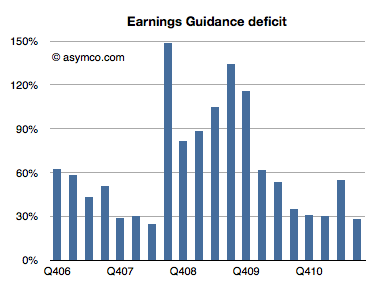
Every quarter Apple's management issues a "guidance" or forecast of their own earnings in the following quarter. Over the years, this figure has been nearly useless because not only is it not accurate, the error itself has been wildly variable. I plotted what I call the Earnings Guidance Deficit for Apple based on the formula (Actual EPS diluted - Guidance)/Guidance.
The higher the value in the bars above, the more the company underestimated (or under forecast) its performance. Note that during the recession the company routinely offered guidance at half the level they actually delivered. After the recession they returned to a more reasonable ~30% under-reporting.
The problem with this analysis is that there is such a high volatility in this factor that we can't count on it to predict where earnings will fall. Even if we saw a range bounded at 30% to 60% the usefulness of this would be very low as that is far worse than the range that analysts can get through other means (Deagol's accounting of analyst error). The best thing we can say is that the range seems to be bounded by 30% and 150%.
Rather than using this history for precision, perhaps it makes more sense to assume that the lower bound offers at least some limit to the possible value of next quarter's earnings. Maybe it can give us a "sanity check" for our own estimates.
For the next quarter Apple guided $9.30 per share. If we assume a 27% "deficit" which is at the lower end of the range above then the earnings are likely to be about $11.8.
That's equivalent to an 84% growth in earnings year/year. It would also imply $33 for the 2011 calendar year. At the current share price of $384 that implies a P/E of 11. That happens to also be the P/E for Apple at the trough of the recession in January 2009.
In other words, if the stock price does not rise (or falls) from the current level by the time earnings are reported in late January, then the P/E for Apple may drop to less than 11 on growth of 83%. That's a sanity check all of its own.
There has been increasing chatter about a new TV being developed by Apple.
My opinion on the subject was summarized in the post called Tele Vision. I contend that a TV cannot be smart until the content it delivers becomes smart. The logical conclusion is that the value chain needs re-integration so that the component which is not good enough (the content) can be improved along the dimensions that users value. And it cannot be improved unless the direction it needs to go into is aligned with the direction of the disruptive innovator. I won't repeat the theory here, but it suffices to say that whatever will change television will do so by re-defining the core product not just the tools we use to consume it.
But today I wanted to address another question: how do we value the opportunity? In a back-of-the-envelope manner, can we tell if this business is big enough to try to fix.
The answer depends a lot on the business model of the disruptive entrant. The entry could depend on software or advertising or hardware or distribution, and each would have a different valuation.
But for the sake of calibration, I want to start with a proxy. The basic question of how many "terminals" exist to the value networks. How many units of TVs are sold and how many could a new entrant convert to a new paradigm?
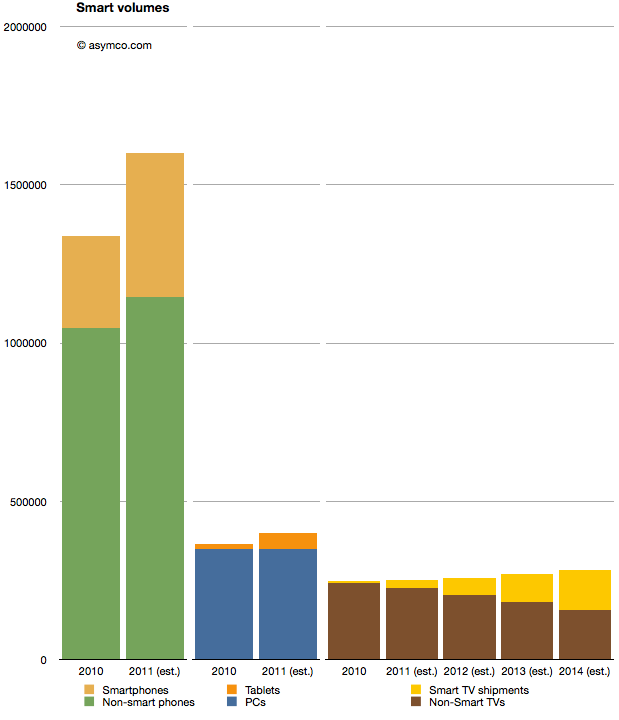
I prepared the following chart showing the world-wide TV market with a highlighted subset of so-called "smart TVs" (source TRi). The market is shown from 2010 actuals through 2014 estimates. To make it more interesting I also added similar data for two other markets. Mobile phones and PCs with their own sub-categories of smartphones and tablets as equivalent "high growth" opportunities.
When considering the opportunity, the Smart TV volumes are small relative to either tablets or smartphones. 2011 shipments are expected to be around 25 million Smart TVs, vs. 454 million smartphones and 51 million tablets. Looking forward, it seems that even by 2014, smart TVs will be smaller volumes relative to either (projected) smartphones or tablets.
A reason for this is that the TV market is not that big. It barely reaches 280 million units in 2014. Having reached saturation, the rate of growth is never assumed to be greater than 5%. The growth in the Smart TV business is assumed to be much higher however, being at least 100% in 2012, though off a low base.
But the concept of what "smart" means in this forecast is troubling. Christina Bonnington at Wired highlights many of the failings of Smart TV.
“In most cases consumers are buying a television with Internet connectivity as insurance. In other words, they are buying them just in case they need it in the future,” says Van Baker, a vice-president at the research firm Gartner. “Less than half of Internet connected televisions actually get connected to the Internet so clearly consumers don’t yet see this capability as a must have feature.”
There is vast under-consumption even if the devices are being purchased. This looks eerily familiar to the smartphone market before they became usable by the vast majority through the transformative touch input method.
So this market seems to be ripe for some serious re-definition. It may not be large today because there is nothing worth buying. Absent any innovation the forecasts can only foresee more of the same. If there is a breakthrough which "cracks" this puzzle then we might indeed witness unforeseen opportunity.
Prior to the third quarter earnings report I discussed a part of Apple's balance sheet related to tangible assets (Plant, Property and Equipment). In a series of three posts I covered the Land and Buildings (data centers and campuses), Leasehold Improvements (store investments) and Machinery, equipment (tooling and factory equipment as well as servers.)
The data shows that there is a consistent pattern of investment in pursuit of strategic goals: extending reach into distribution through stores, extending services through cloud infrastructure spending, and extending control over the supply chain. One story that still remains largely untold is how much does Apple know in advance what it will spend.
In other words, can we tell if Apple can anticipate demand and does it plan its expansion well in advance?
For an answer, the 10 K report comes in handy. Published only once a year, this document shows some data that is not present in any other public release. For example, Apple makes forecasts for capital spending.
But first, an update.
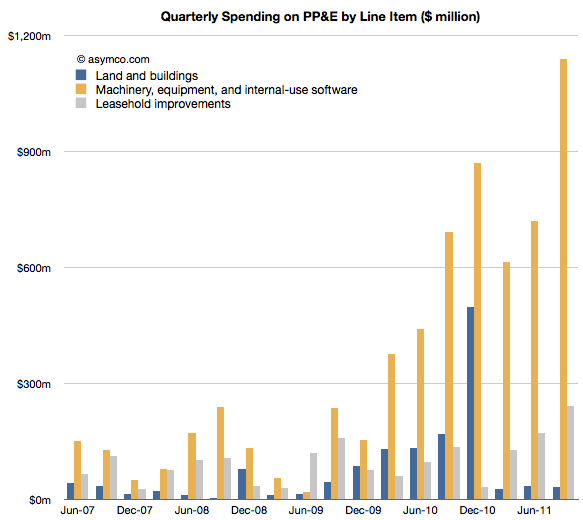
Since the last discussion on PP&E, Apple reported third calendar quarter data. The 10K offers the details on how much was spent in the last quarter. Leasehold improvements increased by 240 million, a new record high. That might have gone into the 30 new stores opened in the quarter but it also signals more openings and renovations still to come.
Land and buildings did not see any significant increase ($31 million).
Machinery and Equipment growth was explosive. Over $1.1 billion was added to the value of those assets. The previous high was $868 million in Q1, presumably getting iPad and iPhone production ramped. The total for Q3 is about half of what was spent in all of 2010. The chart below shows the three items:
The increase in M&E foreshadows increased device production so, while not very precise, it gives an idea that volumes are expected to be substantially higher in the following quarter. More about this when I make my forecast.
Now I want to focus on Apple's ability to forecast its own production. As I mentioned, once a year, Apple predicts its CapEx. That prediction is broken down further by Retail expenditures and M&E+Real Estate. Let's look at Retail first.
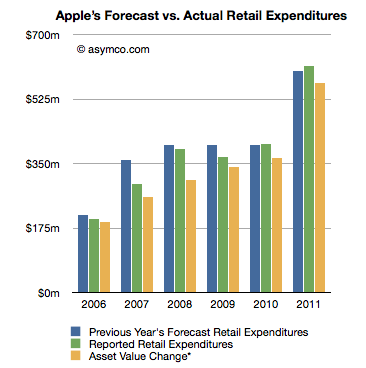
The following chart shows three bars: a previous year's forecast (from the 10K), reported expenditure (from the next 10K) and my own running estimate based on asset value changes.
If we consider the forecast as a "budget" for the next year, what can be observed is that the spending was closely "within budget".
Going by reported expenditure, the company was within 1% of expected budged for store spending in 2010 and 2% in 2011. It underspent for the years 2006 through 2009, though again, but modest amounts.
What this suggests to me is that store roll-outs are predictable for Apple. The costs involved are also quite predictable and things seem to be happening on schedule. The retail expansion is a steady slog.
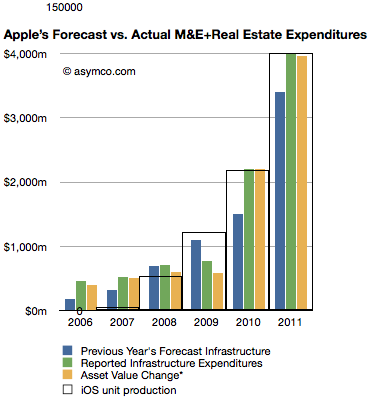
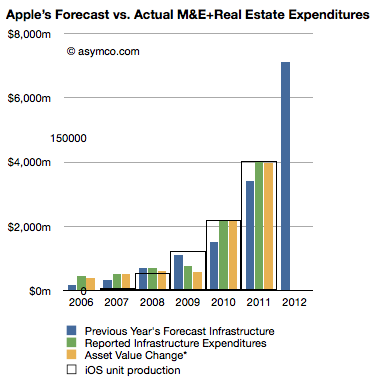
The next chart does the same comparison but with Machinery and Equipment and Real Estate.
Here the story is different. The company has typically over-spent what it forecast.
Here are the "deficits" for this asset class by fiscal year:
2006: 154%
2007: 68%
2008: 0%
2009: -30% (surplus)
2010: 47%
2011: 18%
This suggests that unlike retail, production for Apple has been far less predictable and that the predictions for spending were mostly lower than actuals. It might imply that production was higher than expected as well.
What this analysis suggests overall is that although production (and spending) are increasing, the rate of increase is a bit higher than what Apple expects a year in advance. Some of that might be due to increased costs, but some may be due to changes in capacity.
Note the iOS unit production "wireframe" bar chart overlaid on the expenditure chart. As with quarterly data, the yearly (fiscal) production ramps remarkably consistently with M&E expansion.
Looking forward, the company predicts $8 billion in PP&E, exactly twice what it forecast last year. Retail expansion is forecast at $900 million an increase of 50% and "Infrastructure" (M&E) increase of 110% to $7.1 billion.
Knowing that Apple tends to over-spend on M&E, we can assume that they will at least double spending on machinery and equipment. Knowing further that increase in M&E spending correlates to iOS device production (see chart at left noting the inset scale marked with 150 million units), it implies that iOS device production is set to continue growing at the same rate it always has: 100%.
Last week I proposed that there were two significant markets for the new iPhone: 1) the existing iPhone user base 2) smartphone "non-consumers". Today I want to dig a bit deeper into the first market to get an idea of what it amounts to.
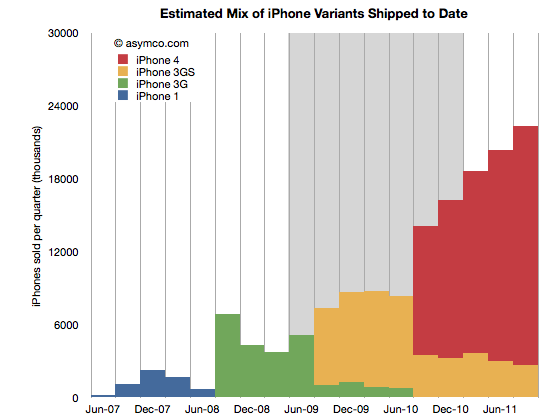
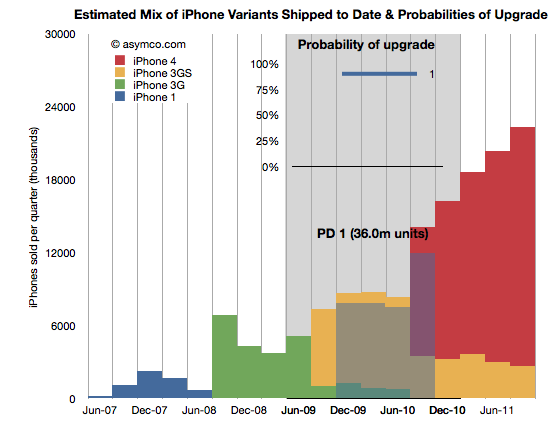
The following chart shows the total iPhone shipments over time with an estimate for the mix of models during the last two years.
The way I calibrated the mix is by taking into account the statement that Tim Cook made that half of all iPhones shipped were iPhone 4. I first estimated that this past quarter (ending September) included about 22.3 million units. That makes the total iPhones to end of Sept 151.3 million. Half would be about 75 million. Therefore the red area needs to add up to that total. The remainder must therefore be the yellow, 3GS volume.
This mix implies that the following shipments by variant (through end of Sept 2011):
iPhone 1: 6.1 million
iPhone 3G: 24.4 million
iPhone 3GS: 45.4 million
iPhone 4: 75.4 million
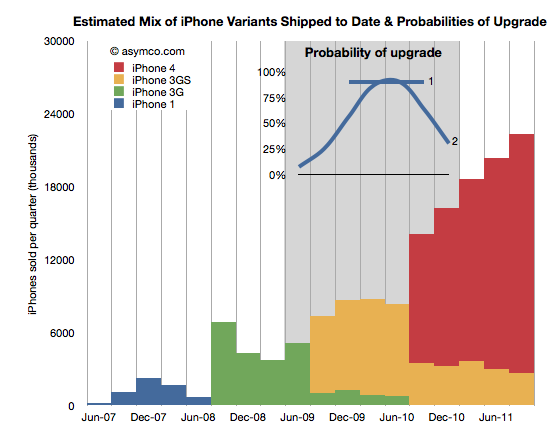
I also highlighted in grey the most likely target market for upgrades during the next 12 months. What I'm assuming is that recent buyers will not be likely to upgrade but those having purchased an iPhone two years hence will probably be looking to replace it. The naive approach is to assume all the iPhones beyond a certain age will be automatically upgraded. That would give almost 70 million units. However, not all those phones are in use and many of those phones may have already been upgraded to iPhone 4s. 70 million is a theoretical maximum. We have to be more specific.
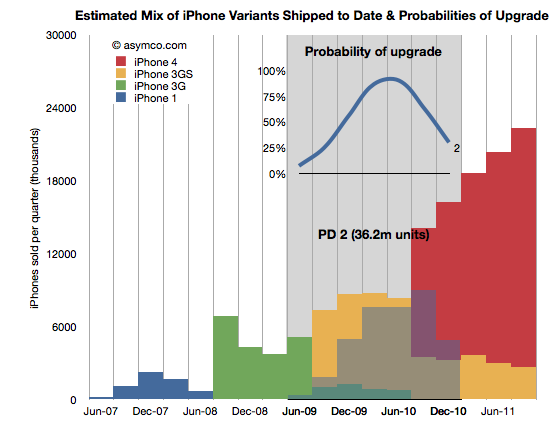
In order to get a better figure for this I created a probability distribution (PD) which suggests the likelihood that the phones purchased in that quarter get upgraded in the next 12 months. I created two such PDs illustrated in the inset chart below:
PD 1 is the simplest. It assumes that 90% of two year old iPhones will always be upgraded. PD 2 is a bit more nuanced where it assumes that there is a range of probabilities over a wider period, but with a peak in the 2 year old zone. These PDs are guesses but consider them starting points for debate.
By multiplying the probability in the line chart (PD1) with the area below it (the units it covers) we get get the shaded area indicating which phones (and variant) will be upgraded next year.
The areas not shaded are either left un-upgraded or represent phones which were already upgraded to iPhone 4's last year. The PD1 assumption yields 36 million units.
Doing the same with PD2 yields a different upgrade set shown below:
This assumption leads to about 36.2 million units upgraded in the next 12 months. Very similar to PD1 but approached from a different angle. Are these figures credible? I don't know. The real PD may be quite different but I think these are pretty conservative figures. They are about half of the theoretical maximum.
Why is this Interesting?
This is interesting because of two reasons.
Firstly, it lets us calibrate our forecast for iPhone sales next few quarters. My own estimate stood at 140 million prior to this analysis. Is it reasonable? Remember that the target market includes non-consumption or non-iPhone, non-Smartphone users. Given the "guaranteed" market above at least 36 million, it makes the non-consumption target about 104 million. Does it sound reasonable?[1]
Yes. Primarily because most iPhones sold during the last 12 months were sold to non-consumers. And there were 76 million of them. Apple's distribution has increased since and will continue to increase[2]. That means that Apple does not need to stretch much more than it already has to get the additional growth from un-penetrated markets. We know that this market is still measured in the billions of users. The demand is there.
Secondly, this is interesting from a competitive point of view. When competitors like Microsoft claim that Apple left open an opportunity by not launching a new iPhone "5" they are not looking at the world through the lenses shown above. From their point of view each new phone sold must come from their installed base or non-consumption.
But they don't have any installed bases over 2 years old looking to upgrade. There are few Galaxy users who are yearning to upgrade since they just bought their first units. There are no Windows Phone users (and no Windows Mobile users) who are ready to upgrade to Mango. Since they don't don't see the world through upgrade "lenses" they see their marginal buyer as somebody who might have bought an iPhone 5 because it was the latest and the greatest in terms of specs or novelty.
However they cannot be hopeful that any existing iPhone buyer will switch because they know the satisfaction scores are above 90%. They also know the legendary Apple brand loyalty that keeps Mac and iPad and iPod users glued to their devices. They are also aware of the moats of iTunes, iCloud, hundreds of installed Apps and iMessage all designed to preserve Apple's customer base.
Competitors have none of these things. They don't have upgraders, or switchers to target. They can only target non-consumers. There their odds are better but Apple's are at least as good.
---
Notes:
The 140 million target for next 12 months is probably well above consensus. It assumes a growth rate of 84%. I've seen a few estimates where the growth is forecast at less than 30%. If we are to believe the analysis above, the consensus begins to appear catastrophic.
Apple's distribution measured as number of carriers and countries covered is still about half that of RIM and about a third that of Nokia or Samsung.
Yesterday Nokia warned that its guidance for the quarter and the year were "no longer valid." The surprise to me is that management was surprised. In February I warned that even if Nokia could fool consumers into buying products whose platform was publicly executed, distributors and operators would not likely go along with the deception. Pricing collapse is the proof of a channel breakdown.
That seemed predictable. What I struggled with was how Nokia itself could present such an optimistic forecast. Absent any explanation, Nokia's forecast of robust sales for Symbian products into the near future belies a failure of understanding of the dynamics of platforms and especially the impact of destruction of trust and brand value that commenced in February. Distress is a slippery slope and it does not model well in a spreadsheet. It takes a leap of non-linear faith to predict the piling-on effect on the up- and the down-side.
Faith in the company's guidance meant that the market reacted to the bad news by discounting Nokia down to a market cap of $26.7 billion. One analyst even cut his target price down to $4/share, 57% of yesterday's close. How can this fair? What is Nokia's phone business worth?
Here's a quick sum-of-the-parts analysis. After yesterday's hair cut Nokia's overall enterprise value is about $20 billion. The Navteq part of the business (purchased for $8.1 billion in 2008) could get a value of $3 billion (based on about 3x sales) and the value of Nokia Siemens networks could be at $6b (less than 0.5x sales). That makes Nokia's phone business worth about $11 billion.
An alternative view based on "the Motorola case study" $4 target price would imply an overall enterprise value of $11 billion. This either makes Navteq and NSN worthless and Phones worth $11 or it makes the phone business worth a lot less than $10 billion. Perhaps less than $8.5 billion which is what Microsoft paid for Skype. Should we be shocked? Nobody would argue that Nokia is worth more than Facebook so who's to say that Skype or Twitter aren't more valuable than a device company in crisis?
I don't try to predict the market's behavior, nevertheless, the markets are now very skeptical that there is much in Nokia to salvage. It's perhaps unfair and illogical but this is the end game of disruption. It ends much more suddenly than it begins. It's the consequence of nobody noticing the beginning that makes the end so shocking.
As chronicled here, this quarter I went through three sets of estimates. This is a departure from my standard practice of sticking with one forecast made three months in advance. I felt last quarter was filled with materially important developments which deserved updating.
So how did I do?
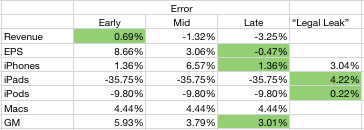
I wanted to see if the additional information helped or hindered predictability so I put my three predictions side-by-side and measured the errors. I also added the "legal leak" from April 15th (published April 19th) to see whether it was an accurate predictor. The table below shows the error rates with the lowest error highlighted.
It's clear that my error rate decreased as new information was used. It's also clear that the "legal leak" was very accurate. What follows is a discussion of each line item.
The iPhone forecast was very accurate both early and late in the quarter. At 1.36% error it was even lower than what was leaked by Apple. I used the information about China and Verizon to boost sell-in and increased the growth rate to 110%. That proved to be the right call. I did not pay any attention to talk of component shortages as I did not consider them to affect Apple whose market share of devices is so low. I would score my "late" estimate as an "A".
Even though I disclaimed it, my iPad forecast was very inaccurate. In contrast, the leak was very accurate. Although mitigated by the higher sell-through (5.1 million) shipments were constrained by the change in product. Details like the date of shipment, the date of announcement and the ramps made this a particularly difficult transition to predict. At 36% error, I score it as an "F".
The iPod error was about 10%. That's mediocre. The product dropped in sales by 17% (vs. 10% expected). Again, the mitigating factors, like higher mix of iPod touch and thus increased prices helped to keep the financial performance decent. I score this as a B-.
The Mac prediction was accurate. The error was less than 5%. I will discuss the Mac business in a separate posting but it suffices to say that the growth was excellent but predictable. I score my prediction as an "A-".
Revenues were reasonably predictable however pricing seems to have been affected by exchange rate volatility. The iPhone turned out to have a huge average selling price ($660) which made up for the lower revenues from iPad. The error of 3.25% is acceptable. I score it as an "A".
The Earnings number was very accurate. The error for the late estimate was less than one half of one percent. This bottom line number is a function of all the other numbers so it's the most encompassing. You have to account for factors like interest income, changes in the number of outstanding shares and tax rates. None of these are predictable. However, I was lucky. With an error below 1%, I rate this as an "A+".
My overall performance as a grade point average would be 3.43 or B.
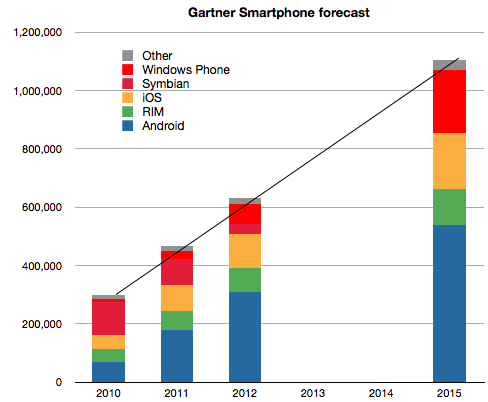
They published a four year forecast with seven significant digits of precision (implying a margin of error of 0.00001%).
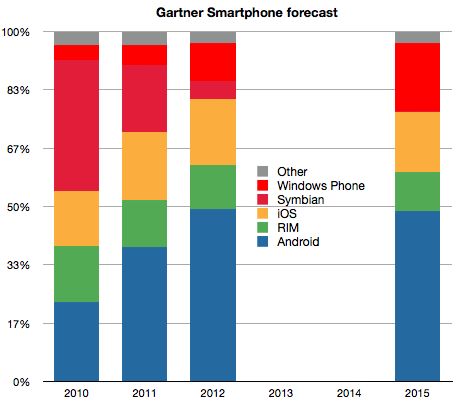
There is a linear growth in total market size.
There are no significant share changes after 2012.
The latter two claims are illustrated below:
Notwithstanding the defensibility of these claims Gartner analysts makes some further assumptions (quoted verbatim).
"Apple will be interested in maintaining margins rather than pursuing market share by changing its pricing strategy"
"RIM’s migration from BlackBerry OS to QNX which is expected in 2012"
"Nokia will push Windows Phone well into the mid-tier of its portfolio by the end of 2012"
These assumptions may be valid, but from where I'm sitting, the first assumption contradicts Apple's COO, the second would be an engineering marvel and the third would be an organizational miracle.
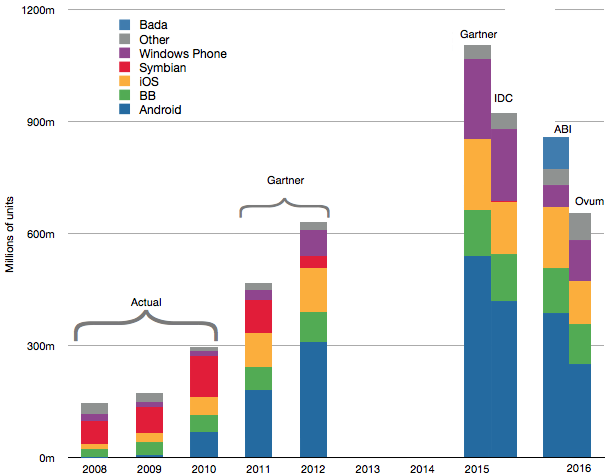
Putting together all the long term forecasts with what is already known about the market history gives the following combined forecast.
At the risk of repeating myself, the only thing I can summarize from this collective wisdom is that the over-riding assumption in forecasting seems to be that the future is an extrapolation of the present. That would indeed be a miracle.
It's a great misfortune that we don't have data about the future. It makes it hard to tell what's going to happen.
It's even harder because although sometimes we have data about the past, the past and the future don't always look the same.
Clearly that's what makes predictions about mobile computing platforms tricky. Nothing that has happened recently had been predicted by those who had tried to do so in the past.
The difficulty is compounded if trying to forecast in the long term like 4 or 5 years ahead. The tendency is to extrapolate what has been happening to date.
It's tempting to project whatever trends one sees into the future. The problem is that some trends are more visible than others.
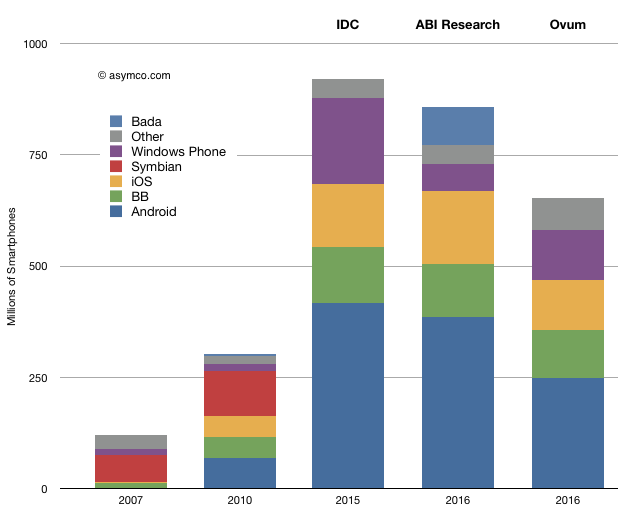
For example, let's look at the following three forecasts (IDC, ABI Research and Ovum) projecting platforms for 2015 and 2016. Although there are some differences in magnitude of the entire market, there is a strong similarity between the forecasts and with the current trends[1].
However, when comparing what was happening in 2007 with the market three years later[2] it's clear that most of the change was from the entry of iOS and Android (and a large expansion in RIM as well.)
So how are we to be sure that there won't be another entrant between now and 2016? I presume the argument is that the market is "too big" for a newcomer to make an impact. This argument is equivalent to saying that some organizations are "too big to fail". That might has a right of its own.
However, the evidence has shown that no Goliath has ever stood for long against a suitably equipped David, especially in technology.
Given this knowledge, the pattern or trend that I see more than any other is that the future will be dramatically different than the past. This invalidates any forecast which assumes otherwise, including all those above.
---
Notes:
The primary difference seems to be with how to treat Symbian. Some forecasters are replacing it with Windows Phone while others are mixing in a bit of "other" and Bada into what used to be Nokia's share.
It's quite pointless to try to compare 2005 with 2010 as on this chart's scale (bounded by 1 billion units/yr), the size of the market and the size of each participant's share are indiscernible. As pointed out earlier, predictions from that era focused on PDA market shares and there was no agreed-upon definition of mobile computing competitors.
IDC released a new forecast for the worldwide smartphone market which included a long range forecast--all the way to 2015.
Most people fixated on the share data in 2015. Not hard to do since whoever wrote the press release highlighted this flashy headline. Putting aside the three significant digits of accuracy on every data point and the hard to swallow declaration that a painfully underperforming (in more ways than one) Windows Phone will overtake iOS and BlackBerry to become the second largest platform by units/year in 2015, there is much more to the report.
Using only the public data from the press release we can put together a pretty good picture of the transition being forecast and determine some of the (unstated) assumptions being made. It's these assumptions about the underlying market dynamics which illuminate far more than the falsely precise share data.
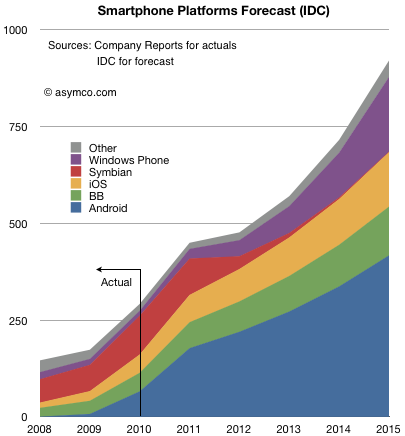
The following chart shows both historic platform performance (which is detailed in the Asymco Interactive data sets on a quarterly basis) and the forecast based on the given compound growth rate published.[1]
I see three main assumptions being made:
Nokia (or more precisely Symbian) share will be swapped for Windows Phone. The transition period 2011 to 2015 shows approximately 150 million Symbian devices will be sold which is the stated goal for Nokia. IDC is making an assumption that the hardware vendors will roughly maintain their respective shares irrespective of platform dynamics and that Nokia will switch its share of users from one platform to another in a predictable way.
iOS and BlackBerry will maintain share. Presumably this is also driven by hardware channel dynamics and relationships with carriers.
Android will grow share slightly but the vast bulk of growth will come from market growth.
Market growth is strong but undramatic.
Overall this is not a controversial set of assumptions.
Except perhaps that it assumes that the basis of competition in the market is unchanging. Of course it's well understood that the basis has shifted during the tumultuous 2007 to 2010 and forecasts made before the iPhone was launched sound absurd today.
But IDC says that the unpleasantness won't happen again. From listening to the conversations going on today on this blog and elsewhere, their assumption that things will not change (again) is fairly deeply ingrained, indeed conventional wisdom. In that sense IDC is not taking any liberties with the future. The projections of current realities onto the future leads to this type of forecast and status quo defenders should be satisfied, if not rejoice.[2]
However, there are a few more consequences of even this uncontroversial forecast which should make keen observers sit up and notice.
If we look at more than the before and after snapshots and comfortable pie-splitting sound-bites there are some profound seismic things being implied.
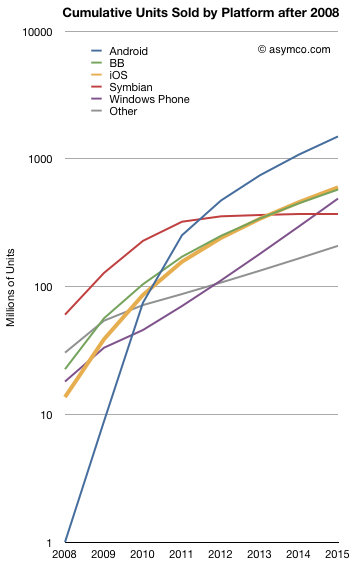
For example the entire market will be nearly 1 billion smartphones a year (in four years!). Even more startling, considering the "race to a billion" discussion we've been having, some of the platforms seem to be reaching that threshold rather quickly. The following chart shows the cumulative unit sales for the candidate platforms on a log scale:
Android is considered likely to break one billion units in five years post-launch. Windows Phone will sell nearly half a billion units and Blackberry will be well over that number.
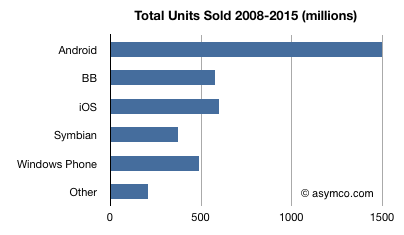
I tallied the cumulative platform unit totals below:
No less than four platforms will have sold half-billion units by 2015. The suggestion that Android will "win" by having the most units sold seems as hollow as the suggestion that Symbian "won" by having the most users in 2008. Not so much because it will go on to lose them, but because there were plenty of viable alternatives for users to buy and developers to build for. Half a billion users cannot be easily ignored.
So even "safe" assumptions can lead to astonishing results in this market. Namely, IDC is saying that the smartphone market will not have any platform losers.
There is one more thing the report implies. If you look at the ranking of leading platforms (by units/year) in 2008, 2015 and, with a little extrapolation, 2016/2017 you get:
Rank in 2008
Rank in 2015
Rank in 2016/2017
Symbian
Android
Android
Other
iOS
Windows Mobile
RIM
RIM
iOS
Windows Mobile
Windows Mobile
RIM
iOS
Symbian
Other
Android
Other
Symbian
In other words, there is a complete reversal being projected. An almost perfect flip: those on top end up at the bottom and those on the bottom end up on top. That's about as controversial as it gets. Pretty impressive for a set of safe assumptions.
--
Notes:
You should ignore the shape of the curve between 2011 and 2015 as it assumes the CAGR is applied to every year. Although the press release shows a CAGR, the actual report may include various fluctuation in yearly growth. The starting point of 2011 and the end result in 2015 however should be the same.
If, on the other hand, you believe that exponential growth, rapid gains in communications speed, new breakthroughs in interaction with devices, and entrants winning with new business models are causes for a disruption, then perhaps extrapolation may not be the way to forecast this market.
Apple's second fiscal quarter has just ended. Time for analysts to put forward their predictions for the quarter's report (due in about 3 weeks.) If history is a guide, the estimates will range quite widely and accuracy will be determined mostly by the ability of an analyst to predict iOS device sales (and iPhone most of all).
How hard can it be?
It depends on what you choose to prioritize as the proxy for sales. In competitive markets there is usually a constraint on demand and rivalry among suppliers. If that's your assumption you might want to use samples from the sales channel as a proxy. That means sampling distribution channels and sales through to end users at retail. You might even watch competitors and index them to each other using historic market shares.
In markets where demand outstrips supply, the best method would be to determine the constraints to production and measure those.
In Apple's case we know from company statements that Apple faces more demand than it can supply. That makes things easier for the amateur because she can just figure out production. In other words, the logical way to forecast Apple's iPhone sales is to guess how many they can make.
That is not trivial since production data is not public. However, we have historic sales data. We also can make assumptions about how much inventory is carried (some data is actually available here as well.)
Combining these public data sets we can build up a model of production ramps and look for patterns of growth.
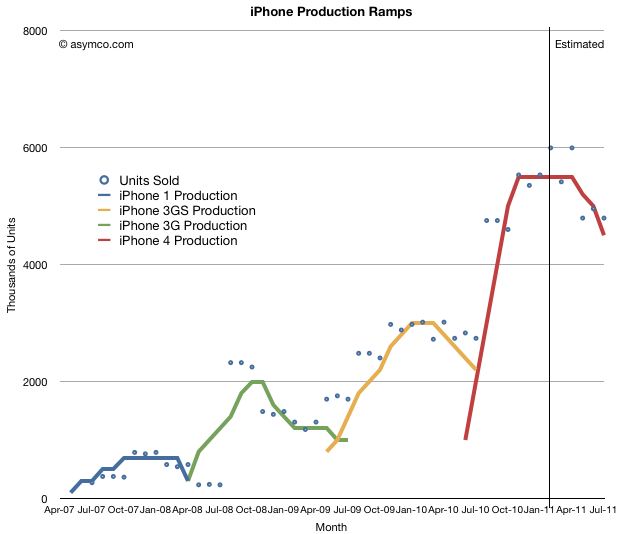
So here are the patterns of sales for the four versions of iPhone sold to date with some production ramps overlaid. The monthly sales are approximations based on actual quarterly sales divided over the months according to the number of days available.
The assumptions are:
Inventory during any one month has to be greater than zero.
Inventory must be minimized. Ideally it should not exceed 2 million units and preferably should be around 1 million units at any given time.
There is a limited amount of overlap between production of various generations. I.e. once a new version is launched, the older product should end production. Continuing sales of older model should be made available from inventory.
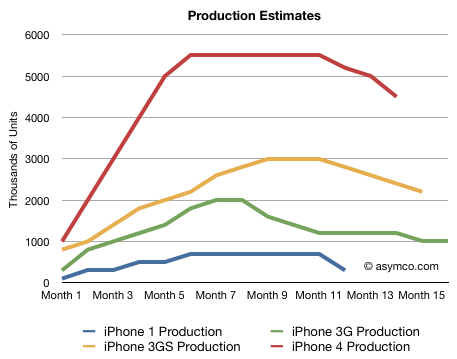
The following chart shows the ramps for the various versions of iPhone that satisfy these assumptions and are shown relative to the same time frame (each line shows the number of units produced per month for each generation of iPhone):
I need to stress that this is just my estimate. It's an approximation and not reality. What it does is give reasonably accurate predictions for units sold.
What I've always assumed is that each new version of the iPhone sells twice as many units as the last. This is roughly translated into: each ramp is roughly double the previous ramp (at least on average). The data bears this out. Apple has been very considerate in keeping products on similar cycle times so that we can see this pattern emerge.
Once you build these models, forecasts are not that hard to make:
The current generation will probably sell around 60 to 65 million units.
The product will still sell for at least one more quarter (CQ2, FQ3)
We know how many have been sold so far, so we can be pretty sure what will happen in the quarter just ended and the one just starting.
Looking at the pattern between generations, we can guess what the iPhone 5 curve will look like and build up the units forecast by month and quarter.
You can sanity-check the forecast by looking at overall market shares for Apple and overall market growth. If share moves too far up or down it might makes sense to revisit the data.
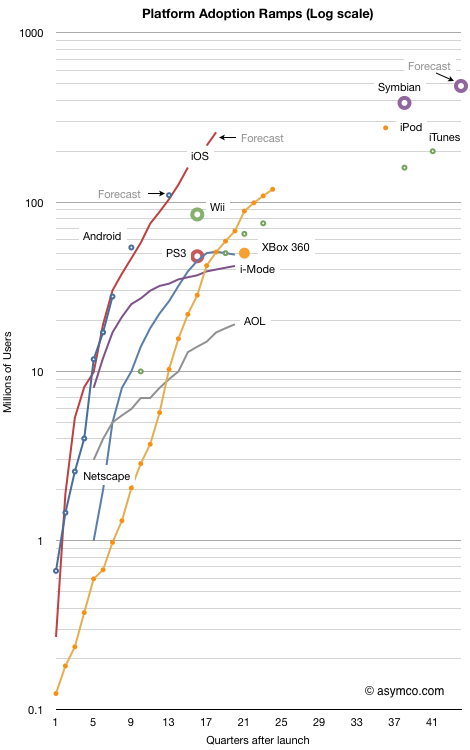
I last looked at the race to a billion in September 2010. I've now added a few more data points to the tracked platforms and also added points for the major console game platforms and Symbian.
The chart shows the cumulative number of users (approximated by units sold) for 11 platforms indexed to the same starting date. The horizontal axis is the number of quarters since a platform launched. Every fourth quarter is numbered so each number on the axis represents a new year. The last number on the axis represents 10 years.
The vertical axis is the cumulative number of users on a logarithmic scale. Each number of the vertical axis is 10x more users than the previous number. The top of the graph represents a billion users.
The overall chart shows how quickly a platform has grown and is bounded by a billion users and a decade of usage.
When judging the performance of a platform, the adoption slope and sustainability over time is perhaps the most interesting measure.
One can see how many platforms slow down before reaching 100 million and so far none have hit the billion mark (Windows has but not in the 10 year time frame of this chart.) Looking at game consoles also shows the limits of a narrowly focused platform. They performed better than i-Mode and Netscape but not as well as iTunes or iPod which themselves have growth limits.
If you're looking for the "fastest growing" title, it's a toss-up. Both iOS and Android are following almost identical trajectories.[see Notes]
The absolute highest cumulative sales total is Symbian, though now that it's been deprecated, it's set to be bypassed.
It does appear that Android and iOS each have the potential to reach a billion users in less than a decade. Perhaps Android will do so faster but the mobile computing platform race will not play out as the personal computing platform race did.
---
Notes:
For Android I used my own summary data for historic performance except for the last estimate and forecast which came from IMS Research.
iOS forecasts are my own.
Symbian data comes from VisionMobile. Forecast is based on Nokia's 150 million additional sales prediction.
Game console data is current as of end of 2010 via Wikipedia.