Asymco

Asymmetric Intelligence

Google

  1. Apple Remarks to Investors in FQ1 2018 Earnings Conference Call, Categorized and Annotated

    Conference · 149 comments

    The following is a transcript of the comments from Tim Cook (CEO) and Luca Maestri (CFO) at Apple's Q1 2018 Earnings Conference Call February 1, 2018. I color coded my interpretation of the comments into four categories:

    • Grey: Background and promotional commentary
    • Red: Strategy and signals of what management considers important and may include data beyond the regularly reported numbers.
    • Green: Financial data
    • Black: Commentary.
    • Blue: My commentary, in brackets.

    For a quick read of Apple's strategy, read the Red text. These comments are not repeated in financial reports. Highly recommended.

    For a quick read of Apple's financial performance, read the green text (which are replicated in financial reports). Read this if you don't want to wade through the financial reports.

    For marketing or product material, read the grey text.This is sometimes unique but also repeats product launch information.

    ----
    Tim Cook:  Thanks, Nancy and thanks everyone on the call, and welcome to everyone today. Before we dive into the quarter, I'd like to take a moment to talk about a significant milestone we recently crossed.

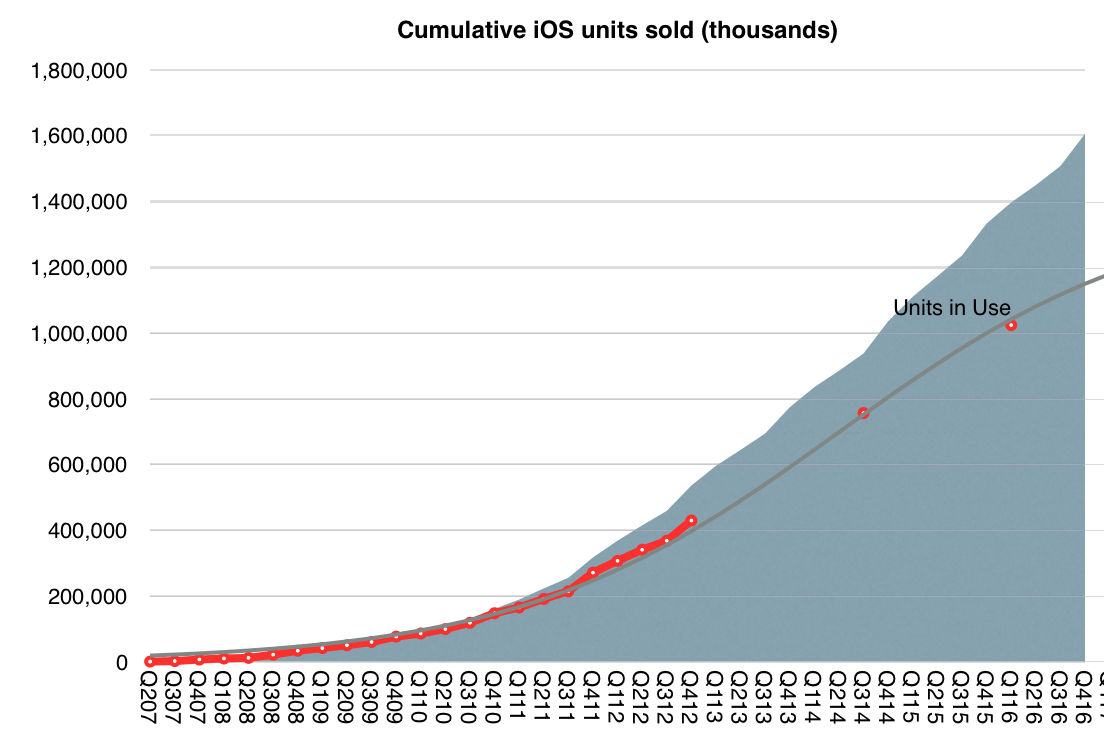
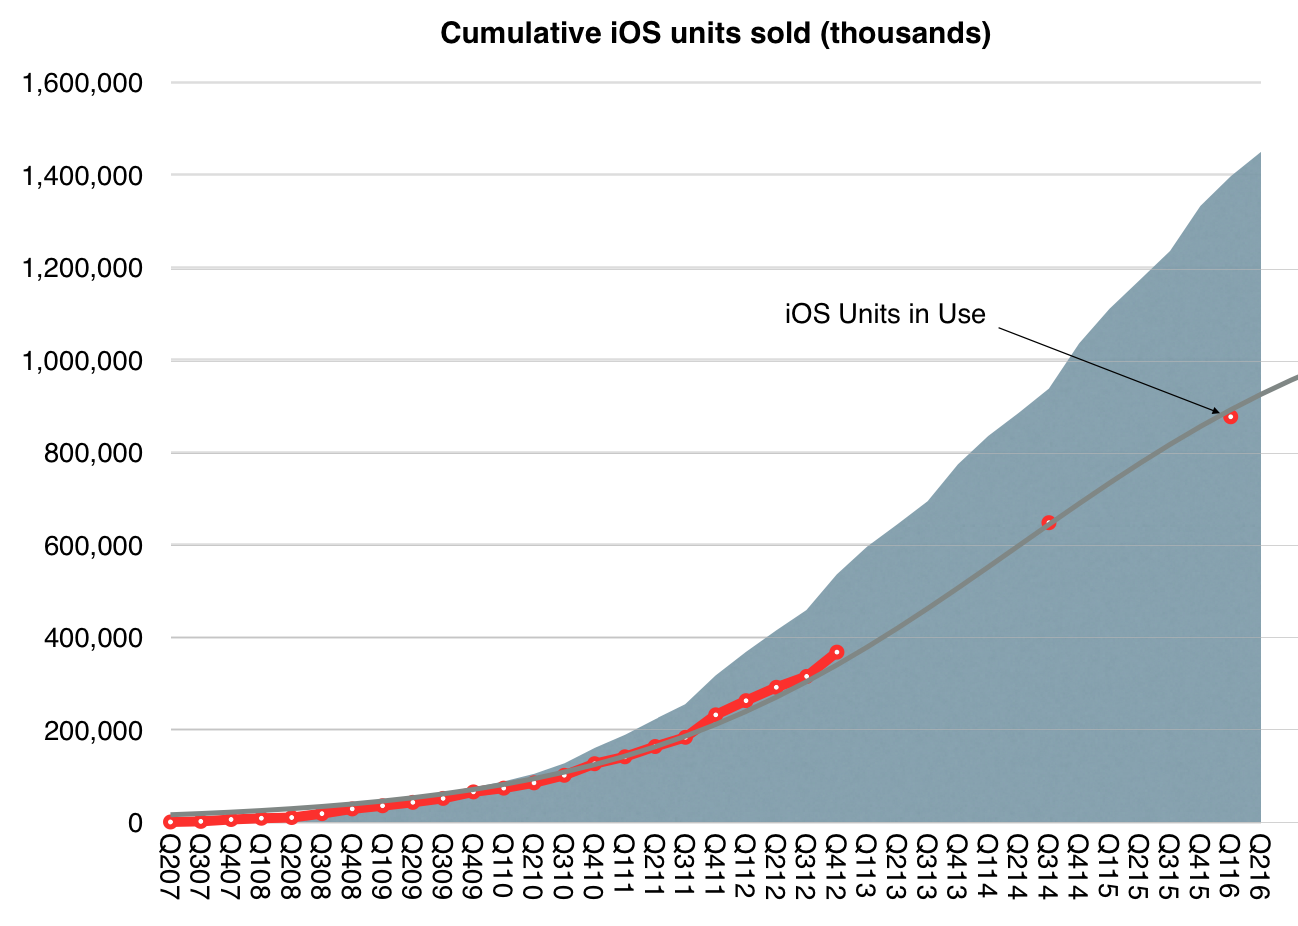
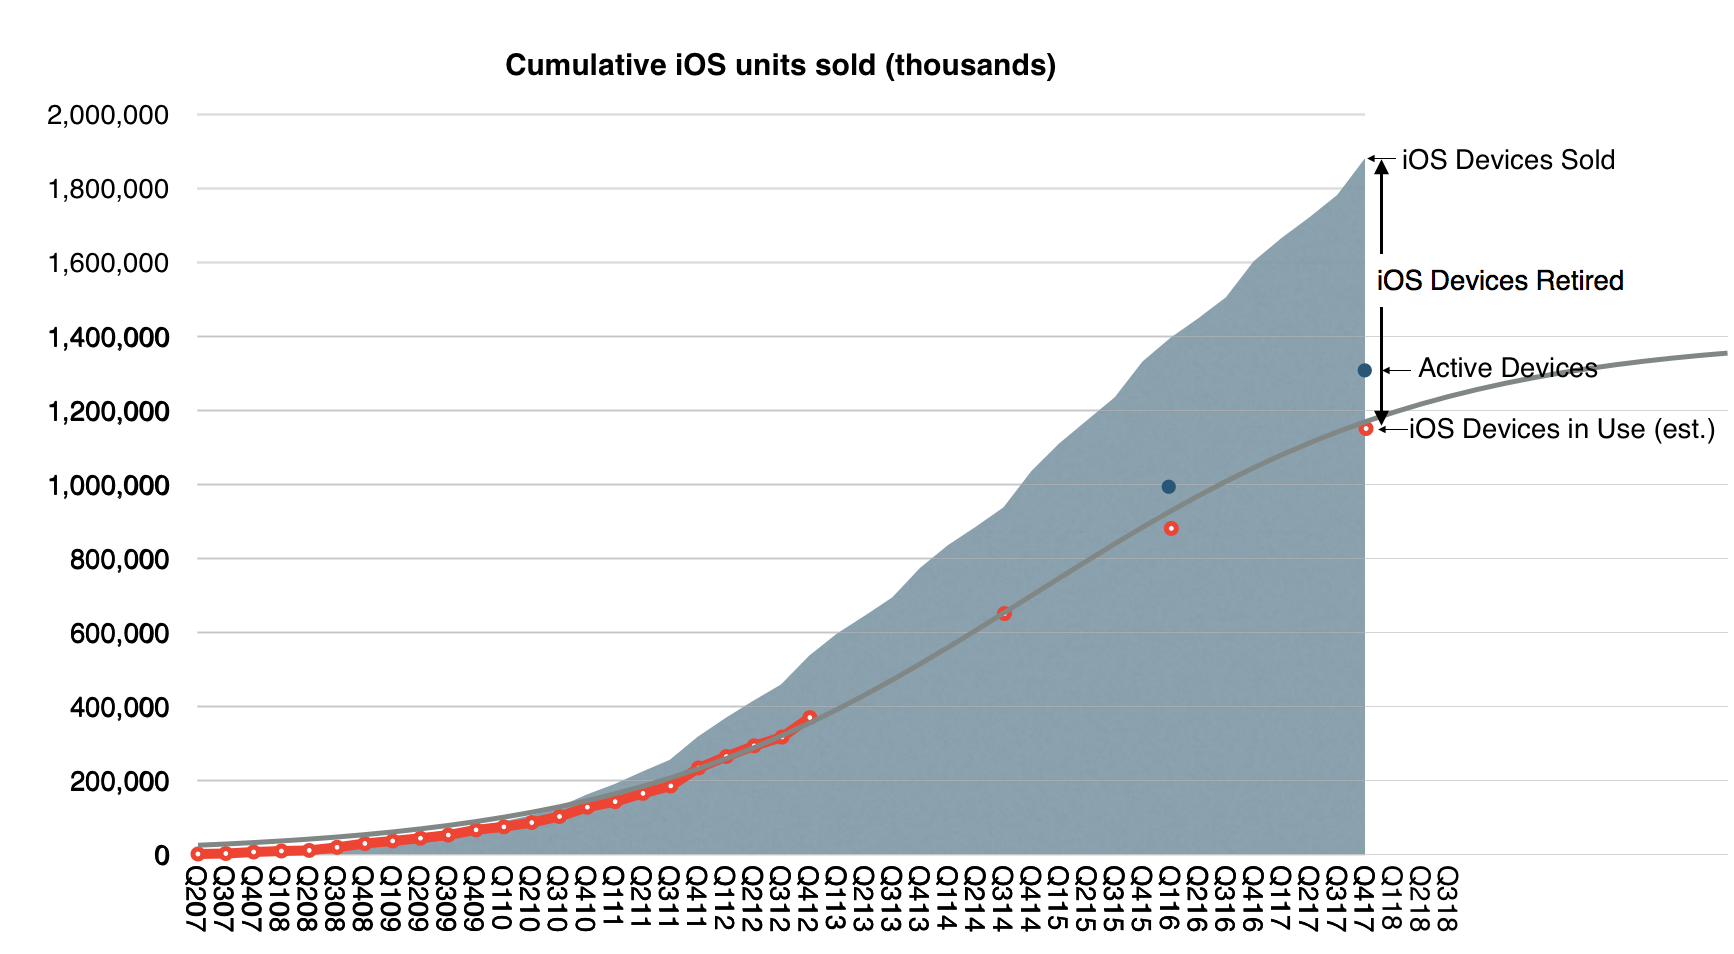
    Apple's active installed base reached 1.3 billion devices in January and is at an all-time high for all of our major products. 1.3 billion devices represents an astonishing 30% growth in just two years. It speaks to the strength and reliability of our products and our ecosystem, as well as the loyalty, satisfaction and engagement of our customers. It's also fueling tremendous growth in our services business, which I’ll talk about a little later in the call. [This is probably Apple's most important number. For at least the next 20 years this is the key performance metric and it can be used to derive company's valuation. A summary of the history of active devices vs. units sold is shown in the graph below:]
    Turning to the December quarter. We're thrilled to report Apple's biggest quarter ever, which set new all-time records in both revenue and earnings. We generated revenue of $88.3 billion, which is above the high-end of our guidance range, and it is up almost $10 billion or 13% over the previous all-time record we set a year ago.

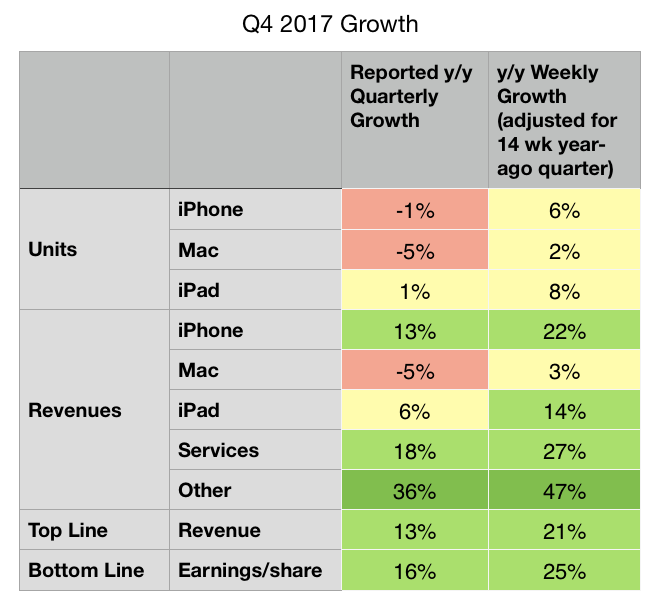
    It's also our fifth consecutive quarter of accelerating revenue growth with double digit growth in each of our geographic segments around the world. What makes us even more remarkable is that the quarter we're reporting today was 13-weeks long, while the year ago quarter was 14-weeks. When we look at the average revenue per week in the December quarter this year compared to last year, our growth was a stunning 21%. [The 13-week vs. 14-week year-on-year comparison is repeated several times. The summary differences are shown in the table below:] 
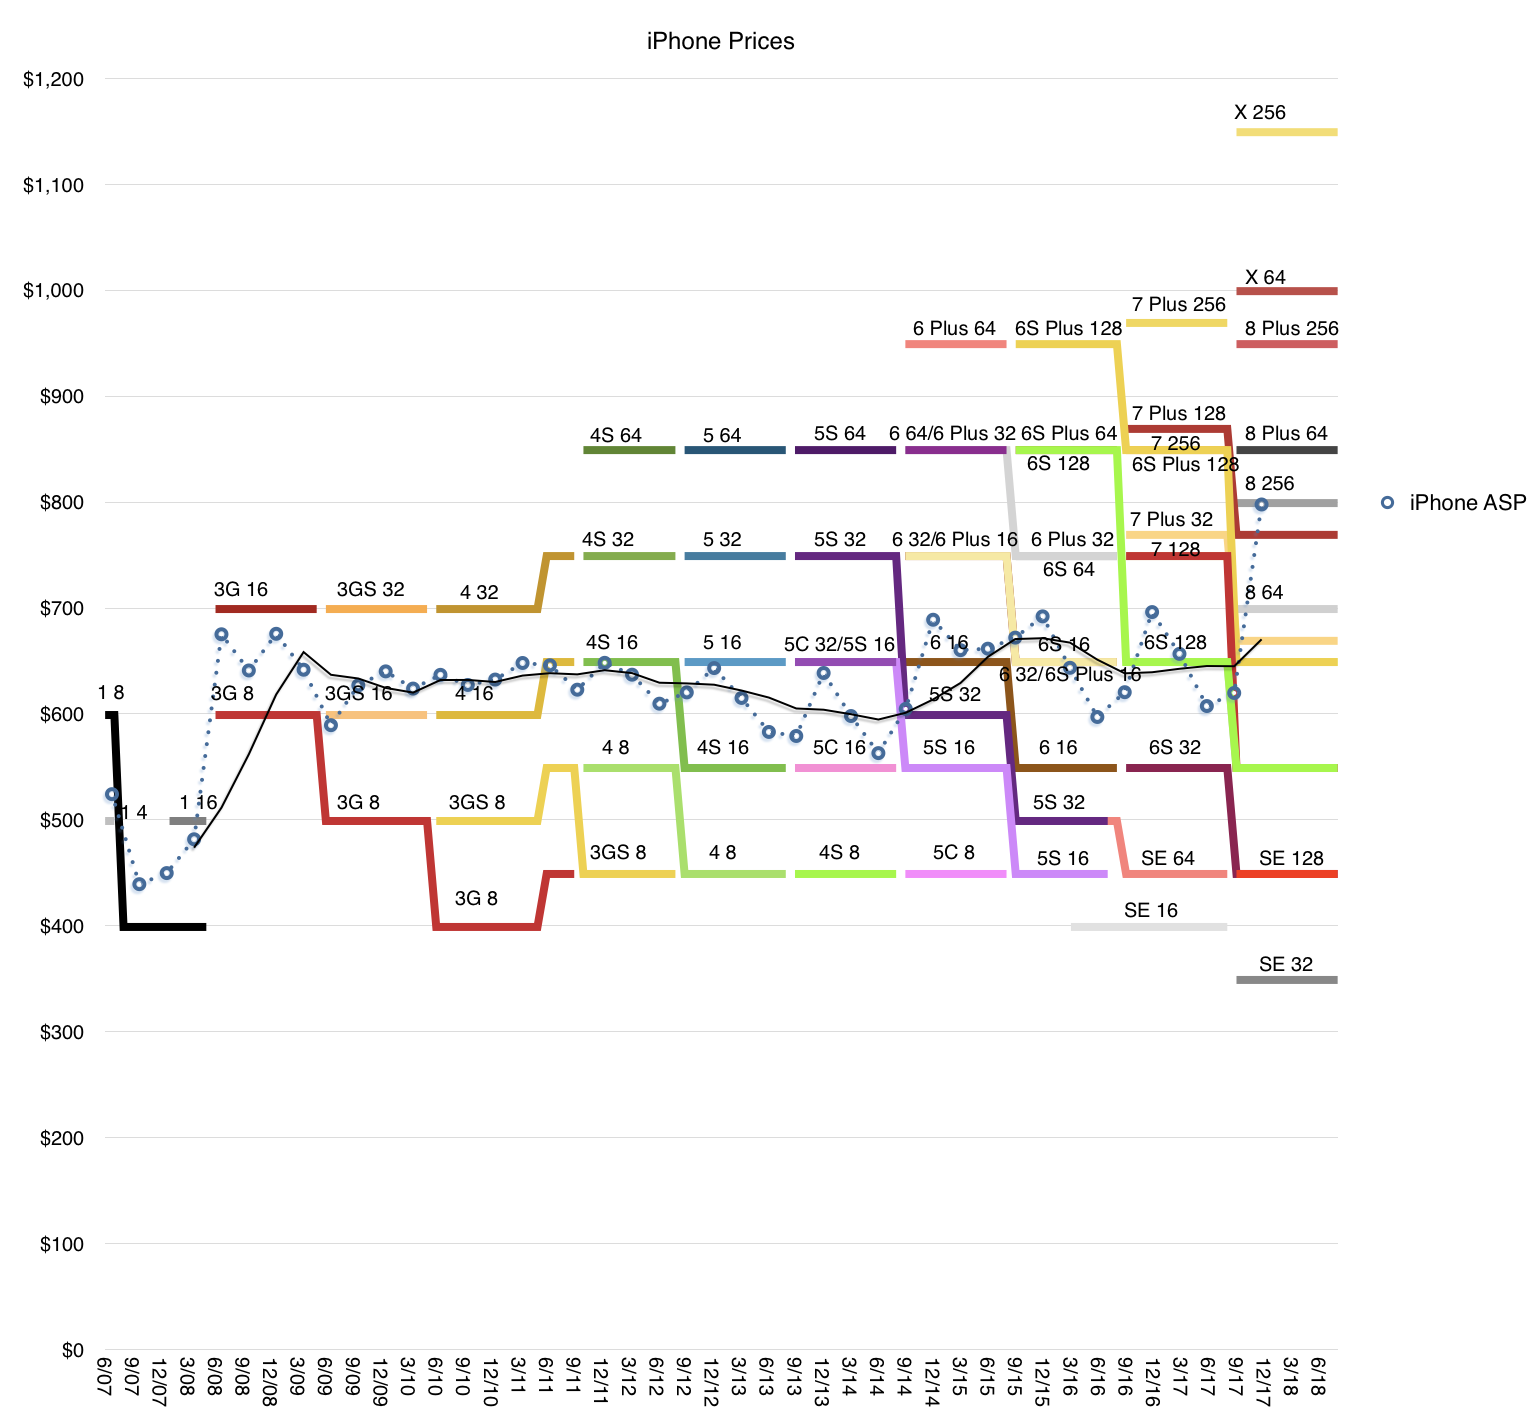
    Our growth was broad-based and a key driver was iPhone, which generated its highest revenue ever. iPhone X was the best-selling smartphone in the world in the December quarter according to Canalys, and it has been our top selling phone every week since it launched. iPhone 8 and iPhone 8 Plus rounded out the top three iPhones in the quarter. In fact, revenue for our newly launched iPhones was the highest of any lineup in our history, driving total Apple revenue above our guidance range. [The iPhone X is a huge hit. It drove the average selling price $100 higher y/y. This is not only unprecedented for Apple but for the entire Industry. The average smartphone sells for less than $300 while iPhones sold for $800. The gap is widening. The following graph shows the product mix and the average resulting price.] 
    I want to take a moment to recognize the tremendous amount of work that went into creating iPhone 10. Our teams carried out an extremely complex launch from both an engineering and operations perspective, executing an outstanding product ramp that required years of research and development; one that introduced innovative features like an edge-to-edge Super Retina Display and the TrueDepth Camera, which enables face ID. Our customers love these new features and the new gestures like simply swiping up from the bottom, which make using iPhone even more intuitive and enjoyable.

    Our team has put the technology of tomorrow in our customers’ hands today, set a standard for the next decade of smartphones and we are very proud of their achievements.

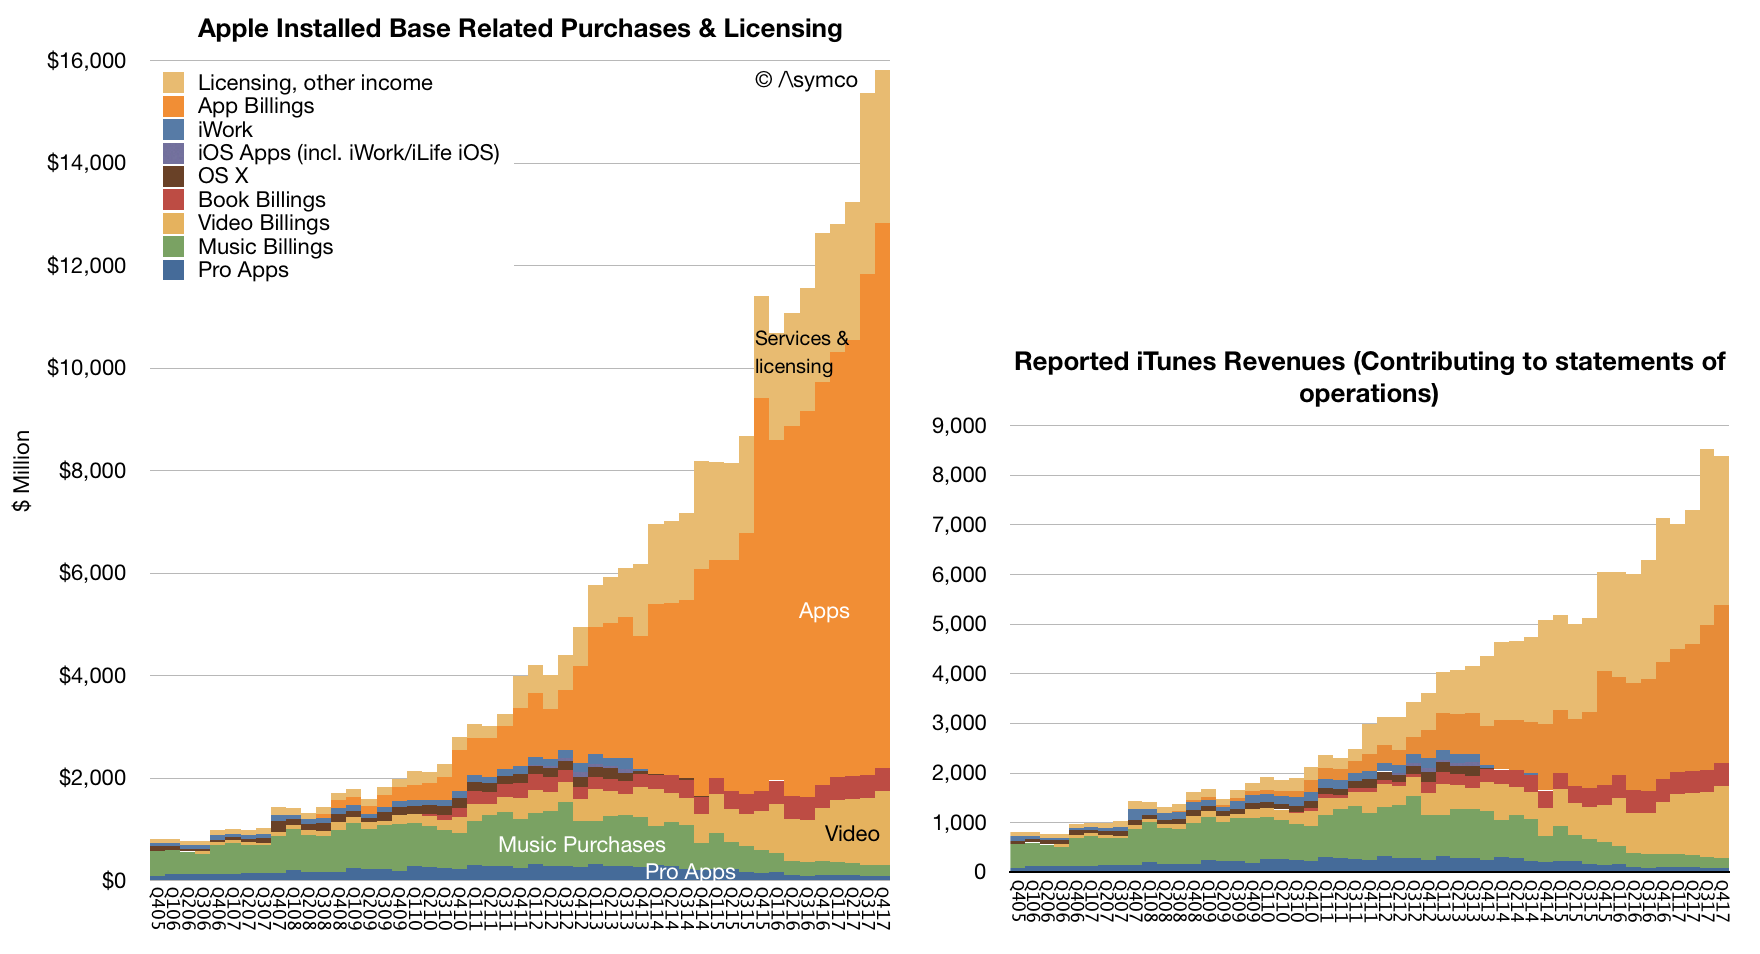
    It was another very strong quarter for services with revenue of $8.5 billion, up 18% over last year, and we’re on pace to achieve our goal of doubling our 2016 services revenue by 2020. The number of paid subscriptions across our services offerings passed 240 million by the end of the December quarter, that’s an increase of 30 million in the last 90 days alone, which is the largest quarterly growth ever. [Services has been growing relentlessly for over a decade. This steadiness of growth makes is a juggernaut. Apple is increasingly speaking about subscriptions as the key metric and 240 million is reaching record territory. The rise of Services is shown below (both revenues and consumer spending.)]
    We had an all-time record quarter for the App Store with our best holiday season ever. We’re seeing great excitement around augmented reality with customers now enjoying over 2,000 ARKit enabled app, spanning every category in the App Store. In December, when Pokémon GO released its new augmented reality features built with ARKit, it jumped the top of the App Store charts. Last week, on a stop in Toronto, I met developers who are hard at work on creative applications using ARKit from art appreciation to ecommerce, and I was very impressed with what I saw.

    Just for months after ARKit launched to the public, we’ve already released ARKit 1.5 in beta to developers around the world, and the response has been tremendous. Augmented reality is going to revolutionize many of the experiences we have with mobile devices. And with ARKit, we’re giving developers the most advanced tools on the market to create apps for the most advanced operating system running on the most advanced hardware. This is something only Apple can do.

    In addition to the App Store, several other services had their biggest quarter ever, including Apple Music, iCloud and Apple Pay, all of which saw growth in both active users and revenue.

    Apple Pay has reached an important milestone in the U.S. As a result of 50% year-over-year growth in merchant adoption, it’s now accepted at more than half of all American retail locations, which includes more than two-thirds of the country’s top 100 retailers. Now available in 20 markets, global Apple Pay purchase volume more than tripled year-over-year and we’re delighted to be expanding to Brazil in the coming months. [There are no absolute data points on Apple Pay but we do have some scattered growth data. The US data is cited here but in my experience it's more popular in select countries like UK where users are using it habitually]

    Today, you can use Apple Pay to take the subway in Guangzhou, China, see a concert at London’s Wembley Stadium or buy a souvenir in Yosemite National Park. In the U.S., we launched Apple Pay Cash in December, and it’s off to a terrific start. Millions of people are already using it to send and receive money with friends and family quickly, easily and securely; to split a bill, pay someone back, or send last minute gift right from the messages app.

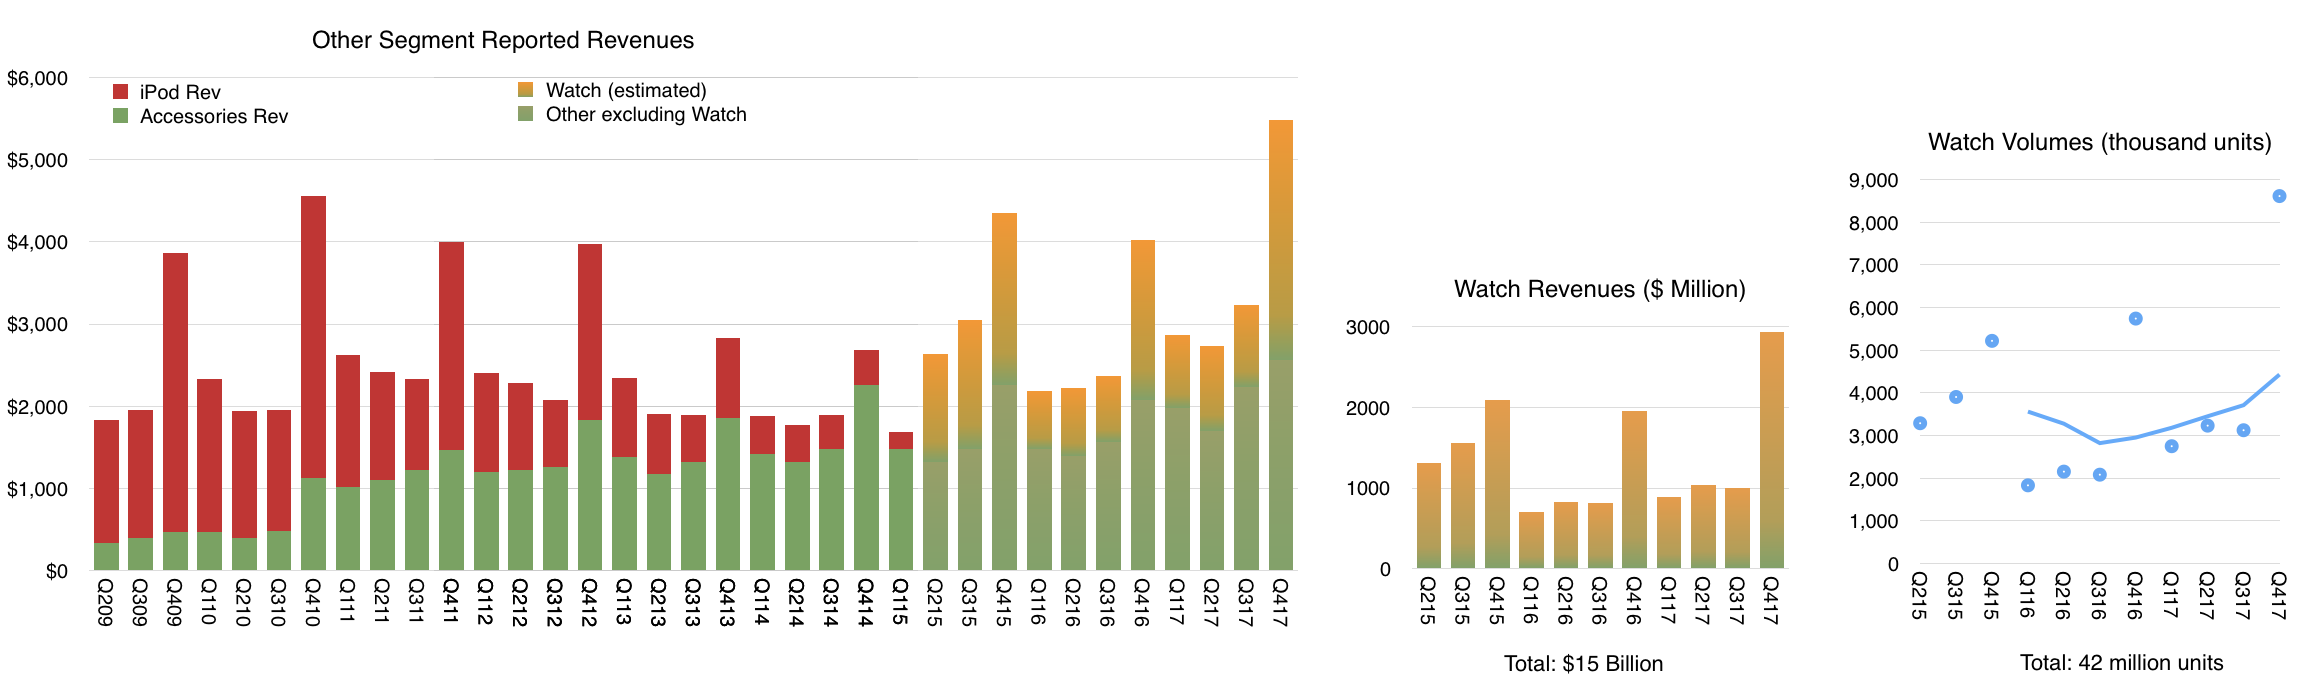
    It was our best quarter ever for the Apple Watch with over 50% growth in revenue and units for the fourth quarter in a row and strong double-digit growth in every geographic segment. Sales of Apple Watch Series 3 models were also more than twice the volume of Series 2 a year ago. Apple Watch is the most popular, smart watch in the world and gained market share during the quarter based on the latest estimates from IDC. [Apple Watch is growing consistently. The following graph shows my estimates of volume (total 42 million to date) and revenues (total $15 billion) based on all available data and commentary from management.]
    It was the third consecutive quarter of growth for iPad revenue, thanks to the strength of both iPad and iPad Pro. Based on the latest data from IDC, we gained share in nearly every market we track with strong outperformance in emerging markets.

    Worldwide, almost half of our iPad sales were the first-time tablet buyers are those switching to Apple, and that’s true in some of our most developed markets, including Japan and France. In China, new and switching users made up over 70% of all iPad sales.

    For Mac, we launched the all new, iMac Pro in mid-December. It’s an entirely new product line designed for our Pro users who love the all-in-one design of iMac and require workstation class performance. It's the fastest, most powerful Mac ever, delivering incredible computational power, for simulation and real time 3D rendering, immersive VR and complex photography audio and video projects. Worldwide, 60% of our Mac sales were the first time buyers and switchers and in China, that number was almost 90%.

    We're looking forward to getting HomePod in customers’ hands beginning next week. HomePod is an innovative wireless speaker, which delivers stunning audio quality wherever its placed in the home, thanks to the advanced Apple engineered hardware and software.

    Together with Apple Music, HomePod gives you instant access to one of the world's largest music catalogs. And with the intelligence of Siri, it’s a powerful assistant you control through natural voice interaction. We're very happy with the initial response from reviewers who've experienced HomePod ahead of its launch, and we think our customers are going to love this new product.

    We believe one of the key issues of the 21st century is education. And because of that, we've strengthened our commitment and investment into initiatives like everyone can code. To find the innovators of the future, we need to nurture the students of today. Our App Development with Swift curriculum, which is available free on iBooks, has been downloaded more than 1.2 million times worldwide with almost half of those coming from here in the United States. It’s also being taught in dozens of community colleges across the country, putting practical skills in the hands of today’s jobs seekers.

    I was in London two weeks ago as we announced that the program was expanding to more than 70 colleges and universities in Europe. Millions of students around the world will have the opportunity to add Swift to their coding vocabulary and gain skills that are essential for today’s economy.

    This is an exciting time at Apple and with the best lineup of products and services we've ever had and a set of initiatives that show how business can be a force for good in the world. We could not be more excited about our future.

    Now, for more details on the December quarter results, I'd like to turn over the call to Luca.

    Luca Maestri: Thank you, Tim. Good afternoon, everyone. Our business and financial performance in the December quarter were exceptional, as we set new all-time records for revenue, operating income, net income and earnings per share.

    Starting with revenue, we’re reporting an all-time record, $88.3 billion, up nearly $10 billion or 13% over the prior record set last year. It is our fifth consecutive quarter of accelerating revenue growth. As you know, the December quarter a year ago spanned 14-weeks compared to 13-weeks this year, which is important to consider as we have set the underlying performance of our business this year. When we look at average revenue per week, our growth rate was even higher at 21% with growth across all product categories for the third consecutive quarter.

    Our results were terrific all around the world with double digit revenue growth in all our geographic segments, an all-time quarterly record in the vast majority of markets we track, including the U.S., Western Europe, Japan, Canada, Australia and Korea, as well as Mainland China, Latin America, The Middle East, Central and Eastern Europe, and India.

    In Greater China, we were very happy to generate double digit revenue growth for the second quarter in a row and in emerging markets outside of Greater China, we saw 25% year-over-year growth.

    Gross margin was 38.4% at the high end of our guidance range. Operating margin was 29.8% of revenue. Our net income was $20.1 billion an all-time record, and up $2.2 billion over the last year. Diluted earnings per share were $3.89 also an all-time record and cash flow from operations was very strong at $28.3 billion.

    During the quarter, we sold 77.3 million iPhones, the highest number ever for a 13-week quarter. Average weekly iPhone sales were up 6% compared to December quarter last year with growth in every region of the world despite the staggered launch of iPhone 10. We established all-time iPhone revenue record in nearly every market we track with double-digit growth in all of our geographic segments. iPhone ASP increased to $796 from $695 a year ago, driven primarily by the launch of iPhone 10 and the success of iPhone 8 and 8 Plus.

    We exited the December quarter towards the lower end of our target range of five to seven weeks of iPhone channel inventory with less than 1 million more iPhones in the channel compared to the December quarter a year ago, in line with our growth in average weekly unit sales. Customer interest and satisfaction with iPhone are very, very strong for both consumers and business users.

    The latest data from 451 Research indicates U.S. customer satisfaction ratings of 96% or higher across iPhone models. In fact, combining iPhone 8, iPhone 8 Plus and iPhone 10, consumers reported an amazing 99% satisfaction rating. And among business customers planning to purchase smartphones in the next quarter, 77% planned to purchase iPhone. Our customers are also incredibly loyal with Kantar's latest U.S. research, reflecting a 96% iPhone loyalty rate, the highest ever measured. [Customer satisfaction is the second most important figure after active user base. Combining these two figures yields the recurring revenue value of the company. Remember what Deming said: the most important measurements for a company's value are the multipliers of a satisfied customer and a dissatisfied customer--these numbers never appear on any financial report but they are applied to all the numbers on every report].

    Turning to services. We had a terrific quarter with revenue of $8.5 billion, up 18% year-over-year and up 27% in terms of average revenue per week; that is an acceleration to the 24% services growth run rate that we experienced in the September quarter.

    The App Store set a new all-time revenue record. The Store’s all-new design is off to a fantastic start with quarterly store visitors, transacting accounts and paying accounts, reaching new all-time highs. During the week beginning December 24th, a record number of customers made purchases or downloaded Apps from the App Store, spending over $890 million in that seven-day period, followed by $300 million in purchases on New Year’s day alone.

    And according to App Annie’s latest report, the App Store continues to be the preferred destination for customer purchases by a very wide margin, generating nearly twice the revenue of Google Play. Across all our services offerings, paid subscriptions reached $240 million with growth of 58% over last year and they were a major contributor to the overall strong growth in services revenue. [Apple has half the user base of Google Android. This is based on Google's May 2017 report of 2 billion active devices vs. the 1.3 billion that we just got from Apple. And yet these users collectively spend twice as much on apps. This ratio of "half the users, twice the spending" has been cropping up in individual developer anecdotes and can also be seen in other metrics of engagement and consumption. This should not be surprising as it conforms to the Pareto distribution of economic value.]

    As Tim mentioned, it was our best quarter ever for Apple Watch. And when we add to this us from Beats and AirPods, our total revenue from wearables was up almost 70% year-over-year. In fact, wearables were the second largest contributor to revenue growth after iPhone, which is impressive for a business that started only three years ago. In total, our other products category set a new all-time record with quarterly revenue exceeding $5 billion for the first time. [Wearables now includes more than watches but watches are likely still the dominant product.]

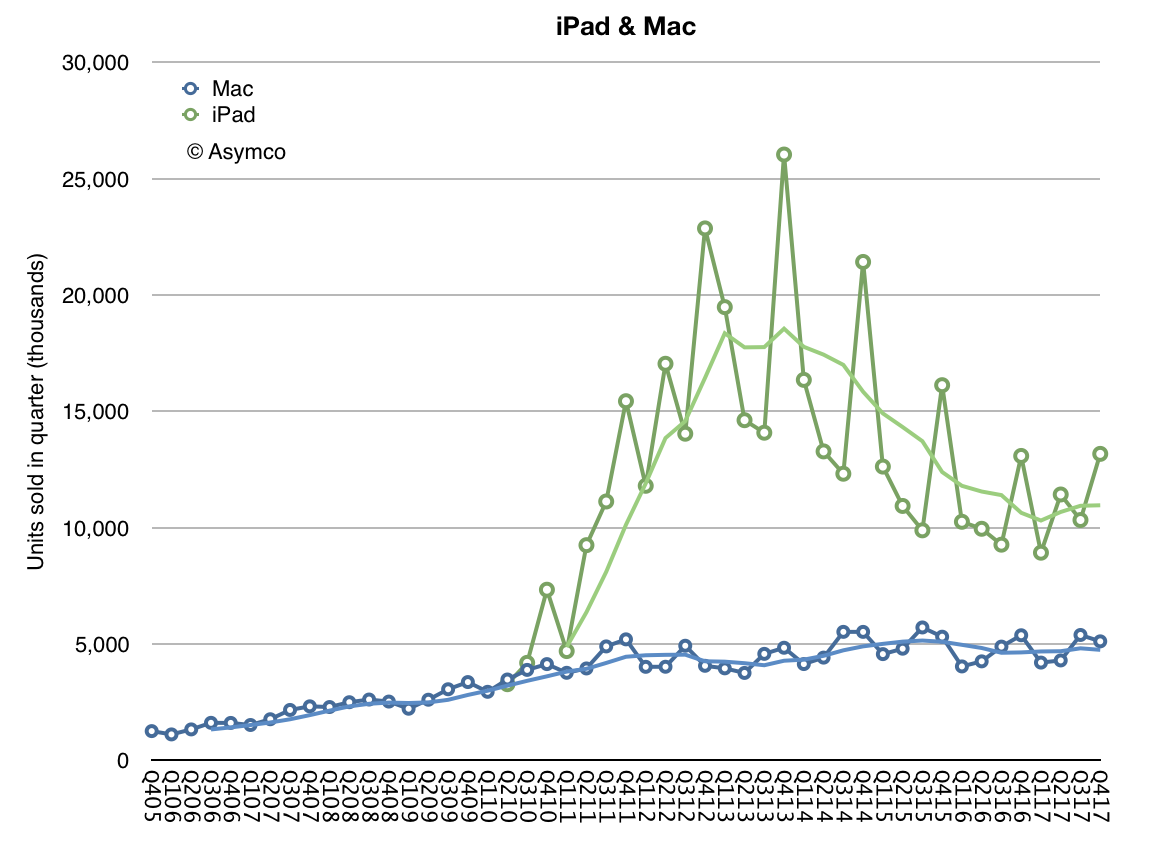
    Next, I’d like to talk about the Mac. We sold 5.1 million Macs during the December quarter, which translates to a 2% year-over-year increase in average sales per week. Mac performance was particularly strong in emerging markets with unit sales up 13% year-over-year and with all-time records in Latin America, in India, Turkey and Central and Eastern Europe. On a worldwide basis, the active install base of Macs was up double-digits year-over-year to a new record.

    It was also another growth quarter for iPad. We sold 13.2 million units with average iPad sales per week up 8% over last year’s December quarter. iPad sales grew strong double-digits in many emerging markets, including Latin America, the Middle East, Central and Eastern Europe and India, as well as developed markets, including Japan, Australia and Korea. The active install base of iPad has grown every quarter since its launch in 2010, and it reached a new all-time high in December, thanks to extremely high customer loyalty and large numbers of first-time iPad users. [iPad is clearly recovering from a long decline. ASPs are rising as it's being positioned as a PC alternative. Its low end functions are being absorbed by large screen iPhones.]
    NPD indicates that iPad had 46% share of the U.S. tablet market in the December quarter, up from 36% share a year ago. And the most recent surveys from 451 Research found that among customers planning to purchase tablets within 90 days, 72% of consumers and 68% of business users planned to purchase iPads. Customer satisfaction is also very high with businesses reporting a 99% satisfaction rating for iPad.

    We are seeing great traction in enterprise as businesses across industries and around the world standardize on iOS. For example, Intesa Sanpaolo, one of Europe’s leading banks, has chosen iOS as the mobile standard for its entire 70,000 employee base in Italy; choosing iOS for its security, user interface, accessibility and reliability, Intesa Sanpaolo will deploy native apps to improve employee productivity in customer support, human resources, and marketing across the company.

    And LensCrafters, one of the largest optical retail brands in North America, will be using over 7,000 iPad Pros to enable digital eye exams and digital optical measurements in a personalized and interactive experience. We’re also rolling out a new initiative, called Apple AtWork to help businesses implement employee choice programs more easily and offer Apple products company-wide.

    Resources from both Apple and our channel partners will enable enterprise IT and procurement teams to buy or lease Apple products more efficiently, streamline the setup of iPhone, iPad, and Mac, and deliver a seamless onboarding experience for employees. We launched the program with CDW in the U.S. last week, and we would be expanding to more channels and regions later this year.

    The December quarter was extremely busy for our retail and online stores, which welcomed 538 million visitors. Traffic was particularly strong during the four-weeks following the launch of iPhone 10, up 46% over last year. And across the quarter, our stores conducted over 200,000 today at Apple sessions, covering topics including photography, music, gaming, and app development, and art and design. Just last weekend, we opened our first store in Seoul, Korea and we’re looking forward to opening our first store in Austria in a few weeks. These newest openings will mark the expansion of our retail store presence to 21 countries.

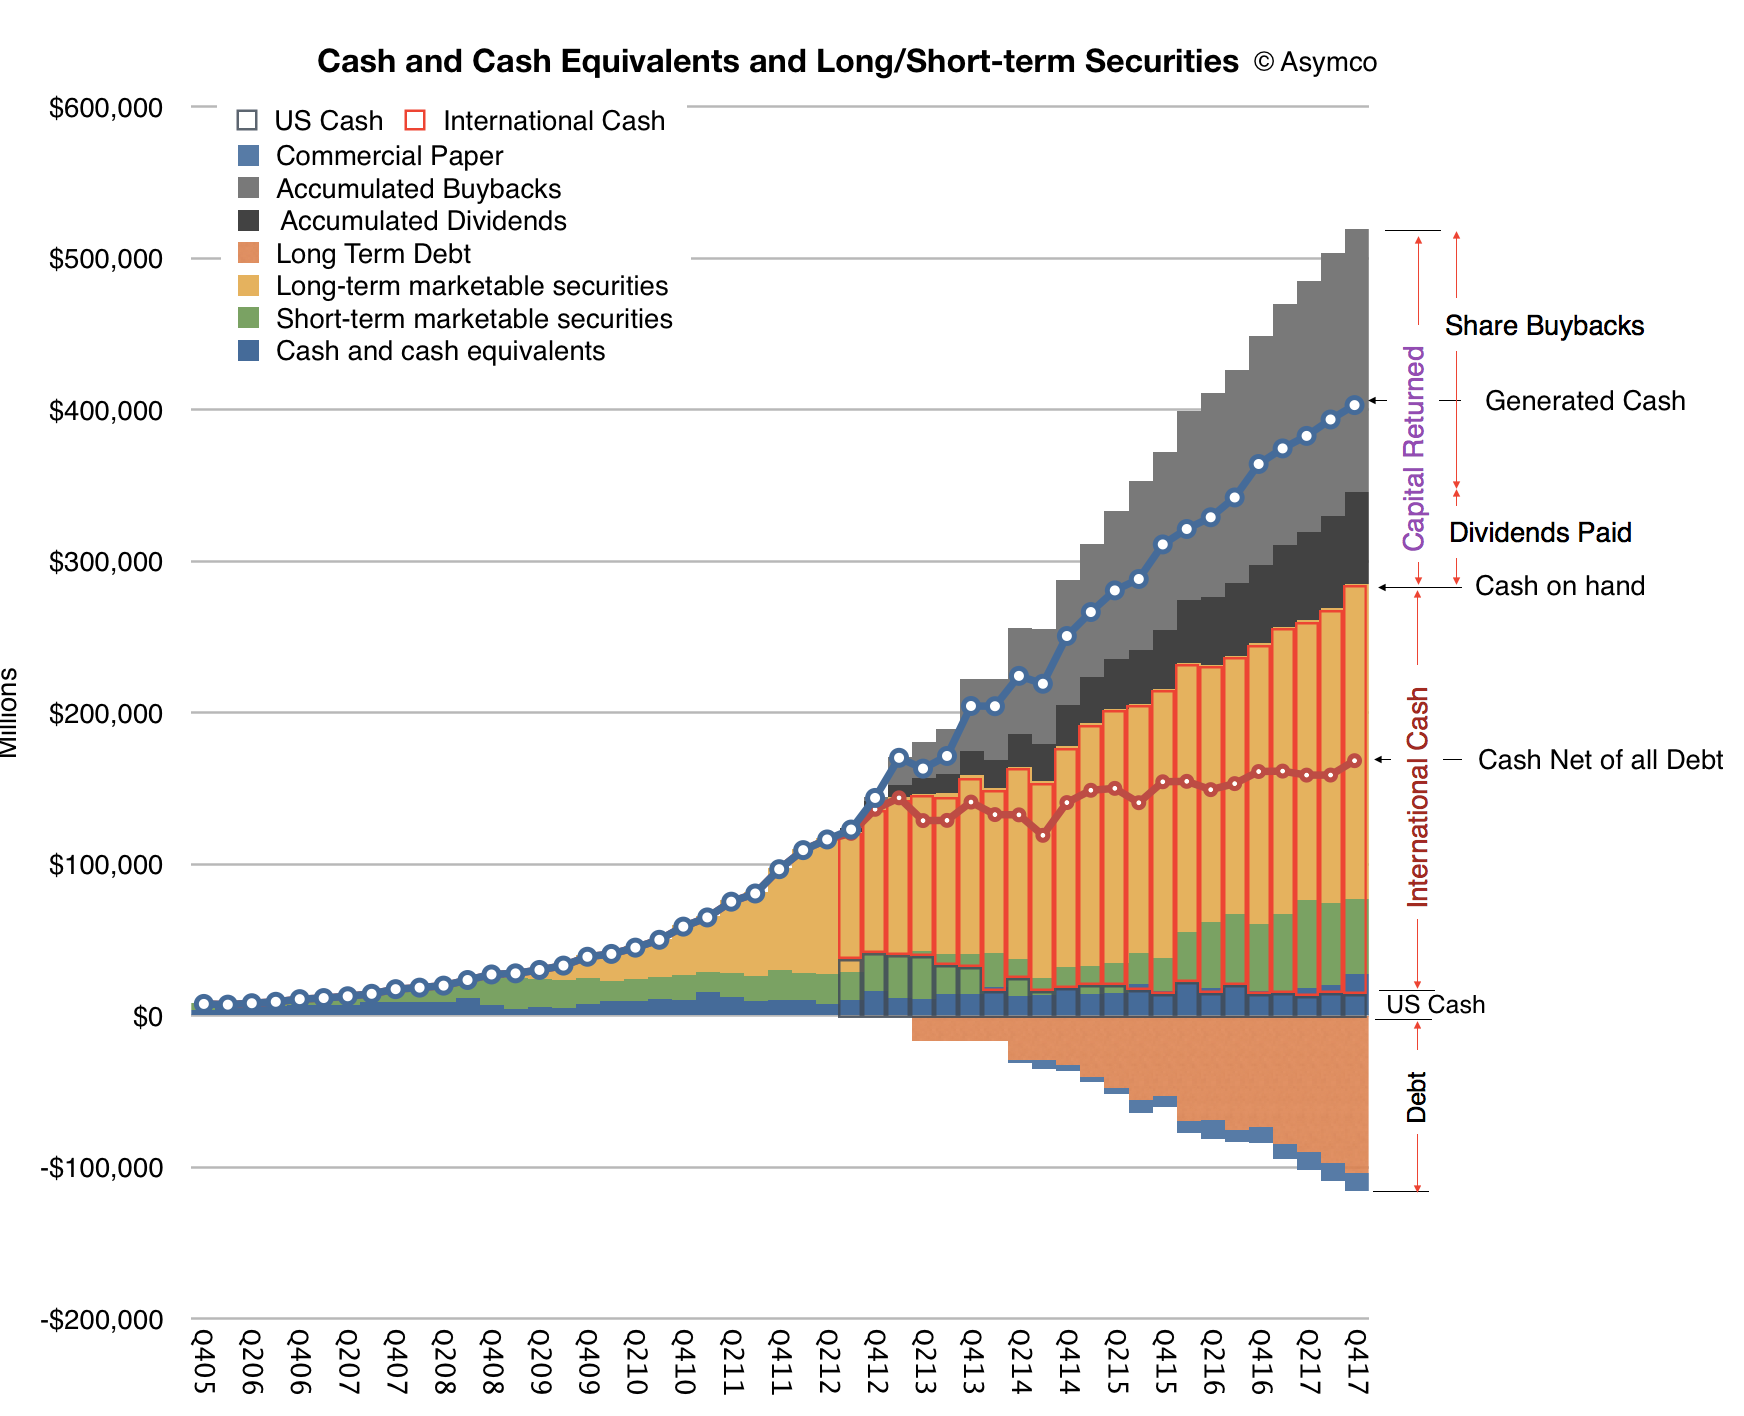
    Let me now turn to our cash position. We ended the quarter with $285.1 billion in cash plus marketable securities, a sequential increase of $16.2 billion. $269 billion of this cash, or 94% of the total, was outside the United States. We issued $7 billion in debt during the quarter, bringing us to $110 billion in term-debt and $12 billion in commercial paper outstanding, for a total net cash position of $163 billion at the end of the quarter. We also returned $14.5 billion to investors during the quarter. We paid $3.3 billion in dividends and equivalents, and spent $5.1 billion on repurchases of 30.2 million Apple shares through open market transactions.

    We launched a new $5 billion ASR program, resulting in initial delivery and retirement of 23.6 million shares and we retired 3.8 million shares upon the completion of our 12th ASR during the quarter. We’ve now completed over $248 billion of our $300 billion capital return program, including $176 billion in share repurchases against our announced $210 billion buyback program with $34 billion remaining under our current authorization. [An updated look at Apple's cash is shown below]
    Turning to taxes. Due to the recently enacted legislation in the U.S., we estimate making a corporate income tax payment of approximately $38 billion to the U.S. government on our cumulative past foreign earnings. This amount is very similar to what we had been accruing on those earnings in our financial results through fiscal year 2017, including the $38 billion payment. We will have paid over $110 billion of corporate income tax on our total domestic and foreign earnings during the last 10 years for a cash tax rate of about 26%. [Apple has paid more tax than any company in history, and is about the make the largest single payment to the US Treasury.]

    Our tax rate of 25.8% for the December quarter was close to our guidance of 25.5% as the lower U.S. statutory rate from the new legislation was effective offset by the remeasurement of deferred tax balances.

    As we move ahead into the March quarter, I'd like to review our outlook, which includes the types of forward looking information that Nancy referred to at the beginning of the call; we expect revenue to be between $60 billion and $62 billion; we expect gross margin to be between 38% and 38.5%; we expect OpEx to be between $7.6 billion and $7.7 billion; we expect OI&E to be about $300 million; and we expect the tax rate to be about 15%.

    Tax reform will allow us to pursue a more optimal capital structure for our company. Our current net cash position is $163 billion. And given the increased financial and operational flexibility from the access to our foreign cash, we are targeting to become approximately net cash neutral overtime. We will provide an update to our specific capital allocation plans when we report results for our second fiscal quarter, consistent with the timing of updates that we have provided in the past.

    Finally, today our Board of Directors has declared a cash dividend of $0.63 per share of common stock, payable on February 15, 2018, to shareholders of record as of February 12, 2018.
  2. The iOS Economy, Updated

    Research · 67 comments

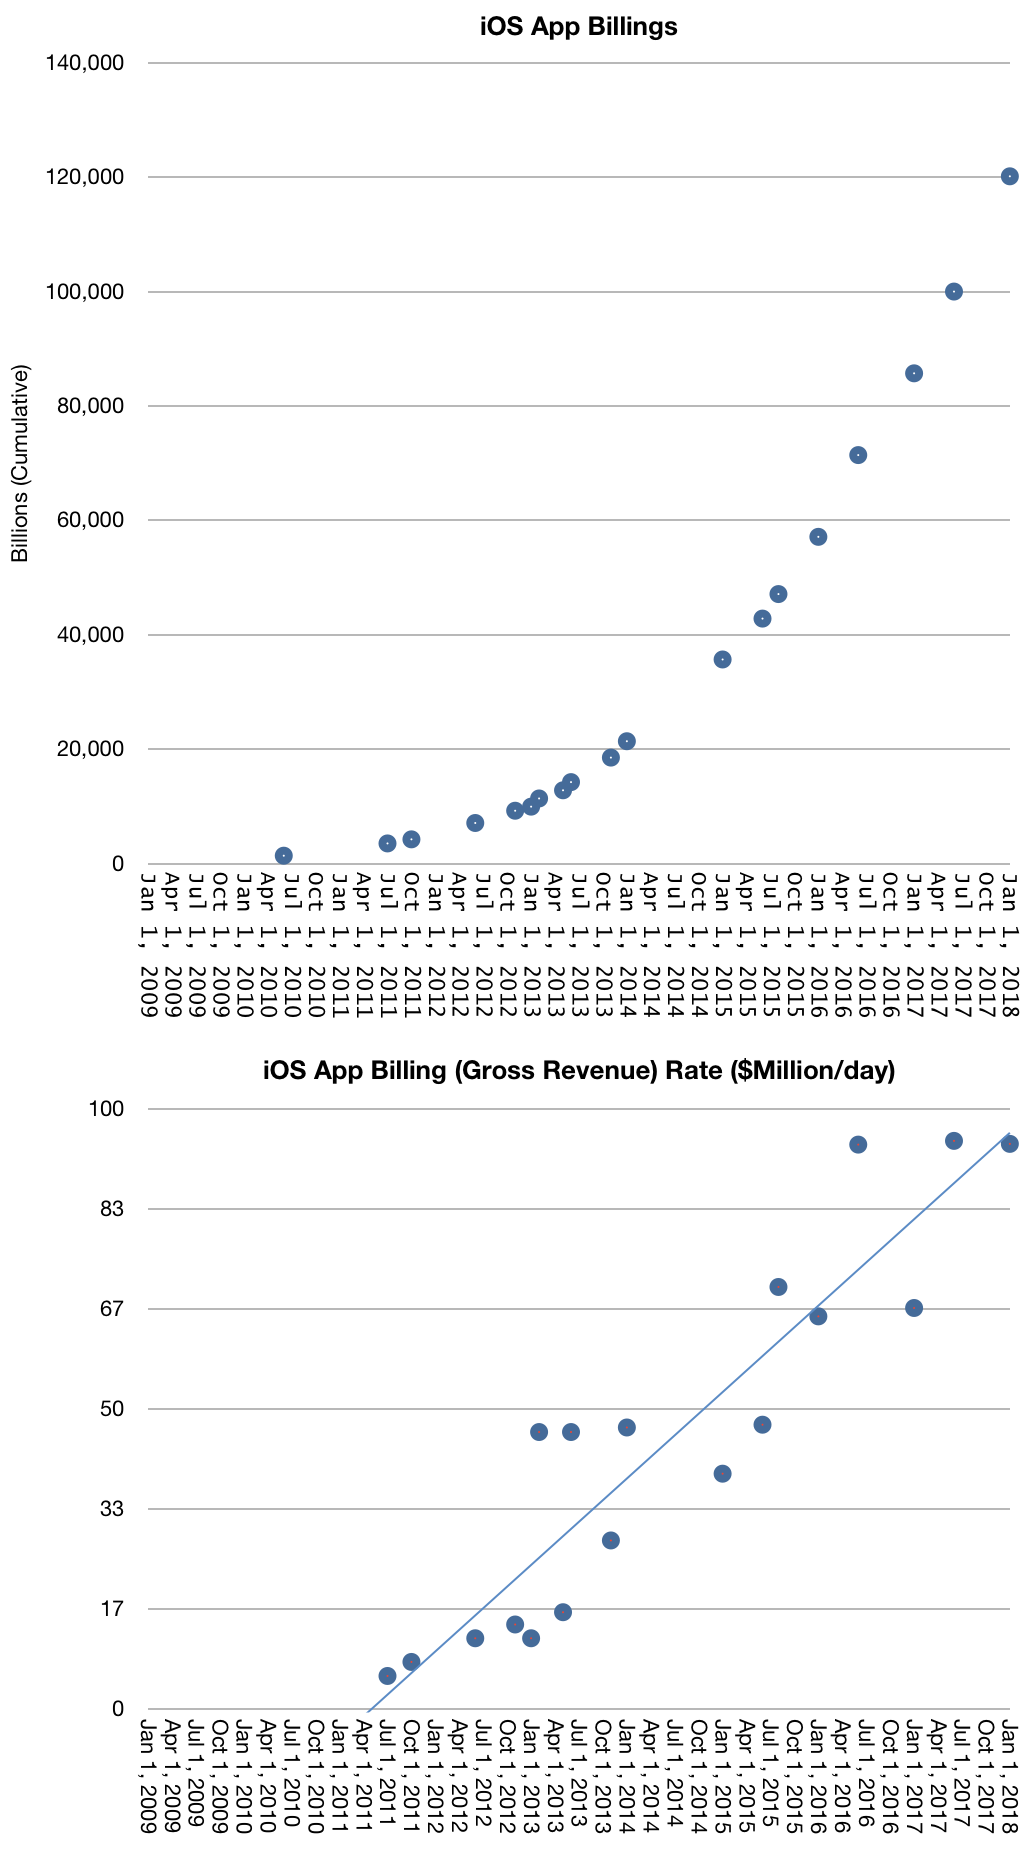
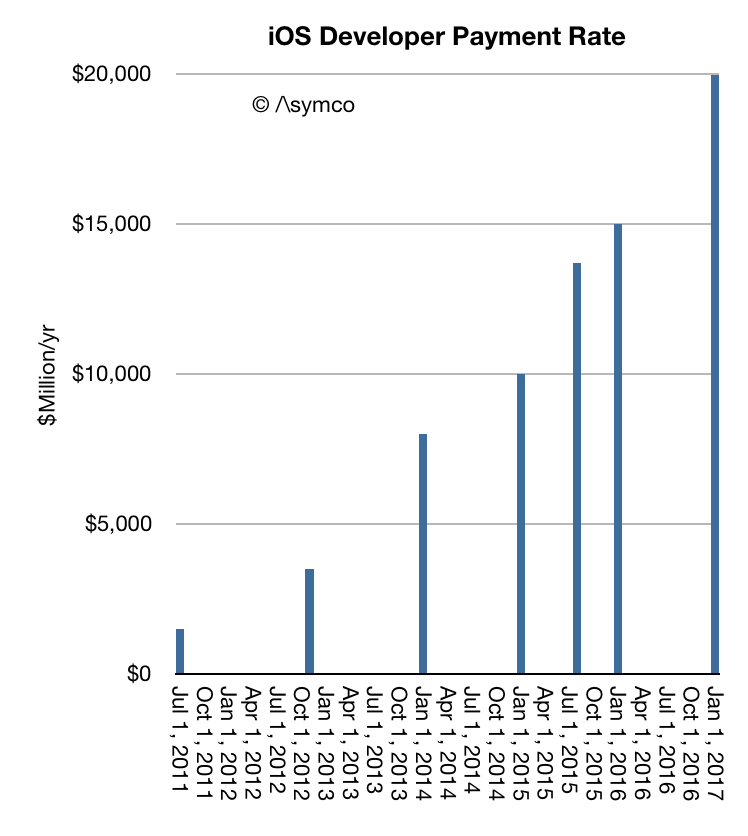
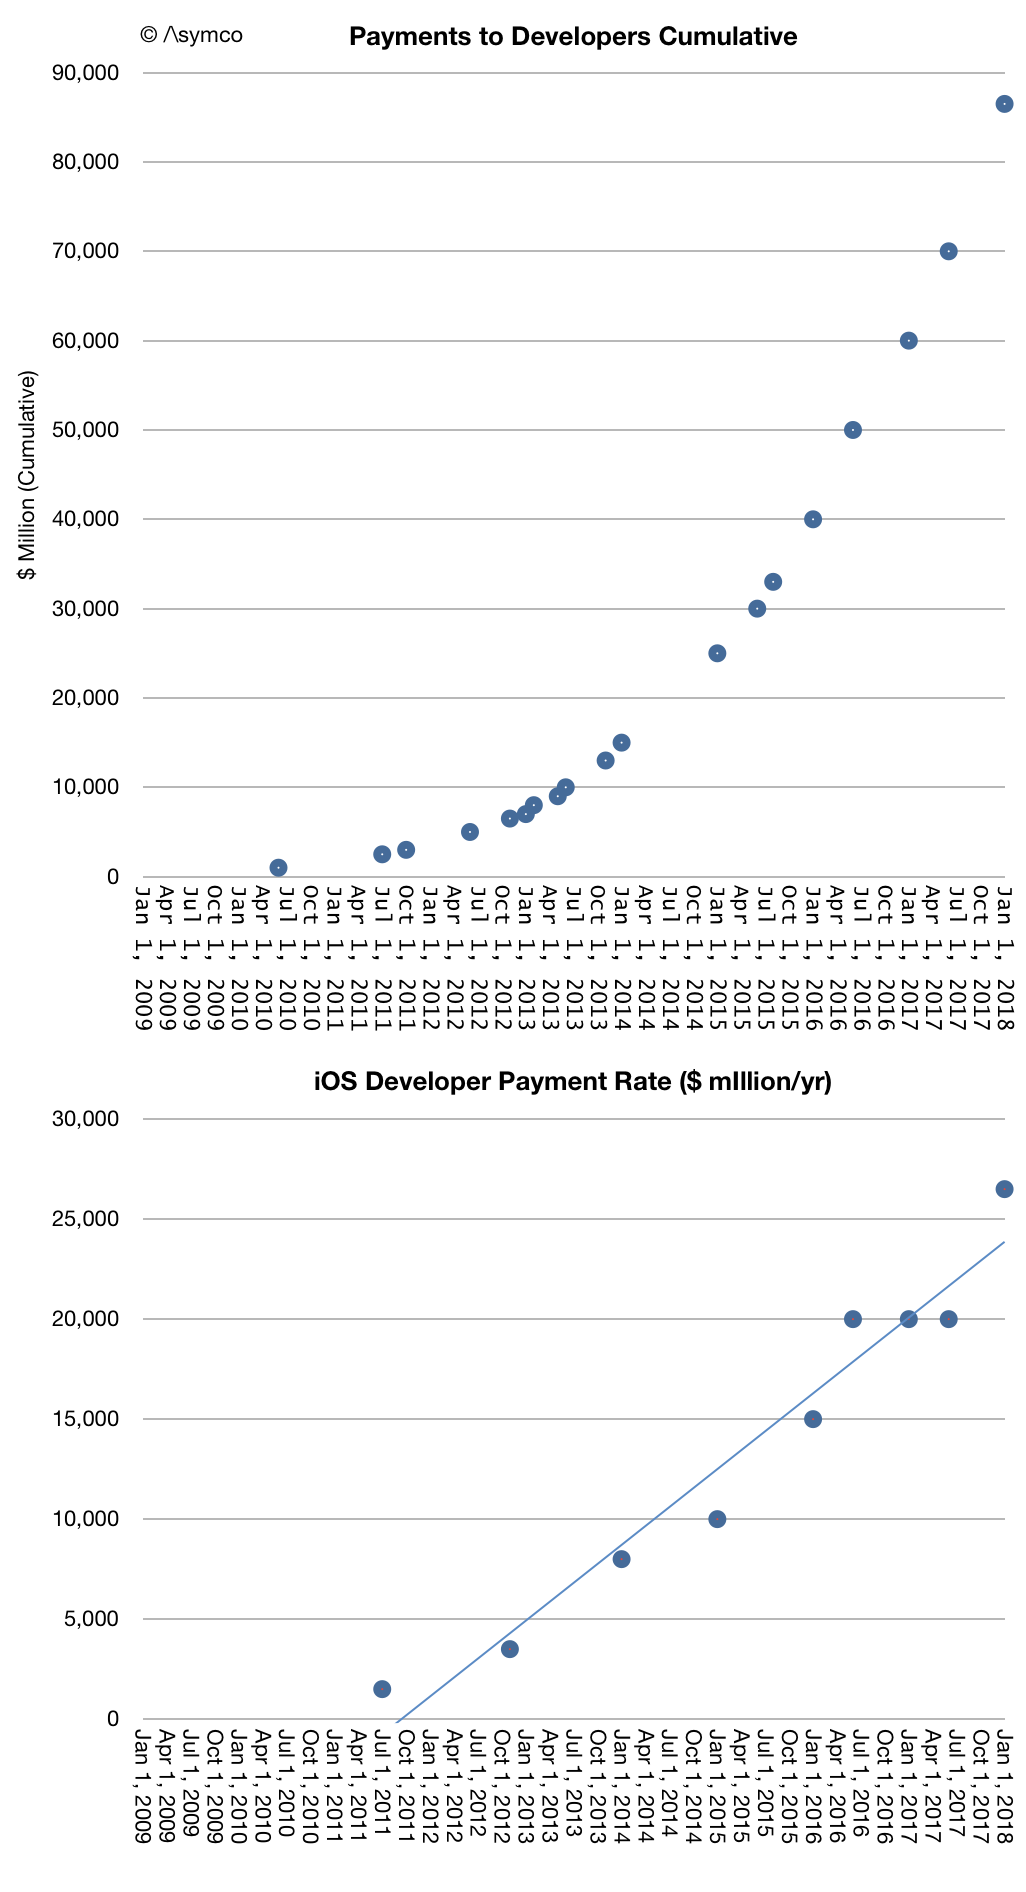
    In its latest update on the App Store Apple reported that iOS developers earned $26.5 billion in 2017. A year ago the figure was $20 billion. The growth rate is then about 33%. The cumulative payments to developers can be calculated as $86.5 billion. This amount was generated in a span of less than 10 years, with the first billion paid by June 2010.

    The following graph shows the history of cumulative payments and the corresponding payment rate (in $/yr.)

    Note that this represents the payment to developers, not the spending by the customer. Apple keeps about 30% of the revenue.  The total spending on the App Store is then about 43% higher. ((During the last year some types of app subscriptions have been priced by Apple at 15% of gross so I adjusted the payment rate to 72% for 2017)). The equivalent figures for spending on the App Store are shown below.

    A few observations:

    • Developer payment rate is now above $25 billion/yr. I've been notified via Twitter that this is higher than the revenue of McDonald's Corporation in 2016.
    • During this year iOS users will be spending about $100 million per day for Apps. This was Google's AdWords revenue rate in 2012.
    • The spending on App Store has been rising steadily, adding about $5 billion/yr since mid 2011.
    • Apps are the biggest component of Apple services and helped that segment gross over $57 billion in 2017, passing Fortune 100 level (net of developer payments).

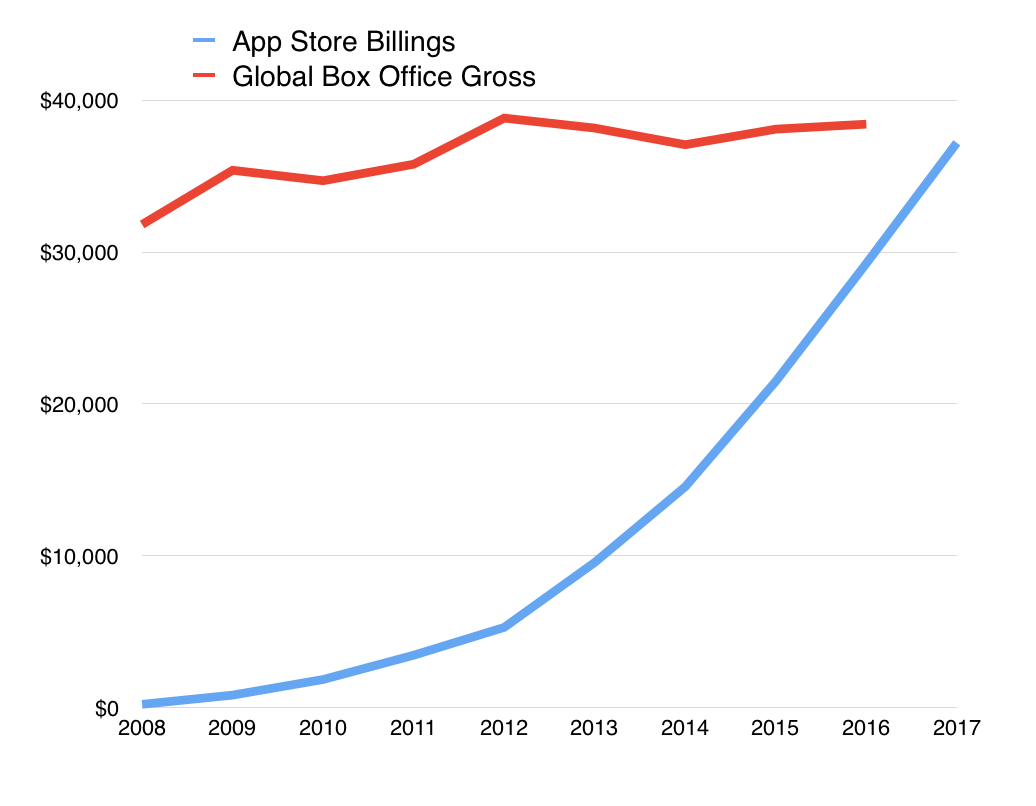
    I've made comparisons before with the app business being bigger than the film industry (and much bigger than the music industry.) This was considering Android revenues and iOS combined as "app revenues".

    As of this year the App Store alone will overtake Global Box Office revenues.

    Of course this is only an observation of the scale of App Store rather than a judgement of the benefit obtained from either medium or the substitutability of one for the other. ((The substitutability of apps for movies is not to be discounted either. The analysis should be based on understanding the jobs the media are hired to do.)) The reason scale should be noted is that the App Store, and Apple services overall, is becoming one of the largest enterprises in the world. Even more importantly, it should be noted for its rate of growth.

    Even when considering this, one should keep in mind that the figures of revenue and payments to developers are only a small fraction of the overall app economy. Apps sold to end users are a subset of all apps on the App Store. There are not only free apps but also many apps which are front-ends to complex services which are monetized in various indirect ways.

    Facebook, Twitter, Linkedin, Tencent, YouTube, Pandora, Netflix, Google, Baidu, Instagram, Amazon, eBay, JD.com, Alibaba, Expedia, Tripadvisor, Salesforce, Uber, AirBnB and hundreds of others are all "free" apps enabling hundreds of billions of dollars of interaction none of which are captured in the App Store revenue data. The vast majority of activity for the top commerce, communications and media properties are now coming through mobile devices.

    By weight of users and their propensity to engage, iOS enables about 50% to 60% of mobile economic activity.

    Based on assumptions of revenue rates for mobile services and iOS share of engagement, my estimate of the economic activity on iOS for 2017 is about $180 billion. Including hardware sales, the iOS economy cleared about $380 billion in revenues 2017.

    Additional assumptions around growth rates suggest that iOS economy will achieve the half trillion revenue rate in 2019. Valuing this, especially as a part of Apple's intrinsic value, is a challenge but it's probably worth doing. There are implications in the robustness or sustainability of the underlying business.

  3. The First Trillion Dollars is Always the Hardest

    Research · 61 comments

    In its first 10 years, the iPhone will have sold at least 1.2 billion units, ((Includes forecast for first six months of 2017)) making it the most successful product of all time. The iPhone also enabled the iOS empire which includes the iPod touch, the iPad, the Apple Watch and Apple TV whose combined total unit sales will reach 1.75 billion units over 10 years. This total is likely to top 2 billion units by the end of 2018.

    Screen Shot 2017-01-11 at 10.15.00 PM

    The revenues from iOS product sales will reach $980 billion by middle of this year. In addition to hardware Apple also books iOS services revenues (including content) which have totaled more than $100 billion to date.

    This means that iOS will have generated over $1 trillion in revenues for Apple sometime this year.

    In addition, developers building apps for iOS have been paid $60 billion. The rate of payments has now reached $20 billion/yr.

    screen-shot-2017-01-11-at-9-41-29-pm

    Not included in this payment total are "mobile-first" or "mobile mainly" businesses such as FaceBook, Twitter, Linkedin, Tencent, YouTube, Yahoo, NetEase, Pandora Radio, Google Search, Baidu, Google Maps, Gmail, Instagram, Amazon, eBay, JD.com, Alibaba, Priceline, Expedia, Salesforce and Other Enterprise Software, Ride Sharing Apps, AirBnB and many other services which monetize independently of the App Store.

    I estimate that the cumulative revenues enabled by iOS across these businesses have exceeded $500 billion, with a rate of revenue soon to reach $300 billion/yr.

    The revenue numbers can only hint at the change in behavior among users. An iPhone is unlocked 80 times a day. Assuming 600 million devices in use there are 48 billion sessions on iPhones every day. 17.5 trillion sessions every year. It is these instances of interaction and engagement which are desired by all businesses built on top of the ecosystem.

    These instances of engagement must be multiplied by the quality of the customers which Apple captures. iOS users spend more and are more loyal than those on alternative platform thus qualifying the platform as "premium" and thus adding to its value in the eyes of developers, content producers and service providers.

    As the install base of iOS increases and as users hire the devices to do more and spend more time with them the virtuous cycle of value creation will continue and accelerate.

    There is a temptation to think that such a business is fragile and will be disrupted. Challengers appear daily and the number of iPhone "killers" is not measurable. One can cite the billion users of Nokia phones which defected. One can cite the loyalty of BlackBerry users that evaporated. One can even cite the juggernaut of Windows and how it became impotent. One can cite the vast number of Android devices offered at low prices.

    But there are reasons to believe that the iOS empire is far stronger and resilient.

    Unlike Nokia's phones, Apple's product is an ecosystem with network effects and dependencies on software and services. It's also a monolithic product with a singular interface and form factor.

    Unlike BlackBerry, the iPhone does many jobs--too many to count. Indeed the iPhone evolves and changes its core value over time.

    Although different in many ways from Windows there are strong similarities in terms of loyalty and persistence of users. iOS even developed a dominant position in enterprises. Microsoft's attempt to become a hardware company is a testament to the confluence of the two business models.

    And whereas Android was originally seen as the "good enough" iPhone, potentially disrupting it, it turns out to be the ersatz iPhone. Chances are higher that users will switch from Android to iPhone and not the other way. Again, the reasons have more to do with the ecosystem and quality of users (which are hard to measure) than with the hardware (which is easy to measure.)

    As we look toward the second decade of the iPhone, the expectation isn't one of another "big bang" but a process of continuous improvement. The market is nearing saturation so the goals must be to capture more switchers from Android. Apple has achieved this with the Mac: survival, persistence and eventual redemption.

    More exciting is the apparent expansion of a network of ancillary "smart" accessories. The Apple Watch, the AirPods, Pencil and possible new wearables point toward a future where the iPhone is a hub to a mesh of personal devices. The seamless integration of such devices is what has always set Apple apart.


  4. Counting Apple's Customers

    Research · 15 comments

    Berkshire Hathaway, led by Warren Buffett, now owns about $1.4 billion of Apple. Occasionally we hear about various "celebrity investors" taking positions in the company or exiting those positions. The last one I remember was Carl Icahn. He seems to have exited Apple before Berkshire entered. There are some who will act because of these decisions. You should not be one of them.

    Nor should the management of the firm act in response to investor decisions or concerns. Management is specifically distinct from ownership in the corporate construct precisely in order to bring professionalism to the role. The manager must set priorities as they see fit, irrespective of what the transient owner might prioritize. The separation of ownership and management is one of the greatest innovations in commerce.

    There are many opinions on what priorities should be. Delivering a specific financial ratio, achieving a certain market position, changing the world for the better. These have all been cited as top priorities. I happen to believe that what matters most is the creation and preservation of customers. That is because I see customer creation as causal to the other desirable outcomes and it is therefore the more important priority.

    And this is why, whenever possible, I try to deduce how well a company is performing on this metric. The greatest companies (by market capitalization) today are certainly examples of achievement in customer creation. Facebook, Microsoft and Google are members of the "billion user club" or companies that crossed a billion active users.

    But do they really have a billion customers? Microsoft has over 1.2 billion users but many (most?) of those users are using computers that their employers provide on which Microsoft software was installed. They may not have made the choice to purchase the tools they are using. Microsoft certainly has millions of customers in the form of "accounts" purchasing its products and services, but It's not likely that there are a billion people who have directly chosen to buy a Microsoft product.

    Facebook has over a billion daily users. Facebook users are certainly using the service of their own accord but they are not paying for the service. Quite the contrary, the actual customers of Facebook are companies buying an advertising service offered in the form of exposure to those billion users. The Facebook users are the product being sold, not the buyers. Thus Facebook's total number of paying customers is probably only in the tens or hundreds of thousands. ((Orr Sella @orrsella pointed out that Facebook has stated that they have 3 million businesses actively advertising on their networks.))

    Same with Google. We don't know how many accounts Google send invoices to but the number is very likely not even in the 100 million range. Its billions of users are beneficiaries of services but they are not paying Google/Alphabet.

    Amazon has many millions of customers, if not billions. Prime membership is above 50 million but not above 100 million. Amazon may some day have a billion customers but there are limits to how quickly that can happen. The growth potential is governed by logistics and that's as much an issue with atoms as it is with electrons.

    Which brings us to Apple. Apple does not offer a figure on its specific user count, but we have some viable proxies:

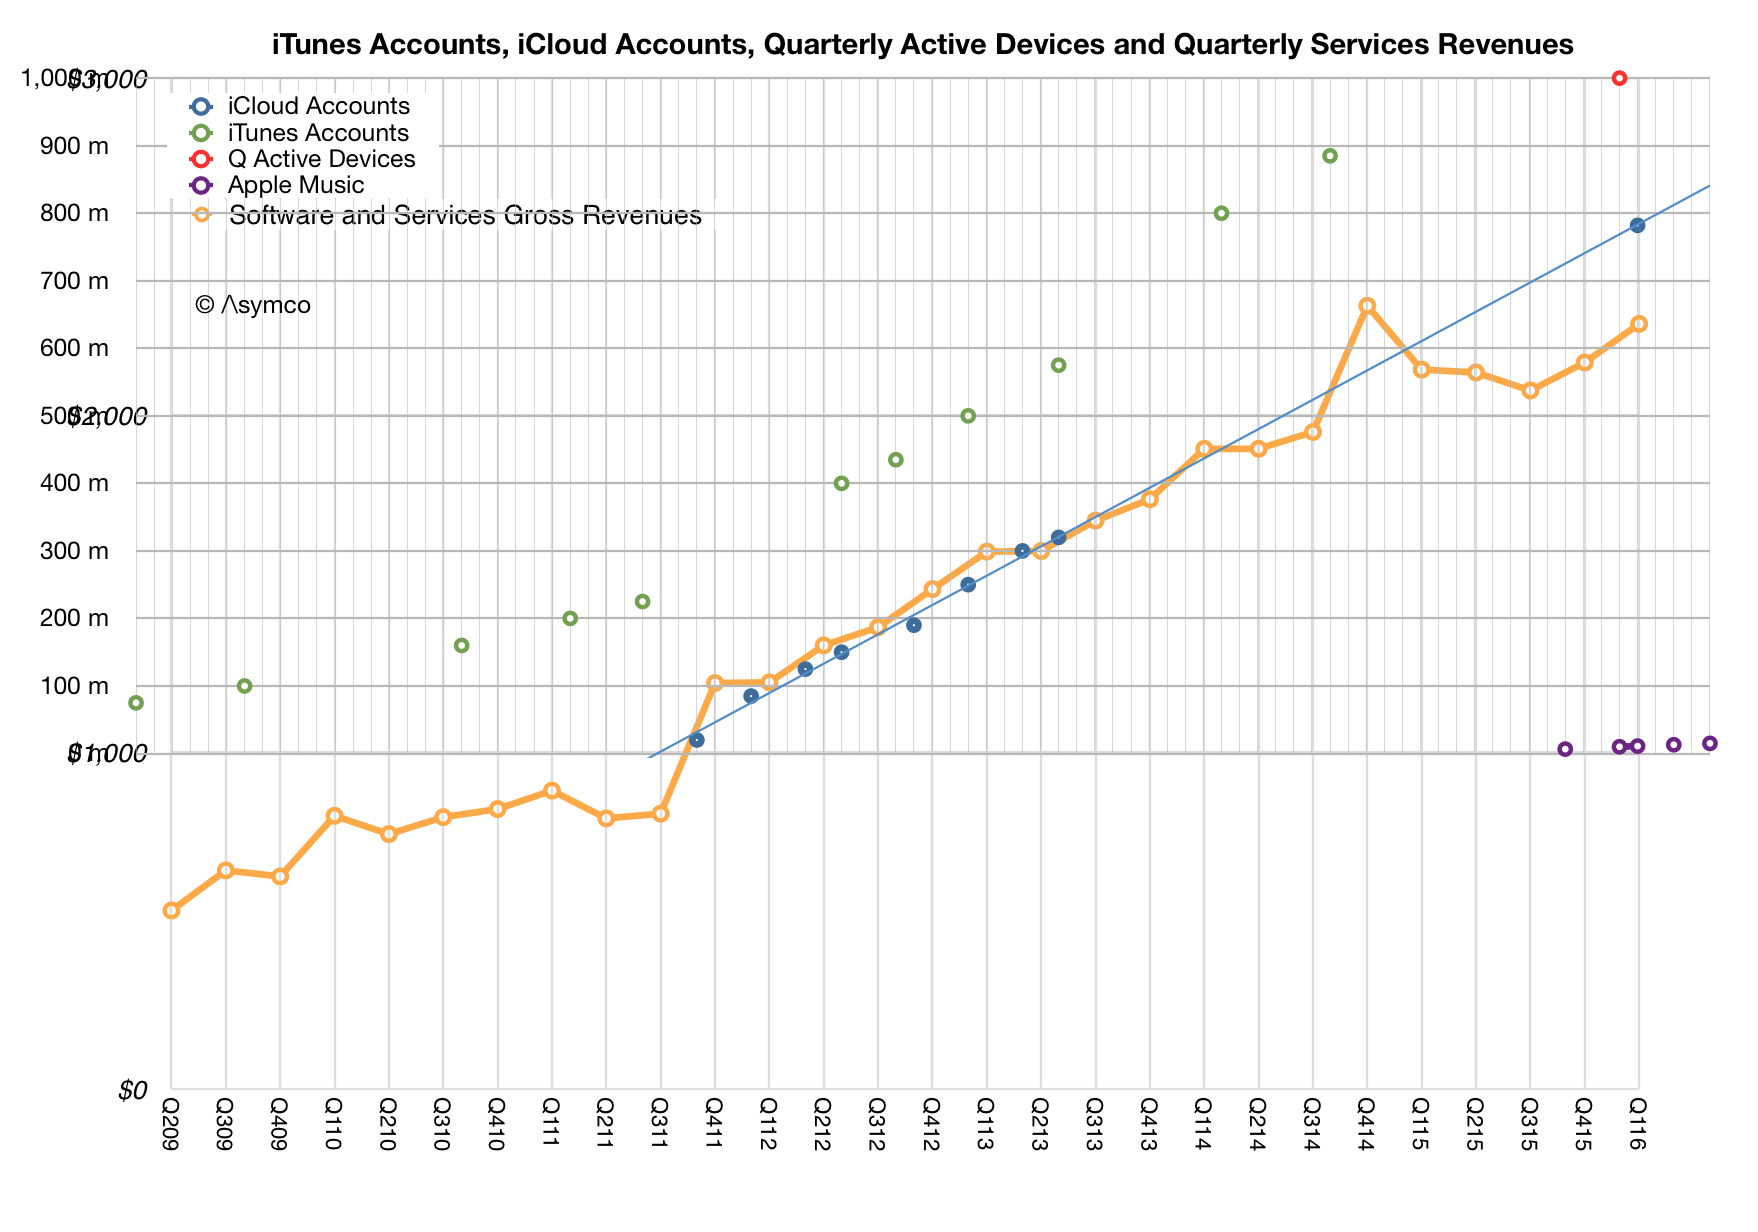
    • iCloud accounts reached 782 million in February 2016.
    • iTunes accounts reached 885 million in September 2014
    • Active devices reached one billion in January 2016. That number is likely above 1.1 billion now. (Includes all devices, hence Macs and Apple TVs).

    These figures are also parts of patterns (shown below) which offer an indication of predictable growth.

    Screen Shot 2016-08-17 at 9.23.26 PM
    Screen Shot 2016-08-17 at 9.27.38 PM

    In addition to the absolute figures and their growth there is also the question of loyalty (frequently cited by the company), switching from other platforms (also frequently cited) and revenues. The company publishes specific figures on service revenues for consumer attached devices showing a run rate of $41 billion/yr in services for their device base.

    In combination, a picture emerges which shows that Apple has nearly a billion customers. I can't say how many with any precision but it's certainly above 500 million (on the basis of iCloud and iTunes accounts). It's below one billion because some users have more than one device.

    Even though it has not happened yet, the trend is pretty clear. Apple will at some point in time have a billion paying customers.

    What is more significant than the specific count is that these customers mostly chose to be customers individually. Some may have been given the products as gifts, but the vast majority bought the items for themselves. Apple benefitted from hundreds of million of individual purchase decisions.

    Furthermore, having made the decision to purchase, chances are that they will do so again. Apple customers are a recurring revenue stream. In fact, it's fairly easy to calculate that being an Apple customer is equivalent to spending about $1/day on its products and services, indefinitely.

    Apple is not there yet, but a billion dollars a day from a billion customers is not inconceivable. That would be quite an achievement.

  5. The Alphabet of Google A and Google B

    Research · 86 comments

    For the last few years, I've been proposing that the way to conceptualize Google is as two separate entities: Google A and Google B.

    Roughly speaking Google A was the R&D ((Research and Development)) organization and Google B was SG&A ((Sales, General and Administrative)). You can find the operating expenses of running each of these organizations in the company's income statement.  In the last quarter R&D was about $2.8 billion and SG&A was about $3.5 billion ((Sales and marketing was $2.1 billion and General and Administrative was $1.5 billion)). The two entities are further distinguished as follows:

    • Google A was led by Eric Schmidt and Larry Page and Google B was led by persons unknown, but mostly represented by the "Chief Business Officer" Omid Kordestani.
    • Google A spends money. Google B collects money.
    • Google B sends a check to Google A while Google A sends data to Google B (which then sells it on to advertisers and collects money).
    • Google A communicates frequently with optimism and enthusiasm about the future. Google B remains quiet.
    • Google A solves problems of humanity, Google B solves problems for advertisers.
    • Google A has users, Google B has customers (to whom it sells users.)

    In summary, Google A is altruistic, Google B is pragmatic. Google A engages in research, Google B engages in commerce. Google A operates in a structure similar to a Bell Labs for the good of humanity ((Using a definition of Good as established by the founder)),  Google B operates in a structure similar to AT&T and collects monopoly rents but without any government oversight.

    This was an effective construct for analysis which explained to me much of how Google operated and how it made decisions. So what do we make of Google's new Alphabet? Is this a dissolution of the Google B/Google A dichotomy?

    My initial answer is no. We don't have a change in this core structure. What we have instead is a split of Google A into Google A and Google A+.

    A+ is the crème de la crème of the altruistic Google A. It's the stuff that really does not make money. It's the laboratory of Bell laboratories. It's the moonshot manufacturer. It's the incubator where hobbies are hatched. It's the funder of ventures.

    After A+ is carved out, Google A and Google B remain exactly as they were, now under a new CEO. The previous CEO no longer has any day-to-day input in the running of Google A and is no longer soiled by association with Google B.

    Alphabet is therefore the "holding company" of Google A+, Google A and Google B. I can only suppose that the separation of A+ from A (and the previous A from B) allows the founders to distance themselves even further from the purchase decisions which, through pricing signals, determine where value lies and how resources should be allocated. That must be a great relief.

  6. Samsung's profit center

    Research · 41 comments

    Will there come a time when Samsung will earn more profits from the iPhone franchise than from its own Galaxy product line?

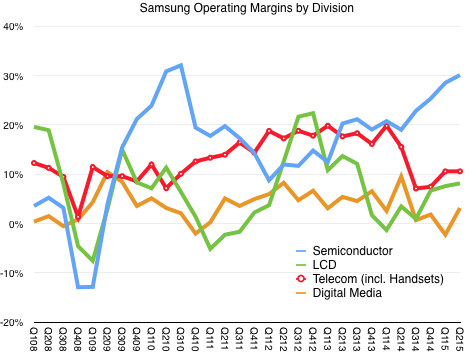
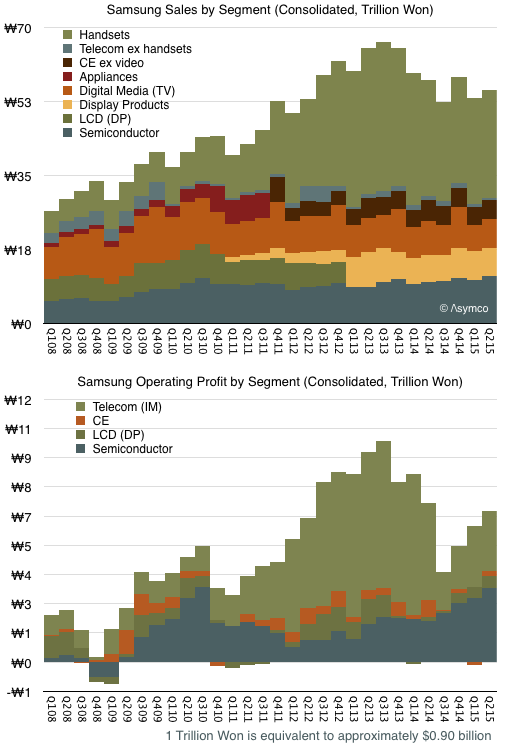
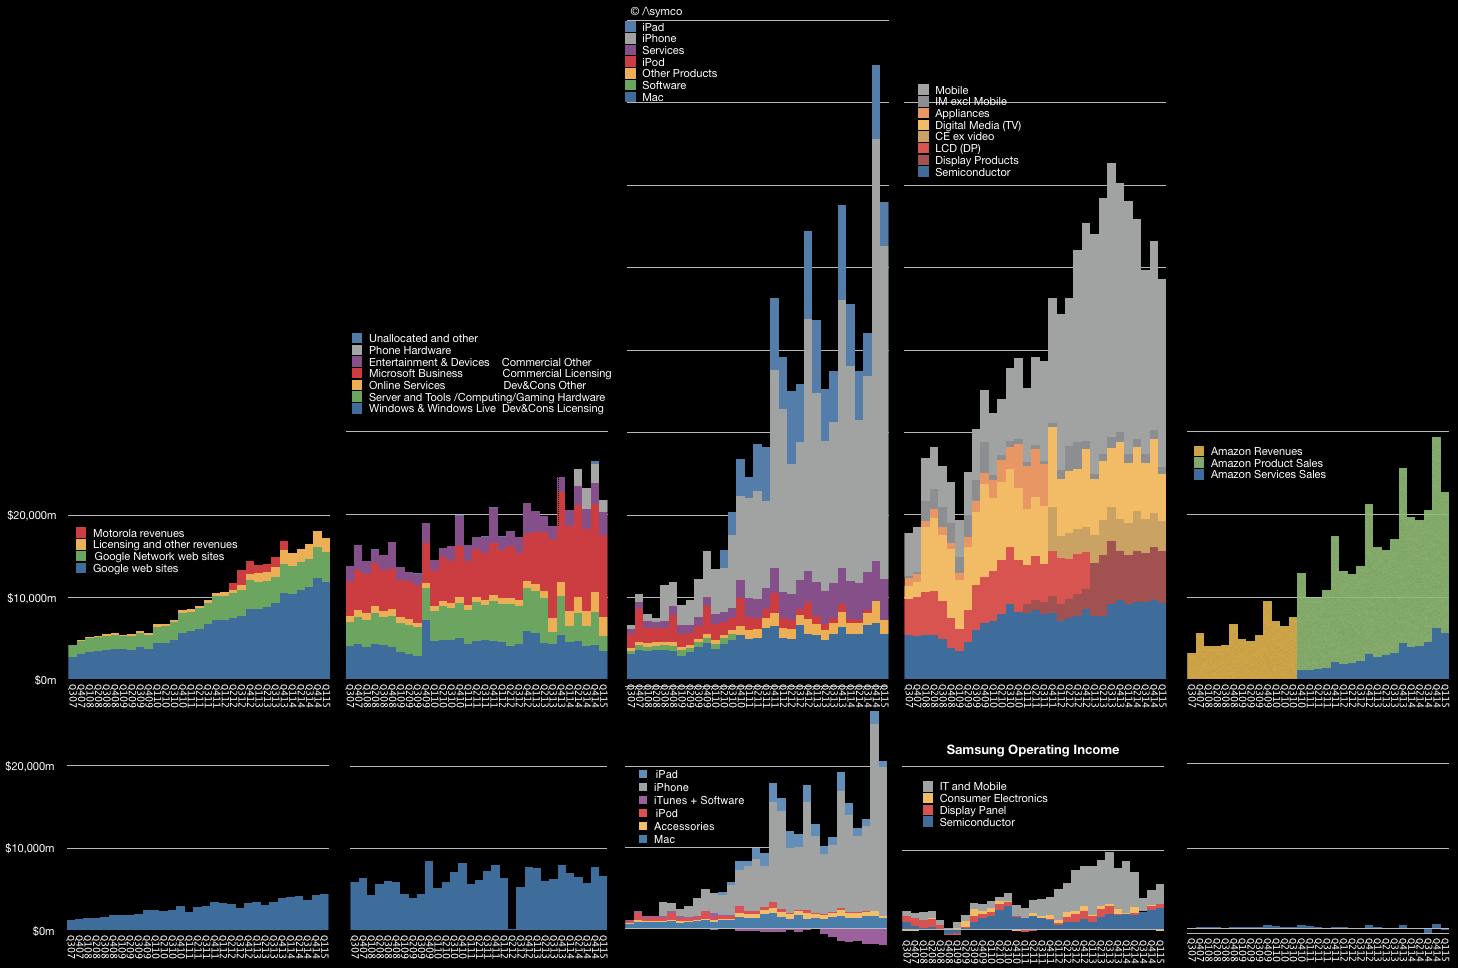
    The problem for Samsung is that although it still sells the most phones ((over 80 million but we don't have a precise figure)), and the most smartphones, the price and margins for these products are collapsing. The pattern is shown in the graphs below:

    Screen Shot 2015-07-30 at 7-30-8.20.29 PM
    Screen Shot 2015-07-30 at 7-30-8.20.22 PM

    Phone operating margins peaked in Q1 2014 at 20% but are half that level today. These margins have dropped to levels Samsung had in 2009, before the Galaxy launched and before they had any substantial revenues from smartphones.

    In contrast, the semiconductor group is growing both revenues and margins. Margins and operating profits are both 50% higher than those of devices.

    We also know that Apple is Samsung Semiconductor's single biggest customer. We can't be sure how much of the total revenue/profit comes from Apple but if the pattern continues then Apple could be the greatest contributor to Samsung's profitability in the near future.

    How could this be? Wasn't Samsung supposed to "disrupt" Apple?

    The reality is that Samsung's own smartphones are being disrupted by good-enough Android devices, typically made by Chinese brands. This low-end disruption is also affecting LG, another phone maker and Apple supplier.

    Unlike Samsung and LG, Apple is less susceptible to low-end disruption. What Apple offers is a brand promise, an ecosystem, associated products and services and what amounts to a new market. It's this parallel value network that competes with Android/Google, rather than with Samsung.

    Samsung is a supplier in the Apple network and a licensee in the Google network. As a result, it has a near monopoly position with a platform controller (Apple) and a commodity position with a platform licensor.

    Neither position is one of control, but the current market stage benefits Samsung within the Apple ecosystem more than  in Google's ecosystem. It's a situation analogous to one where Intel made both x86 chips and PCs that ran Windows. Long term it's likely that the sole-source chip business does a lot better than the multi-source systems business.

    That should be a warning to others who hoped to survive as Android OEMs. They don't have semiconductors to sell to Apple.


  7. Where are Maps going?

    Research · 311 comments

    At the 2015 WWDC Apple stated that it receives 5 billion requests per week for its maps service. It also said that Apple maps is used 3.5 times more frequently than "the next leading maps app."

    These two data points are the total number of data points we have about the global maps market. Neither Google nor Nokia provide usage or share or performance data. Regardless, commentary on the usage, share and performance of Apple Maps has been abundant for the three years since its inception.

    The data presented allows us to make a few estimates for the first time and we can hope that additional data can allow a picture to emerge of where maps are going.

    With these first two data points we can finally make some estimates. But some assumptions are still needed: We need to assume that the "next leading maps app" is Google Maps. Although there are other maps apps on the iOS platform they are probably insignificant and it's a two-horse race between Google and Apple on iOS.

    This means that the 3.5:1 split in usage results in a 78% share for Apple Maps and a 22% share for Google. If we assume that there are about 400 million iOS users of maps ((Note that not all iOS users are maps users. Maps are not used by all users)), it leads to about 90 million Google Maps users on iOS and about 310 million Apple Maps users on iOS.  This includes iPad. ((We are excluding OS X use of Maps.))

    Given that Google also reported 1 billion downloads in 2014 ((though not necessarily all of these downloads lead to active use, obviously)) we can assume between 25% to 33% Apple Maps "market share" of usage.

    At the minimum, 25% share is not insignificant and it's easily sustainable. To understand why, we should note that there is one more data point. In December 2012 I posted an analysis on the the cost of maps. It showed that maintaining maps requires an investment of between $1 billion and $2 billion/yr. With the addition of new features such as 3-D mapping, transit maps and thousands of new cities, the cost is likely to have increased. $2 billion/yr is probably the norm today.

    Apple then could be seen as spending about $6.5/user/yr on maps and Google could be spending about $2/user/yr. To be profitable Google would need to find ad revenues of $2/user/yr and Apple would need to find $6 of profit on each phone/yr. Clearly, each of these targets is achievable.

    In contrast we can see why Nokia's HERE Maps business is now worth a lot less than it was in 2007. The asset has been for sale for some time and the latest bid  has been for $3 billion, making the $5 billion lost in market value and $7 billion of investment since seem like a catastrophe. Without a business model the data is worthless--with only 30 million users the cost per user reaches $66/yr. A buyer needs to find an appropriate model for sustaining a $2 billion/yr burn rate.

    So the question of where maps are going depends on the business model for maps. In a world where maps are sustained by device value, 300 million users makes it sustainable. In a world where maps are sustained by advertising, 1 billion users makes it sustainable. What else is there?

    How about a world where maps are sustained by transportation services?

    Uber's and other auto makers' interest in HERE shows a third business model. Accurate maps are a key to making vehicles autonomous. More so even than the value of the algorithms, precise imaging of roadways enables vehicle autonomy and the value of location gathering systems should grow to meet that future.

    It's highly likely that Google's maps efforts are going to continue because they are fueled by a business model. That is also true for Apple's maps efforts, though they are fueled by an entirely different business model. Each of these business models fuels the improvement of the maps product but also of the maps gathering process. As these processes are expensive and licensing options are few there is little incentive to share the data. As a result the processes remain integral to the businesses.

    This integrated-while-fueled nature means that maps makers will find it compelling to pursue adjacent business models, i.e. transportation services. It's not a matter of whether they will or won't. It's only a matter of when and where.

  8. Unicornia

    Research · 14 comments

    Unicorns typically are valued on the basis of number of users. While they are not yet monetizing those users, their growth and engagement metrics are expected to be off the charts. As there are no revenues (or profits) the $billion valuation hinges on a nominal value of $/user. That figure is based on comparable companies (e.g. Facebook) which do monetize their users.

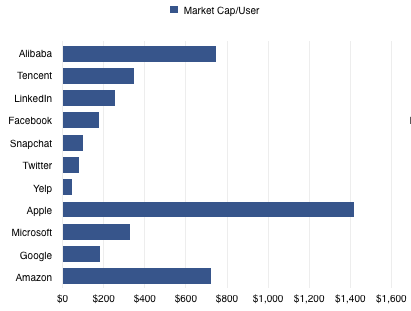
    Since the unicorn's capitalization/user defines its valuation, which company should be considered comparable? Unfortunately they range widely. There are many alternatives. The graph below shows a few Market Cap/Mobile User rates ranging from $45 for Yelp to $747 for Alibaba.

    Screen Shot 2015-05-15 at 5-15-2.47.16 PM


    Note that I've also added companies which may not be considered as unicorn comparables because they are not usually valued on a per-user basis. Apple, Microsoft, Google and Amazon are priced by product sales, typically. However, most of them operate and self-define as service organizations. Microsoft has been "monetizing users" for decades using a recurring revenue model. It has a "SaaS" business logic for most of its revenues. Google ((Google users are estimated at 2 billion active Android/GMS devices)) likewise. Amazon reports its active users every quarter and obviously is measuring itself by that metric.

    Apple ((The assumption here is that Apple has 520 million active users which is based on iOS devices in use estimates)) is the least likely to be seen as a company whose value is a function of user base. Nonetheless it behaves entirely on that basis. The company's entire strategy depends on satisfying its customers and building its brand which can only have one outcome: loyalty and repeat purchases. The services and software they offer can be seen as supporting that brand loyalty which is converted to profit through an above-average selling price.

    Being mature of business model therefore does not exclude a company from being valued like all the kids are these days.

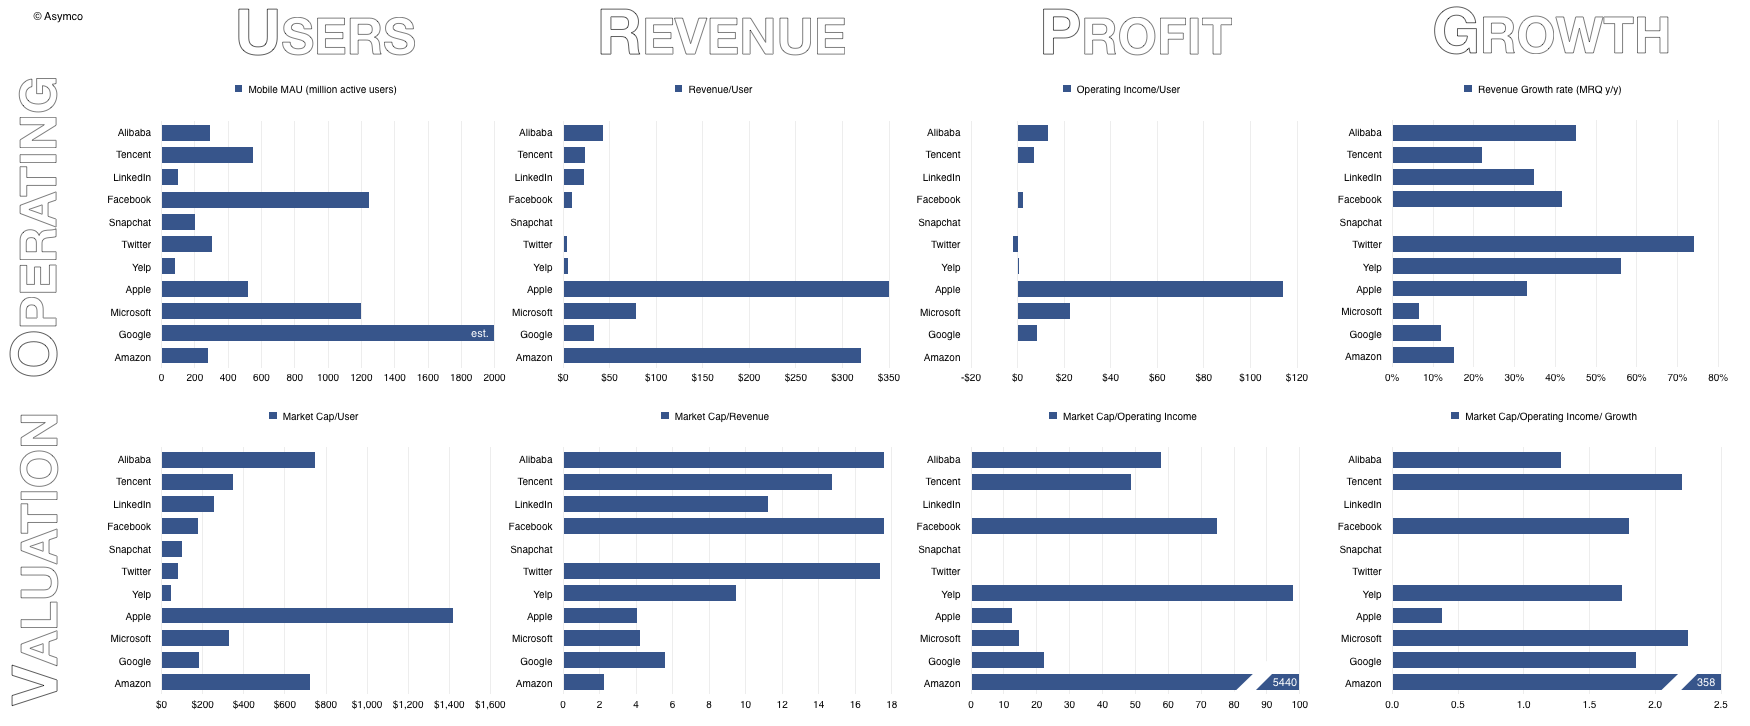
    So, if we do look at the value/user metric we might as well look at the revenues, operating profit and growth data.

    Screen Shot 2015-05-15 at 5-15-3.09.43 PM

    Unicorns are therefore characterized as having negligible revenue or profit but significant growth. The growth of Alibaba, Tencent, LinkedIn, Facebook, Twitter, Snapchat and Yelp should be seen in the 50% y/y range. The growth of mature companies is more modest: Microsoft (<10%), Google (12%), Amazon (15%).

    Apple is an exception with recent growth in the 30% to 40% range.

    Markets therefore value internet services at multiples of 10 to 20x revenues and 50x at least in terms of operating income. These multiples don't yet apply to Unicorns, since they typically don't have revenues, but the expectations are typically in this range once they do.

    Mature product companies are valued more cheaply with 2x revenues for Amazon (a retailer with zero margins) up to Google with near 6x. Apple and Microsoft are in the middle at 4x revenues.

    Mature company value as a function of income is also much lower ranking from about 12 for Apple to 22 for Google. Amazon's multiple is astronomical only because it has almost zero income.

    Finally, when considering growth and income together ((When seen into the future this is the PEG ratio or Share Price/Earnings/Growth. When seen into the past, this is the PETG or Share Price/Earnings/Trailing Growth)) both emerging services and product companies are priced between 1.3 and 2.5. The outliers are Amazon due to its lack of income (PETG of 358) and Apple with its enormous income (PETG of 0.4).

    This last ratio has had a "rule of thumb" of 1.0 being the "fair value" with <1 being seen as under-valued for growth and >1 being over-valued. Alternatively it can be seen as either pessimism about sustainability or optimism, respectively.

    Clearly Unicorn Mania (or Unicornia) is a reflection of an optimism around new market disruptions in many industries where software has suddenly become ingestible.  Old-school software companies are seen as less exciting in this context. If only they could take part in these new market creating opportunities then maybe they too could benefit from this optimism.

    Now that would be crazy talk.

  9. iPhone, killer

    Research · 253 comments

    Screen Shot 2015-05-13 at 5-13-8.20.01 AM


    Searching for "iPhone killer" returns millions of hits. It's hard to remember any phone/product/service/platform/initiative/merger/startup which was not at some point considered an iPhone killer. A sampling is offered here.

    In reality, the killers seem to have all faded away while the iPhone continues. We could just shake our heads and move on, but a deeper analysis is possible. Take a look at the graph above. Note that iPhone's (and hence Apple's) ascent has not caused decline in its nominal competitors. When seen in the context of the graph above, the success of the iPhone has in fact been complementary to those companies who would be its killers.

    Consider that the iPhone drives a large portion of Google's revenues as it is the home to many Google services and engagement through the iPhone is higher than any other platform, including Google's own. iPhone users tend to make better customers. In exchange Google pays a great deal for traffic acquisition on iOS devices. The placement of search on Safari is probably the biggest single cost item on Google's income statement ((Estimates are a few billion dollars a year.))

    The iPhone example drew Google to build Android as a facsimile and that, coupled with Brobdingnagian spending on marketing, led to Samsung's Galaxy success. That success seems to have peaked and the brand is now a victim of low-end disruptors which copied it and the iPhone in turn. However, Samsung electronics benefits from the iPhone in terms of its semiconductor division. Apple is Samsung's biggest customer and the semiconductor division is now the largest source of operating profits.

    The explosion of Android has led to IP licensing revenues for Microsoft and now Microsoft is extending its software applications to iOS, hoping to participate in the iOS ecosystem rather than competing with it. The time may come when Microsoft shows growth from the iPhone.

    Finally, although it may seem oblique, Amazon is benefiting from the iPhone. Instead of killing it with the Fire ((presumably as a low-end disruption)), the iPhone and iPad offered much more mobile shopping opportunities to the Amazon store. Data shows that iOS leads in shopping traffic and order size precisely at a time when Amazon obtains its largest volumes. Amazon's AWS also handles a great deal of iOS-originated traffic.

    This alternate reality shows that the benefits from the iPhone revolution are broad and deep. It's not just the direct revenues (($25 billion paid so far)) from app sales on the App Store but also the creation of entire new communications modalities (Instagram, Snapchat, WhatsApp) new services (Uber, Airbnb) and the multi-billion dollar accessories markets. These benefits are largely unmeasured and therefore not visible in accounting systems. They are perceivable however.

    Users perceive the value, developers perceive the value and, in the end, the only account that matters, the brand, accrues these perceptions to grow in value.

    As the brand flourishes, the perception of vulnerability dissipates and the narrative shifts from Apple getting killed to killing it.

    It's taken eight years and 500 million loyal users but, perhaps, just perhaps, this change in perception is entering the collective consciousness.


  10. The 2015 "Sleeper Ideas" List: Trends, Stocks, And Private Companies To Watch - Forbes

    Research · 16 comments

    My choices:

    1. Cyanogen. This company should develop a credible path for AOSP (non-Google Android) especially in India. I expect a lot of traction as OEMs who embrace Android reject Google.

    2. iPad. Not as a consumer product but for the Enterprise. The iPad grows up into a solid product for business while being replaced by phones in consumer “jobs to be done”.

    A few more ideas are listed here: The 2015 "Sleeper Ideas" List: Trends, Stocks, And Private Companies To Watch - Forbes.


  11. Faster Followed

    Research · 76 comments

    Samsung's smartphone ascent was breathtaking. From having essentially zero market share in the category in late 2010 to becoming the largest vendor took less than two years. In doing so it grew to become the largest phone vendor, smart or not--a goal which eluded them during the previous decade of effort. Samsung went on to capture not only the lion's share of unit volumes, they also took almost all the profits in the Android mobile phone market.

    And in a market filled with competitors. Literally hundreds of vendors and thousands of products were available at every conceivable price point. Samsung did away with HTC, LG, and Motorola. HTC, the first Android vendor (and first to market with Windows Mobile), Motorola, Google's launch partner in the US and "Droid" brand partner (and future owner).  Google's own Nexus products. Samsung Galaxy ruled them all.

    Galaxy swamped the Chinese market and the Indian market, the largest in the world. They were so powerful that they were singled out both by Microsoft and Apple for IP royalties.

    All within two years or the average life-span of one smartphone.

    But something went wrong in 2014. Growth in shipments suddenly stopped. This was not a problem with the overall market, which kept growing. The slowdown did not affect other vendors, especially the up-and-coming Lenovo and Xiaomi and the second and third tier vendors whose names are  known only in the local markets they serve.

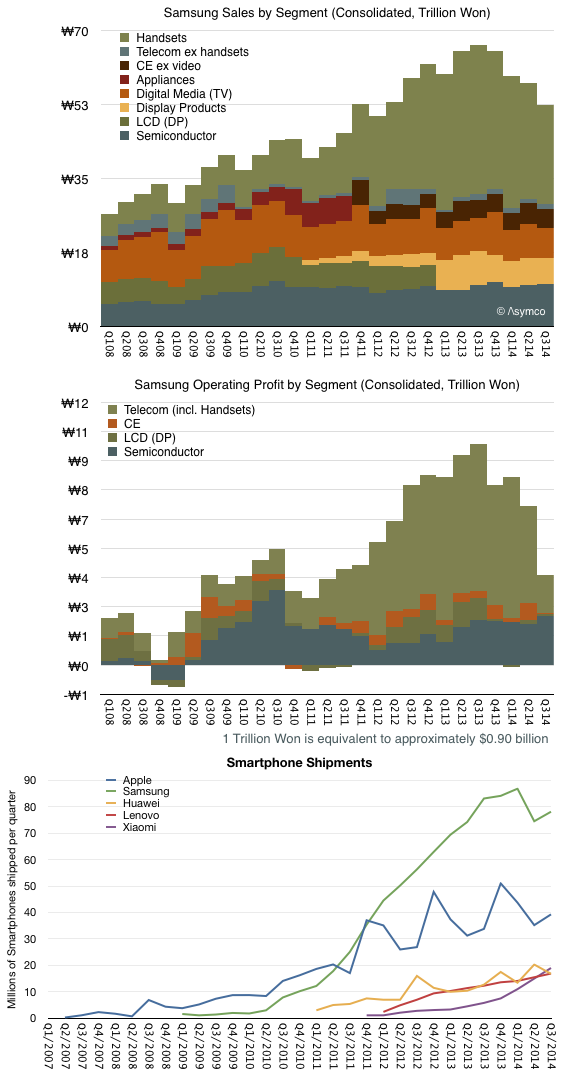
    The result of this slowdown is shown in the following graphs:

    <>

    Screen Shot 2014-10-30 at 10-30-4.11.19 PM

    Note how the wobble in units shipped was foretold by slowing revenues and an even more profound effect in profits. Peak revenues and profit occurred in Q3 2013 while volumes continued to grow until Q1 2014. Even in the last quarter, shipments are at near year-ago levels. Profits however have dropped to 2011 levels.

    At the same time, Apple shipments continue to grow as do those of Lenovo, Huawei and Xiaomi. Xiaomi in fact is growing in a trajectory eerily parallel to that of Samsung from 2010. It just hit the same level of volume that Samsung had in Q2 2011. And Samsung had been making phones for decades while Xiaomi is barely two years old.

    Having seen a boom/bust rise/fall pattern with other vendors (e.g. Nokia and Blackberry) it should behoove us to ask what are the causes of success and failure in this business. Samsung management suggests that they perceive speed of action, product mix/portfolio choices and hardware experimentation are the keys to their success.

    However, competitors which are rising rapidly (at the expense of Samsung) are not acting in the same way. Xiaomi is patterned as a Chinese Apple, offering design, brand, attention to detail and software as differentiation. Lenovo is building on its computing roots and expanding with acquisition. Huawei and ZTE leverage networking business and operator relationships.

    The crisper answer to causality may be that the market is bifurcating into an "upper" market where new jobs-to-be-done are being explored with integrated offerings (Apple and Xiaomi) and a "lower" market which is in the throes of low-end disruption. Both are competing with non-consumption though the upper market is service non-consumption and the lower market is feature non-consumption.

    Samsung is stuck right in the middle ((Just like Nokia was.)) It defines itself on the basis of what exists. It competes only within a defined market and positions itself agains existing products. They claim to be "better" than the competition and make the point loudly with their advertising. However, being better is never a solid foundation. At some point you'll be either good enough or someone more agile will be faster than you.

    At some point the fast follower exposes themselves to being faster followed. Better to find new lands to conquer.