Asymco

Asymmetric Intelligence

gross margin

  1. Margin Call 2

    Research · 164 comments

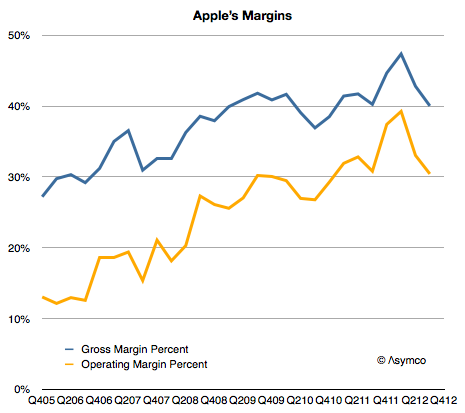
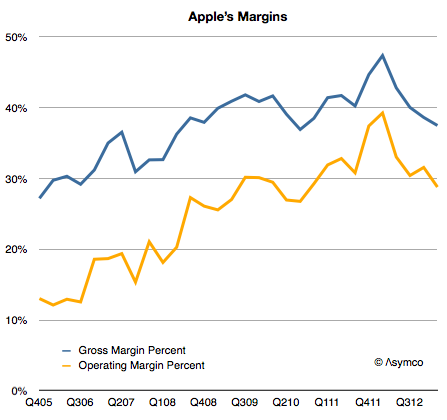
    I expected Apple's margins to improve  last quarter. They didn't and so the question I needed to answer is why. Here is a history of Apple's gross margin and operating margin as reported since late 2005:
    Screen Shot 2013-04-25 at 4-25-9.26.53 AM

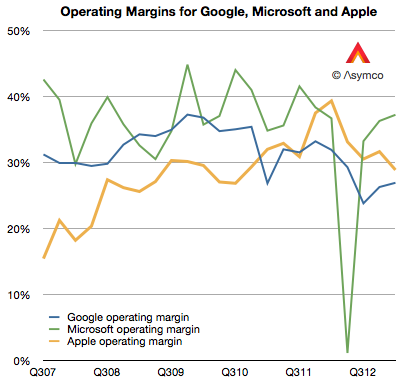
    For a company selling hardware these are extraordinarily high margins. They are higher than those of Google and have narrowed the gap with Microsoft,  neither of which has a high proportion of hardware sales:
    Screen Shot 2013-04-25 at 4-25-10.06.04 AM

    But they are not growing and the reason is to be found in the reason they grew in the first place: because of proportion of iPhones making up the total sales.

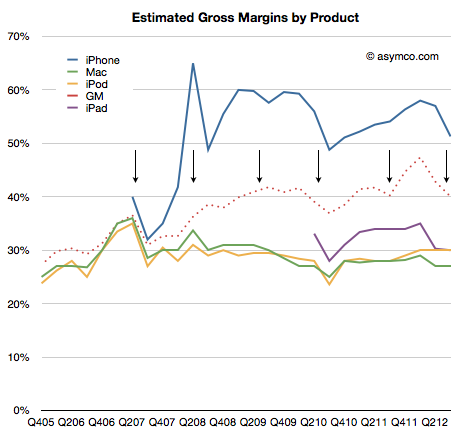
    As a reminder, the iPhone is a uniquely profitable product. I estimate that it obtains about 50% gross margins. The history of these estimates is shown below:
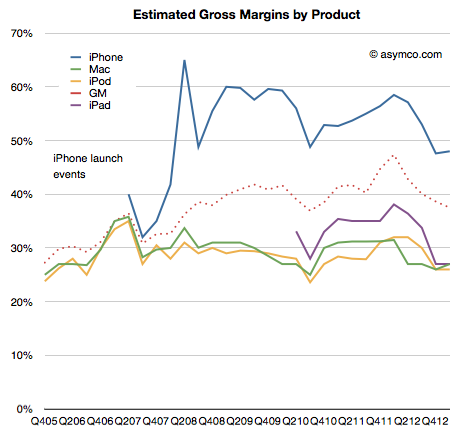
    Screen Shot 2013-04-25 at 4-25-9.32.34 AM

    It remains in stark contrast to the margins Apple obtains for its other products. Much of that is due to the pricing power of the product as shown below:
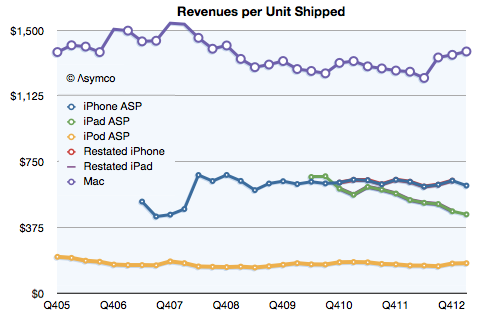
    Screen Shot 2013-04-25 at 4-25-9.33.13 AM

    Notice that even after the launch of the iPhone 5 and the persistence of two previous generations of iPhones (and their lowered pricing) has barely put pressure on pricing.

    Contrast that with the iPad. As its breadth of offerings increases, it causes a lower price per unit.  The iPhone is now at $613 per unit, even with two older generation products available. (The lowest price was in Q2 2012 when the average price was $608.) The iPad is at $449 per unit, down from $662 at launch three years earlier.

    So overall, margin is a function of three things:

    1. Price changes: iPhone had a small reduction (from $635 to $613) but the iPad has had a moderate reduction in price (from $531 to $449).
    2. Cost of components: This is reflected in product-line gross margins which can only be estimated. Compared to last year I estimate that iPhone gross margin dropped from 58% to 48%. iPad margins also fell from about 38% to 27%. The reasons were given by management as "Last year, our business benefited from …a more favorable foreign currency environment, and historically low costs."
    3. Mix of high and low margin products. The iPhone units grew at 7% but the iPad units grew by 65%. A year ago iPhones were 58% of revenues and this year they were 53%. The iPads were 17% and now they are 20%.

    The result is seen in this one graph showing the allocation of revenues and margins by product:
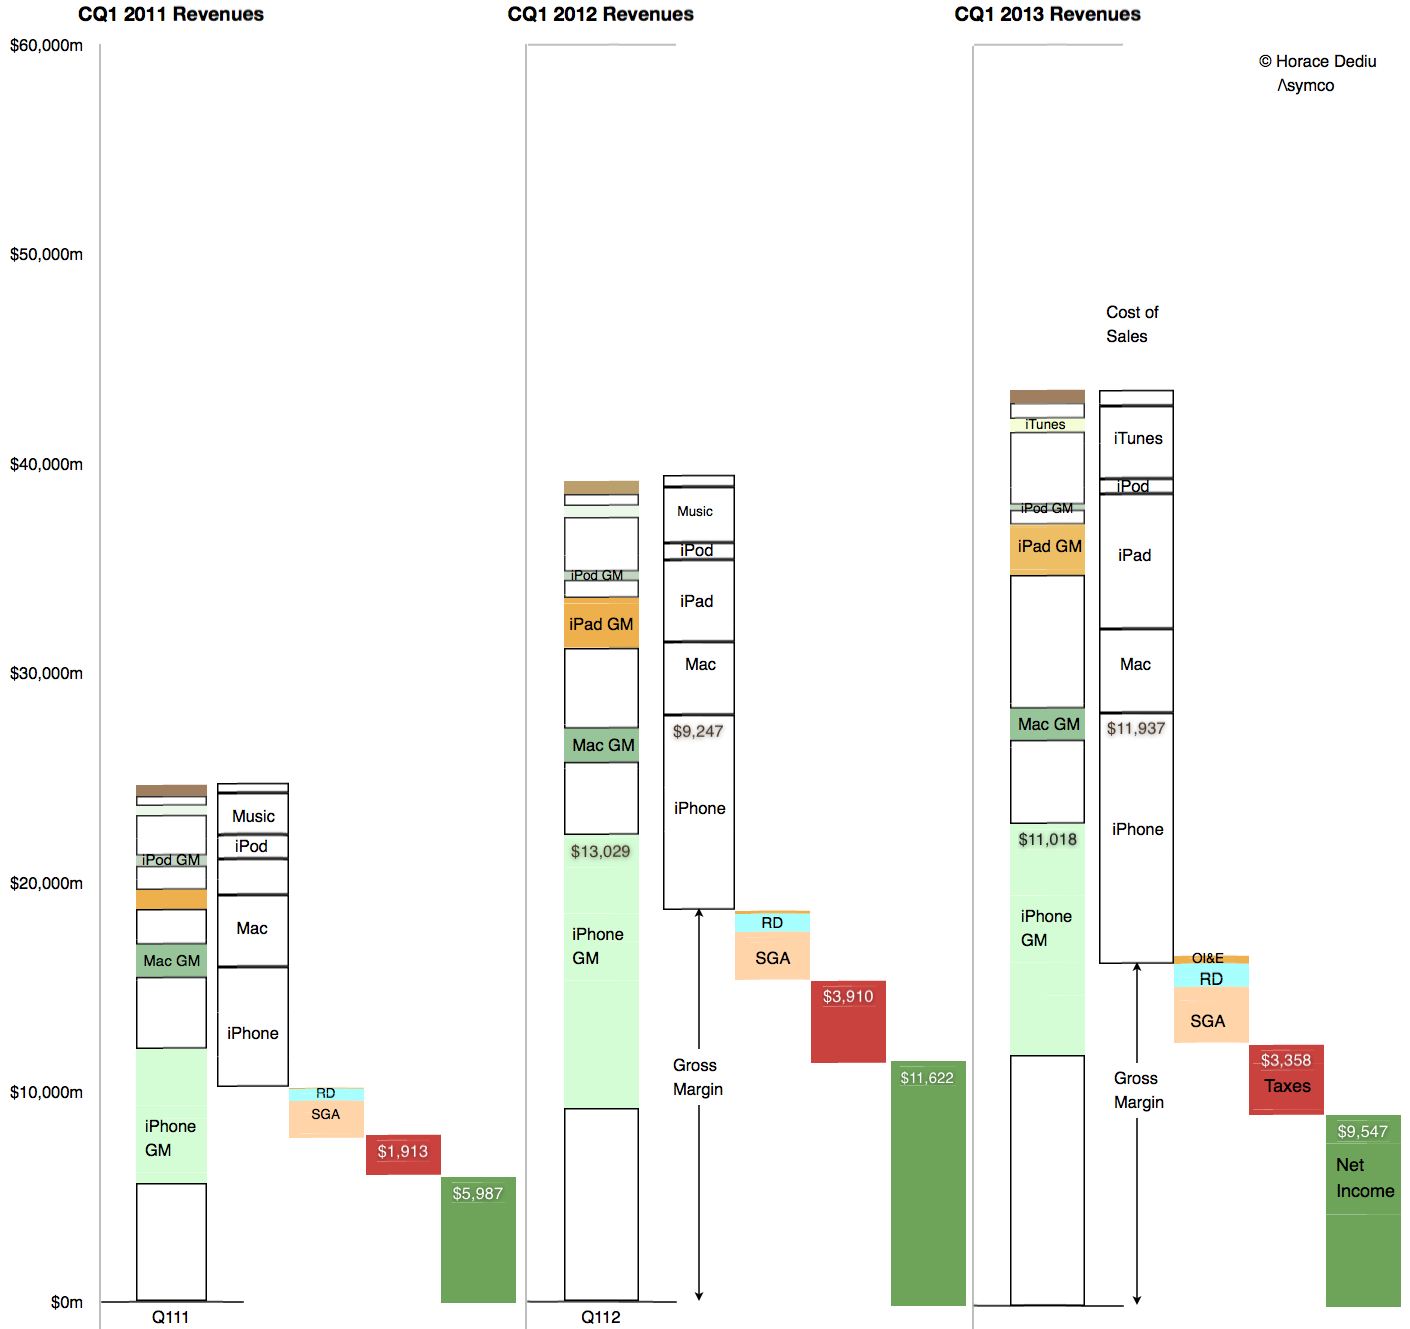
    Screen Shot 2013-04-25 at 4-25-8.46.04 AM


    So what is surprising? My expectations were met in terms of iPhone units (and exceeded in terms of iPad units). The mix was also something that falls out of the unit expectations. The pricing is also not  surprising.

    My guess is that the largest contribution to the "reduction of margin" is the increased cost of components. Note that the graph implies that even though iPhone revenues were nearly flat at 3% growth, the cost of those revenues went up by 29%! In addition, the iPad revenues grew 40% while costs went up 65%.

    Unit pricing (and implicitly competitive pressure) is still not the primary cause of the reduction in Apple's margins. Indeed, the curious thing is that margins are now at levels seen for most of 2009 and 2010, a time when the iPhone (and iPad) were seen as near monopolies in their respective categories.
  2. Counting stool legs

    Research · 140 comments

    As Apple introduced a new set of revenue categories, the performance of its "minor" businesses has become clearer. The changes include re-statement of what used to be called "Software" revenues as part of iTunes. Apple Software includes sales of OS X, iWork and its pro tools. These products are now sold through the Mac App and since that is a part of iTunes its inclusion makes sense.

    However, we have to understand that iTunes now is a blend of many business models. Some, like music, use a wholesale revenue recognition method and have very low to zero margins, others, like eBooks and Apps, are sold using an "agency" revenue model with potentially higher margins and some, like Software, are recognized at full value with very high margins.

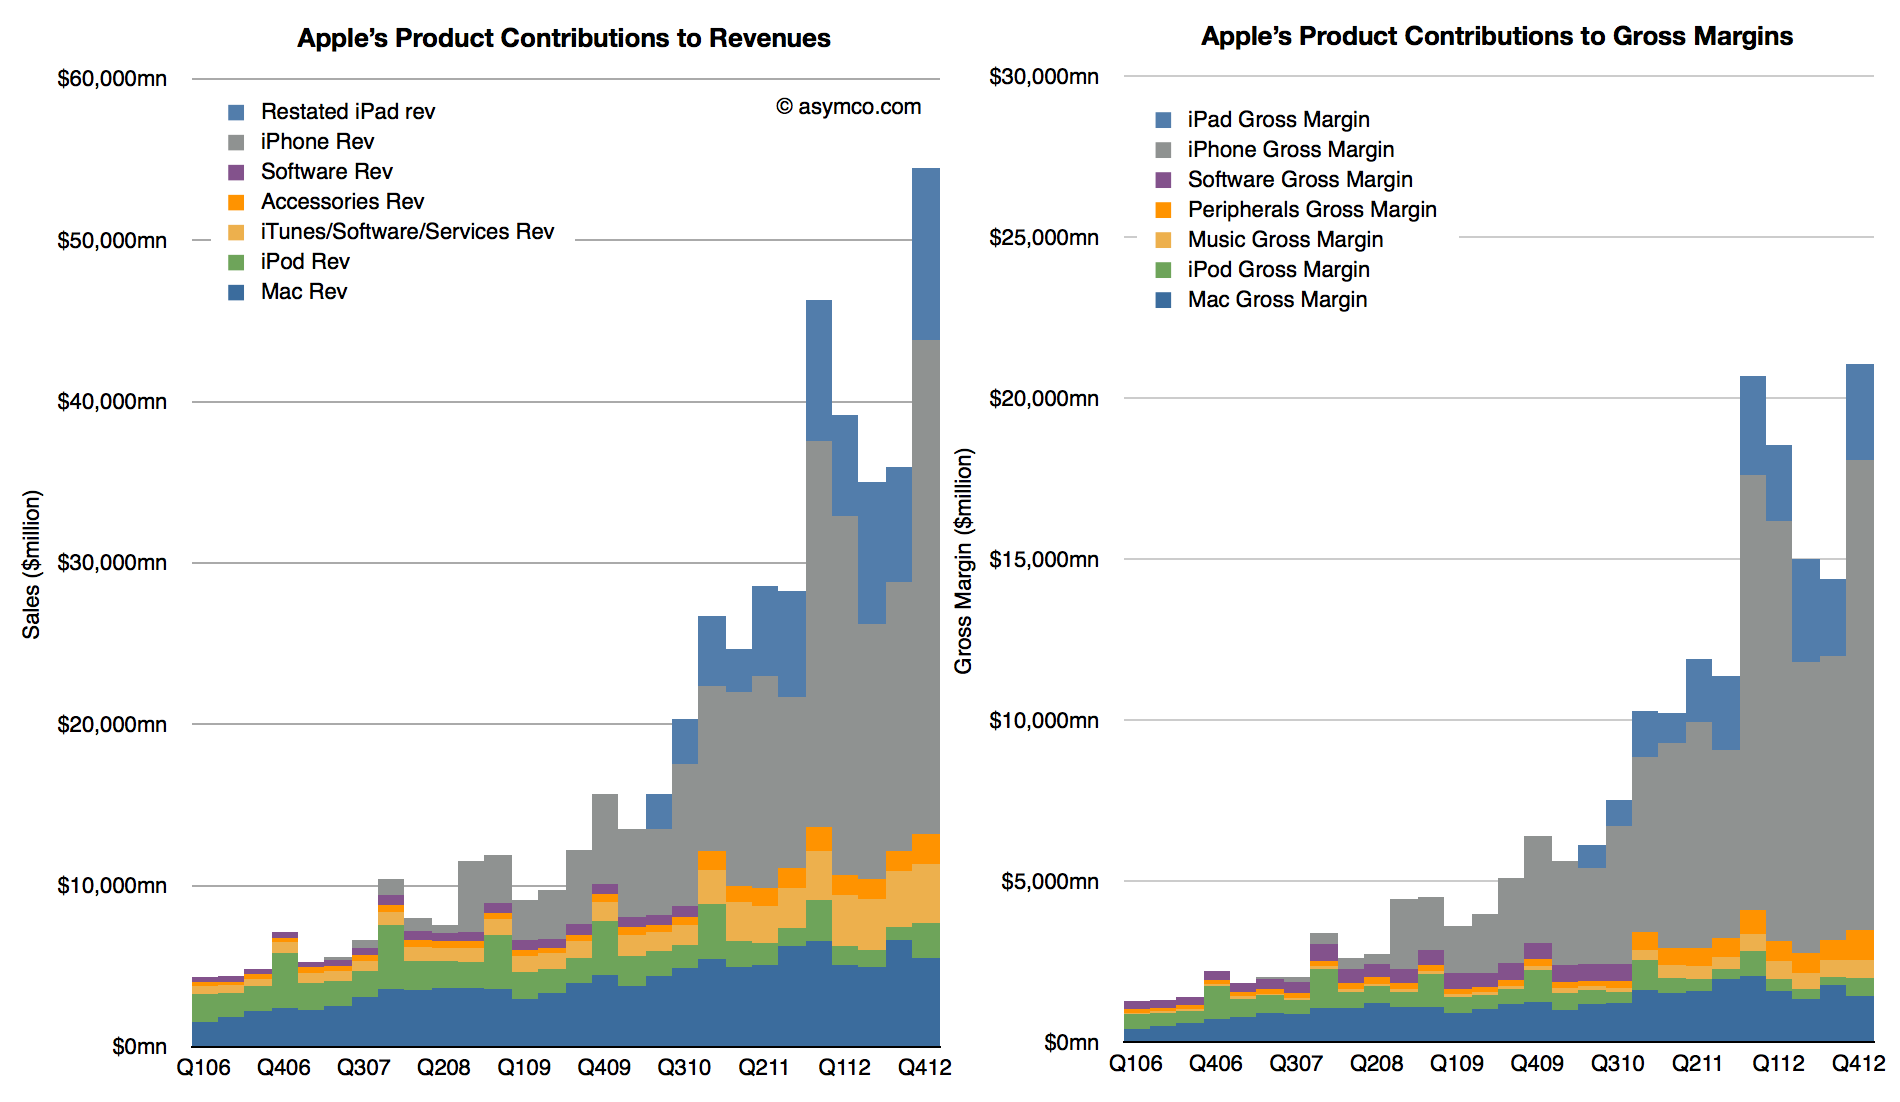
    When re-stated this way, iTunes becomes much more than a "break-even" business. My own estimate for its gross margin as currently reported is between 15% and 17% but it could be even higher. This allows the following picture to emerge:

    Screen Shot 2013-02-11 at 2-11-12.06.08 PM

    These graphs show contributions to Revenue and Gross Margins of the various reported product categories. Note that restatements for Accessories and iTunes only extend back to Q4 2010 and the older "Software" is still shown for earlier periods.

    Note also that Accessories are now including some of the revenue that used to be reported as part of iPad and iPhone revenues. This was discussed in more detail here.

    There are several observations we can make:

    1. iTunes now becomes a steadily and rapidly growing business. Growth over the previous two years averages well over 30% and is consistent across seasons.
    2. The absolute revenue number is substantial: $13.5 billion for 2012 (up from $10.2 billion in 2011).
    3. Assuming a gross margin of 15% to 17% yields contribution of $2 billion in margin in 2012 and $1.6 the year before.
    4. iTunes is now Apple's fourth largest business, having overtaken the iPod in revenues two years ago
    5. iTunes growth relative to the Mac means that it could become the third largest business during this year.

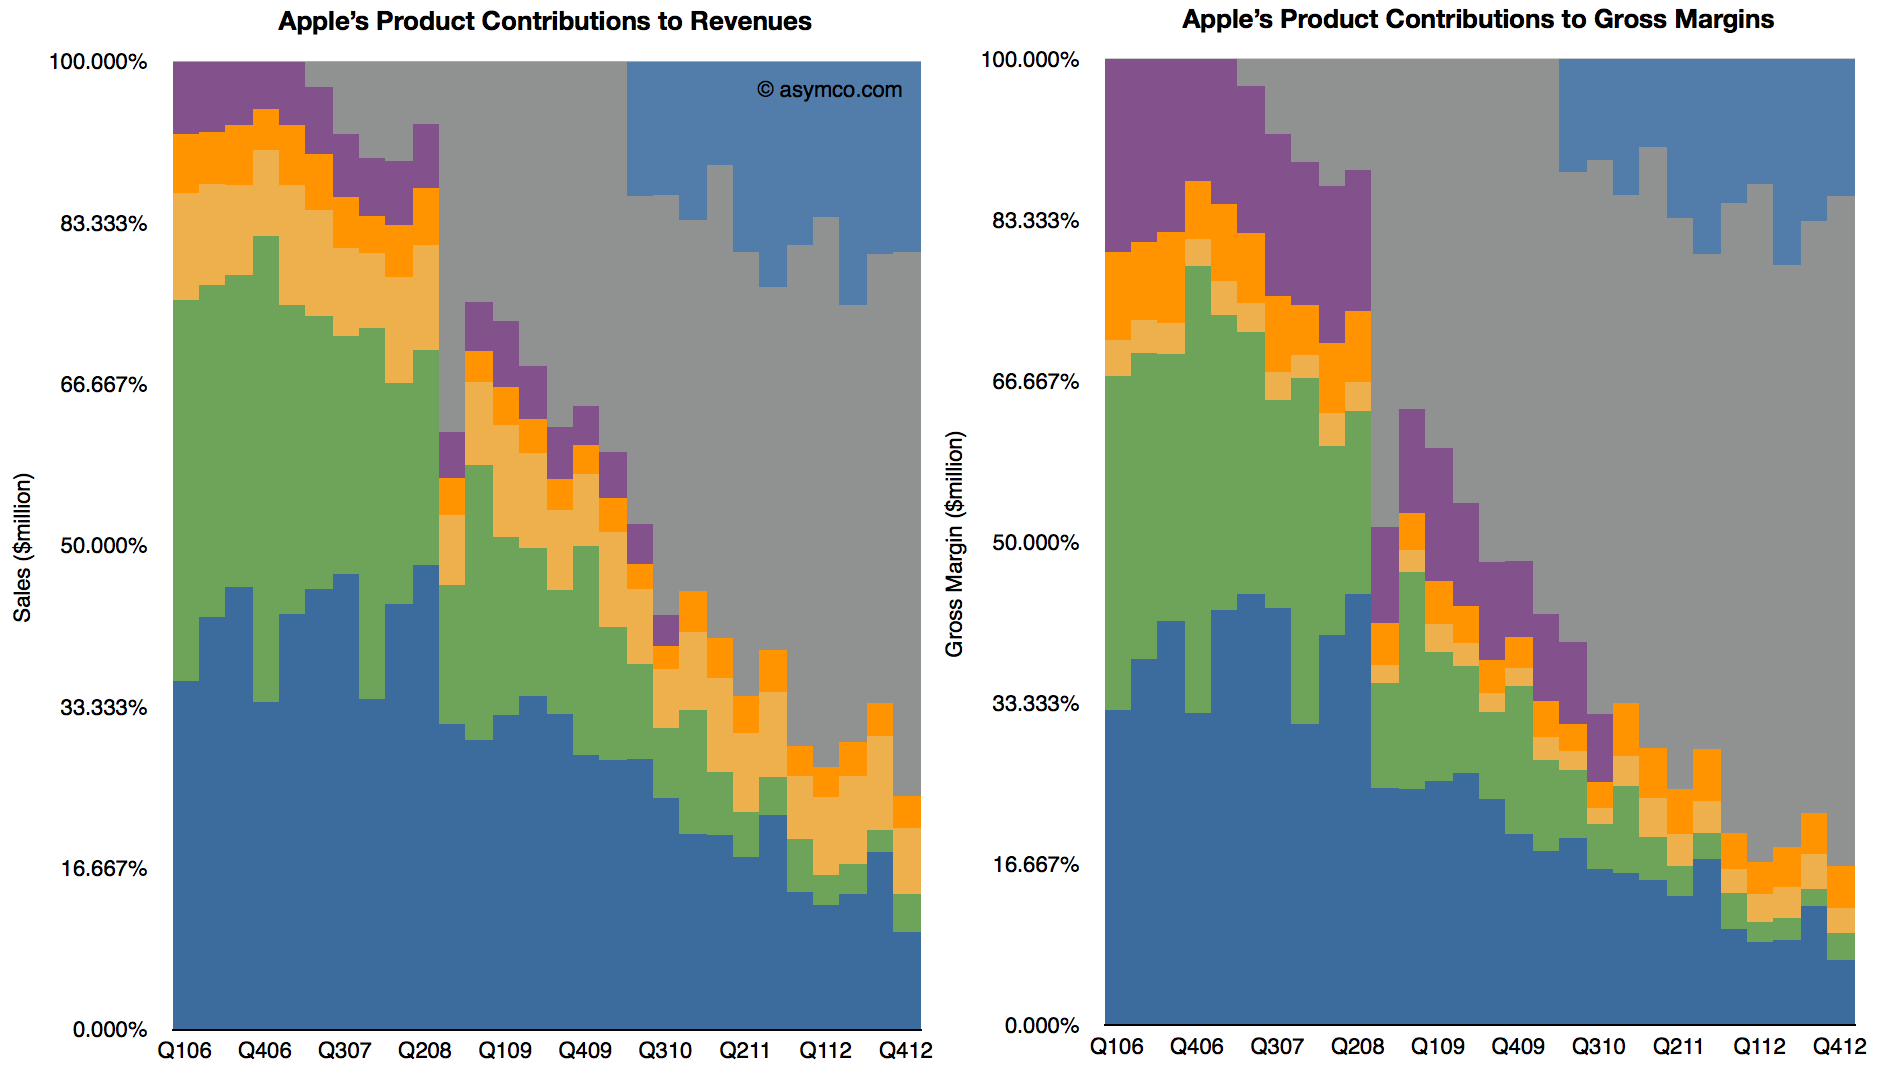
    When seen this way, as a percent of total, iTunes begins to look increasingly as a viable "leg stool" upon which Apple rests. Note that in the following charts the percent of total for iTunes holds steady while Mac and iPod decline.

    Screen Shot 2013-02-11 at 2-11-12.24.44 PM

    Adding the Accessories business (which includes Apple TV and is showing in Orange above) these "other" businesses are already bigger than the Mac. Of course, content, software, accessories and services depend on a healthy device business, but the size of these ancillaries are beginning to be substantial and Apple's ecosystem may begin to be valued more than just as an incentive to buy the devices.

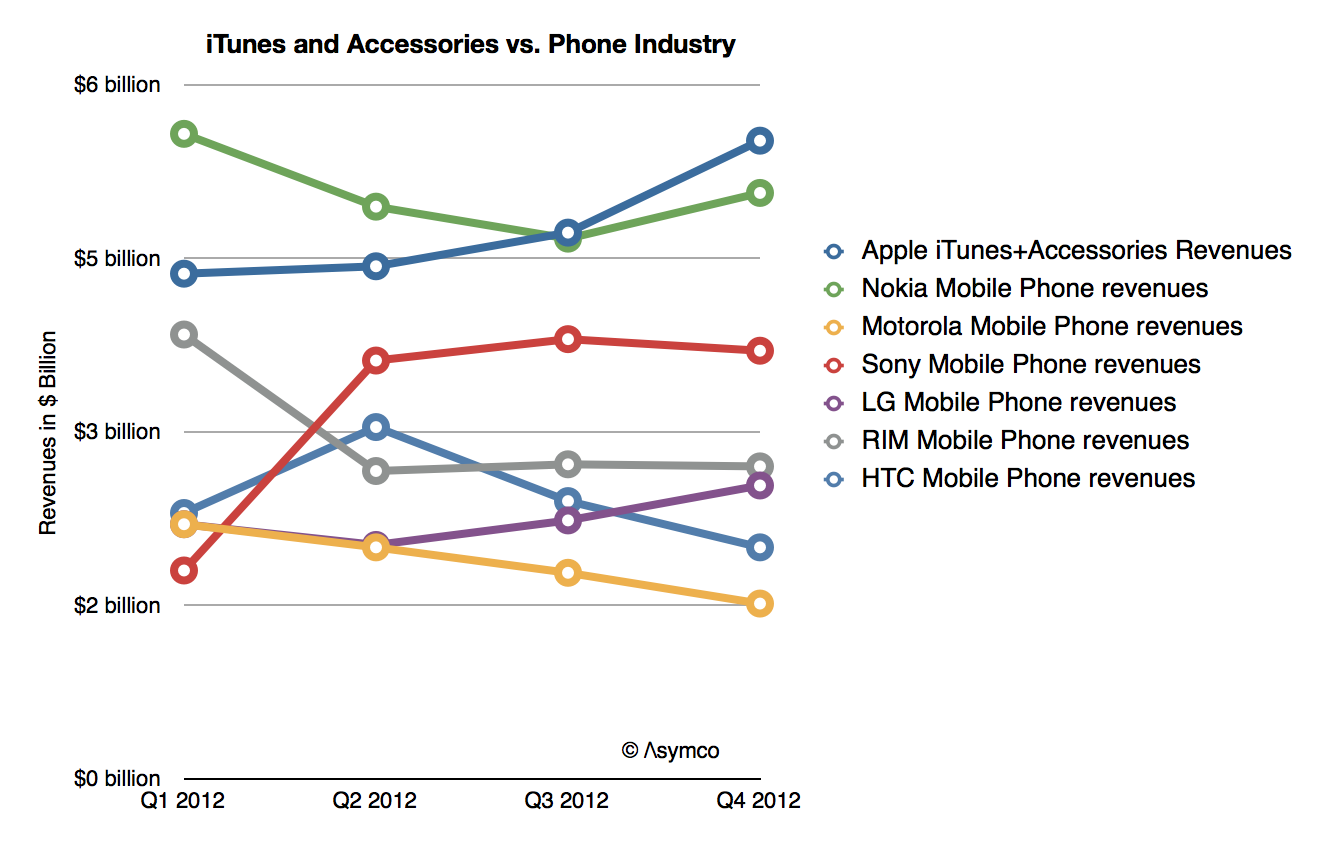
    Indeed, if seen in isolation, iTunes+Accessories combined is a bigger business in terms of revenues than any of the other phone vendors except Samsung:

    Screen Shot 2013-02-11 at 2-11-12.36.14 PM


  3. Margin Call

    Research · 97 comments

    During the fourth quarter 2012 Apple's margin fell to about 38%, a level not seen since two years earlier and down from a peak of 47% in Q1 2012. Does this lower margin foretell lower prices or a loss of competitiveness?

    Obviously not.

    Gross margin is a function of Sales (aka revenues) and Cost of Sales. Gross margin as a percent is calculated with the following formula: (Sales-Cost of Sales)/Sales. If dealing with a single product, Sales itself is the product of shipments and price/unit but since cost of sales is also a product of shipments and cost per unit, the shipments numbers cancel each other out and the gross margin reduces to the ratio of (Price-Cost)/Price.

    So a margin drop can only be caused if one of three things happened:

    1. Prices dropped
    2. Costs increased
    3. Both prices dropped and costs increased.

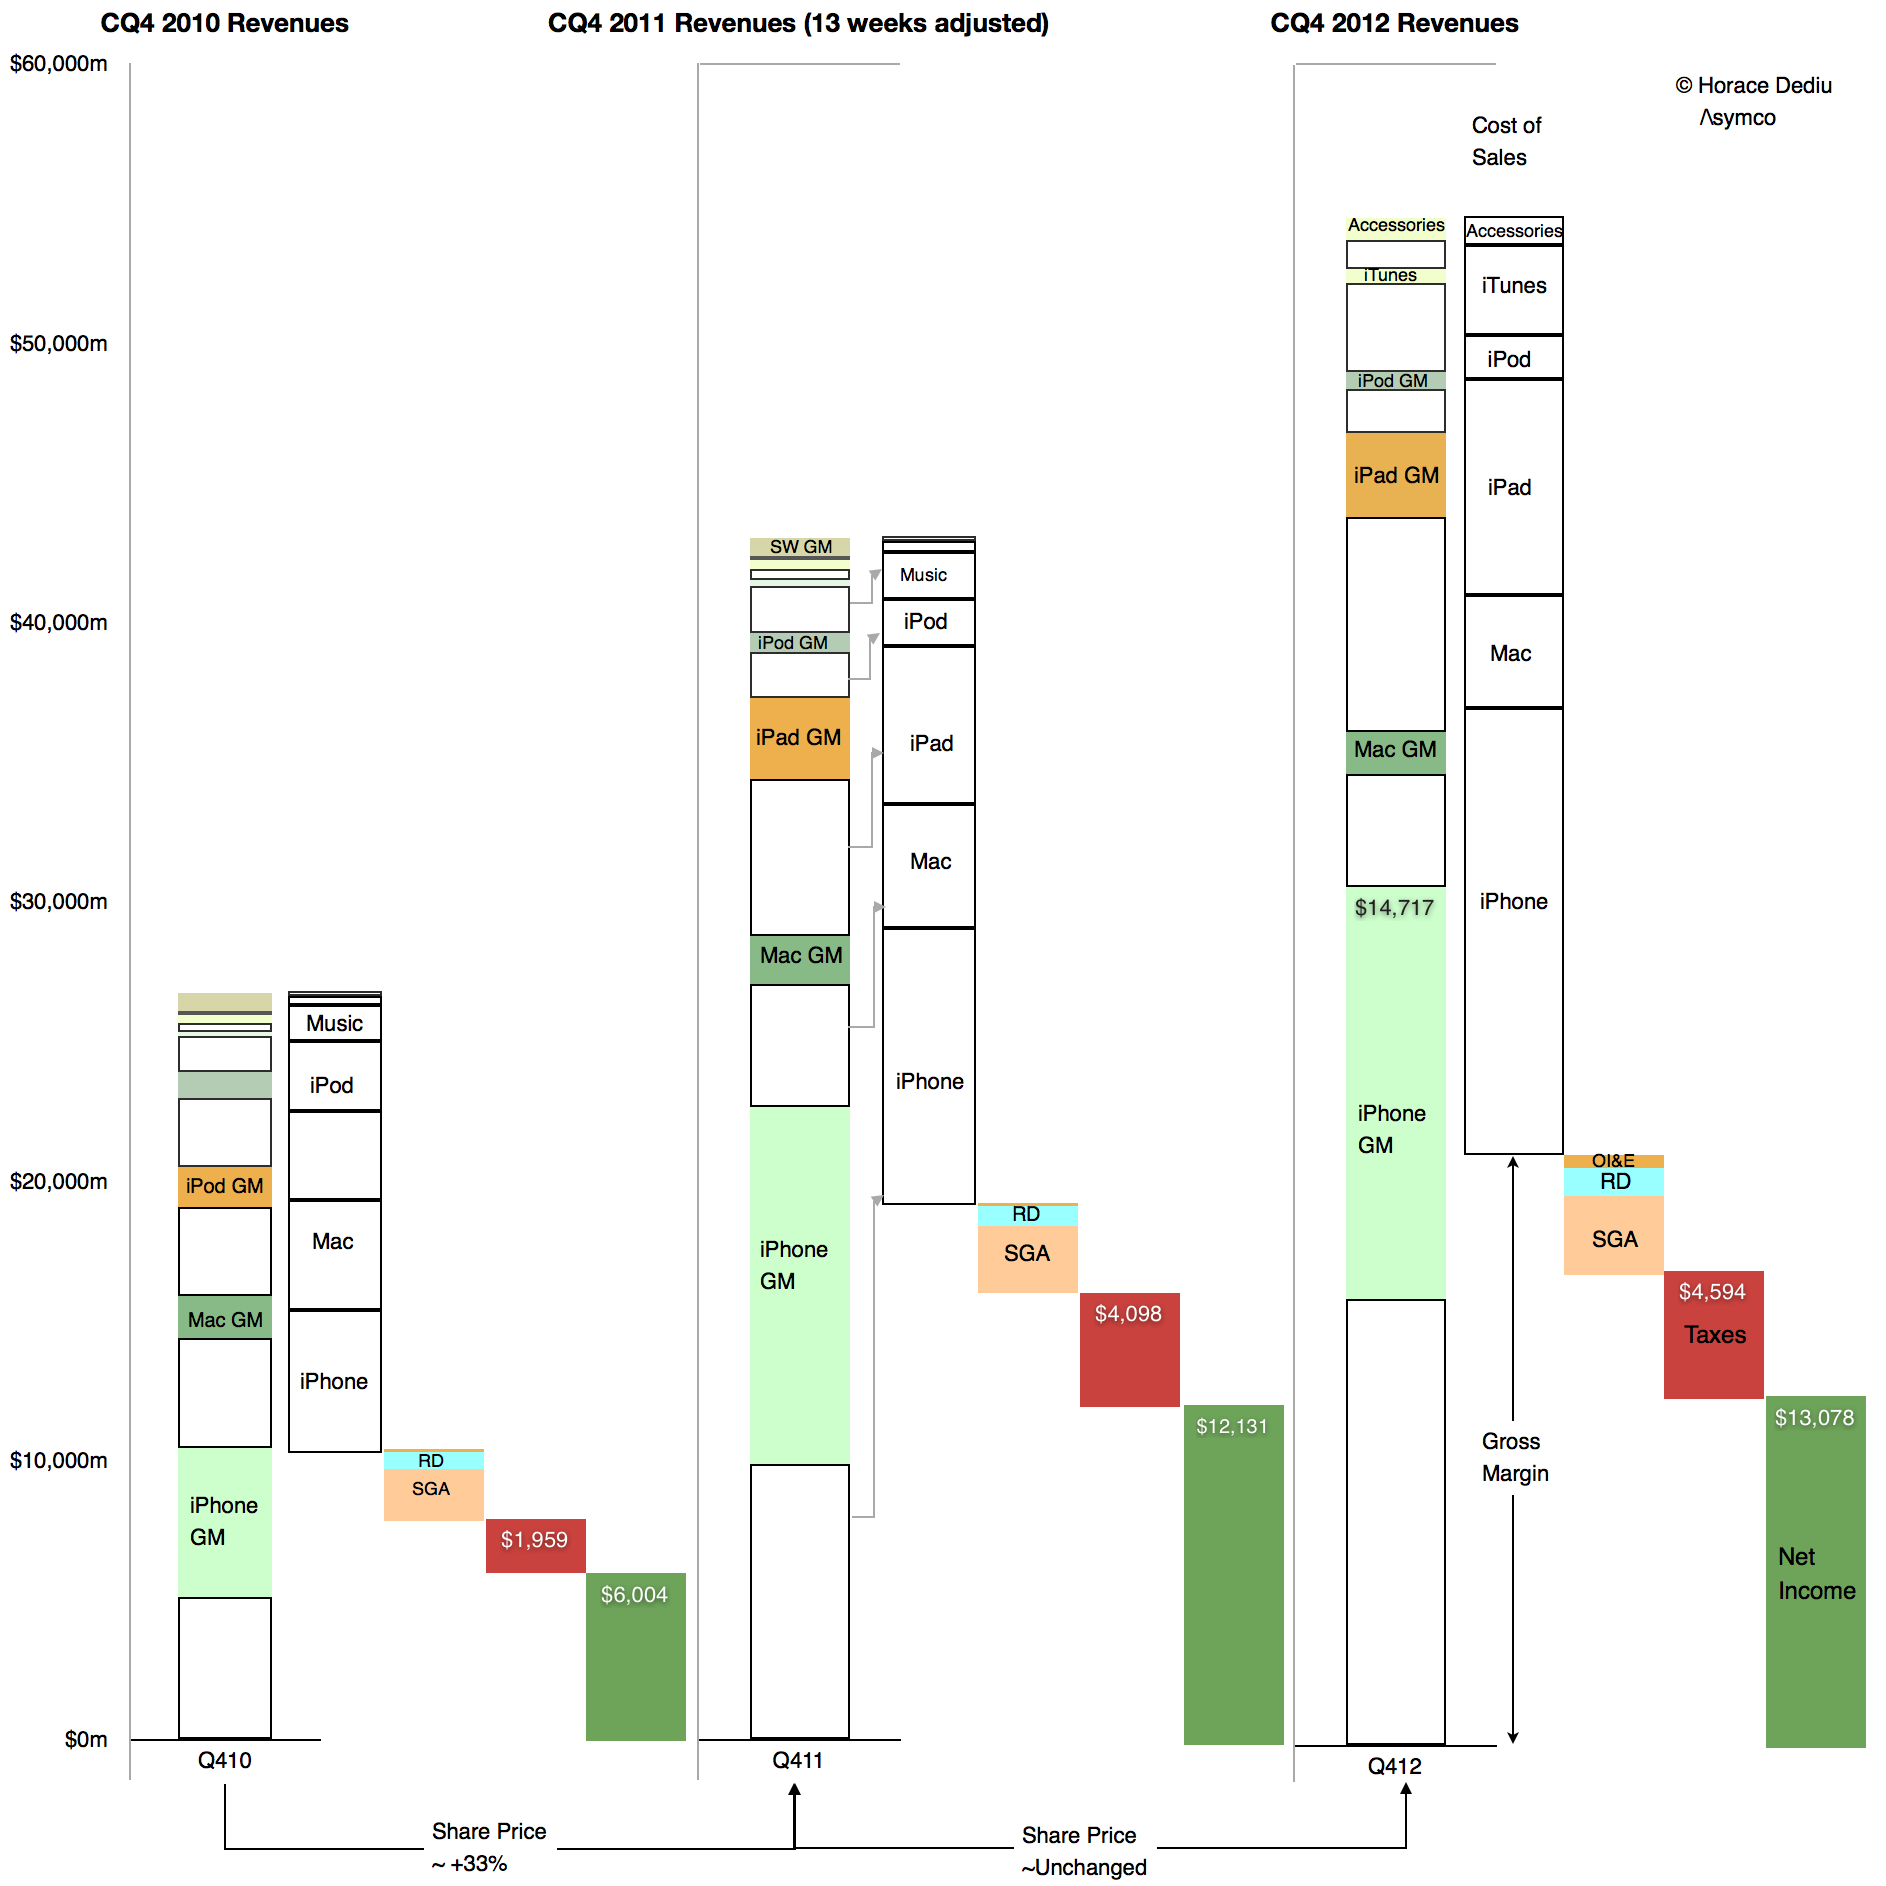
    We can easily find out which of these was the cause in the fourth quarter because we have volumes and prices for all of Apple's products. We can also derive total costs based a total gross margin. These are illustrated in the following retina-friendly diagram.

    Screen Shot 2013-02-05 at 2-5-11.25.16 AM

    The diagram shows Revenues, cost of Sales, Operating expenses, Taxes and Net Income relative to each other for the fourth quarters of 2010, 2011 and 2012. Of interest is the difference between 2011 and 2012. Note how the 2012 Gross Margin (absolute, not as a percent, identified with the arrow) did not change much from the year before. As Taxes and Operating Expenses did not change much either, the earnings were quite flat y/y.

    However note also that total sales increased quite a bit. As the gross margin (absolute) remained steady and sales increased the margin as a percent fell. But the cause is that cost of sales also increased. They increased faster than sales increased.

    Relative to adjusted 4th quarter 2011 Sales increased by 27% while Cost of Sales increased by 30.5%. Margins shrank in late 2012 because the products were more expensive to make.

    It's simple arithmetic.

    We can at a glance see that the cost of sales increased as a proportion of sales. Therefore the margin decreased as a percent of sales. The cause is higher costs, not lower pricing.

    In fact, pricing analysis was already performed and showed that they largely held steady (iPad being the only decline). If pricing is unchanged then competitive issues are not to blame. The supposed link between lower margins and some mythical loss of competitiveness can be easily disproved.

    But there's more.

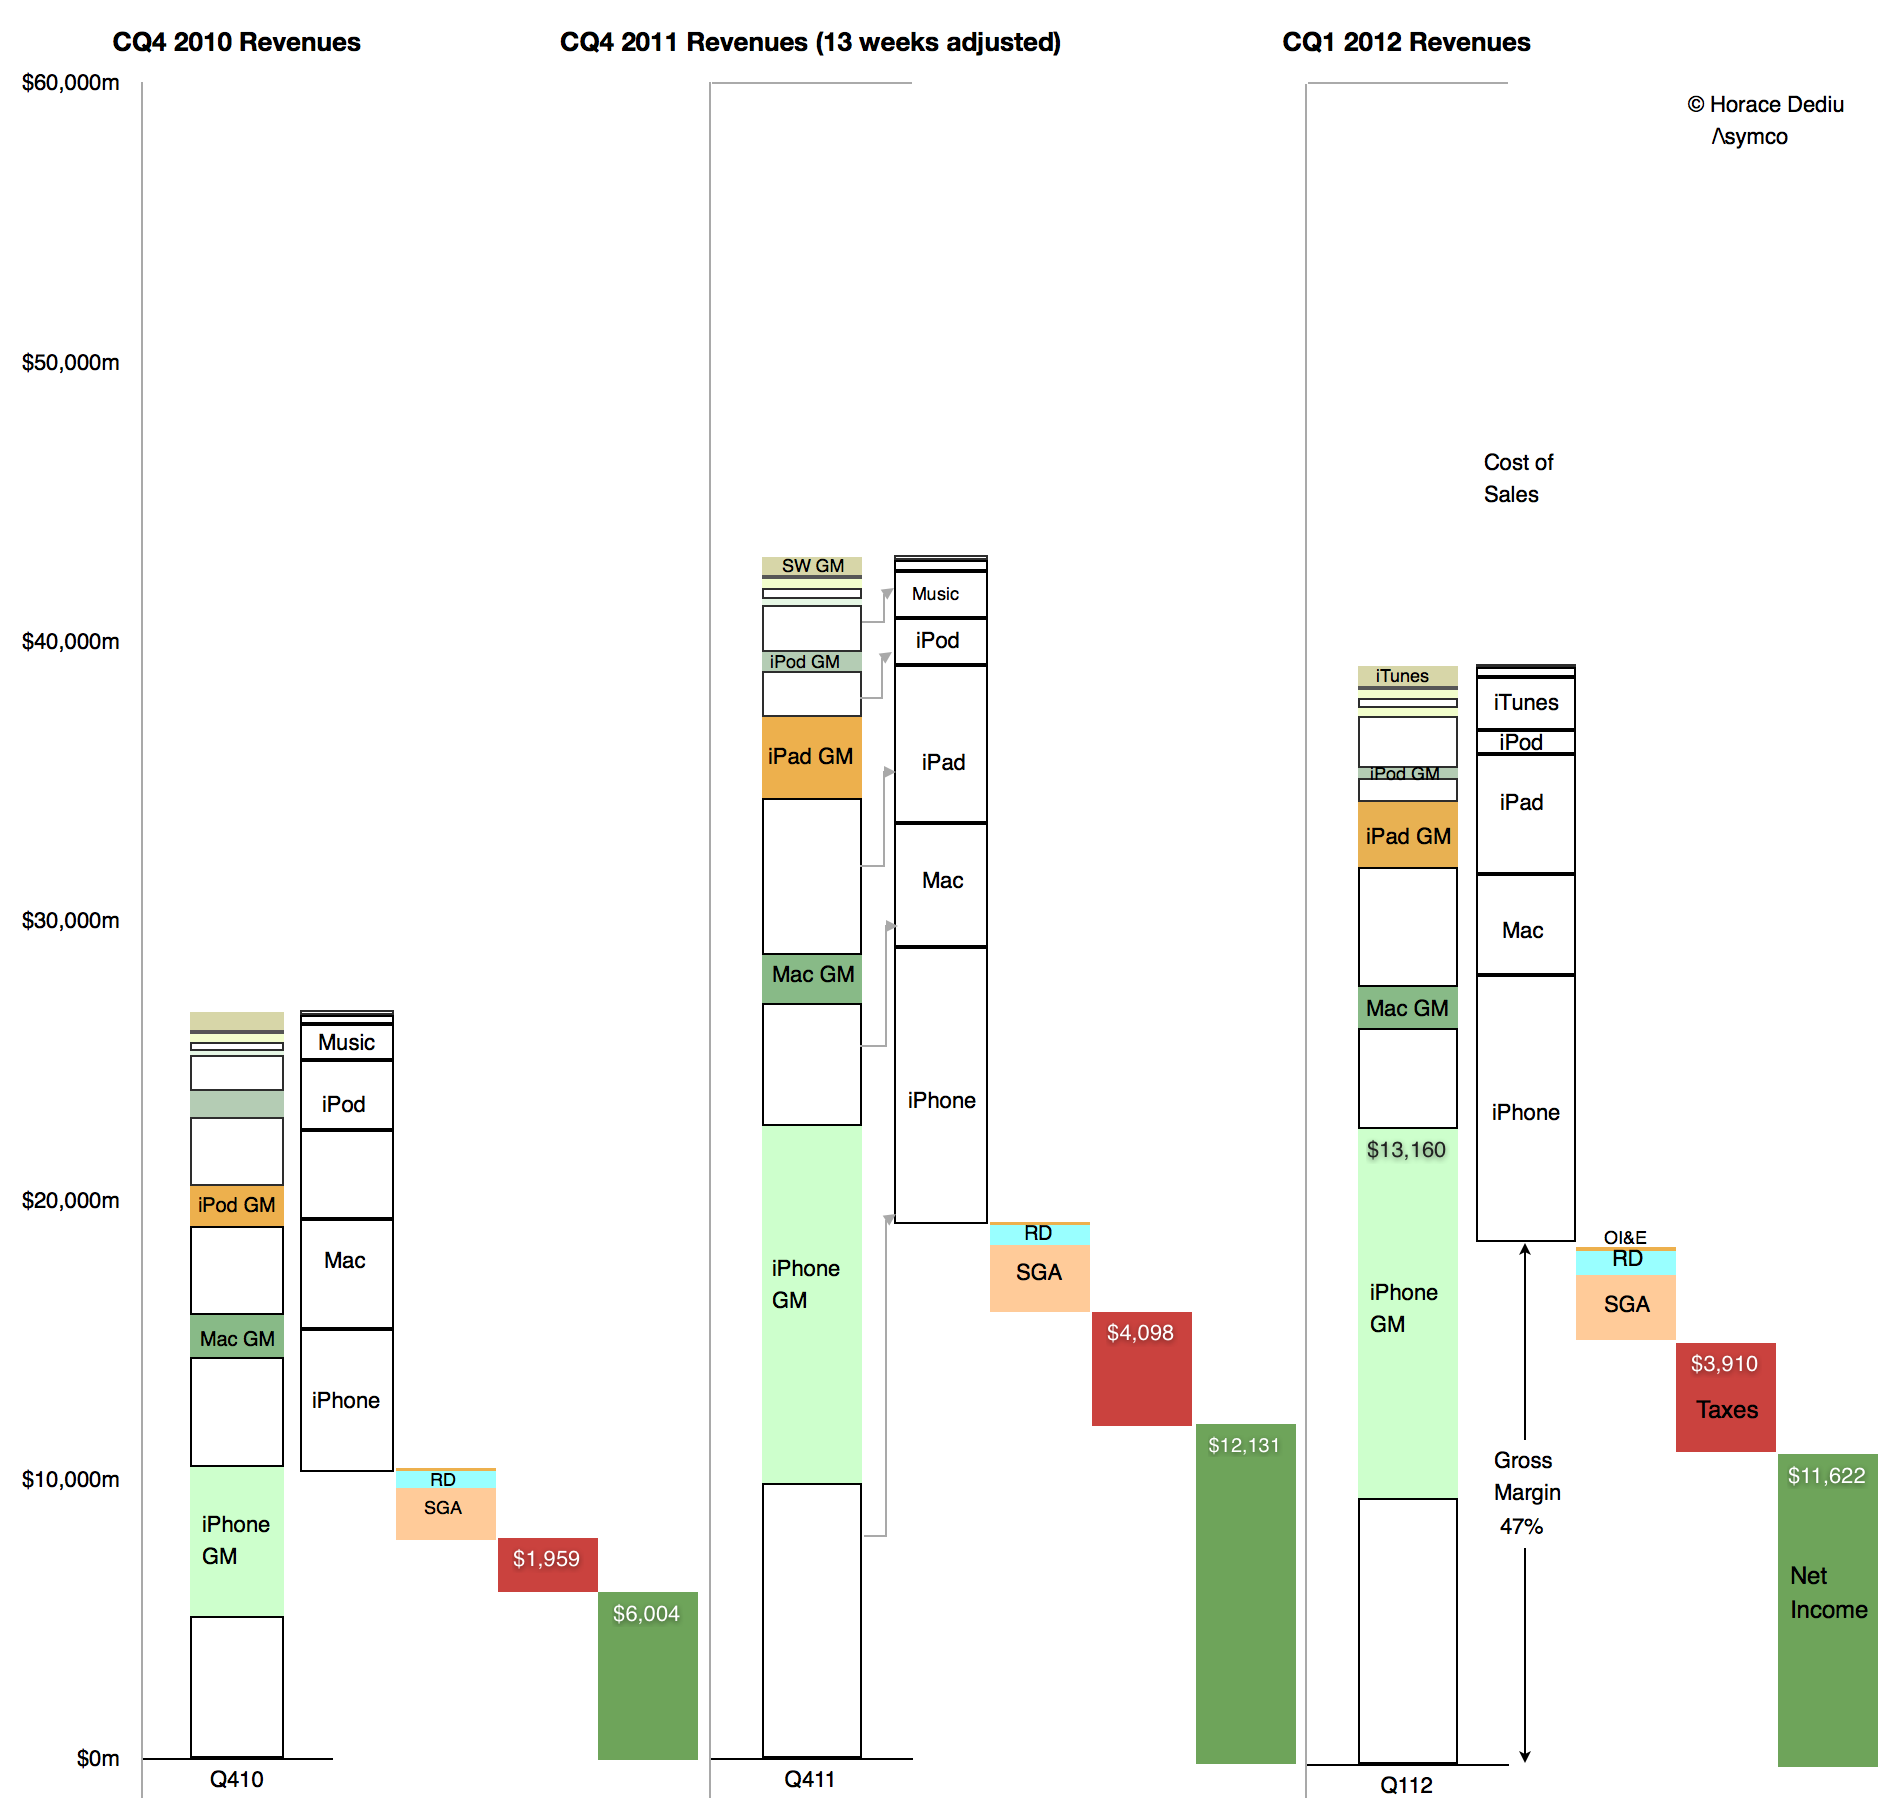
    There is an easily observed cause to changes in production costs. Consider  the opposite effect in the sequential change from the fourth quarter of 2011 to the first quarter of 2012:

    Screen Shot 2013-02-05 at 2-5-11.36.46 AM

    Here we can see how sequentially sales fell but gross margins rose. Again, the change in absolute Gross Margin was slight but the reduction in cost of sales was out of proportion of the reduction in sales. Cost of sales fell by 13% while sales fell by 9%. The result was an increase in gross margin from 45% to 47%. The cause was that the cost of production fell.

    Obviously. Because, as everyone knows, costs of production fall as output increases. It's due to something called the learning curve. It's something that has happened for all of Apple's (or anyone else's) product launches forever.

    What is not obvious is the effect this has on the share price whose changes are shown at the bottom of the first diagram. It's a case where one margin's fall has caused quite a few margin calls.

  4. The cost of mobile clicks

    Research · 26 comments

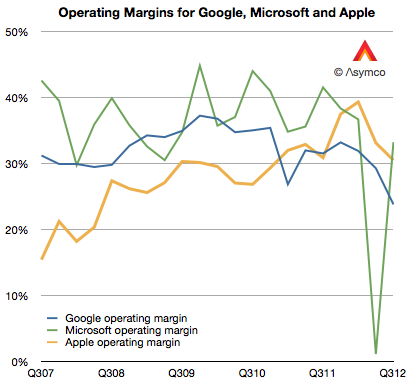
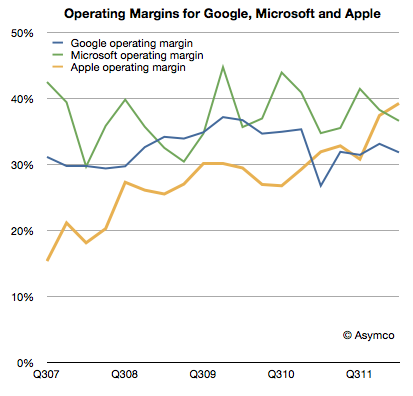
    Google's operating margins fell to 23.7% last quarter. This level is the lowest I'm aware of. From 2007 to late 2009 margin went from about 31% to about 37%.  Then from early 2010 until present they fell. The history is shown the the following graph.

    [I included Microsoft and Apple operating margins for comparison.]

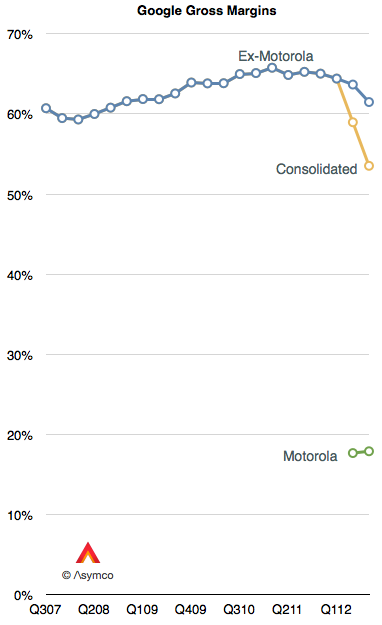
    Some of the recent decline is due to the inclusion of Motorola into consolidated earnings. Motorola gross margins were therefore 18%. Excluding Motorola, Google gross margins (Revenues-Cost of Revenues) were 61.5% of revenues.  However, even excluding Motorola, Google's core margins dropped.

    One reason for the decline in core margins is the reduction in cost per click (-16% for search and -18% for network sites.) This is what Google pays to partners for access to traffic. The trend is not new. It was first discussed in January.

    The bottom line is that an individual click is not as valuable as it used to be. Would a larger volume of mobile usage be a reason? Google won't say.

    The overall result in the bottom line is shown below. Microsoft and Apple are again put forward for comparison.

    Reminder: Register for Asymconf.

  5. The iPhone and Apple's Margins

    Research · 17 comments

    As the following graph shows Apple gross margins and its operating margins have both been on a consistent upward slope since early 2006.

    The reason is that the company has moved to more mobile devices as a percent of products shipped. Whereas Macs have had decent margins by the standard of the PC industry, they are not as profitable on a unit basis as iPods, iPhones or iPads. As portable or mobile products grow rapidly, it would follow that margins would as well.

    However, the growth is not monotonic. There are occasional dips in gross margins. The cause is the launch of new device versions. On the following graph I show the launch times for the iPhone versions and the company's gross margin as well as my estimates for iPhone and other product line margins.

    The general pattern is clear: each new version of the iPhone causes a dip in gross margins. This is not surprising as the company forewarns of this (in a decidedly exaggerated manner.) But why does it happen?

    The iPhone is a profit monster, but when it launches there are many costs associated with it: components tend to be more expensive, there are more warranty returns, there are higher shipping costs are units are shipped in smaller lots to more points of sale. Tim Cook explains as "In terms of costs, with each new product we see learning curves associated with ramping production."

    Every launch causes an amplification of these learning effects. With each dip in margins however, comes another surge as the learning is complete and the volumes of the new generation product begin to dwarf the previous. And so the process continues.

    There is an asymptotic limit to margins as they cannot grow higher than whatever the iPhone yields but that's not yet in sight. The upper bound is probably in the 50% range.

  6. Which is best: hardware, software or services?

    Research · 43 comments

    Apple's recent margins are nothing short of spectacular. It's hard to convey just how remarkable 47% gross margin and 39% operating margins are. For a company that sells hardware these are simply unheard-of numbers.

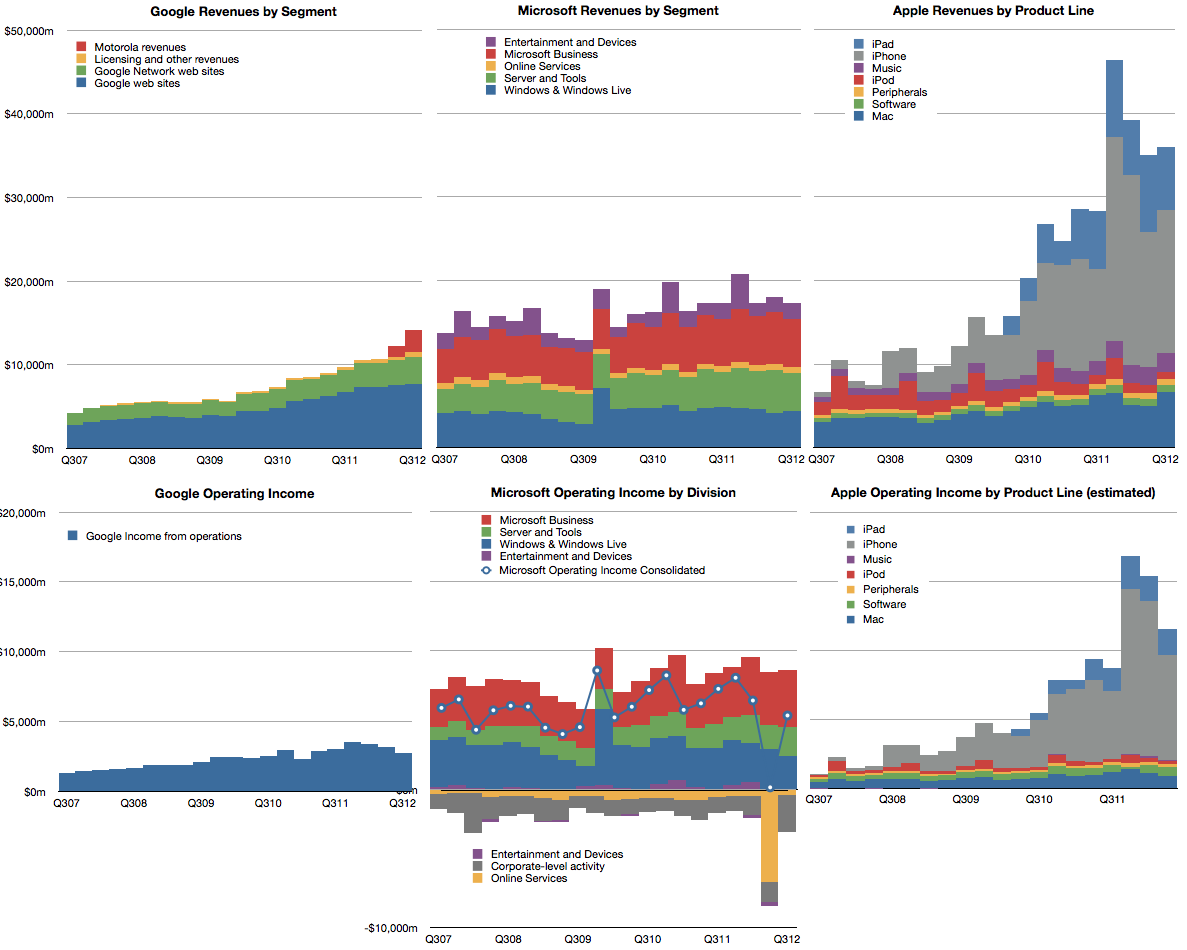
    The best way I can illustrate this is by comparing Apple's operating margins with those of two other platform-based companies, Google and Microsoft.

    Microsoft invented the software-as-a-business model and, as software is easily reproduced, their margins are phenomenal. The gross margins are typically in the 80% range for software. Overall, the company had higher R&D and SG&A expenses so their operating margins are a more modest 37% on average. However, Apple managed to exceed this value even though it has the disadvantage of actually having to build things made of atoms.

    Google also has led a charmed life free of inventory and factories. Its operating margins have been however hurt by investments needed to sustain the infrastructure for indexing the internet. That means that their margins have hovered around 33%.

    As the chart above shows, Apple has been creeping up on both these benchmark companies with exceptional operational leverage and, as of this last quarter, overtaken them.

    The reason Apple is able to do this is that its iOS businesses are extremely profitable and, as those businesses grow in absolute terms and relative to its other businesses, the overall margins are reaching into the stratosphere.

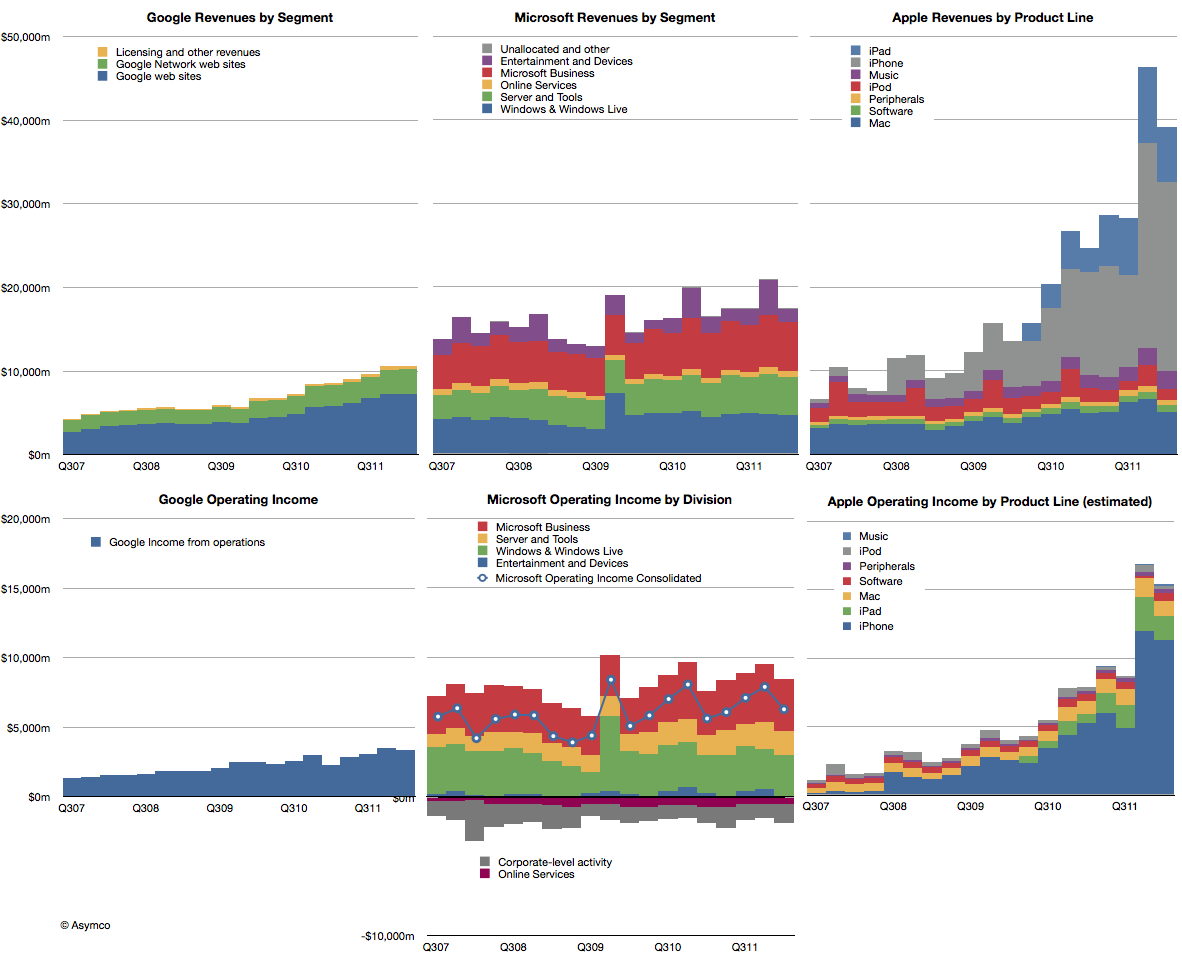
    The impact of iOS on Apple is shown in the right-most two charts below. The difference in growth relative to these other great companies makes Apple all the more impressive.

    But the temptation is to compare the "core" business models and ask which is best: hardware, software or internet services. It would seem that hardware is winning, suddenly getting the best margin and best growth--a dramatic reversal with prior technology business dogma.

    However, it would be a mis-reading of what allows Apple to succeed. Apple is the most valuable company in technology (and indeed in the world) because it integrates hardware, software and services. It's the first, and only, company to do all these three well in service of jobs that the vast majority of consumers want done.

  7. A three year view of Apple's fourth quarter

    Research · 22 comments

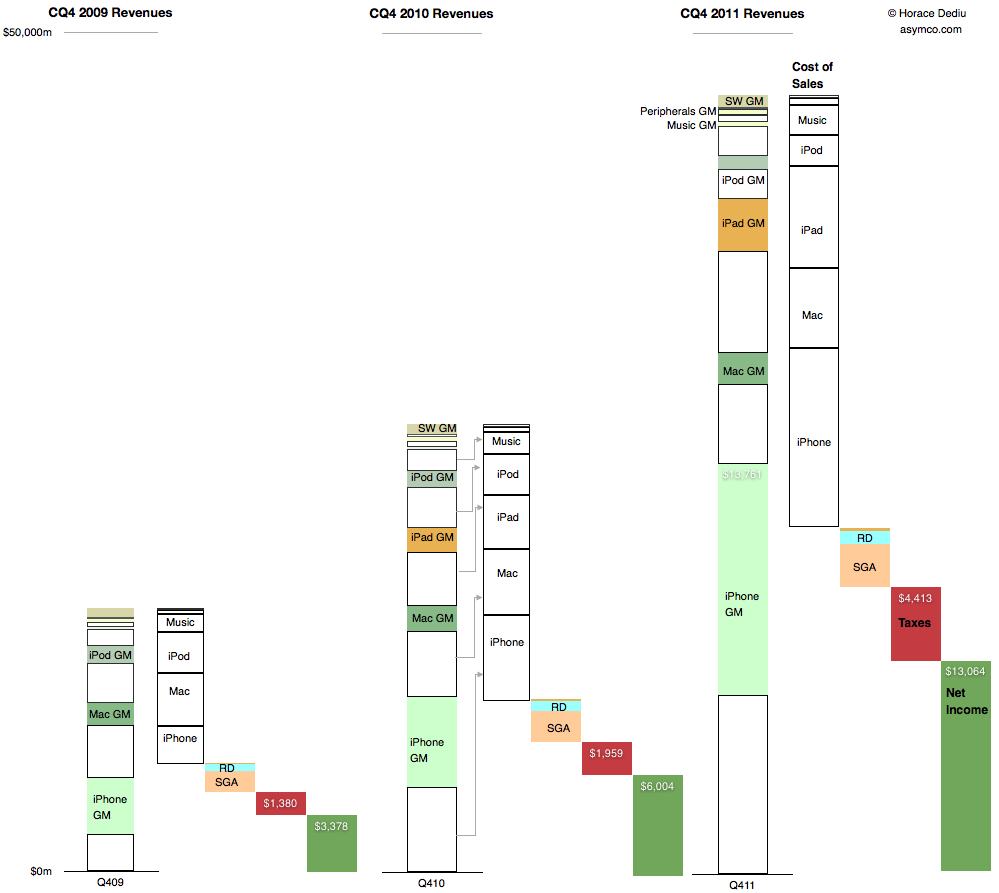
    This is a summary view of Apple's income statement for the fourth quarter of 2009, 2010 and 2011. The full size is 999x893 pixels. Click on image below for full size bitmap.


    The convention used is to show revenues in the first column, cost of sales in the second followed by operating expenses, taxes and net income in the last (dark green) column.

    For the revenue column, individual products are shown stacked from highest to lowest revenues and further divided into variable costs and gross margin.

    The costs are then drawn separately leaving net income (or profit). Ratios between various quantities can be visualized:

    • Gross Margin percentages are ratios between the empty boxes and their colored counterparts
    • Operating expenses as a percent of sales are the third column in relation to the first.
    • Tax rates are the fourth column as a percent of the fourth plus the fifth, etc.
    • Finally, the rate of year-on-year growth in all these quantities can be seen by looking through column sets left to right.

    Given this perspective it's perhaps more obvious how much and from which business Apple has grown.

  8. How much does it cost to manufacture an iPhone?

    Research · 103 comments

    An iPhone generates approximately $650 in revenue for Apple. This figure has remained fairly steady over time. Using deduction from overall margins, it's possible to estimate the gross margin on the product to be around 55%.

    That means that the cost of goods sold (COGS) for the iPhone is about $293. Is that a lot? Where does that money go? What else does it tell us about how the company operates?

    To find out we need to understand the cost structure of phone building.

    Typically there are four main categories of costs for a phone:

    1. Bill of materials (BOM). This represents the cost of the components that go into the device. These are paid to suppliers.
    2. Transportation/warehousing. This is the cost to transport and store the product before sale. This is paid to shipping companies and warehousing.
    3. Manufacturing cost (including labor). This is paid to contract manufacturers.
    4. Warranty expense. This is paid back to customers for returned product that can no longer be sold.

    We can estimate a device's BOM through a teardown analysis and there are firms that do this. Usually this offers enough competitive insight into the cost structure and hence gross margin because the other items are predictable in that they do not vary greatly from product to product.

    In the case of the iPhone the BOM has been fairly steady around $200 for a new model. That leaves quite a big gap to the overall COGS of $293.

    Could transportation, manufacturing and warranty costs really add up to $90 for an iPhone?

    The manufacturing costs are not usually discussed in detail openly because the processes used are secret. However, thanks to and ABC Nightline report,  some clues have emerged about how iPhones are built and, although incomplete, they offer some interesting bounds.

    One data point recently published is that the iPhone takes 24 hours to be built. Of that 6 to 8 hours is spent in "burn-in" to install and test the software and components automatically. This leaves about 17 hours unaccounted for in the throughput time. Could this time be spent in labor intensive operations? In the ABC report the wage of workers on the line is given as $1.78/hr[4]. 17 hours of labor input would imply $30 labor cost per iPhone. That seems a lot higher than the industry (i.e. iSupply's estimate is $8 for manufacturing cost.)  This is an upper bound. Obviously, those 17 hours could be spent in automated operations which were not shown or simply sitting idle, waiting for a process to begin.

    Is there another way we can check this?

    There is. The ABC report also mentioned that there were 141 (presumably labor) work steps in the production for an iPhone. If we knew the time each step took we could obtain another estimate. For example, if each step in the human assembly process took 3 minutes[2] then human hands will touch the iPhone for 423 minutes or about 7 hours. This would imply a labor cost for an iPhone of about $12.5. If each step was longer or shorter, the cost would vary accordingly.

    Unfortunately we can't be sure of the exact cost. However, these recent clues offer some interesting bounds and observations[3]:

    • Manufacturing costs for the iPhone are likely to be much higher than comparable devices. This is partly because of the design of the product and partly because of the quality testing needed.
    • Those costs are likely to range between $12.5 and $30 per unit.
    • The iPhone manufacturing costs are likely to be twice or three times the average.
    • Labor costs are still a small part of the overall cost structure at between 2% and 5% of sales price.
    • The high level (141 steps) of human interaction in the process could be automated however, the fact that it isn't implies that the cost of automation would be higher and the flexibility of the automated process would be lower. It's much more likely that the process is a mixture of labor and robot intensive sub-processes.
    • Even if we assume a $30 manufacturing cost, there is still $60 that needs to be allocated to transportation and warranty expense. These require sanity checks as well.

    ---

    Notes:

    1. Note that R&D (engineering and development) and Sales, General and Administrative (e.g. Marketing) costs are not part of this cost structure. They are considered fixed costs and are not allocated to individual units of production.
    2. Note that during the ABC video there was mention of automated instructions being broadcast to the line. This implies that each worker is working on a "clock cycle" and each work stage is timed to take an equal amount of time. This clock cycle time is crucial in understanding the cost structure. One further clue to this cycle time comes from the iPad output rate per worker. This was mentioned in the slide show to be up to 6,000 units per day. Assuming 10 hours of working time per day means 600 units per hour or 10 per minute. This seems extremely high as the worker would have to handle the product for only six seconds. [UPDATE: Apple clarified this point: "In manufacturing parlance this is called deburring. Her line processes 3,000 units per shift, with two shifts per day for a total of 6,000. A single operator at Ms. Zhou’s station would deburr 3,000 iPads in a shift"]
    3. As this post shows the amount of information that can be obtained from observing operations can be significant and lead to competitor advantage. It should be clear why this is not something done willingly.
    4. UPDATE: In a statement Foxconn clarified wages as "We have over 75 percent of the employees in the category of earning at least 2,200 RMB ($349/month) basic compensation standard. That means they are earning 13.75 RMB ($2.18) per hour".
  9. Interactive charts for Apple's product lines

    Research · 5 comments

    Warning: This requires Flash.

    This is a data set that shows Apple's product-level performance according to Units sold, Average Selling Prices, Cost of Sales, Gross Margin, Unit Growth, Revenues, Revenue Growth and Gross Margin contribution. It, along with all the other data sets are available under the Products menu at the top of this page.

    Default settings:

    • Line Chart
    • Y-Axis set to Revenues.
    • Color set to GM (Gross Margin percent).

    Click here for a larger version.

    [hang2column foo="bar"]

    https://docs.google.com/spreadsheet/pub?hl=en_US&hl=en_US&key=0AmUJMRccl_skdDZ4LUhJVk1JS0RHeW5sUEhfSDZRN3c&output=html&widget=true

    [/hang2column]

  10. iOS vs. Microsoft: Comparing the bottom lines

    Research · 60 comments

    I began comparing Microsoft and Apple's financial performance with a review of "top line" or revenues by product lines over a four year period.

    This post is about the "bottom line" for the same companies and products.

    Before I jump in I would like to make sure there is no confusion about the terms. I will be comparing "operating income"[1] as a measure of "bottom line". This is a common way to compare the profitability of companies because it excludes taxes and interest income. These non-operating expenses/income can distort a comparison of performance because they can be the result of investment activity or changes in tax law or where the company is domiciled. One should not make judgements of comparative performance on those non-operational bases.[2]

    Another challenge is that some companies report operating income by division while others don't. We can usually compare overall operating income but usually not on a division or product-level. This is the challenge I will try to overcome in this analysis between two very different operating models.

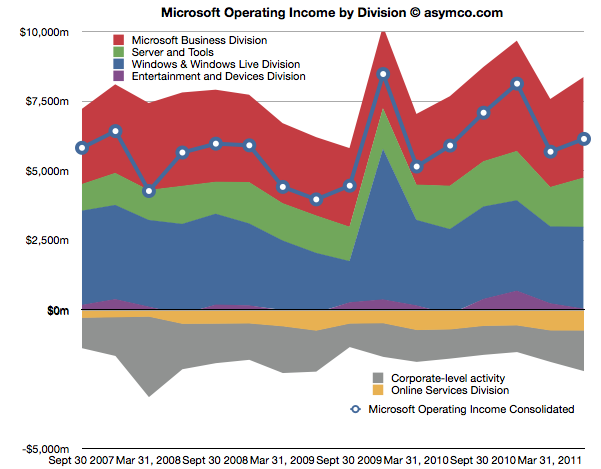
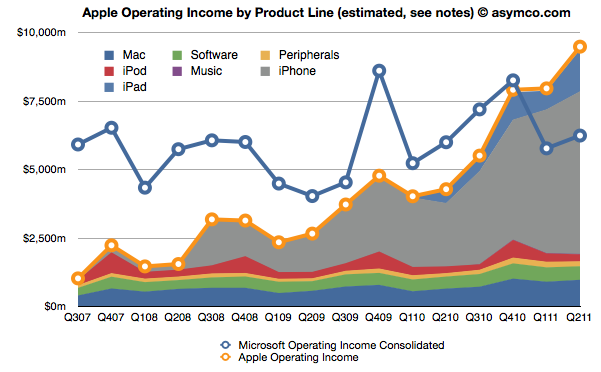
    The first chart shows Microsoft's Operating Income by Division as reported by the company.

    Each area represents a business division. Note some are showing negative income (losses).I've added a line representing consolidated operating income which is the sum of all areas (including the negatives).

    The same line from the chart above is super-imposed on the chart below and is comparable to the orange line that represents the operating income that Apple was able to obtain over the same time frame. Note that both axes are using the same scale.

    The Blue and Orange lines are indisputable but the allocation of the areas under the orange line may be open to debate.

    As Apple does not report a break-down of each product line or division, getting the areas in the Apple chart is a matter of analysis and estimation. The method I used was to estimate gross margins per product (the overall gross margin is known) and assigning a portion of OPEX (also known) in a ratio equal to the sales level of that product. [3][4]

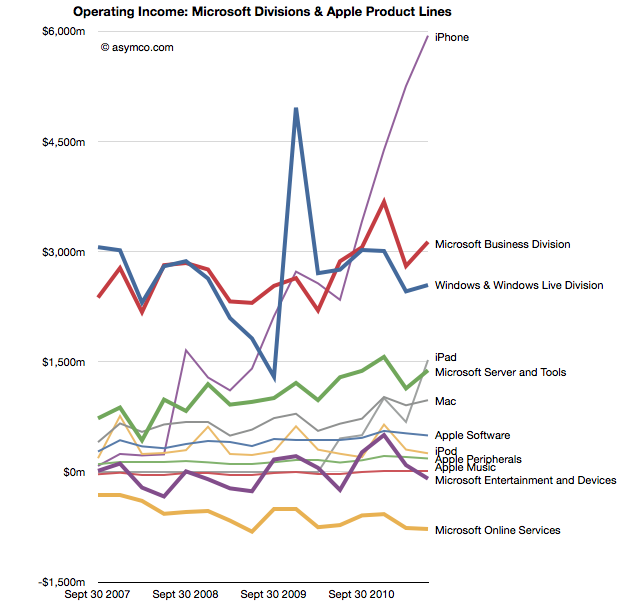
    To make the contrast sharper (though more cluttered), I took all operating incomes from all product lines and divisions of both companies and laid them out as time series line charts in the following chart. I allocated Corporate Level Activity as an expense proportionate to each business unit in a ratio proportional to its sales. This allows comparison of product lines individually.


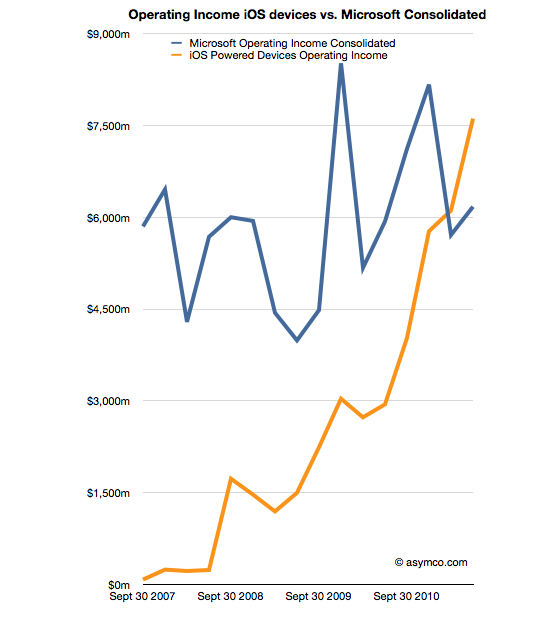
    Finally, I combined all the iOS product lines (iPhone, iPad and iPod touch est.) as one line and laid it alongside overall Microsoft Operating Income (consolidated).

    The second chart in this post showed that Apple has reached higher operational profitability than Microsoft by the end of last year. This fourth chart shows that iOS products combined are more profitable than Microsoft as a whole.

    Microsoft invented the software business and built it to become the world's most valuable business by the year 2000. It's still been growing since and after 35 years it is reaching a profit of $27 billion per year. It did this while maintaining enormous margins and a highly disruptive monopoly business model the likes of which the world had never seen before.

    It is scarcely believable then that a device business has been created to overtake it in four years.

    ---

    Notes:

    1. The operating income is almost the same as EBIT  which is explained here: Earnings before interest and taxes - Wikipedia, the free encyclopedia.
    2. On the other hand, one should not use Gross Margins alone. The crucial difference between Gross Margin (Sales Revenue - Cost of Goods Sold or COGS) and Operating Income is that fixed costs are also accounted for. These fixed costs are typically Selling, General and Administrative Expenses and Research and Development Expenses (commonly summarized as Operational Expenses or OPEX) which can be allocated to a particular business or division. For different business models, gross margins can be widely different. In the case of Microsoft for example, software has negligible direct variable costs. A CD or download is of tiny cost compared to the price of the license to use it. As a result software often has 80% gross margins. Hardware on the other hand can have very thin margins in single digits (e.g. PCs). Conversely, Microsoft will have very high fixed costs to pay for developers, product management and sales forces. A hardware vendor may have few engineers and sales could be handled through resellers. Thus Microsoft will have very high OPEX and a PC company will have very low OPEX.
    3. So, for example, In Q2 '11 the iPad had an estimated gross margin of $2.06 billion (which assumed 34% margin on published revenues of $6.06bn). As it also was 21% of total revenues that quarter, I assigned 21% of OPEX to the iPad. That means 21% of $2.54bn or $540 million was the operational expense allocated to the iPad. This results in operational income estimate of $1.52bn for the iPad in Q2.
    4. To summarize, the assumptions this estimate depends on are gross margin estimates and the allocation of OPEX in proportion to sales. Gross margin analysis has been a matter of iteration and peer review for some time and I'm fairly confident in my estimates. The allocation of OPEX is more arbitrary. Chances are that these expenses vary greatly with each quarter where more work is done nearer to launch of a new product and less in late season. If there are better methods available to allocate expenses by product, I'm open to suggestion.
  11. Revisiting Estimates for Apple’s second quarter earnings (ended March)

    Research · 29 comments

    Estimates for Apple’s second quarter earnings ending March | asymco.

    Since making the original estimates In January,

    • Revenue: $24.5 billion
    • EPS: 5.89
    • iPhone unit sales: 18.4m
    • iPod unit sales: 10m
    • Mac unit sales: 3.6m
    • iPad unit sales: 7.3m
    • Gross margin percentage: 38.8%

    I revised them at the end of March to the following:

    • Revenue: $25 billion
    • EPS: 6.21
    • iPhone unit sales: 17.5m
    • iPod unit sales: 10m
    • Mac unit sales: 3.6m
    • iPad unit sales: 7.3m
    • Gross margin percentage: 39.6%

    In the past I was comfortable keeping untouched estimates made three months in advance. This quarter however there have been several developments during the quarter which were unforeseen and cause me to revisit my estimates.

    1. The Verizon iPhone launch. Observations of the event focused on line lengths and buying activity. However, Apple reports shipments not sell-through. I believe the deal structure was such that Apple obtained a very large order as condition to the relationship. The January and March update analysis did not consider this order size. We have also more data on sales from HTC and RIM and there is no letup in the market's growth. As a result I am revising the growth for the iPhone back up to 110% y/y and 18.4 million units.
    2. Crucially, I'm increasing iPhone ASP to $625 on the basis of this new demand and the likely delay of iPhone 5 launch.
    3. The iPad 2 launch. This product is still too young to see production and sales patterns. However, demand for the second version seems higher than for the first. Distribution is broader too. The unknown is production. I am keeping the unit number at 7.3 million which is the same as the level of CQ4.
    4. China is booming. The Chinese New Year occurred in the quarter and since last year that has meant a sequential increase in device sales for Apple. But it's a double edged-sword. Almost all production activity is shut down during the holiday period. Apple depends on China exclusively for manufacturing so they will certainly be affected. So whereas it's likely that we'll see increased demand from China this year due to even better distribution, macroeconomics and brand value I'm unsure if supply rose to match. Overall, I'm not changing unit growth due to his increased demand but I'm cautioning that there could be downside bias in my estimates.
    5. The tsunami disaster in Japan will affect some demand in Japan and some of the supply chain will be disrupted. However, the effect will be felt more by weaker competitors. It's possible that the event will amplify the shortages that Apple's pre-purchase agreements already created. The consequences are bad news for Apple's competitors but I rate it as neutral for Apple.

    Given these new facts coming to light, I would update my estimates as follows:

    • Revenue: $25.5 billion
    • EPS: 6.43
    • iPhone unit sales: 18.4m
    • iPod unit sales: 10m
    • Mac unit sales: 3.6m
    • iPad unit sales: 7.3m
    • Gross margin percentage: 39.9%

    Resulting EPS growth would thus be 93%.

    For the record, I value my January estimates since they are based on long-term pattern recognition rather than transient events and thus are more useful in forming a market theory.

    However, these transient events cannot be ignored and analysis needs to be informed by both theory and events. I will be watching to see which set of predictions (early, mid or late) will be more accurate.