I was only half-joking when, on first sight, I tweeted that I will buy a new iPad 2 to go with my new Smart Cover. The new iPad cover is enchanting.
It also seems to be enchanting to many.
I'm estimating that at least 60% of iPad buyers will get one. Based on an estimate of 36 million iPads sold in 2011 and an average price of $48 (70% polyurethane and 30% leather mix), the total revenue for Smart Covers will top $1 billion this year.
I further estimate that with a very modest gross margin of 75% (average cost to produce of $12), the Smart Cover could contribute $777 million to Apple's gross margins.
The iPad by itself should generate $23 billion in revenue and a contribution of $7.7 billion. That means that the Smart Cover will add 4% to sales and 9% to gross profits. If taken as a bundle, the iPad+SC will increase gross margin over the iPad alone by nearly 200 basis points (taking it from 33% to 35%).
It will be interesting to compare the Smart Cover business with competitor tablet businesses.
As the highly profitable iPhone makes up an increasingly larger proportion of Apple's sales, the overall gross margin would be expected to grow.
Sure enough that's what's been happening.
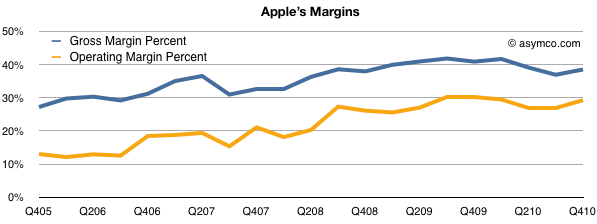
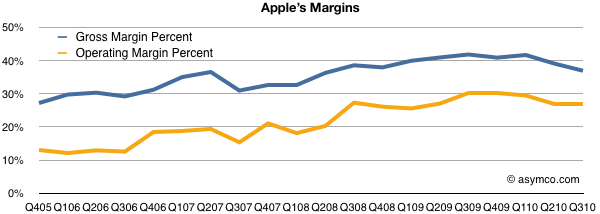
The gross margin percent, which measures the direct or variable costs of production vs. price, shows a healthy rise in the last five years from slightly below 30% to around 40%. The Operating Margin, which also includes the overhead or fixed costs like R&D and SG&A, shows a similar rise, reaching about 30%.
Margin expansion while sales quadruple is a good indicator that a company is producing real value not just trading sales volume for profit.
Focusing attention on individual product lines, it's clear that the iPhone is the largest component of sales and of profits. We don't have specific product line-item gross margins from management, but we can estimate a figure for the iPhone by several means.
First, we can work out roughly what every other product line's margin is due to their longer histories. (Mac and iPod have reliable profitability estimates). What's left can be deduced to make up the iPhone's margin.
Alternatively, we can get estimates of the bill of materials and add in some of the other direct expenses like manufacturing, warranties, shipping and incidentals to get an estimate of the cost of production.
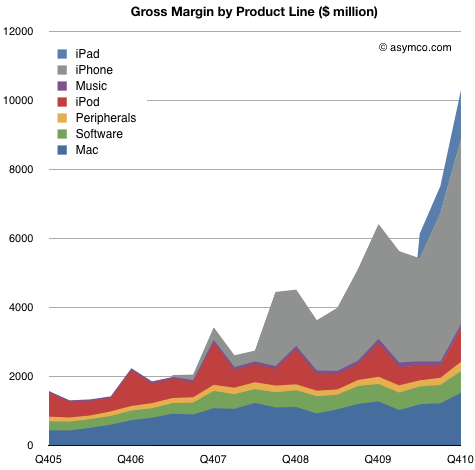
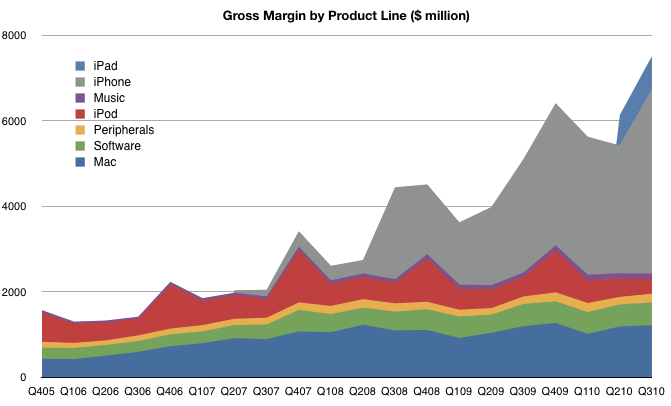
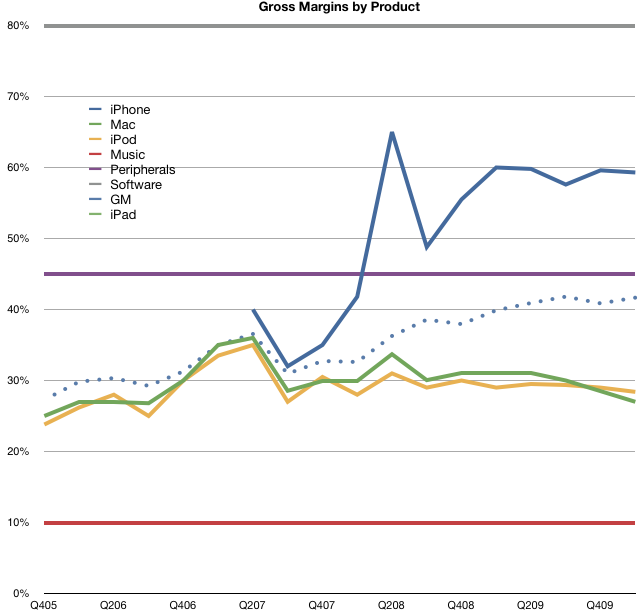
These methods allow me to guess at a margin for the iPhone of about 50% for the last quarter. Based on these inputs we can plot the gross margins for the entire company's product lines:
Overall, gross margins have reached over $10.3 billion in the quarter, increasing 543% from five years ago and 61% from a year ago.
That's great, but by knowing product line profitability we can get a better feel how the company changed strategically.
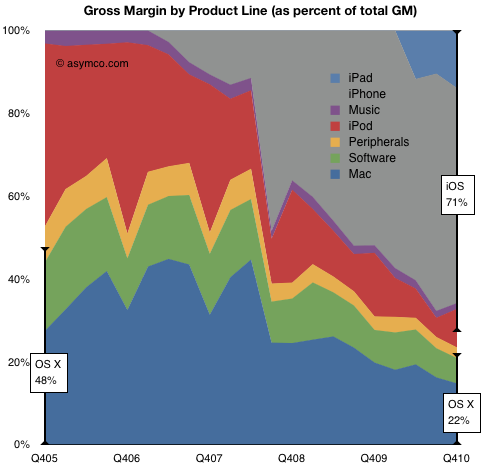
In the following chart I show the percent of gross profit captured by each product line.
What we can observe is that at the end of 2005, OS X based products made up nearly half the profits. The rest was mostly the iPod, which was not a software platform product.
A short five years later, OS X products which, although having grown in volume, made up only 22% of total margin. The rest was mostly iPhone but with significant contributions from iPad and iPod. What's most important to note is that the non-OS X profits are almost all powered by iOS.
iOS powers about 70% of Apple's current gross profits. Combined with OS X, 93% of profits are from platform products.
So again the question about Apple being a software, hardware or media company comes back. Perhaps, those categories are not relevant. Perhaps Apple is a platform company.
The last analysis of the iTunes content store showed amazing acceleration in download rates. Since we know something about the pricing of apps in aggregate, we can make some guesses about the income from apps for both Apple and suppliers.
The key assumptions are:
Average selling price per app $0.29 (as reported in June 2010 here).
Price per song $.99 increasing to $1.05 over time
Music gross margin 10%
App gross margin 30%
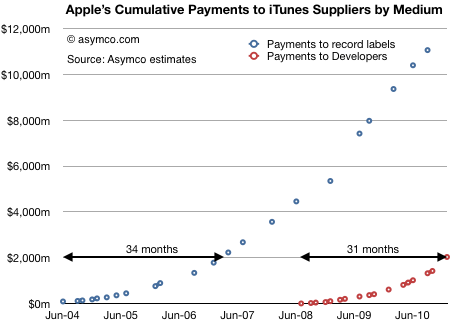
The first chart shows the accumulated payments made to suppliers of content to the iTunes store over time.
Although the music suppliers received in aggregate much more than developers, the iTunes store has been open much longer. When comparing sales acceleration, the App store is ramping faster having paid out $2 billion in 31 months vs. 34 months for the first $2 billion paid out for music.
My guess is that a follow-the-money analysis would show that apps as a medium will absorb talent and capital away from existing mediums and the industries they support.
14.2 million devices shipped, sell-through: 12.3 million
expect to ship 14.5 to 15 million units in the next quarter
ASP of approximately $315
US, UK and Canada are 56% of sales
US represented 34% of the total revenue
Last year US represented 57% of revenue
BlackBerry Torch launched in over 75 new markets, Torch launched with the $99 pricing from AT&T
BlackBerry Curve 3G launched with 118 carriers in 48 countries
China Mobile introduced BIS for small-to-medium sized businesses. The service starts at $14 per month
App World applications grew 60%
More than 16,000 applications available
2 million downloads daily
1,000 vendors registered for PlayBook apps
Revenue: $5.5 billion
Net subscriber additions: 5.1 million
Top three customers: 12%, 9%, and 9% of revenue
The same quarter a year ago: 25%, 13% and 10% of revenue
Service revenue in Q3: $835 million
Software revenue: $78 million
Gross margin in the quarter was 43.6%
Cash: $2.5 billion
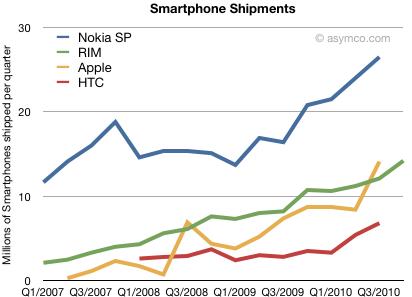
For comparison, here are a select few vendors' smartphone reported shipments. RIM is the first to report and we'll be hearing the the rest by the end of January.
The number most RIM "bears" focus on is the new subscriber additions. At 5.1 million out of 14.2 million units sold implying that the new subscribers added per unit sold is 0.34, a new low.
The bulls will argue that the gross margin is healthy and slightly higher than anticipated.
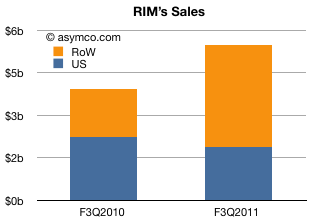
My observation is that the company is finding growth outside its traditional markets. Given the figures above, the US went from $1.65b in revenue to $1.87b; a mere 13% growth while the company experienced 89% overall growth in revenues.
The following chart illustrates the situation:
Of the total increase in sales ($1.6 billion), the US contributed -15% while the rest of the world accounted for 112%.
This can be seen as positive news since RIM has been weak internationally for many years and they really need to penetrate world markets. However, a -15% growth in the US is implies significant share loss in a rapidly growing and traditional stronghold.
After the last earnings report, many noted that Apple's gross margins dipped. Turley Muller noted in a letter to PED that the cause was probably the aggressive ramp in iPhone 4 production which broke new records at 14.1 million units.
That may be. My estimate of iPhone margin shows it dropping to about 49% from the more usual 55% (sometimes even higher). We'll never know exactly how much, but sometimes margins drop. RIM and Nokia are punished for drops in the GM percent so why shouldn't Apple?
However, there are some other factors to consider: the overall margin is currently historically very high. As the high-margin iPhone makes up more of the total product mix, the overall margin should be growing. And it is. The chart below shows the trend since 2005. GM was in the high 20's five years ago.
Note however the other margin: operating margin. After taking the fixed costs into consideration (which we saw to be shrinking as a percent of sales), Apple's bottom line profitability has been rising slightly more rapidly than the GM. It has plateaued recently but not dipped significantly.
Also note that there have been dips in the past from which GM expansion resumed. One such dip was at the launch of the first iPhone in 2007, though we can't be sure that was attributed to the iPhone itself or to other factors like that most cited by management: components costs.
However, the bottom line profitability is only part of the picture. It would be instructive to look at which product contribute how much. You won't see this analysis often because the gross margin by product is not published by Apple and it takes quite a bit of guesswork to get there.
I maintain product-level gross margins and compute the overall GM bottom-up. The product-by-product line profitability is based on several assumptions which I won't detail here, but those assumptions lead to the following contribution chart:
There are several takeaways here:
The iPhone is huge (57% of gross profits). It is far more important than most people assume. Without it, the company would not have materially grown EPS since 2007.
The "Music" which includes iTunes revenues is tiny. Many people assume that iTunes is a large contributor to Apple's operating profitability but operating margins on the store are 10 percent. Peripherals add more to the bottom line than the iTMS/App Store. The benefit of the iTunes/App Stores is in the hardware sold.
Software contributes more now than the iPod. This is completely under everyone's radar but Apple's software business has been growing and with 80% gross margins (assumed) it's a big part of the profit picture.
The iPad margins are lower than the iPhone. As it grows in volume, the profit share will grow, but it's a long way from being the profit share leader.
This picture should also be a warning to Apple's competitors. If they seek to grow shareholder value and shift profits away from Apple they need to see just how much of that profit is captured in hardware. At the same time, they need to realize that it's the non-hardware businesses which make the hardware so desirable. Like it's products, Apple's income statement is very inter-dependent.
In recent articles I highlighted the acceleration in iTunes App downloads where the rate is approaching 18 million apps per day and the cumulative total apps which is about to overtake the cumulative songs downloaded.
We now turn our attention now to constructing the iTunes income statement: namely total sales, gross margins and deduce its operating budget.
Gross Sales
To obtain the top line (income) for iTunes we need to know the average selling price (ASP) for songs and for apps. Apps are easy, we received that info in June: $0.29 per app. For songs, it was easy before early last year: $0.99/song. After the selective price increase, the blended price needs to be estimated. I chose $1.10 for 2009 and $1.2 for 2010. These are just assumptions and can be adjusted but should give us a rough estimate:
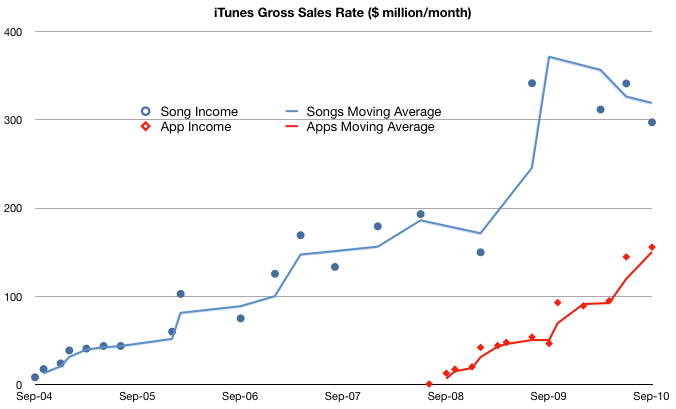
I followed the convention of using income rate or $/month to show the history of sales. It shows that even with a price less than a third of the music product, apps are generating over half of the sales of music. In other words, apps are adding 50% to iTunes sales today. If the decline in music units continues and the app sales increase with the current trajectory then app sales value will overtake music sales next year, consistent with the cross-over of cumulative units sold.
Gross Margin
If we know how much Apple pays music licensors and developers (i.e. cost of goods sold) we can calculate how much it keeps for operations (gross margin). Apple's app margin is 30 percent. The music margin was never official but the consensus has been 10 percent for a while.
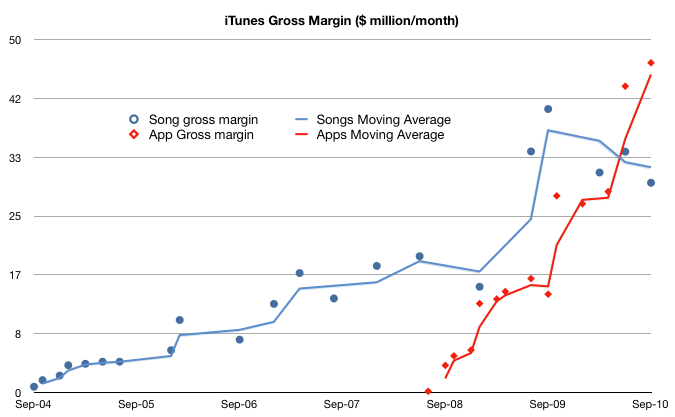
Using these figures, we get the following chart:
This shows that what is left after paying the content license, Apple "keeps" about $50 million every month to run the App store (iTAS) and another $30 million to run the Music store (iTMS).
The Operating Budget
Apple has made a point of saying that both iTAS and iTMS are run at "break even" implying that the gross margin is used up in operating costs (CAPEX, R&D, SG&A). To be sure, the cost of bandwidth and the data center(s) needed must be considerable.
But the operating budget for the store is beginning to reach a level that may be beyond what can be spent reasonably. The amount left over for operations has increased from ~$30 million a month in 2009 to $75 million/month today.
In fact, if this burn rate is maintained (even though it's increasing) the operating budget for iTunes is nearing $1 billion/yr.
I'm not an expert on the cost of operating data centers but $ 1billion a year seems like a lot. I would love to see an analysis of how this could be allocated.
Implications
I would also add that because of the increasing mix of apps, the overall gross margin percent is increasing. I estimate that to be a blended 17%--a healthy margin for a content store--and an increase from 10% before the app store came online.
Finally, one implication of the economics involved is that a budget like this may provide a significant barrier to entry for any competitors looking to take on the iTunes juggernaut. iTunes has reached content critical mass (12 million songs), user base (160 million users) and wide distribution (23 countries for songs and 80+ countries for apps).
These are non-trivial operational issues that even the best in the "cloud" business models will find challenging.
Footnote:
This discussion excludes video sales, rentals, book sales as we don't have solid histories for these product lines. However, we can do a spot check on the cumulative totals:
450 million TV episodes downloaded implies $1 billion in sales.
100 million movies downloaded probably adds at least another $1 billion
35 million books adds another 500 million.
Compare with 11.7 billion songs at ASP of $1 for about $12 billion in song sales and 6.5 billion apps at ASP of $0.29 or about $1.9 billion.
iTMS content downloads have generated $16.4 billion in sales to date.
Apple's overall gross margin reached 41.67%, the second highest ever. The highest was 41.82% last Fall. This should not come as a surprise as the iPhone continues to make up an increasingly larger percent of Apple's total sales. The gross margin on the iPhone continues to be well above all its other product lines (except for software).
Although Apple does not provide product line GM break-out, some intelligent guessing can be made. Here are my estimates:
iPhone 59%
Mac 27%
iPod 28%
iTunes 10%
Periph 45%
Software 80%
A historic perspective for gross growth (iTunes, Peripheral and Software sales growth) is shown in the graph below.
Apple’s latest re-statement of financial statements eliminated subscription accounting for the iPhone not just for the past quarter but for the entire history of the product, back to mid-2007. This allows a more precise estimate of the gross margin of the product and the results are eye-watering.
Apple does not reveal the margin for any product. They do provide an overall margin for the company (shown in the dotted line above).
The only challenge is to “back into” the GM for iPhone based on what we know of the margins for the other product lines and filling in the iPhone as the last piece of the puzzle.
To do so, we need to have some idea of what the other products’ margins are. Fortunately, this is not that hard.
We start with the easiest and work up:
The Software products business line ($2.4 billion last year) is easily the most profitable on a unit basis as software does not require much cost in manufacturing. A solid ballpark estimate is 80% GM (which is what Microsoft typically gets.)
Next, Music ($4.2 billion revenues). The estimate for music is fairly straight-forward. Apple and the industry have leaked the terms many years ago. Apple pays the labels most of the revenue of the music and keeps about 10% to operate the store. On the App Store there is a 30% margin off the selling price but that is offset by higher direct costs (shipping billions of free apps and free updates). I stick with 10% margin for the Music business line.
Third, Peripherals. The peripherals business is not particularly large for Apple, but they do a fair amount of peripherals with $1.5 billion last year. My estimate for peripherals margin is 45% based on some comparables.
Fourth, the iPod ($8.1 billion). The iPod has had a fairly well understood cost structure. The main variable is the cost of the memory, which, as a commodity, varies greatly quarter to quarter. Nevertheless, there is a strong consensus that iPod margins have kept around 29% to 30% over a few years. Teardown analysis coupled with spot pricing for memory chips gives a consistent average.
Fifth, the Mac ($14.7 billion). The Mac is a difficult product to estimate margins for due to the relatively wide variety of SKUs in the market, the complex components, various quality/warranty issues, transportation costs and the point in the life cycle of any given Mac. The best estimates however hover around the same as the iPod: 30%.
Once these values are available, and knowing the proportion of sales attributable to the iPhone vs. the other products, we can get an estimate of the gross margin.
Recent GM estimates are all shown in the graph attached. Here are a few observations:
The overall GM was tied very closely to the Mac/iPod prior to the iPhone.
Gross Margin has been increasing since the iPhone
The iPhone GM is consistently above 60% and is chiefly the reason for the increasing of the overall GM
The expanding margin for the whole of Apple is quite a story in itself (especially vis-a-vis the tragicomedy of the other PC vendors). However, what really stands out is how high the iPhone margin is.
Knowing why it stays so high in the face of an assault of “iKiller” devices is a clue to how Apple creates value.
Peter Oppenheimer, Apple's Chief Financial Officer, said that the Average Selling Price of iPhones in the quarter "was just over $600. This reflects both high mix of 3GS sellthrough and benefits of rebalancing the ending channel inventory toward the 3GS."
An astonishing admission from Apple who has never revealed their iPhone ASP. Previous analyst estimates had the iPhone ASP at $550. If this is true, then Apple has violated one of the cardinal mobile industry rules: "Thy ASP shall always erode". Given what is known about the components, iPhone gross margin is likely to be above 50%. The gross margin, or what you are able to capture in value above the bill of materials, isthe primary indicator of value creation in the device business. Apple's number is astronomical vis-a-vis the competition. Stay tuned as this gets scrutiny.
So Dell is making Android mobile phones while Nokia is making Windows PCs. A curious confluence of poor management decisions.
Why is all this dilution of core competence happening? Average punditry would suggest it's all about "convergence" and the overlapping of mobile and until-recently-fixed computing.
Er, not quite.
The economics of plastic bits shipped in cardboard boxes has not changed. It's as lousy a business as it has always been, whether the plastic bits are small or large. Some would argue that the gross margins of mobile devices are higher than those of computers, but that's not true on average. The gross margin on average mobile phones is just as low (<10%) as it is on PCs. There are about the same number of competitors and rivalry and global marketplace.
If indeed, margins were the only story, why would Nokia choose to chase the low margin PC business while holding (albeit very tentatively) 50% global share in "smartphones"? Similarly, why would RIMM choose to chase the low end consumer business (link: Blackberry Pearl et. al.) while having the fat margins of thinly penetrated business devices to wallow in? Finally, why would there be hundreds (literally link: www.pdadb.net) Windows Mobile smartphone licensees, the vast majority of which don't manage to sell more than the 50k minimum volume licenses they are obliged to order?
The fact of the matter is that the money being chased by device vendors is not being paid for devices, but for the service plans those devices enable. More precisely, these businesses are concerned with capturing a share of ARPU uplift from mobile data services. As such, they are mostly offering hardware as enticements for the *change* in ARPU that mobile broadband creates. Success depends on the power of that hardware to compel users to switch to higher data service fees.
The first proponent in his "hardware as ARPU booster" was actually Microsoft back in 2003 when they entered the mobile OS market. One of their value propositions was that Windows Mobile would boost data ARPU. The reality was not so compelling however as WinMo turned out to be too awkward to use for most users and the power of the platform lay fallow. In reality, the first successful hardware ARPU booster was RIM. In the middle of this decade, RIM showed that a Blackberry user could be worth between $5000 and $8000 in NPV ARPU to an operator. For that juicy pie, RIM was handsomely rewarded with a small "cut" that boosted their margins to above 50% making them the most profitable device vendor on the planet.
The realization only began to set in about 2007 as every other vendor began applying resources to deliver ARPU boosters. Apple took note early and executed beautifully with the iPhone, mastering the "get paid for ARPU" game, and in the process capturing 50%+ gross margins and (depending on the quarter) up to 30% of all profits in the device industry.
To forecast how this game will be played and how sustainable this boosterism is, we need to segment or categorize the market according to ARPU. The way to visualize this is what I call the "wedding cake" model. Each cake layer represents the population of users in that ARPU segment and the thickness of that layer represents the delta of ARPU to the layer below.
The base layer is huge (billions of customers) and represents the prepaid voice market. The average "thickness" of this layer is about $10/mo.
The next layer is smaller and represents the postpaid voice market. The thickness is about $30, representing the "boost" over prepaid.
The next layer is smaller still and represents the postpaid voice+data market where the data is a-la-carte. This is typical of plans where the buyer pays separately for certain data services (e.g. email, navigation, etc.) and pays on a per-megabyte basis for browsing. The ARPU differential is about $20.
Finally the top layer is the unlimited data plan packaged with bucket voice and SMS. Here the ARPU differential is another $30.
At its highest, the cake is about $100/mo., though the width of the top layer and hence the population of paying customers at that price point is quite small relative to the other layers.
Now each layer is covered with a "frosting" which is the device hardware revenue. Obviously the frosting gets a bit thicker the higher the layer, but it's a relatively thin layer compared to the "cake" thickness. In the higher layers the trend is in fact to make the frosting as thin as possible (<$99 NPV or <$4/mo. for a 24 mo. contract.) The devices which enable the top layers are clearly more complex and expensive to make, but the end-user pricing is trending down. The trick is therefore to convince the operators to pay a piece of the "cake" to the device vendor in exchange for migrating users to these higher layers.