Apple is best placed to withstand memory inflation
Analyst Wamsi Mohan told clients in a note that the bank applied its existing elasticity framework to assess how Apple, Dell and HP can offset sharply higher component prices expected in 2026.
Mohan wrote that NAND prices are projected to rise “+140% in C26 and DRAM +14% in C26,” forcing PC OEMs to rely on a mix of “price increases, reconfigurations, and pressure on supply chain to offset headwinds.”
BofA divided each OEM’s units into demand-elasticity cohorts and found that Apple is best placed to withstand memory inflation because its “units skew the least elastic with ~85% in the Inelastic cohort.”
Based on BofA’s modelling, Apple faces a potential earnings impact of just $0.12, compared with $3.77 for Dell and $1.55 for HPQ.
Mohan said the bank does not expect the full theoretical impact to materialize because memory pricing in long-term contracts is likely to be lower than current projections.
“The implied downside to EPS is modest for AAPL,” he wrote, adding that BofA maintains its Buy rating on optionality from new products, new markets and “eventual success with AI at the edge.”
BofA believes Apple’s operating margins could still see over 600bps of year-over-year deleverage, though they remain positive due to the company’s stronger profitability. Dell and HP would need to cut operating expenses by 5–20% and reduce specifications to remain profitable.
The bank now expects 2026 PC units to fall 8% year over year, compared with a prior view of flat growth..
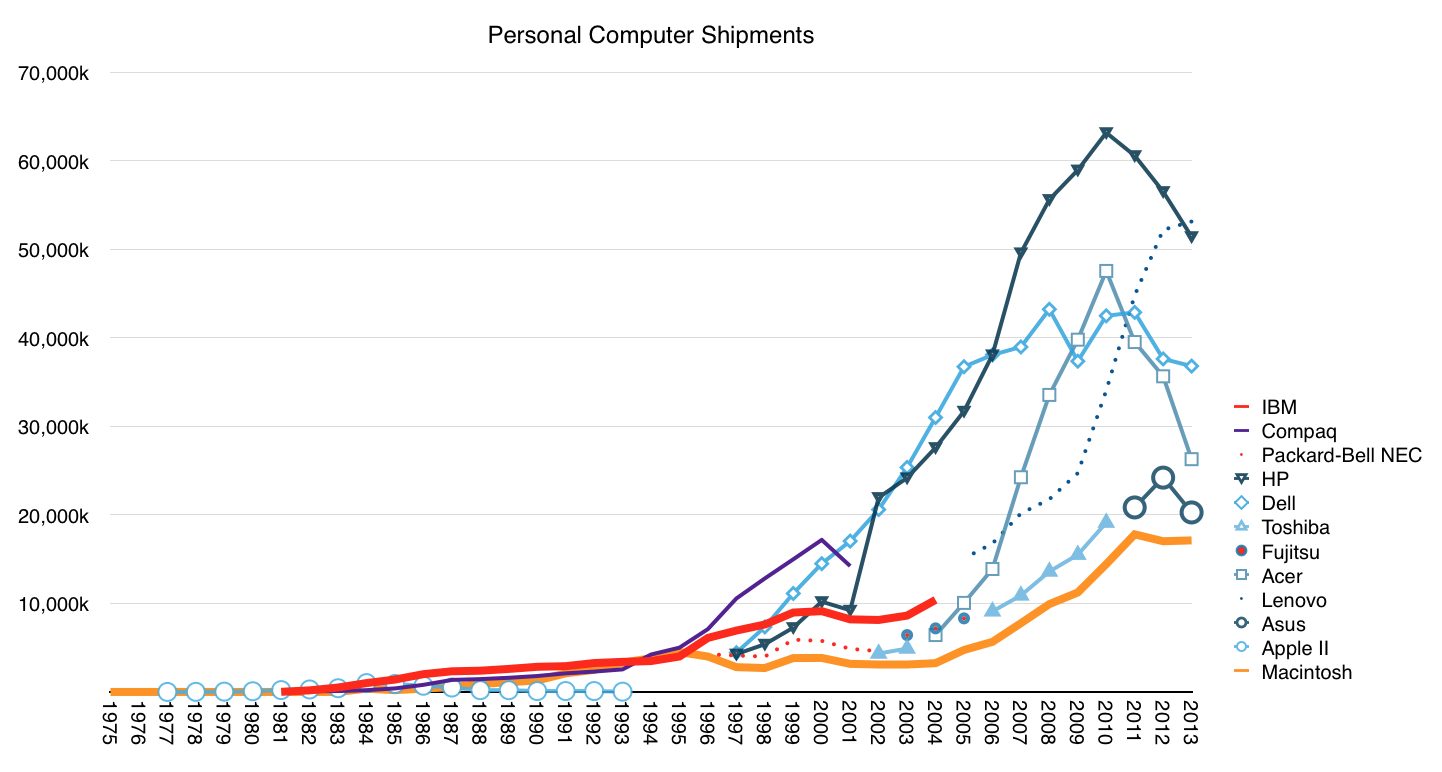
IBM did not invent personal computing but their "PC" became synonymous with the category. Having entered the market in 1981, the IBM PC quickly became the top selling brand. From 1984 to 1993 IBM sold more PCs than any other vendor, conceding the spot to Compaq which remained on top only until 2000. No PC vendor remained at the top of the sales leagues longer than IBM. HP had the second longest run but that run was broken last year as Lenovo (who acquired IBM's PC business) surged.
As the graph above shows, the period of time when IBM was dominant was characterized by far lower volumes. In 2004, the year IBM exited, they sold about 10 million units. ((as the graph shows, if we consider Lenovo as taking over from there, they did a very good job extending the legacy.)) It was a decent performance but one that did not keep up with the Dell and HP/Compaq race to the bottom in pricing and subsequent rise in volumes.
However, throughout its position of strength, IBM was a reluctant PC maker. IBM never controlled the PC platform the way they had controlled their mainframe and mini-computer businesses. Their falling out with Microsoft over OS/2 and their attempts at differentiating with the PS/2 architecture show how uncomfortable the situation was. Their exit in 2004 must have come as a relief and, in retrospect, they should be congratulated for having exited the market well before it began deteriorating. First came pricing and margin collapse and later total volumes began to decline. Most of the remaining vendors are today in various states of distress. Lenovo is growing but incumbents like Dell, HP and entrants have come and gone (Fujitsu, Sony, NEC, Toshiba). Potential disruptors like Asus and Acer have found no long-term success with PCs.
This is because without control over the platform, PC hardware is nothing more than a commodity, with negligible margins, intense competition and an inability to control one's destiny.
One company making computers did manage to control its destiny. By continuous refinement, the Macintosh survived and even thrived as the market pivoted toward mobility (and hence requiring integration that values design). Indeed, Apple now ships over 17 million Macs a year. More than either IBM or Compaq did at their peaks. It's not in the top five globally but has a very profitable niche. ((It's very likely that it captures more operating profit than the top five vendors combined.))
As a matter of fact, through 2013 Apple shipped a total of 156.5 million Macs, 50% more than all IBM PCs ever shipped. Apple also shipped more than twice as many iPads and five times more iPhones. And it's not just popular with consumers. With iOS Apple manages to reach 98% of Fortune 500 companies and 92% of Global 500.
At the same time, even though IBM exited the hardware business, it remained a powerful force in computing. IBM pivoted to primarily being a service company with a vast client base and increasing global reach. It essentially moved up the value chain to become an integrated services provider to business customers. IBM's reach in breadth and depth of services is extraordinary.
This dramatic turnaround–Apple moving to a device leadership position and IBM moving to a service leadership position–created the conditions for today's announcement of a strategic partnership--an event which is astounding to those who witnessed the 1980s and 1990s. Were it not for the tenacious independence of Apple and the business model agility of IBM, neither company would be around today to leverage one another.
There is drama in this industry and this latest chapter has a plot twist which any poet would envy.
LG Electronics has acquired HP's WebOS for an undisclosed amount. When last it changed hands WebOS was part of Palm which was purchased for $1.2 billion in 2010.
Palm has thus been effectively divided into several smaller pieces distributed as follows:
HP will own:
Support of existing Palm users
Palm back-end assets including source code, infrastructure and talent
webOS patents
LG will own:
Stewardship of the Open WebOS and Enyo open-source projects where the source code resides
Associated talent
WebOS websites
License for IP related to webOS
LG announced that it plans to offer an "intuitive user experience an Internet services across a range of consumer electronics devices." In an interview, the CTO of LG said that given the current situation with Android, LG does not plan on making smartphones running webOS but will use it in televisions and other devices such as cars, signage and appliances where there are no embedded OS's. "We'd like to secure a software platform across all devices."
Most commentary regarding the deal focused on the use of the platform for TVs but management seems to consider all devices, perhaps even phones, at some future date, to be webOS targets.
The TV however seems to be low hanging fruit today. The TV as an app platform will be the new ecosystem war and no platform today has a lock on the developers or users. The way this rivalry will shape up will not mirror other device classes for the same reason that current device classes are platform silos.
PCs, music players, tablets and phones all have different super-majority platform leaders. The association of a platform with a device class depends first on the distribution model, which favors a specific business model which favors a specific vendor which favors a specific platform. As each device is distributed differently, a different platform takes precedence.
Consider that the PC has historically been purchased by IT departments which led to a monoculture of Windows which led to a persistent leadership for Microsoft.
The music player created dominance around iTunes mostly because the distribution model for music labels was baked-in. With network effects, the iPod quickly gained and perpetually retained market share leadership.
The smartphone business initially favored Symbian and BlackBerry because they had the market access through operators. After the touch UI became dominant (and incumbents failed to respond in a timely manner), Apple and Google took leadership as soon as they accepted the operator distribution model. Android in particular is especially resonant with operators and has been developed with their requirements in mind.
The tablet business is more like the PC business but without enterprise requirements or patterns of purchase. This has meant that app/content ecosystems and retail distribution were the key gating factors. The story is still unfolding but so far Microsoft has not found a foothold while iOS and Android and Amazon have.
That leads to the question of how will smart TVs be sold and which business model (or go-to-market strategy) will succeed. Steve Jobs pointed out the difficulty in trying to deliver innovation into a value chain dominated by cable companies which can effectively block it. A TV which is an application execution device rather than a content terminal will require a re-definition of the category. That will require a re-positioining of this product. Few companies are able to do that. [See also my post Tele Vision from mid-2011].
Which brings us back to the question of webOS. As long as LG sells TVs as content terminals they might not obtain much value from webOS. If, on the other hand, LG were to use webOS to re-define their televisions to be something else entirely, namely software execution devices, sold differently and hired to do a different job than a TV, then webOS becomes not only necessary but potentially a source of great prosperity.
Gartner has published preliminary PC unit sales for Q2. The data from Apple's Mac sales has not been published yet but based on some estimates, we can draw a partial picture of the personal computer market.
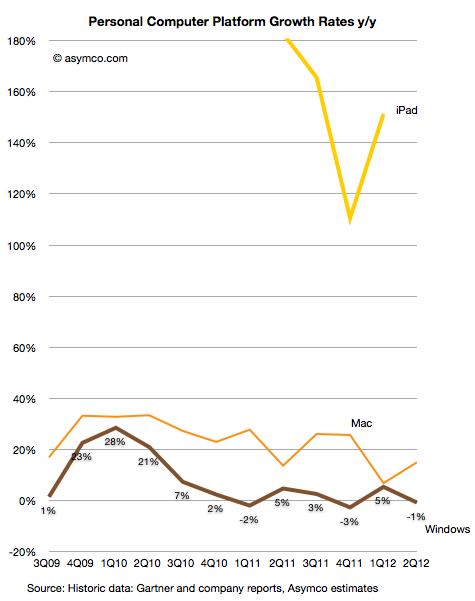
My estimate is that the Windows PC market fell by 1% while the Mac market grew by 15%. Gartner reports an overall flat market. I'll leave out the iPad for the time being, and show the growth of the Mac vs. Windows:
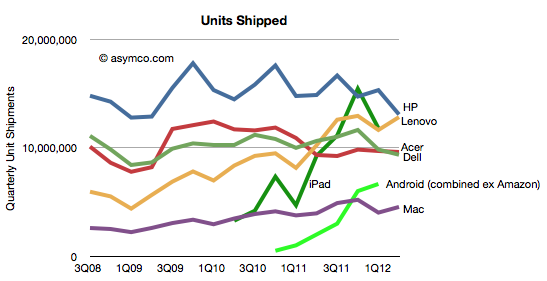
In terms of individual vendors vs. each other, the patterns are as follows:
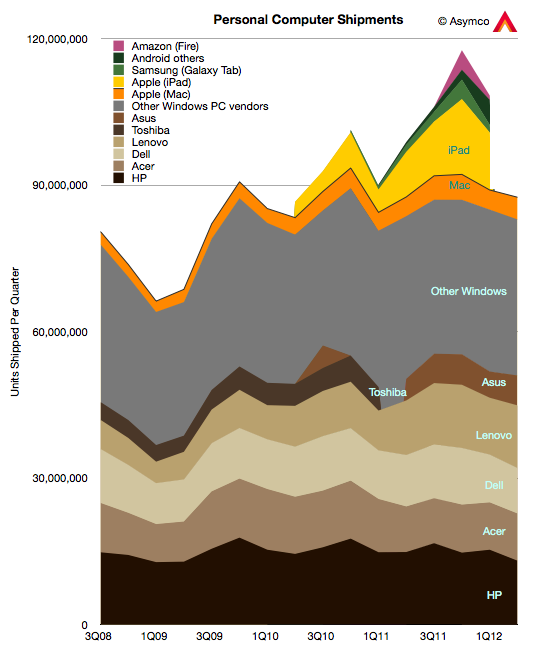
It's perhaps a bit early to tell, but if the Windows PC market continues to slow or contract, it may be possible that HP and Dell will cede their market share leadership positions to Lenovo and Acer. Already "Others" account for as many units as HP and Dell put together.
If we are to believe the analyst community reflects consensus, the industry, in the aggregate, continues to treat the potential for disruption from devices as unlikely. There always seems to be a wrinkle, a quirk, or an exceptional circumstance that is to blame. I won't get into all the excuses given by analysts for the slowing of PC sales but will point out that there's been a series of initiatives put forward by the industry to act as "catalysts" for growth. So far they have not worked. The current expectation is that Windows 8 will reverse this trend.
Perhaps. But perhaps the relief, if it comes at all, will be temporary.
[UPDATE: Due to a data error, the drop in Windows was overstated in the initial version of this post as 10%. It's been corrected to a drop of 1%]
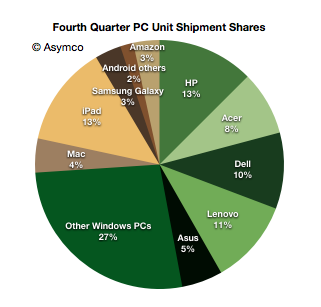
In January I noted that there were more iPads sold by Apple than PCs from HP, the largest PC vendor in the fourth quarter. Including all tablets, this is the distribution of market shares by units shipped.
Note the different color palettes for Windows and non-Windows.
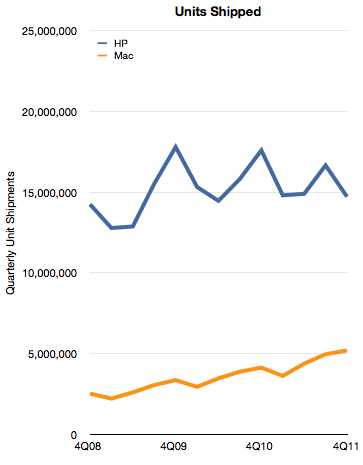
By the metric of tablets+PC's Apple appears to be the leading vendor. However, if we consider only the Mac, Apple is still well behind. The historic unit volumes of the two is shown below:
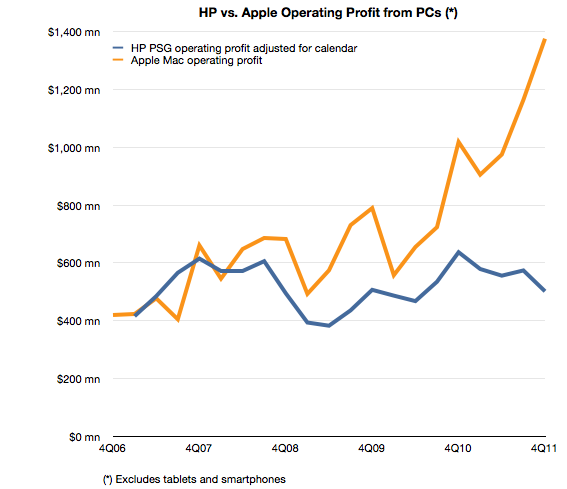
Although Apple has nearly doubled its shipment volumes since 2008, it's still only one third that of HP. In addition to comparing volumes, we can also measure profitability. In this case HP's PSG (Personal Systems Group) reports operating profits and we can estimate the same from Apple based on a gross margin estimate and an operating expense estimate (as percent of sales).
The comparison looks like this:
The operating profit for Apple is 2.7 times higher from a third the units. This gap is a result of a vast difference in profitability. HP's operating margin for PCs is 5% while Apple's is 21%.
A few days ago I highlighted that Apple's iPhone yields disproportionate profits because of the way it performs the jobs its hired to do by consumers and operators.
With the Mac the story is that Apple's OS X is primarily responsible for delivering quadruple hardware margins vis-a-vis the most successful PC vendor.
Both iPhones and Macs are sold as hardware products and the entire econometric analysis of Apple depends on hardware cost structures. This is because hardware lends itself to easy measurement. However, a casual observer would be stumped by a comparison with competitors which cannot come near the profitability Apple enjoys. How can the same bundle of components (admittedly mostly off-the-shelf) be sold at triple the margins?
It comes down to software. Apple has a monopoly on iOS and OS X and charges for it through its hardware. That's a very valuable monopoly. It's worth at least $1 billion per quarter.
Yesterday's post described the history of personal computing platforms over the past 37 years. It showed a distinct shifting of "eras" between traditional personal computing and the emergent mobile computing represented by device-based platforms.
Underlying these lives (and deaths) of platforms were the growth (and decline) of fortunes of companies and people. I hoped that by observing these patterns insight could be gained into the conditions for success or failure.
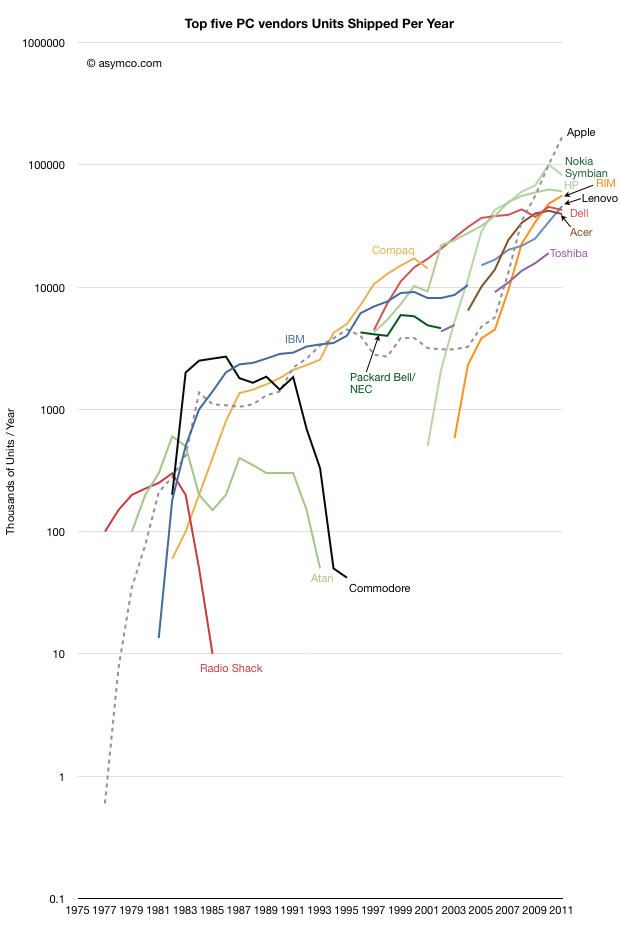
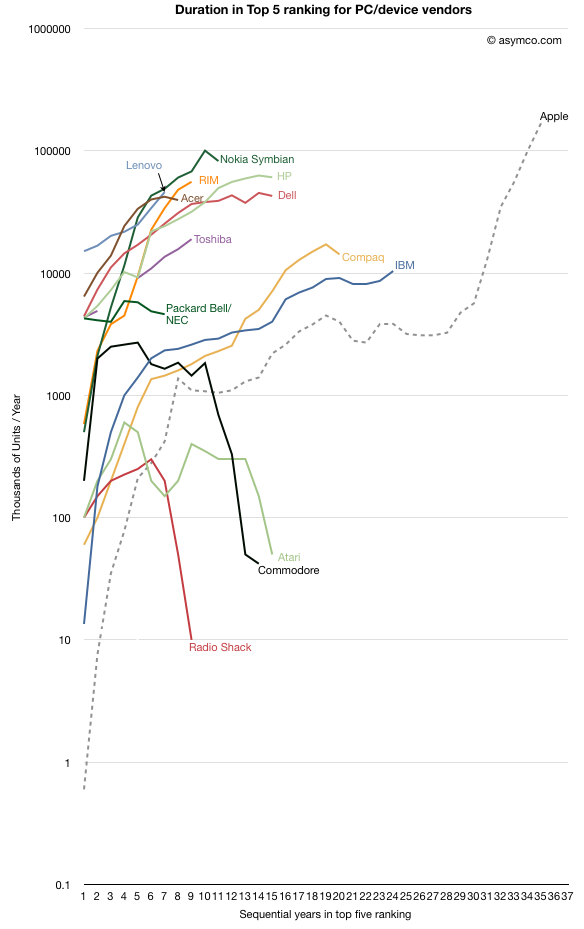
The following graph shows the companies which were predominant (in the top five ranking by shipments[1]) during each year of the industry's history and the volumes they were able to obtain during that period. I also added Nokia and RIM as examples of the challengers coming from mobile devices.
It's a difficult graph to interpret. The pattern I observed was that most companies were not able to sustain presence in the top five ranking for long. Indeed, regardless of having one's own platform or being a licensee, companies seemed to fade reliably. Some were acquired, some sold their operations but there is a distinct impermanence to their prosperity.
To sharpen this perspective of longevity I indexed each company to the point when they entered the "prosperity zone" and measured their staying power within it. The following graph shows these indexed lives.
Apart from Apple, IBM remained in the business the longest (24 years). Compaq was second with 20 years before being bought by HP. HP and Dell are still operating after 15 years, having tied Atari and Commodore. After these ancients, the upstarts Nokia and RIM are struggling to remain relevant after 10 to 12 years.
Then there are the transients like Packard-Bell/NEC, Toshiba, Radio Shack and Fujitsu which lasted less than 10 years. The newest PC companies are all from China or Taiwan: Acer, Asus and Lenovo. Their longevity cannot be called yet though Acer seems to be in decline. Lenovo, which took over IBM's brands continues to grow. However, as yesterday's post showed, without diversification into devices, pure PC makers are likely to fade.
But besides this interesting history lesson, there is a deeper, unsettling observation. The scale of these periods of prosperity is far shorter than the average person's career. Indeed, the entire time span of the study is 35 years, about the time an average person will be employed. All the companies failed to maintain prosperity over this time frame.
These are a small sample, flawed by showing only hardware units, but I consider it a proxy for the overall technology market. Software-only or services companies have had no better records.
The implications for company managers and workers is profound. Chances are that the business you work for will not prosper for more than a decade and will reward you for an even shorter period. Similarly, as witnessed by the P/E ratios, investors have given up on this industry as one with any quality of earnings.
There is no "rule" that this has to be so. The high mortality rate and short longevity of technology companies is a consequence of a failure to manage innovation and disruption. Apple may be an exception--one I think worth studying. Though not always prosperous, it has managed to survive, being the only company from the early era of personal computing to still be operating in the industry. Indeed, it's now the most prosperous. Maybe it's a fluke, but I rather think it's due to an ability to re-define itself as the market shifts. Its essential quality being an ability to disrupt itself.
And if we think about it this way, ultimately, longevity is more important than prosperity. Without patience there is nothing but chance determining prosperity. The fate of more than company finances rests in the balance.
Notes:
Apple did not maintain a position in the top 5 throughout this period but is shown as a benchmark as it remained in the same business throughout this period.
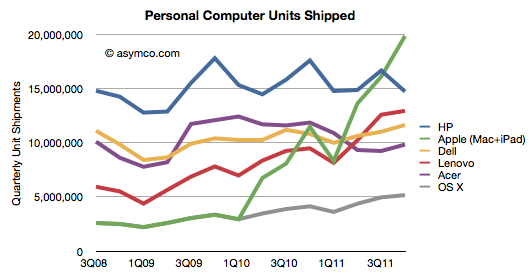
However, according to Gartner, HP shipped 14.7 million PCs in the last quarter. While we don't have the total global figure for Apple, my estimates are 5.2 million Macs and 14.7 million iPads, for a total of 19.9 million computers in the same period.
There might be an error in both Gartner's and my numbers, but the gap of over five million in Apple's favor is unlikely to disappear.
The history of shipments from these vendors is shown below.
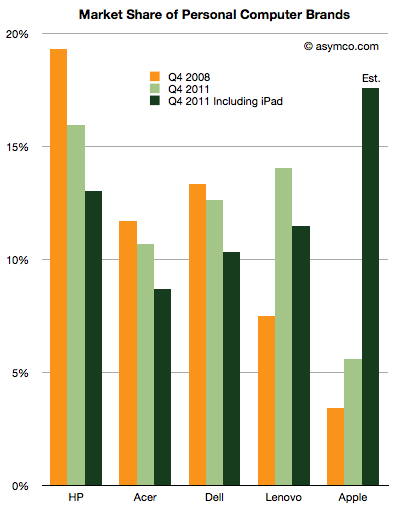
The market shares are also shown here:
I included the market shares thee years ago, and the rankings with the iPad excluded.[1] Apple went from 3.42% share at the end of 2008 to 5.6% share today excluding the iPad or 17.6% including the iPad. HP went from 19.3% in 2008 to 16% today or 13% if iPad is included.
Apple is ahead of schedule on their taking[2] the top spot in terms of units.
Notes:
Although vendors other than Apple also sell tablets, their totals are unpublished and I am not aware of any estimates so. If anyone has seen estimates I would be happy to amend the data.
Throughout the history of the industry, Apple never held the top spot. The Apple II peaked at 15.8% in 1984 and the Mac at 12% in 1992.
HP's CEO Meg Whitman admitted that, when iPads are included, Apple will overtake HP as the world's leader in computer shipments.
“We need to improve our game and our products to take over the leadership position. Apple could go past HP in 2012. We will try to become the champion in 2013.
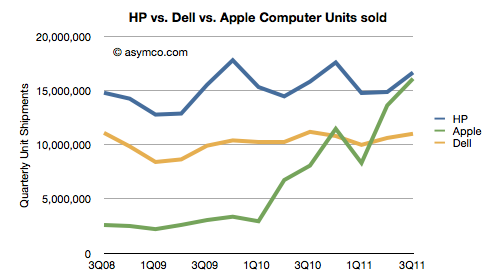
When the quarterly shipment data is seen as a chart the doubt of this happening disappears:
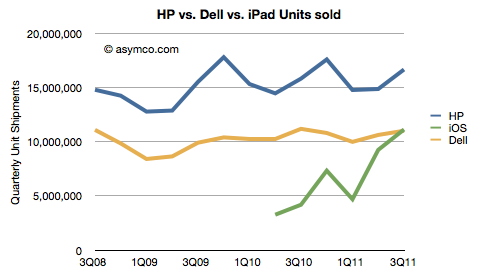
Note that the combined iPad+Mac has already overtaken Dell. In fact, the iPad alone overtook Dell in Q3 and might overtake HP in two quarters.
The iPad is growing at an average of 170% y/y (average of two quarters) while the Windows PC market is growing at an average of 1.9% over the same period (source: Gartner, company reports). The
Placing the iPad in the "competitor" category is an important admission for a PC company. Categorization choices make all the difference when thinking about strategy. The new tablet product may not appear at first glance to be competitive with the current definition of a PC (though it might very well be a personal computer.) But definitions tend to evolve. Categories are abstractly defined. The original PC was certainly not competitive with Mainframe computers and perhaps it still isn't. But that does not mean that usage (and hence value capture) did not migrate. Most people today would say a PC is a "real computer" and the Mainframe is simply an old computer.
Whitman notes that the iPad is not the only computer people use and most have a PC as well. That may be true as it was true when the PC was new. Most companies that supplied PCs to workers maintained large computers for "mission critical" applications like accounting and engineering. The two technologies lived side-by-side for many years. In fact, in the beginning there was a thriving market for software and hardware that would allow PCs to be used as terminals to access central computers. It wasn't until PC servers and server software like that from Novell and networking from 3COM became commonplace that mainframes and minis began to fade.
So in practice, there was no big bang start to the post mainframe era. The evolution of the PC went through stages. It was an isolated local computer, a client-server solution and then finally a web-enabled communication product on its way to ubiquity. But the era did change.
So if history serves as a guide, the displacement of the PC won't come from a direct substitution but a more sinister and hard-to-predict subversion through new applications and a re-definition of what a PC is. The driving forces are not just volumes but new input methods, new user interfaces, new jobs to be done, new software and many innovative companies working within an ecosystem.
If there is one difference today it's that things are happening a lot faster. A transition that took a decade is happening in three years today, even though the entire market is orders of magnitude bigger.
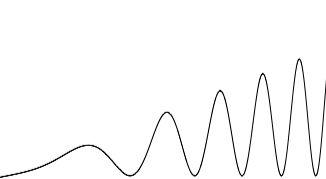
When I visualize the cycle time of technology change, I see it as the waveform to the left: as cycle time decreases (i.e. frequency increases), the opportunity (amplitude) also increases.
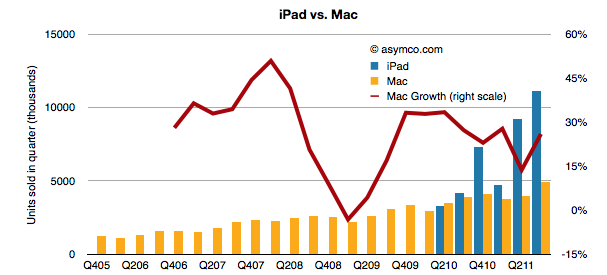
Last quarter the iPad had unit growth of 166% with revenue growth of 146%. The iPad is selling more than twice the (also rapidly growing) Mac. The two product lines are shown below:
A big reason the Mac is still growing is that it now consists of 74% portables and the MacBook Air and Pro products are still largely unmatched and have a near monopoly in their target price.
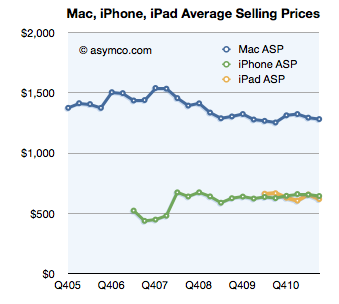
The Mac's average selling price has remained remarkably steady for three years.
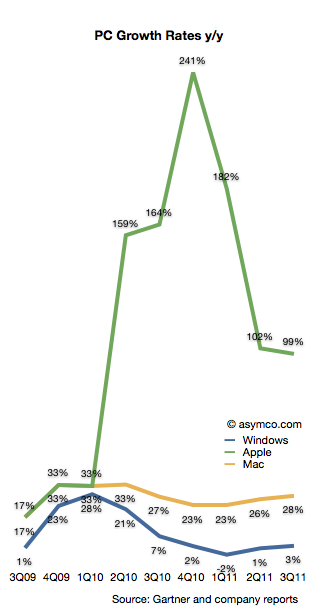
But more importantly the iPad and the Mac both outgrew the PC market. Taken as OS X vs. Windows, the growth rates were 27.7% vs. 2.5%. If iOS is included along OS X, Apple grew its "computer" shipments at a rate of 99%.
The following chart illustrates the growth rates for Windows, Mac and Apple as a combined OS X/iOS.
The Windows platform still ran on 82% of PCs sold in the quarter with iOS taking second with 10.5%, OS X third with 4.7% and Android at about 3%.
Even though Mac OS X grew faster than the overall PC market for 20+ quarters, its market share is still below 5%--lower than what the iPhone has been able to obtain in the far larger mobile phone market.
That share has grown from 3.2% in the same quarter of 2008 but it's still a very slowly changing landscape.
However, if we include the iPad, Apple begins to not only grow very rapidly, it moves up sharply in terms of ranking among PC vendors.
Last quarter's 16 million OS X and iOS tablets brought it into second place behind the 16.6 million PCs that HP sold. That was enough to give Apple 15% share vs. 15.7% for HP. Over the last three years Apple has gained nearly 12 points of percentage of share.
The other vendors mostly lost share but the most affected were the smaller OEMs. HP lost 2.6 points, Acer 3.9 and Dell 3.4. However "Other" lost 10.5 points. Lenovo is the only major vendor to gain share (+4.48 points).
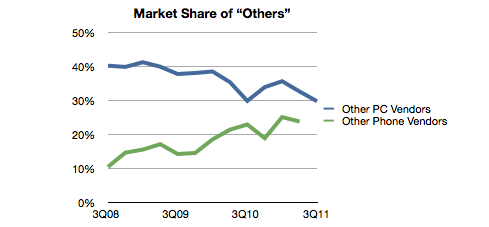
What's interesting about this pattern is that whereas in the phone business "others" is a rapidly growing group of companies, in PCs the smaller vendors seem to be suffering. They still make up about 30% of the market but that's down from about 40% three years ago.
In contrast, "Other" went from 15% to 24% of the phone market in the same time frame. Part of the explanation is that the entry of the iPad took the wind out of the "low end" netbooks and other cheap PCs. Consumers migrated low-end usage to a product re-built around those jobs.
In the mobile phone market, the disruption is in the opposite direction: communication is moving rapidly up-market from real-time voice to latent messaging and from storage consumption to broadband consumption. The companies being rewarded today in the phone business are those who are leading the charge to new markets.
In other words, on the PC, we are witnessing low-end disruption. On the mobile phone we are witnessing new market disruption. The irony is that the low end PC and the high-end mobile are very nearly the same thing but the industries, channels and incumbent business models are very different.
In his recent posts Horace took a look at Apple’s fixed assets and their development over the recent years. He also tested the hypotheses that Apple is making investments into machinery & equipment on which iOS devices are produced by overlaying iOS volumes with preceding changes in property, plant and equipment (PP&E).
The question that has arisen is: Are Apple’s investments in PP&E extraordinary?
To answer, I have compiled the capital expenditures (CapEx) for our previously established peer group [1].
But first we need to clarify what CapEx include and not include. CapEx includes investment into property, plants, equipment, office furniture, larger IT hardware and in some cases patents; CapEx do not include investment into long-term marketable securities or other long-term financial instruments, acquisitions or capitalized R&D. Furthermore, CapEx are gross values and are not net of any sold equipment [2]. CapEx are largely depending on a company’s business model and strategy. For example if you are a manufacturer you need equipment to operate, if you are a software company or a retailer, your business will not be capital intensive.
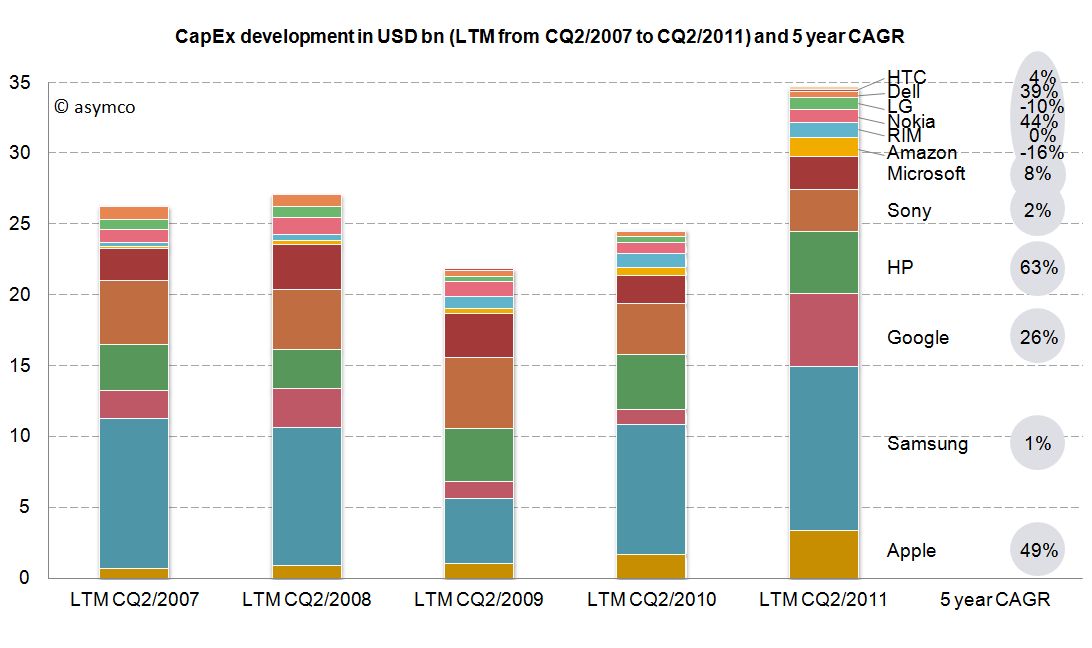
As the second calendar quarter of 2011 is the latest quarter for which all companies have reported figures, we will take a look at last twelve months’ (LTM) figures from Q2/2011 backwards. The following stacked bar chart shows the combined CapEx of our peer group:
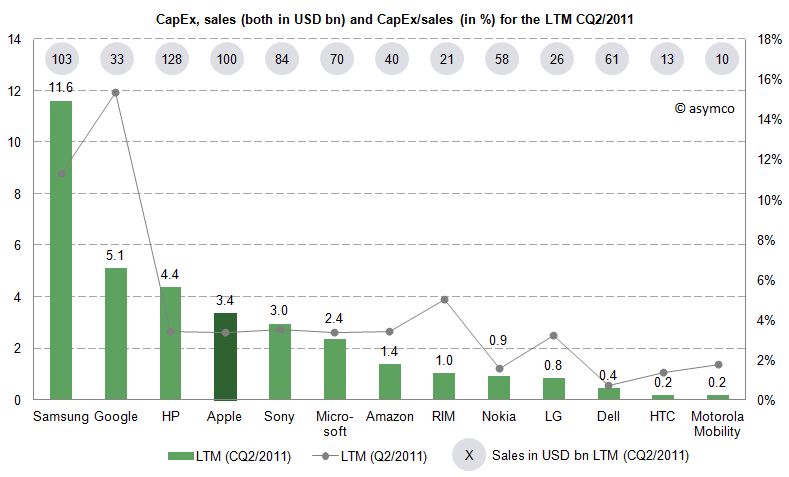
The combined capital expenditures of our peer group for the LTM CQ2/2011 have outpaced even pre-crisis levels of investments and, combined, account for $34.7 billion. Samsung, a diversified manufacturer of IT hardware and other equipment, has invested more than $11.6bn with Google ($5.1bn), HP ($4.4bn) and Apple with $3.4bn following in line. While Google’s CapEx mostly account for its infrastructure of server farms and other IT hardware, HP’s CapEx mostly account for IT hardware it leases to its customers [3]. In absolute terms, Apple takes fourth place in CapEx spending for the last twelve months ending in CQ2.
Since the business model and sales magnitude varies largely in our peer group, we can also take a look at a common measure to compare CapEx intensity by dividing CapEx by sales achieved in the same period. For the last twelve months we can depict the following chart:
The average of the peer group accounts for 4.4% of CapEx over sales. Samsung’s and Google’s business model are clearly more capital intensive, while Apple’s CapEx ratio of 3.4% is below the peer group average but above some of its peers like Nokia, Dell, LG, HTC or Motorola Mobility. Interestingly, capital intensity of HP, Apple, Sony, Microsoft and Amazon is at a comparable level of around 3.4%.
As noted before, business models and strategies are significantly different among companies in our peer group. However, while Apple’s CapEx intensity is not extraordinary, Apple’s CapEx in absolute terms are among the largest in it this peer group and have grown constantly throughout a five year period.
Is this a good thing and why does it matter?
CapEx by itself does not tell us much. We still do not know in what companies specifically invest as financial regulations do not require detailed CapEx accounts. We know that even if a company is not growing assets they need to be maintained, upgraded and replaced – this spending is also called "Maintenance CapEx". Everything else can be called "Expansion CapEx" associated with new product launches, entry to new business area or geographies or expansion of (manufacturing) capacity.
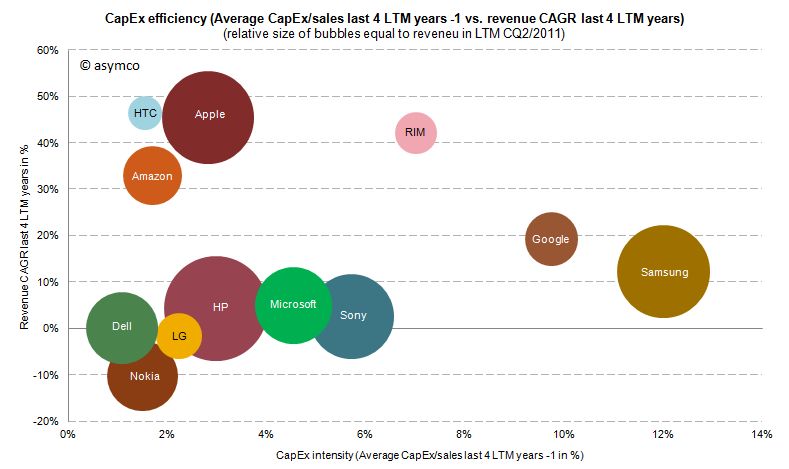
Therefore, Expansion CapEx is closely linked to expected organic sales growth in the future. So let’s go ahead and link CapEx ratio of the previous years with the sales growth of the following year. The following chart shows the cumulative average growth rate (CAGR) over the last four years versus the average of CapEx/sales ratio of the four last preceding years:
We can see that high CapEx efficiency has been achieved by Amazon, Apple and HTC with sales growth rates of 33-47%. RIM reached similar revenue growth but with higher CapEx intensity. Google and Samsung with high CapEx intensity have only reached modest growth rates. Dell, HP, Microsoft and Sony have not grown significantly but have close to average CapEx intensity.
We cannot state that CapEx in absolute terms have been extraordinary for Apple, but we can witness that with below average CapEx/sales ratio Apple outgrew in absolute terms Dell, LG, Microsoft, Nokia and Sony and has grown close to the revenue size of Samsung and HP in the last four years.
---
Notes:
Excluding Lenovo (not reported) and Acer (extra-ordinary low numbers reported, to be investigated), Motorola Mobility figures only available for the last six quarters
Minor differences may occur due to local Generally Accepted Accounting Principles (GAAP)
HP assumes ownership of these assets and rents them to the customers who in turn have a smaller balance sheet and can run IT hardware CapEx through the income statement as lease expenses
Balance Sheets are not typical targets of focus in software or services or "high tech" companies. Except for Cash, there are usually not much in terms of assets for analysts to contemplate. With outsourced manufacturing, even hardware companies don't maintain depreciable assets on their books.
Apple, as usual, is different. It turns out there is a lot there and there's a lot to learn from what's there. I've looked at the Cash and Long Term Securities in the past but in the next few posts I'll dive into fixed (non-current) assets. Specifically Apple's Property, Plant and Equipment.
Apple Inc. has selected North Carolina as the location for a new data center and will invest more than $1 billion in the project over nine years, Gov. Bev Perdue announced
When Apple committed to the North Carolina data center in mid-2009 the iPhone was two years old. Only 26 million iPhones had been sold to date (about as many as Apple now sells every quarter.) Clearly if the commitment was on such a scale there must have been a plan. A big plan.
We don't know for sure if NC was used last week or whether it was handling only part of the load, but let's assume it was. What I want to think about is how much iCloud would thus cost and hence what would be the cost for alternative providers of such a service. That analysis might let us determine if "cloud" forms a substantial barrier to entry for competitors.
Beside the public statement above (which may have been designed for political benefit) can we find any evidence of what Apple spent on data centers? That's where the PP&E line comes in.
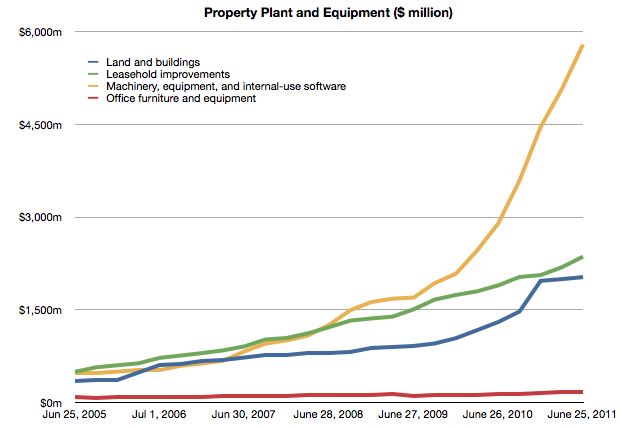
The following chart shows the Property, Plant and Equipment asset in Apple's Balance Sheet.
Each line represents a particular type of asset and its value at a particular point in time. I will now pay attention to the blue line, Land and Buildings. I'll look at the other lines separately.
Note that each line represent current value so it does not say directly what was happening in the quarter. However, if we look at the change q/q for a particular line we get how much new spending occurred in the quarter for that particular asset.
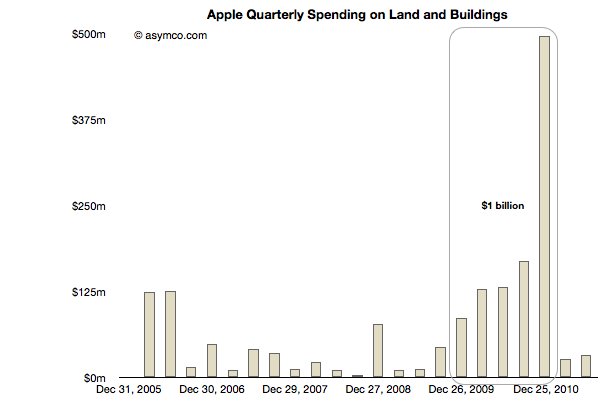
This change in Land and Building asset value is shown in the following chart:
Going back to 2005, there were minimal changes. Perhaps there is some significance in the $250 million spend in early 2006 or the nearly $78 million spent in Q4 2008, but there is a definite significance to the massive spending that occurred right after the NC commitment was made.[1] Some of that payment also included the old HP campus in Cupertino. "Local real estate experts said HP’s asking price may have been $300 million or more, but they also said the final amount may have been less."
There is also a clear cut-off on that spending at the end of 2010.
The total spending during this time adds up to nearly exactly $1 billion. If we subtract $250 million for the Cupertino expansion we still have $750 million that must have gone into NC.
Note that the original statement quoted above was $1 billion over nine years. We can see that Apple spent $0.75 billion in one year. On the building alone. This is why I consider this a down payment. It does not include any of the equipment in the plant. It does not include the cost of operation (incl. labor) or any development costs (R&D). In fact, it does not include any of the funds that would be part of the nine year commitment.
What this level of spending implies is that iCloud (and Siri and iTunes) are expensive. They may seem ephemeral and even trivial as services, but they require a staggering commitment few can make. Apple made that commitment and they made it early on, before the first quarter billion users were even on the horizon.
If platforms are moving from local to distributed and if value moves from selling things to "getting to know you" and if that knowledge requires infrastructure control then the number of companies that can participate in the market shrinks dramatically. Not only in terms of who has the capabilities, but who could even afford to acquire them.
The invoices Apple pays are shown above.
----
Notes:
Apple's retail stores are not included in these figures as Apple leases them. The cost of the stores will be discussed in a separate post.