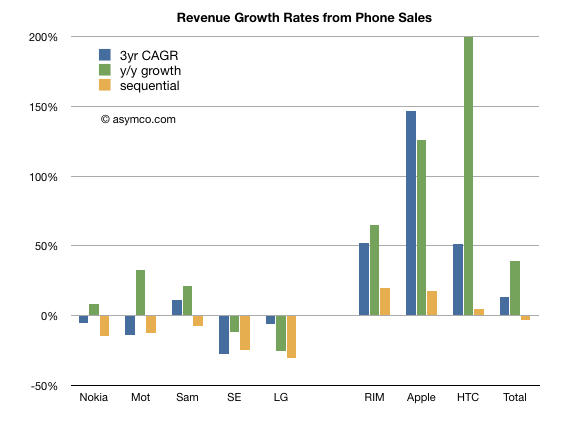
Revenues for the eight phone vendors I track increased overall during the last three years. The compounded annual growth was about 13%. However the growth was not evenly distributed. The following chart shows revenue growth across three time frames: Three year compounded, year/year quarterly and sequential quarterly.
I separated the incumbent companies from the "entrant" smartphone vendors for contrast.
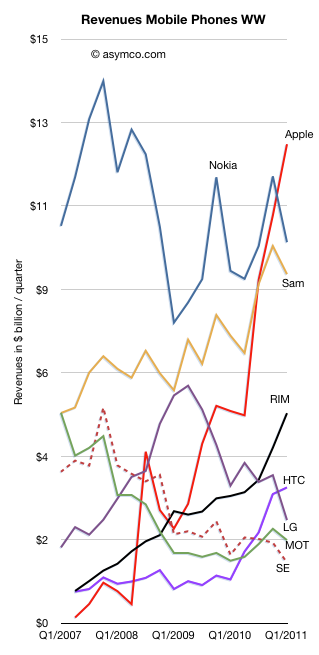
Looking at individual performance, the following chart shows how each vendor performed over time:
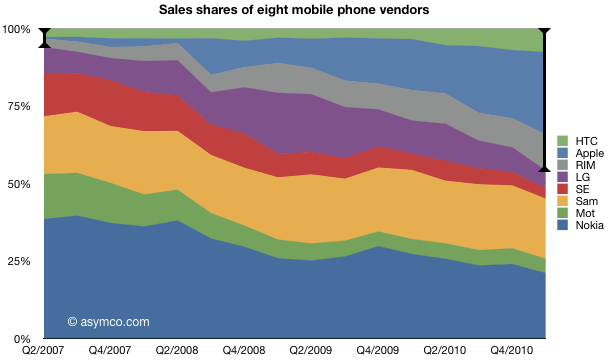
The share of revenues is shown in the following chart (I highlighted the smartphone cohort):
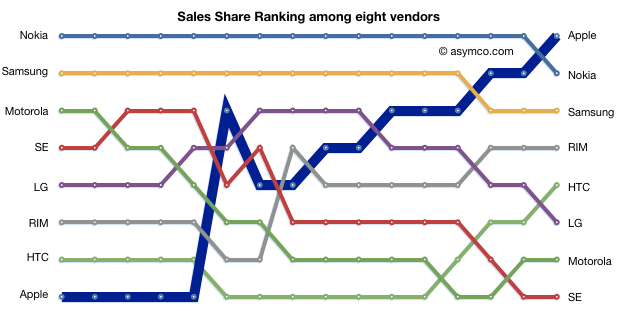
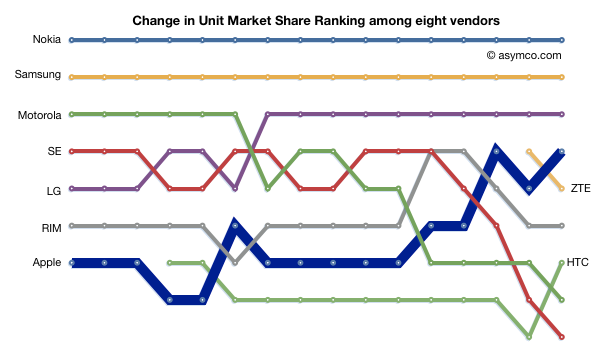
The ascent of the entrants is shown in the league table below:
The headline that Apple became the biggest phone vendor in the world by revenue has already flashed across the feeds of the world. It's another straw on the camel's back. But I'd like to take a moment to note that this is not just an Apple story.
If you look at the league table, RIM, HTC and Apple were at the bottom three years ago and now they are either in the top or the middle. RIM in particular deserves credit for reaching the fourth spot and staying there. HTC also has shown a late surge to fifth passing LG, Motorola and Sony Ericsson in the process.
Combined, these vendors went from taking in about one dollar in 20 (6%) in Q2 2007 to nearly half the money (46%) in Q1 2011. As the market also grew, the total amount went up an order of magnitude. From $1.8 billion to $21 billion in three years. Not bad for niche players.
It's time to review the mobile phone market at the end of the first quarter of 2011. Before I begin, I'd like to remind that this analysis will span multiple posts and that many details will be published separately due to time and space constraints. Data about platforms, sales, profitability and pricing will be posted separately.
All data sets and chart data will be available for interaction and download through Asymco Interactive when complete. You can purchase a license to Asymco Interactive anytime and you will have access to any new data sets for next 90 days so don't hesitate to pre-order the report.
The overall phone market grew at a compound rate of 9% over three years. The pattern of entrants focused on smartphones and mobile computing growing faster than the incumbents continues. The compound three year unit growth for the tracked vendors in descending order is:
Apple 122%
HTC 55%
RIM 50%
Samsung 15%
Other 14%
LG 0%
Nokia -2%
Sony Ericsson -29%
Motorola -30%
To give an idea of the split between smart and non smart, Nokia's smart business grew at 18% compounded while its non-smart units contracted at -6% rate.
In terms of y/y growth the market grew at 26% and the vendor ranking is:
HTC 194%
Apple 113%
Other 103%
ZTE 75%
RIM 42%
Motorola 13%
Samsung 9%
Nokia 1% (smart: 13%, non-smart -2.3%)
LG -10%
Sony Ericsson -23%
Sequentially, the growth rankings are:
Other 28%
Apple 15%
HTC 7%
RIM 5%
ZTE -10%
Nokia -12%
Samsung -13%
Motorola -18%
LG -20%
Sony Ericsson -28%
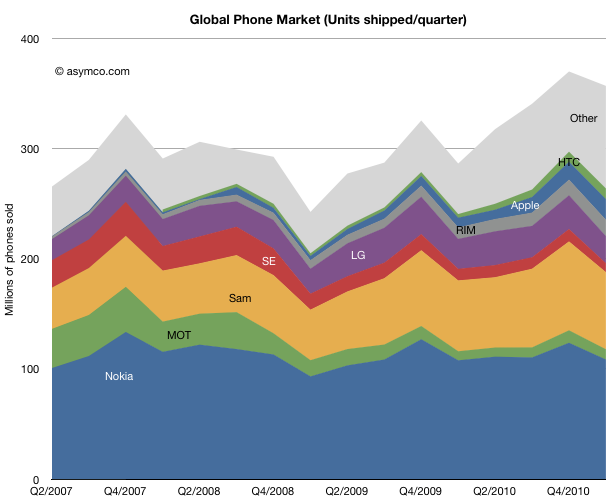
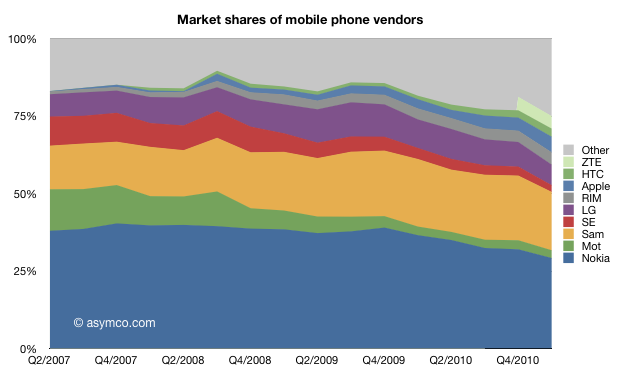
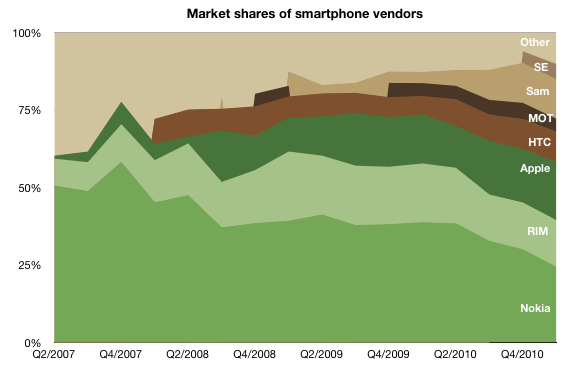
In terms of market share, the field is becoming more crowded.
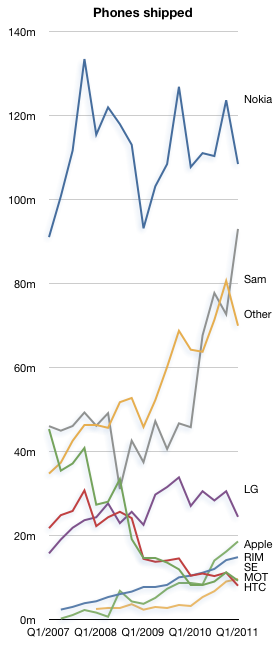
The ranking of units shows a continuing relegation of Sony Ericsson and the increase of HTC to 7th spot. Apple reclaimed its fourth spot from ZTE.
As the number of vendors increases and the share of incumbents decreases it becomes harder to identify who is a "top tier" vendor or, in fact, what the tiers are.
It's pretty clear that on a unit basis there are nine vendors selling significant volumes. The other important observation is that vendors like ZTE are graduating from "other" while "other" is still growing, now at 25% of the market.
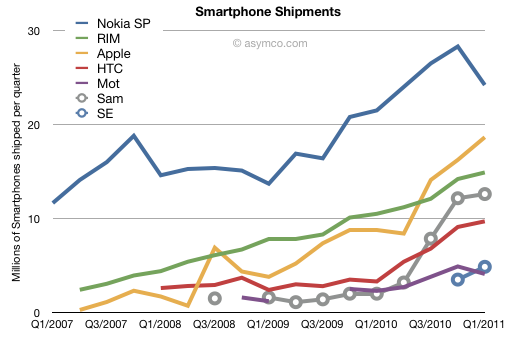
I've often said that the smartphone rising tide has lifted many boats. If you were selling smartphones during the last three years, your business was growing, no matter what phones you made.
In fact, measuring success and failure was a matter of deciding what growth rate was "not good enough". Growing at 30% was nearly enough to shame some vendors into re-evaluating their strategies.
But that sort of tidal growth can't last. At some point ships with holes begin to sink no matter what the tide brings.
When we look at the data from the last quarter, we should be asking again whether some ships have developed some leaks.
The challenge is in eliminating seasonal effects. Q1 is usually a sequential drop for many markets. There is an unsettling drop in Nokia and Motorola and a weakening in Samsung and HTC. On a year/year basis the growth rates appear more robust for HTC and Samsung (194% and 530% respectively), but one should note the low bases they started from. Apple maintained triple digit growth (113%) while RIM sustained a respectable 42%. Motorola grew at 78% but looks weak sequentially. Sony Ericsson began to offer smartphone units and they are showing a run rate similar to Motorola but can't gauge their growth rate yet.
Apple and RIM seem largely unaffected by seasonality but Apple is growing twice as fast.
But the biggest surprise is the drop in Nokia's volumes. There was a similar drop in Q1 2008 but the phone market was plunging into recession then and the company's smartphones moved in sync to the overall market (one with limited competition). This quarter's drop happened when the overall market is growing. The alarming thing is that Nokia's smartphone performance in Europe seems to be a big part of the problem.
Data from IDC shows that Nokia's volumes plunged by 15% y/y in Europe while the smartphone market there grew by 76%. Apple ended up with the largest share in a region that had been Nokia's with 70%+ share. That share is now under 20%. Nokia's overall growth was a mere 13% y/y while the market grew 73%. The result is the following picture of Smartphone shares:
But perhaps the drop should not be a big surprise. Was it due to the public execution of Symbian? Did Europeans stay away from Nokia in droves due to an aging portfolio or because they felt betrayed. Perhaps we'll never know but there is another indicator to mull over. Nokia's brand fell to 81st spot in a recent survey. It used to rank in the top 10.
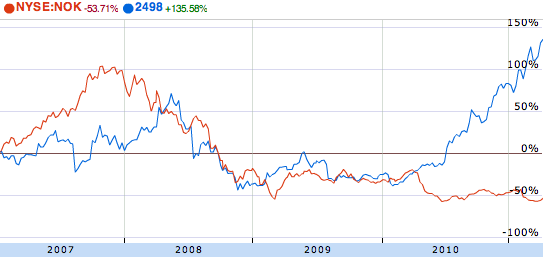
HTC's market cap has just overtaken Nokia's. While market capitalization is a fickle thing, shifting with sentiment, this is still a remarkable feat. Nokia's market capitalization has almost halved in the space of a year while HTC has more than tripled from $10 billion to over $33 billion.
If you roll back to 2007 and the start of the modern era of smartphones, you can see how the two companies stocks traded places:
(source: Google finance)
The recession was hard on everybody but HTC soared during 2010 while Nokia never recovered. Markets reward unforeseen growth and typically that means above-market growth.
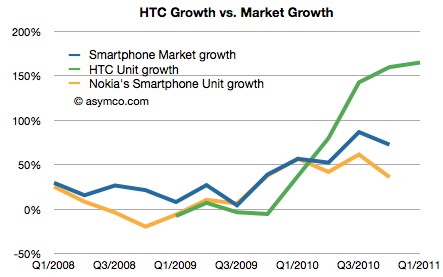
That's reflected in the following chart (admittedly units and not profits, but pricing and margins for both have remained relatively steady.)
As Nokia's growth lagged the market the stock was punished. As HTC's growth exceeded the market's growth, the stock was rewarded.
But there are a few more observations to make:
HTC's smartphone business was under-performing the market for most of 2009. In fact, it was even in negative growth for three quarters.
The surge in growth coincided with HTC adding Android to its portfolio and given no other changes, seems to be causal.
Although not within the time range of the charts above, HTC had another period of rapid growth in the mid 2000s.
A year ago HTC was making excuses and apologizing. Today they are more valuable than the largest phone vendors. All thanks to Android.
But why no thanks to Microsoft?
HTC was the primary Windows Mobile vendor a few years ago. They claimed at one point to have shipped over 80% of all Windows Mobile devices. They were also the leader in the Pocket PC franchise as they were the ODM behind the iPaq brand from HP/Compaq. HTC would not exist today were it not for Microsoft.
The relationship is such that HTC is paying Microsoft for protection from (potential) Android IP infringements. HTC has also licensed Windows Phone though the relationship between Nokia and Microsoft must give them pause.
But that's the whole problem. Those who live by the sword shall die by it. HTC was a Microsoft dependent and now they're a Google dependent. As the basis of innovation shifted, HTC was agile enough to make the transition. Perhaps they can execute a portfolio switch yet again as their upstream suppliers change whims or business models.
But then again, as we saw with Windows Phone, perhaps not.
If HTC wants to control its destiny it needs to control its suppliers. Now that its power and brand have grown, it needs software because in their market software is self-determination.
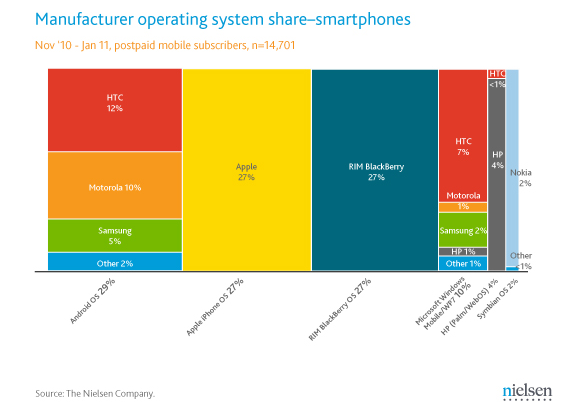
This is a great chart from Nielsen showing the split in manufacturer share by OS in US installed base. What I consider significant is how the modular software platforms Windows Mobile and Android worked out for the licensees.
Whereas in the case of Windows Mobile HTC took a significant, nearly dominant share, the Android ecosystem was more balanced between HTC and Motorola. However, HP and Motorola left the Microsoft camps, Motorola going exclusively for Android and HP buying Palm. That leaves Microsoft with HTC, Samsung and Other (mainly LG I presume).
The question of how Windows Phone will shape up vs. Windows Mobile and Android remains. Motorola has signaled they are not interested in WP7 for the time being and so it's likely that they will stick with Android. Samsung is always hedging its bets so it will probably balance its portfolio. One could conceive of Nokia stepping into the US with significant WP volumes, but there are many hurdles on the way.
One can see the challenge individual modular vendors have to edge the overall volumes of the integrated vendors. As Nielsen points out:
But an analysis by manufacturer shows RIM and Apple to be the winners compared to other device makers since they are the only ones creating and selling smartphones with their respective operating systems
Not only are the volumes higher, but so are the margins and hence profit share.
The smartphone market grew 73% in Q4. Here are the growth rates for vendors which regularly report smartphone sales:
HTC: 142%
Motorola: 96%
Apple: 86%
RIM: 40.5% (period ending November)
Nokia: 36%
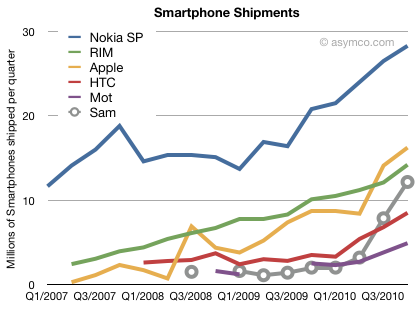
Samsung is not consistent in reporting smartphones and we don't have year-ago data but the following chart can be used to get a hint.
Samsung had a very good year with 25.2 million smartphones sold. This is compared to 2009 when they probably sold less than 5 million. Their growth has meant they overtook both Motorola and HTC and are likely to overtake RIM this year.
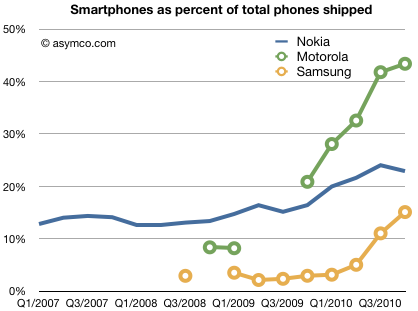
Samsung owes its success mainly to adopting Android. As can be seen in the next chart, Samsung moved rapidly to shift its portfolio from non-smart to smart. This is quite a feat considering the starting point well below that of Nokia.
From 2% of total phones to 15% smartphone volumes in 18 months is astonishing.
Extrapolating for the missing data leads to an estimate of smartphone growth for Samsung of over 500%.
[Samsung] said it has sold around 4 million Galaxy S smartphones in North America, 2.5 million in Europe, and around 2 million in South Korea in the past seven months.
Samsung's US Android sales are very similarly allocated to Apple's iPhone sales: 40%. But at 20%, South Korea represents a very large portion of their sales (2 million phones sold in 7 months into a country of 48 million). This is understandable given Samsung's distribution power in its home country. However it also implies that Samsung's [high end] Android sales in Asia excluding South Korea are tiny. Only 1.5 million were allocated to outside Europe, US and South Korea--a market that includes the whole of Asia, Africa, Middle East and Latin America.
If we believe that Android is activated at the rate of 300k units per day, then Samsung represents around 40k of that. (10 million over seven months, linear extrapolation.) So where are those remaining 260k units/day going? Gartner calculated that in Q3 Samsung was the leading Android brand (about one third of all units). The Samsung figures make these share numbers very obsolete because 40k/300k is only 13.3%.
It's hard to pin down the market because the share shifts are dramatic and the market's growth is not linear. Nevertheless, intuition and guesswork leads to me believe that Android activations are to a large degree (perhaps two thirds) in Asia. This in turn implies that Samsung is not a major participant in that market.
Since neither LG (who does not have a strong Android portfolio) nor Sony Ericsson or Motorola which have low volumes, (nor obviously Nokia, RIM or Apple) are supplying the Asian Android market, the question is who is? Only HTC remains a contender but it's not big enough to account for the difference and they too are focused on the established Western markets (except for a modest presence in China).
We are left again with circumstantial evidence that "Other" lower tier vendors are carrying the Android torch in Asia. Pdadb.net shows 277 Android models available. Brands like ZTE, Huawei, Acer, Notion Ink, Linx, TMN, FirsOne, Ziss, Kogan, Highscreen, Saygus, Haier and Forsa are selling Android devices (though not all in Asia).
Not that there's anything wrong with that
If there is a worry it is perhaps that Samsung might find it hard to maintain the top spot in supplying Android once the unbranded vendors make it through the distribution obstacle course (as HTC did when it reached 80% of the Windows Mobile share.)
If one is to argue that Android empowers the desperate incumbents, then one has to also agree that it also empowers the more nimble entrants--inevitably leading to even more desperation.
[Updated: thanks to reader @UVStaska who noticed on glaring error in the analysis. I had failed to see the "S" in the original quote and been assuming the 10 million figure represented all Samsung Android sales. The Galaxy brand is the Android brand but the "S" model is only one product within the line-up. Samsung Android sales are likely much higher than the 1.5 million I assumed.
Back to the drawing board with the question of Samsung's strength in Asia. One does still wonder how well they are doing relative to entrants.]
One of the most popular themes running through the mobile phone industry this year has been the unprecedented growth in Android adoption. I've argued that the adoption was initiated on the supply side by vendors and operators, but demand has certainly manifested itself.
Android is almost viral in the way it spreads. With no constraints on intellectual property, pricing, contracts, modification or terms of distribution, the incentives to push product out are phenomenal. It even works, mostly.
One hypothesis of the consequences of this viral adoption is that there will be a "commoditization" of smartphones with rapid price erosion to follow. This in turn might even lead to lower margins for Apple and RIM and most major vendors, including those selling Android itself.
In order to test this hypothesis, we need to look at what has been happening to prices. If prices have started tipping down at more than their usual rate then maybe commoditization is happening.
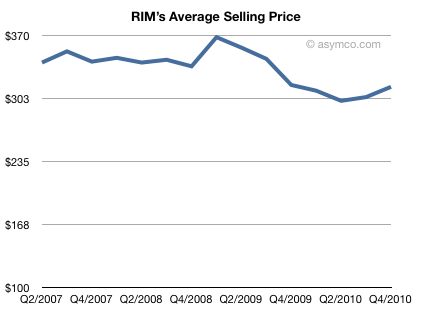
We can begin this test with the industry's canary in the coal mine: RIM. RIM has been struggling for growth in the very market where Android has been growing the fastest. Is RIM's pricing under pressure?
Interestingly, no. Their ASP (average selling price) decline, from an average of $350 to $310 in late 2009, came before the Android avalanche. During this year, the ASP has held steady, even rising in the last two quarters to $315 while Android activations reached 300k/day.
So I don't see a big problem with RIM, yet.
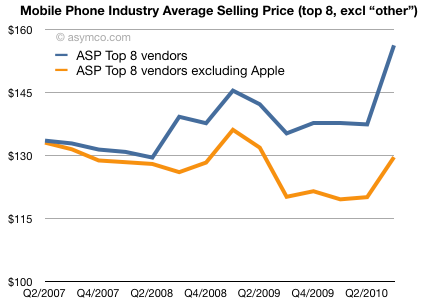
What about the industry as a whole? Can we see patterns that suggest imminent commoditization? Using the top 8 vendors (Nokia, Motorola, Samsung, Sony Ericsson, LG, RIM, Apple and HTC) and using volume-weighted ASP (total device sales divided by total units sold) we have the following chart:
Since the second half of 2007 the "industry ASP" (blue line) has actually increased. This is even though there was a huge recession in the middle of the time period.
This should be only slightly surprising. If you suspected that the iPhone may have a lot to do with that, you would be right. If you remove Apple from the mix, the second line (in orange) shows that the top vendors (ex-Apple) had some, but quite quite mild erosion (from an ASP of $133 to $129)[1].
This is far milder than what's been happening in the PC sector where prices are dropping catastrophically (According to NPD the average selling price of all Windows portable PCs has fallen from $659 in Oct. 2008 to $519 in Oct. 2009).
So Apple was a big contributor to the industry increasing its pricing power.[2] but even without Apple the industry has been holding on.
But is this just a lull?
Is Android going to stop the growth?
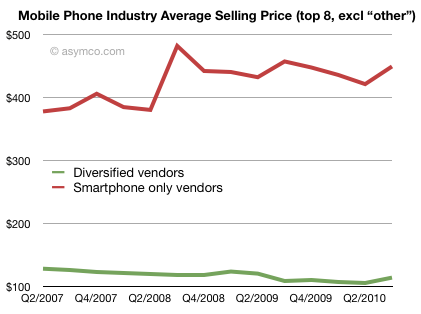
We can look at the pricing data one more way: If we separate the eight companies into two cohorts, the "diversified" vendors who sell both smartphones and regular phones vs. the "pure play" smartphone-only vendors, we get the following price history.
What is happening is that the diversified (Nokia, Samsung, LG, Sony Ericsson, Motorola) saw modest price declines (from $128 to $114) while the pure-players saw price appreciation (from $378 to $449). This is with the early impact of Android priced in. Unfortunately I don't have a chart showing non-smartphone prices in isolation, but I would be willing to bet it would be a significant negative slope.
In these two lines Android is not an independent variable. Android was adapted by some of the diversified vendors (all but Nokia), but in different ways. The thing is that Motorola and Sony Ericsson had great increases in ASP with Android. Among the pure-play vendors only HTC adopted Android and its performance is undistinguished vs. RIM which didn't.
So what, if anything, has Android done to pricing?
I argue that there is no evidence in the pricing data of a coming commoditization of smartphones. Android vendors were able to use the platform to move to higher pricing and the more they switched their portfolio to Android the more they got a better average price. At the same time those vendors who built smartphones without Android also saw strong price supports.
The only correlation with pricing power is whether you build smartphones or dumb phones. The more smartphones you build, the more price you can charge. This is regardless of platform.
The reason for this is that the smartphone market is growing so rapidly (90% y/y). There is limited direct competition between smartphones and a lot of competition between non-smartphones and smartphones--a battle smartphones are winning handily, irrespective of price. Smartphones seem to be what everyone wants.
So the real question that should be asked is:
Why do vendors bother making any dumb phones at all?
If you look at the third chart above you can see how attractive it must be for the diversified vendors to abandon the non-smart market to ZTE, Huawei et. al. Perhaps Nokia can still make a small profit there but to do so you need to run faster and faster toward extraordinarily low costs and prices. A point where phones cost less than everyday consumables. What keeps Samsung and LG in that game? Motorola and Sony Ericsson left once they hit profit warnings. Is that what it takes to drop what seems to be a loser business? I think not.
My bet is that by the end of 2012, it will be hard to find any branded phones which won't run a smartphone OS. Demand and supply of smartphones will race each other to overwhelm portfolio logic at the largest companies. The zero (visible) cost of Android will snowball this effect. What's even more provocative is that I believe the "others" will follow and abandon voice-oriented phones for smartphones almost immediately after the larger group.
I've long argued that the phone market should be studied as a whole because the competition is not between platforms but between smart and non-smart. Pricing is a leading indicator of what drives decision making inside vendors and it leads margin, and thence portfolio discussion. Android is expanding the market without crushing pricing. The margin expansion is what attracts more vendors and creates more demand. It's a virtuous cycle.
In a way, this is all good news--even for Apple. A world full of smartphone users is a better addressable market for iPhones than one filled with voice products. iPhone's traction was always in markets which had been seeded by some smartphones: the US with RIM and Europe with Symbian. Such a smartphone-soaked world will have better mobile broadband infrastructure, users with more demanding tastes and awareness of the value that a smart device can bring.
---
[1] The effect of "other" vendors not among the 8 listed is a big unknown. It's been estimated that they now make up as much as 30% of total volumes and that they are beginning to ship significant volumes with Android. Without visibility into that part of the market, we should be cautious. However, the eight vendors sampled here are still a significant cohort and the conclusions still appear reliable.
[2] This industry had, until 2007 suffered from chronic price erosion. Each sustaining innovation drove a mild burst of pricing power but it never seemed to last. From color screens to bluetooth, to 2.5G to 3G to MMS, to cameras to music playback, each hardware advance was not enough to keep the erosion away. The tipping point seems to be the iPhone and the shift to software as the component that drives price power.
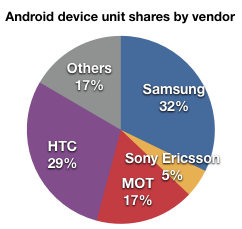
Gartner released sell-through data for the handset market. In the release appears an estimate of total Android 3Q Smartphone sales (20.5 million). Combining this with what some of the vendors have reported in terms of units sold, we can estimate the share of Android by vendors.
Note that this is a rough estimate. We don't have data on Sony Ericsson's smartphone units sold and we don't know the mix of HTC's Windows Mobile vs. Android. I'm also assuming LG as part of Others. The data from Gartner is claimed to be sell-through whereas vendors report sell-in so there is more roughness about each vendor.
Regardless of these potential sources of error, it's a very safe bet that Samsung and HTC are the largest Android vendors by a fairly large margin.
It's perhaps noteworthy that both are also committed Windows Phone vendors. According to pdadb.net here is the count of Windows Phone SKUs by vendor:
HTC 12
LG 5
Samsung 2
Dell 2
Toshiba 1
Motorola is keeping its Windows Phone options open, leaving "Others" as the only likely exclusive Android vendors.
Peter Chou, chief executive of HTC, had previously said he saw “little value” in HTC running its own application store. But he has also said that it was no longer enough for HTC to simply customise the standard Android user interface with its own “skin”: “It is not enough to be skin-deep. We need to go bone-deep.”
HTC was the world's biggest Windows Mobile vendor, at one time claiming to have sold over 80% of all WinMo phones ever made.
I always considered them to be the natural leaders in the Android licensing cohort. First, because they are the most agile and second because they had the operator relationships that allowed white-label operator phones.
HTC aspired to differentiate itself by "skinning" Windows Mobile and have carried their Sense UI over to Android offering a brand image distinct from competitors. However, HTC's branded strategy may have upset their operator partnerships (no evidence of this, just hypothesis). In the event, HTC, though prosperous, is not the largest single Android vendor.
Now the comment above from Peter Chou indicates that HTC is going to integrate the experience further. Building its own APIs, store and perhaps more. Not satisfied with "re-skinning" perhaps it will "re-bone" as well.
Going "bone-deep" sounds a lot more integrated and inter-dependent than modular to me.
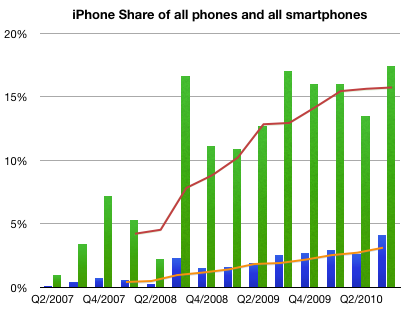
There is some confusion with the latest Canalys teaser press release. The implication is that Apple has lost smartphone platform share due to the Android surge.
Using the published data, it's easy to see that Apple has continued to increase share in both smartphones and handsets as a whole.
I used green bars to represent quarterly share of smartphones and blue bars to represent quarterly share of all phones.
I used orange line to show trailing four quarters (TTM) share in regular phones and red for smartphones.
Here are the Q2 to Q3 changes in share for the vendors whose data is published:
Nokia 38.4% to 32.7%
Motorola 4.32% to 4.7%
Samsung 5.11% to 9.71%
RIM 18% to 15%
Apple 13.5% to 17.4%
HTC 8.65% to 8.41%
Other 12% to 12%
Sequentially, Nokia lost 5.6% of share, Samsung gained 4.6%, RIM lost 3% and Apple gained 4%, Motorola, HTC and Other remained largely unchanged.