Recording and transcript of the June 9, 2026 Asymco One Office Hours, recorded the day after Apple's WWDC 2026 keynote. Horace Dediu shares his impressions of the event and takes questions from Asymco One subscribers.
Attach rates for iCloud reached about 42%, while Apple Music stood near 30%
The iPhone ecosystem is showing signs of increased customer loyalty and steady demand, while its high-margin services business remains a key support to profitability, according to UBS analysts.
The bank, which maintains a 'Neutral' rating on Apple with a 12-month price target of $280, cited findings from its Evidence Lab survey of roughly 4,000 iPhone users globally. The data suggests that iPhone “stickiness” continues to improve, even as replacement cycles remain relatively stable.
UBS said the average age of iPhones in use globally was largely unchanged year-over-year at about 33 months. Outside China, device age edged slightly higher to around 38 months, a trend the analysts said could push some upgrade demand into 2027.
At the same time, customer retention strengthened, with the global iPhone retention rate rising about 200 basis points to roughly 74%. Gains were particularly notable in the United States and China, where retention increased by 200 and 700 basis points, respectively. UBS belives that this indicates Apple is maintaining share despite a competitive smartphone market.
Purchase intent also improved across regions, with more surveyed users indicating their next smartphone would be an iPhone. The UK recorded the largest increase, while China also saw a meaningful rise despite what UBS described as a challenging competitive backdrop.
The report highlighted continued growth in Apple’s services ecosystem, particularly iCloud and Apple Music. Attach rates for iCloud reached about 42%, while Apple Music stood near 30%, trends UBS said should help sustain services gross margins above 75% through fiscal 2026 and 2027.
Higher-tier iCloud usage is also increasing, even as Apple raises base storage on newer devices. Among iPhone 17 users, 77% reported subscribing to mid- to high-tier iCloud storage plans, compared with roughly 60% across the broader installed base. UBS noted that additional services uptake carries incremental gross margins of at least 90%, helping offset potential pressure from rising memory costs.
On the hardware side, consumers are also opting for higher storage configurations. UBS wrote that 56% of iPhone 17 users purchased models with more than the base storage, up about 800 basis points year-over-year. This shift could support product margins, with incremental storage estimated to generate gross margins of around 75% on roughly one-fifth of sales.
Looking at the installed base, UBS estimates about 68% of iPhones in use are from the 14 through 17 series, while around 40% are Pro or Pro Max models. The analysts said this premium segment could be a target market for a potential foldable iPhone, though they expect the opportunity to be relatively limited given the anticipated price range of $2,000 to $2,500.
UBS estimates a foldable launch could result in as many as 8 million units in fiscal 2026, contributing roughly 6 million incremental iPhone shipments, or about a 2% uplift to its forecast of 251 million units.
Berkshire Hathaway, led by Warren Buffett, now owns about $1.4 billion of Apple. Occasionally we hear about various "celebrity investors" taking positions in the company or exiting those positions. The last one I remember was Carl Icahn. He seems to have exited Apple before Berkshire entered. There are some who will act because of these decisions. You should not be one of them.
Nor should the management of the firm act in response to investor decisions or concerns. Management is specifically distinct from ownership in the corporate construct precisely in order to bring professionalism to the role. The manager must set priorities as they see fit, irrespective of what the transient owner might prioritize. The separation of ownership and management is one of the greatest innovations in commerce.
There are many opinions on what priorities should be. Delivering a specific financial ratio, achieving a certain market position, changing the world for the better. These have all been cited as top priorities. I happen to believe that what matters most is the creation and preservation of customers. That is because I see customer creation as causal to the other desirable outcomes and it is therefore the more important priority.
And this is why, whenever possible, I try to deduce how well a company is performing on this metric. The greatest companies (by market capitalization) today are certainly examples of achievement in customer creation. Facebook, Microsoft and Google are members of the "billion user club" or companies that crossed a billion active users.
But do they really have a billion customers? Microsoft has over 1.2 billion users but many (most?) of those users are using computers that their employers provide on which Microsoft software was installed. They may not have made the choice to purchase the tools they are using. Microsoft certainly has millions of customers in the form of "accounts" purchasing its products and services, but It's not likely that there are a billion people who have directly chosen to buy a Microsoft product.
Facebook has over a billion daily users. Facebook users are certainly using the service of their own accord but they are not paying for the service. Quite the contrary, the actual customers of Facebook are companies buying an advertising service offered in the form of exposure to those billion users. The Facebook users are the product being sold, not the buyers. Thus Facebook's total number of paying customers is probably only in the tens or hundreds of thousands. ((Orr Sella @orrsella pointed out that Facebook has stated that they have 3 million businesses actively advertising on their networks.))
Same with Google. We don't know how many accounts Google send invoices to but the number is very likely not even in the 100 million range. Its billions of users are beneficiaries of services but they are not paying Google/Alphabet.
Amazon has many millions of customers, if not billions. Prime membership is above 50 million but not above 100 million. Amazon may some day have a billion customers but there are limits to how quickly that can happen. The growth potential is governed by logistics and that's as much an issue with atoms as it is with electrons.
Which brings us to Apple. Apple does not offer a figure on its specific user count, but we have some viable proxies:
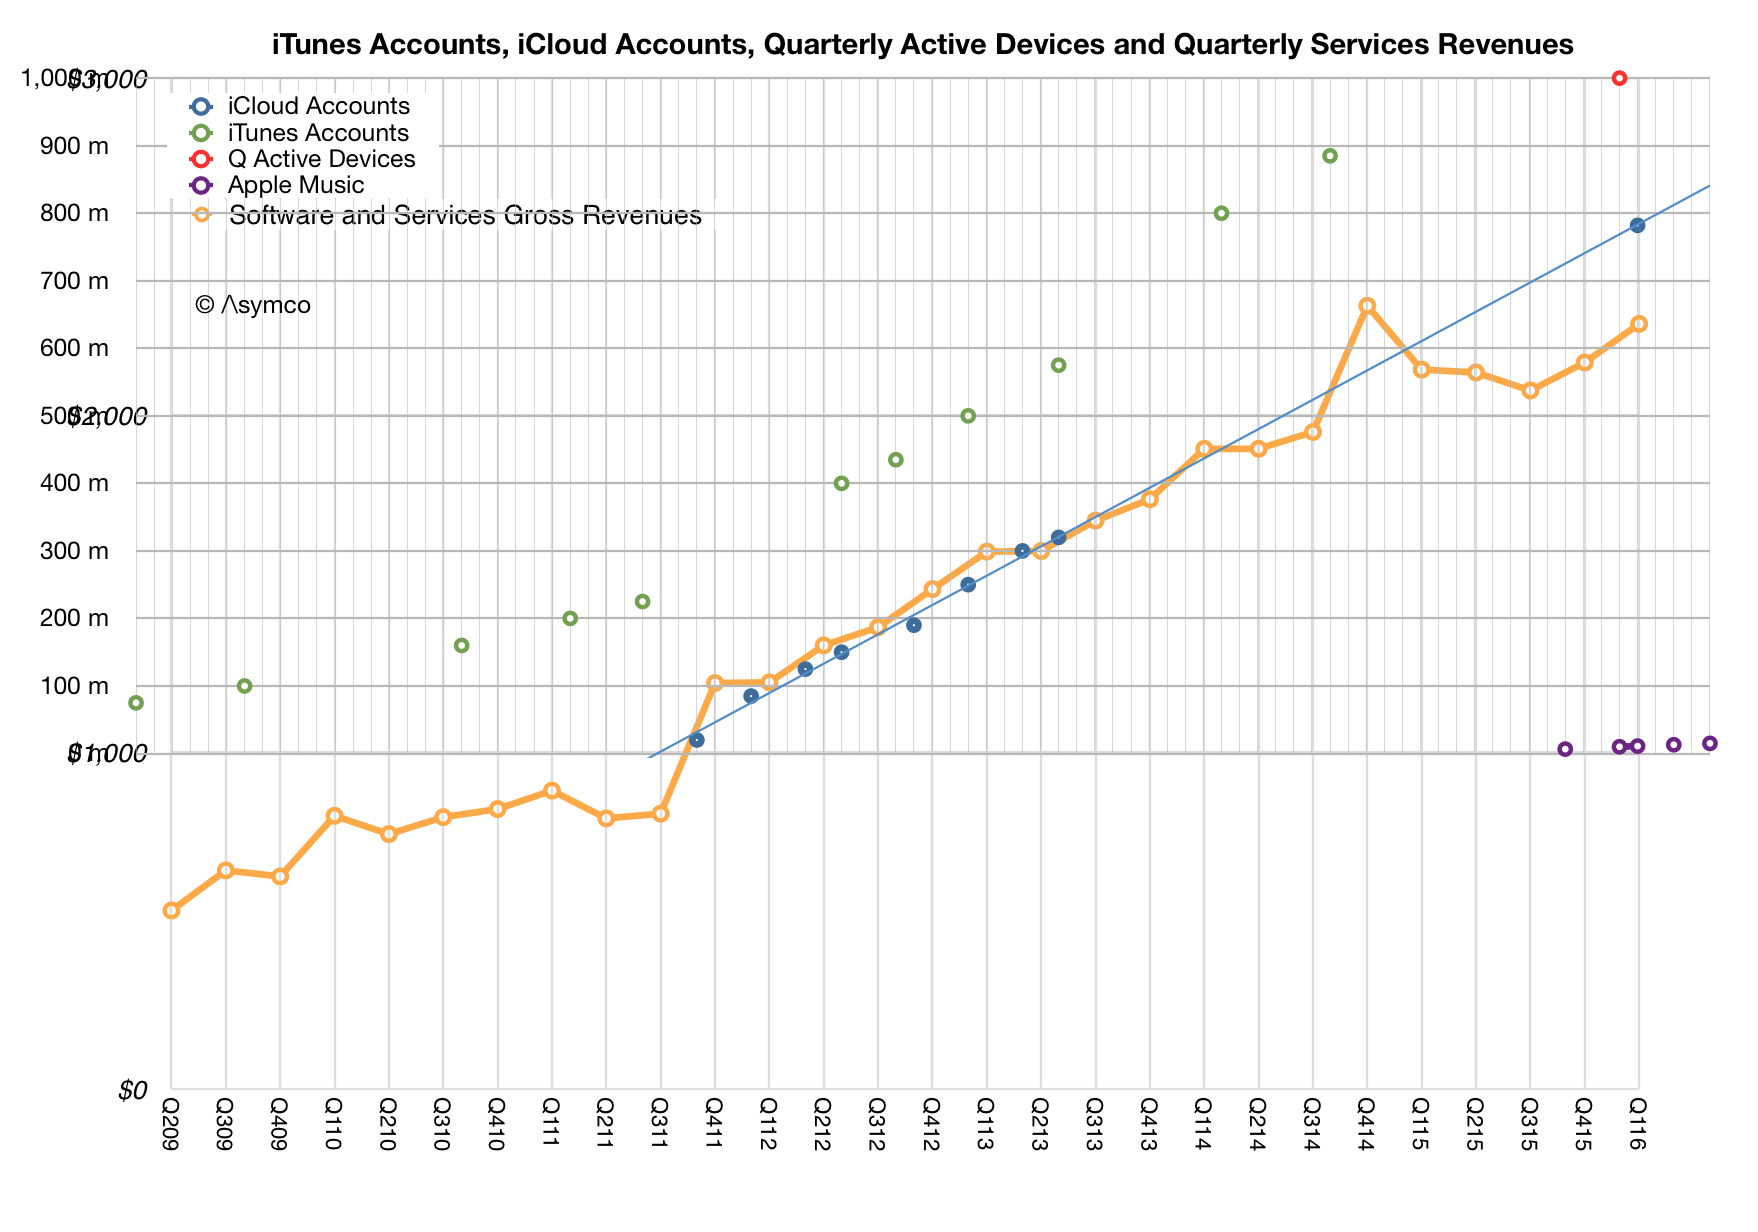
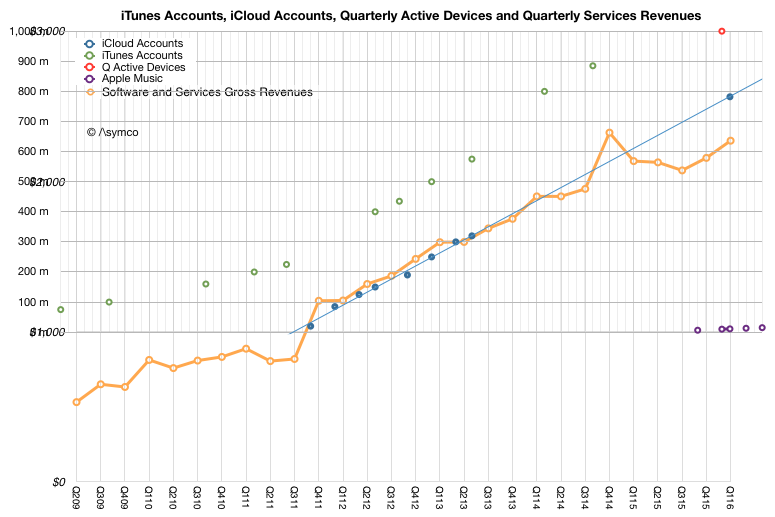
iCloud accounts reached 782 million in February 2016.
iTunes accounts reached 885 million in September 2014
Active devices reached one billion in January 2016. That number is likely above 1.1 billion now. (Includes all devices, hence Macs and Apple TVs).
These figures are also parts of patterns (shown below) which offer an indication of predictable growth.
In addition to the absolute figures and their growth there is also the question of loyalty (frequently cited by the company), switching from other platforms (also frequently cited) and revenues. The company publishes specific figures on service revenues for consumer attached devices showing a run rate of $41 billion/yr in services for their device base.
In combination, a picture emerges which shows that Apple has nearly a billion customers. I can't say how many with any precision but it's certainly above 500 million (on the basis of iCloud and iTunes accounts). It's below one billion because some users have more than one device.
Even though it has not happened yet, the trend is pretty clear. Apple will at some point in time have a billion paying customers.
What is more significant than the specific count is that these customers mostly chose to be customers individually. Some may have been given the products as gifts, but the vast majority bought the items for themselves. Apple benefitted from hundreds of million of individual purchase decisions.
Furthermore, having made the decision to purchase, chances are that they will do so again. Apple customers are a recurring revenue stream. In fact, it's fairly easy to calculate that being an Apple customer is equivalent to spending about $1/day on its products and services, indefinitely.
Apple is not there yet, but a billion dollars a day from a billion customers is not inconceivable. That would be quite an achievement.
When Spotify and Pandora were starting their streaming services many were quick to point out that Apple was about to be disrupted. The future, they said, was streaming because (young) people could not be bothered with ownership of music and the limitations of a personal collection. Who would want to pay for a few hundred songs when they could listen to millions for free?
This perception continued and became more vocal over the years. Seven years in fact. Spotify collected 20 million paying subscribers while Apple did nothing. Pandora grabbed 80 million active listeners and possibly 4 million paying subscribers while Apple did nothing. The boat had sailed and Apple was not only not on it but oblivious that there was a boat in the first place.
At first Apple launched a half-hearted streaming service and then a paid service finally showed up with Apple Music in mid 2015. Since then the company managed to add 15 million subscribers. A tiny number compared to the 900 million iTunes accounts it had reported a year earlier. Pathetic. The number of music subscriptions relative to iCloud accounts, iTunes accounts and active devices is shown the the graph below.
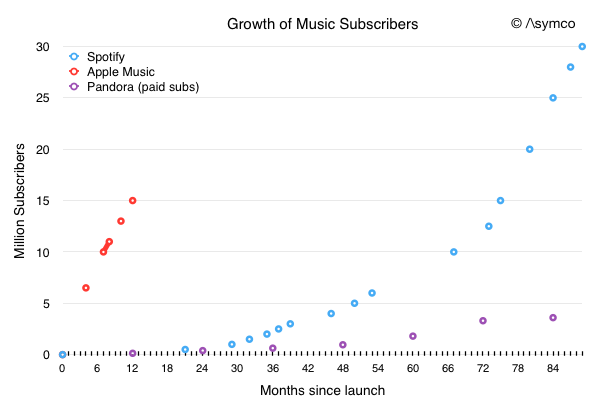
It may be paltry compared to the count of users Apple may have in total, but how does a 15 million user base in 1 year compare with the growth rate for the incumbents Spotify and Pandora?
The following graph shows the ramps for Spotify, Pandora and Apple Music since their moments of market entry. The accumulation of users by Apple looks to be the fastest yet.
This is, of course, due to a maturing use case. Apple did not have to educate people to the notion of music as a subscription. It could just announce it and users would discover it and just sign up, especially if they were already iCloud subscribers and had a credit card attached to their iTunes account.
But that's the whole point. Apple did not have to move first in music subscriptions. It did not even have to move second or third. When it did move it could just skim the market and add to its already healthy Services revenue (orange line in the first graph above.) Missing the boat in music in this case meant capturing all the value quickly and with minimal expense.
Fundamentally, Apple's entry into music subscriptions was a sustaining effort. Streaming sustained Apple rather than disrupting it. The difference may seem merely one of semantics, but it is also the difference between life and death for a challenger. Meaning matters.
This is a cautionary tale for those who would pronounce every new idea as "disruptive" to Apple or anyone else on the basis of novelty alone. The tests for disruptiveness are easy enough and it behooves the analyst to apply them before dropping the d-bomb.
Apples Services business is growing by leaps and bounds. How much of that can be attributed to iCloud? Horace and Anders consider how big the iCloud business is for Apple, as well as Apples recent stock price rise in this "rolling show" on the way to the airport.
Apple has declared that what used to be "Other Music Related Products and Services" ((Includes revenue from sales from the iTunes Store, App Store and iBookstore in addition to sales of iPod services and Apple-branded and third-party iPod accessories.)) plus "Software, Service and Other Sales" ((Includes revenue from sales of Apple-branded and third-party Mac software, and services.)) which was formerly known as "iTunes/Software/Services" ((Includes revenue from sales on the iTunes Store, the App Store, the Mac App Store, and the iBooks Store, and revenue from sales of AppleCare, licensing and other services)) is about to become "Services".
"We'll also have a category that we refer to as services and this will encompass everything we report under the heading of iTunes software and services today including content, apps, licensing and other services and beginning this month it will also include Apple Pay."
"Services" will therefore encompass a massive amount of revenue. The reported revenues for the fiscal 2014 were $18 billion. Including all billings, the turnover in sales is over $28 billion. For next year, assuming that Apple Pay, which is just getting started, is unlikely to contribute greatly to revenues, Services turnover will top over $35 billion. That figure would make Apple Services alone one of the top 90 companies in the Fortune 500.
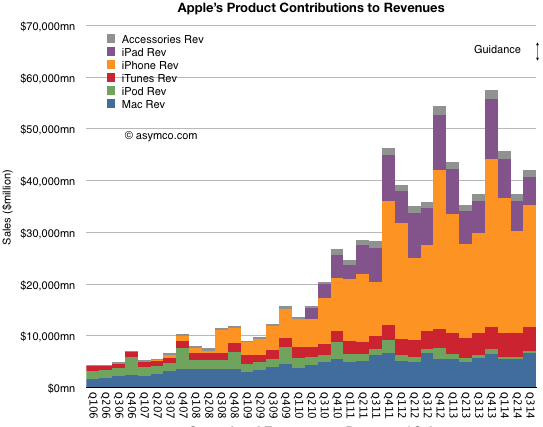
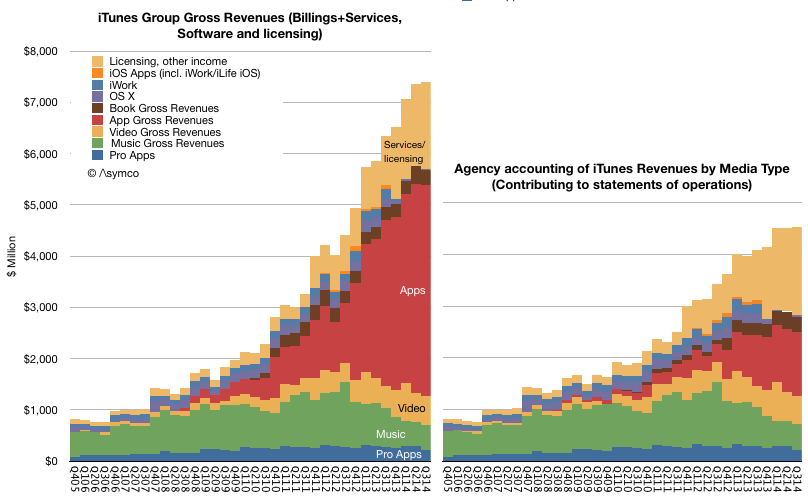
Regardless, as a component of overall sales, the group formerly known as iTunes/Software/Services (shown in red above) was a modest 7% of total sales in the last quarter. Using all available information regarding downloads, payouts and reported financials, an estimate can be obtained on how this 7% is itself divisible into nine sub-segments:
Pro Apps
Music
Video
Apps
Books
OS X
iWork
iOS Apps
Licensing and other income
These are shown above as either contributing to statement of operations (i.e. as reported, on right) or using billings (or the actual "cash register takings", on left). ((The primary distinction is in Apps billings where the 70% paid to developers is not shown as revenue.))
What would be ideal in understanding this Services segment would be to break the "Licensing and other income" into its component parts. Namely:
Licensing revenues including Google's payments for traffic acquisition (TAC)
AppleCare
iTunes Match
iTunes Radio
iAd
iCloud
(and soon, Apple Pay)
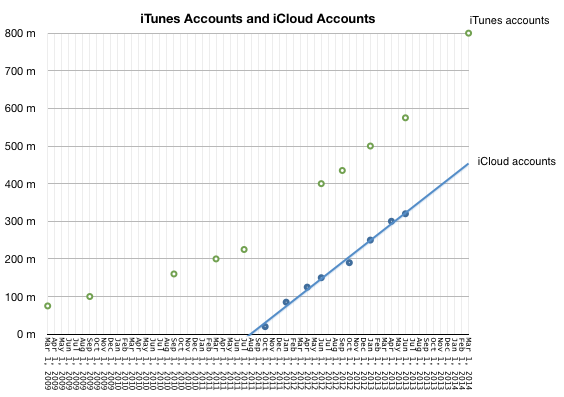
In particular, it would be very interesting to know exactly how much revenue could be coming from iCloud. We have not heard from Apple on iCloud user numbers since mid-2013 and this was the data at the time:
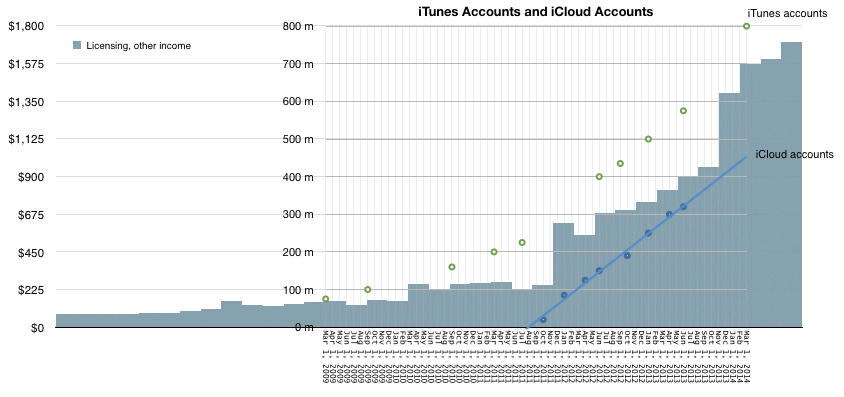
Couple that to "Licensing and Other Income" as deduced from Services accounting yields the following picture:
It would appear that iCloud accounts are growing in proportion to "Licensing and Other Income". Note that at the point that iCloud accounts were zero, revenues from Licensing were about $225 million/quarter and growing slowly. The real growth kicked in when iCloud accounts started ramping up. Since revenues from iCloud has to be in the "other income" and since no then it is, I believe, reasonable to assume that the iCloud user base growth is a principal driver of growth ((Of course, AppleCare could also be a driver but AppleCare should follow overall device sales patterns and this is not clearly evident in the Licensing/Other curve))
Also, bursts in the Licensing and other income line occurred after several iCloud-specific marketing events:
Mobile Me migration started in October 2011 and on September 30, 2013 the complimentary iCloud storage plans expired and were automatically adjusted to the free 5 GB plan (with an offer to upgrade to a paid plan). Correspondingly, Q1 2012 and Q1 2014 showed the largest increases in Licensing and Other Income.
This is a multiplication of many assumptions, but there is some intuitive logic. The only place iCloud can be found seems to be growing in proportion to iCloud users and plan marketing.
So how much does iCloud contribute to Apple's sales? My guess would be about $1 billion per quarter. That would be spread over 500 million iCloud accounts and therefore an average revenue per account of $2/user/quarter or $8/user/yr.
The lowest non-free iCloud pricing is about $12/yr (5GB plan is free). This would imply that two thirds of iCloud users are paying users (and one third are opting for the 5G plan).
I realize that this attach rate to a paid service is astronomical. Anything over 10% is unheard of. I would say the error in my estimates could be 20% but that still leaves a huge gap to what seems reasonable.
[Put another way, if the attach rate were only 10% then iCloud revenues would have to be in the $600 million range and thus only about 10% of what Licensing and Other income seems to be. This would force the question of what could be generating the remaining $5.6 billion/yr.]
Apple has sold 700 million iOS devices. Google claims one billion Android device activations. Microsoft has about 1.5 billion Windows users and Facebook about 1.19 billion. LinkedIn has 259 million users and Twitter has 232 million. Amazon has 215 active account holders and PayPal 137 million.
Markets place a value on these users implicitly when company shares are priced. For example, Twitter whose users are worth about $110 or FaceBook's $98 and LinkedIn at $93.
This consistency suggests a universally accepted value per social media user but what is the value of an ecosystem user? Apple, Google, Microsoft and even Amazon aspire to enable ecosystems which should be seen are more valuable than mere communities. Ecosystems enable a higher level of economic activity because they are unbounded by the medium itself. Any number of media can be created. Or so the theory goes.
If we could determine a value for an ecosystem user we could test it against the going value of a social media user. Fortunately we have enough data to do so.
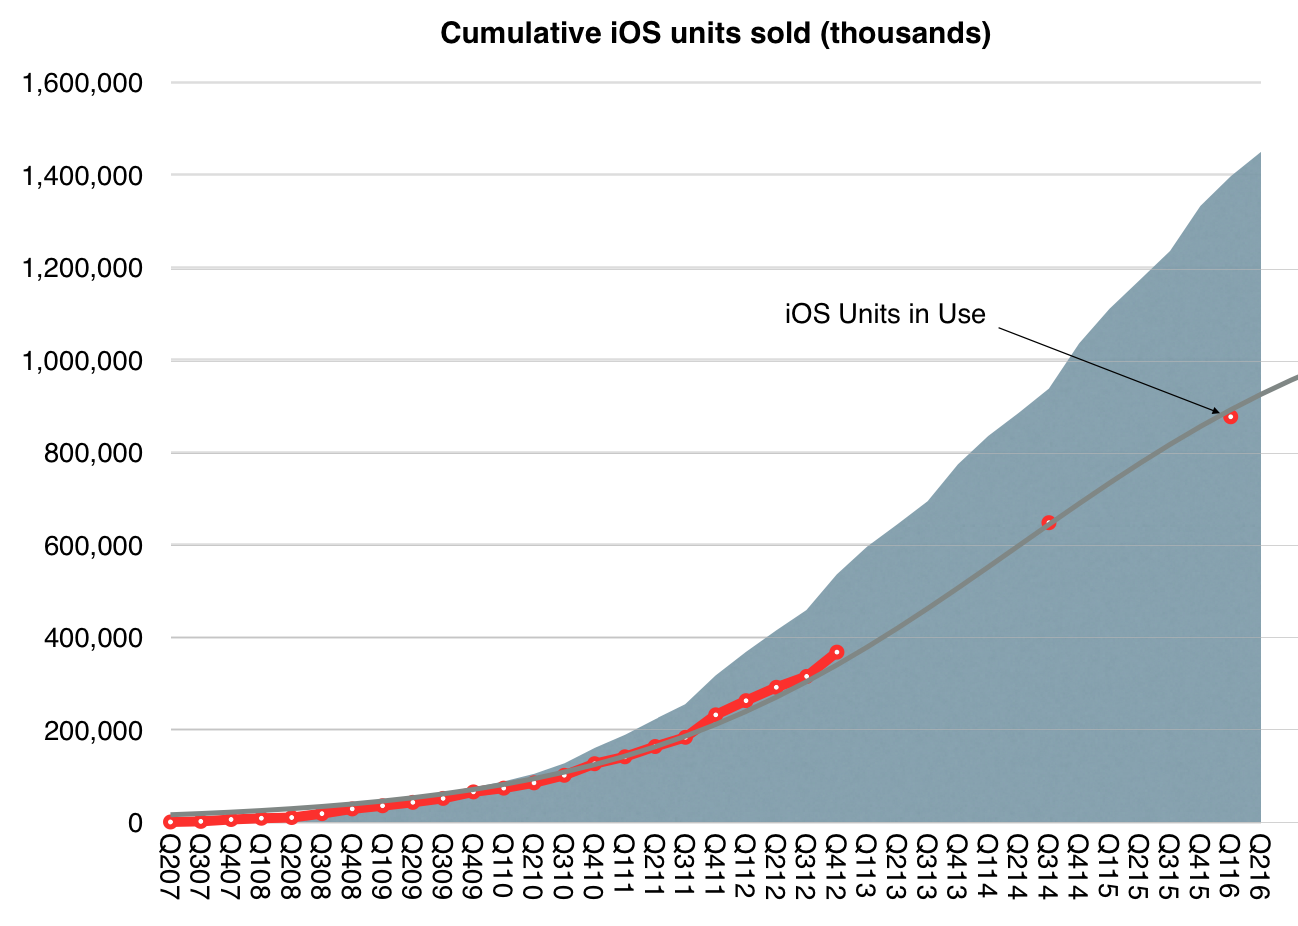
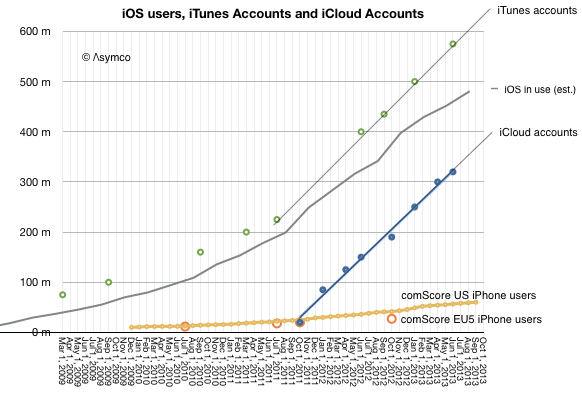
The total number of iOS devices sold per quarter allows us to measure the install base of device users. With some assumptions regarding the retirement and attrition rate we can get the following history:
Since the total number of iTunes accounts is updated with some regularity I've added it to the graph. I've also shown on the same graph the total number of iCloud accounts. For calibration, I included survey data showing the number of iPhone users in two regions (US and EU5).
These combined graphs give us an upper bound of active users (iTunes accounts) and a lower bound (iCloud) calibrating our device-based estimate. The regional iPhone data offers some additional test on growth.
The result is "about 500 million" ((482 million by my count but with quite a bit of margin of error)) with a growth of about 11 million per month.
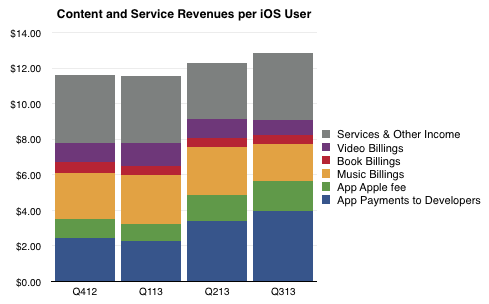
So if we know with some confidence that there are about 500 million active users as part of the iOS ecosystem, how do we know how much value they generate? The answer is in the consolidated iTunes revenues as reported by Apple: $4.26 billion/quarter. With some attention to the reported media retail and purchases, the following picture of the average iOS user's quarterly spending emerges:
The bottom line is that in the last 12 months the average iOS user contributed about $48/yr to the ecosystem via Apple's own properties. They also bought the device and paid for cellular service in most cases. They may also have engaged in quite a bit of browsing and online purchases which fed other ecosystems. But as far as Apple is concerned, it transacted about $48 per user.
As Twitter revenues last year were $317 million, the Twitter user today generates about $1.36 of revenue per year or one thirty-fifth of what an iOS user generates through iTunes and iCloud alone. And note that the number of iOS users is about twice that of Twitter.
Of course one could argue that the iOS user's participation is not profitable for Apple. It does obtain massive cash flow from iTunes which finances its fashionable data centers and bandwidth but it does not presume to value itself primarily through this revenue.
Or at least the market doesn't think so. We don't hear much about how Apple is worth so many dollars per user. ((I suppose the corollary to this is that Apple users are disloyal or fickle or fleeting, and quite contrary to observed behavior.))
The paradox is that while the device which enables this commerce is where Apple guides the consumer's perception of value, markets discount devices and bid up services. In other words, users continue to pay for the devices which delight them enough to participate in services (especially the monthly billable kind) but markets walk right by these shiny baubles and and shower money on services which have negligible sales and even fewer profits. There must be some serious misdirection going on here. The question is who's being fooled.
In the last two posts (How much does an Apple store cost?, The down payment on iCloud) I discussed two line items in the PP&E asset class on Apple's Balance Sheet. In isolation, the data is interesting as it gives us an idea of the cost structure of stores and facilities being developed to sustain its current business model. In aggregate, it provides insight into Apple's strategic intent.
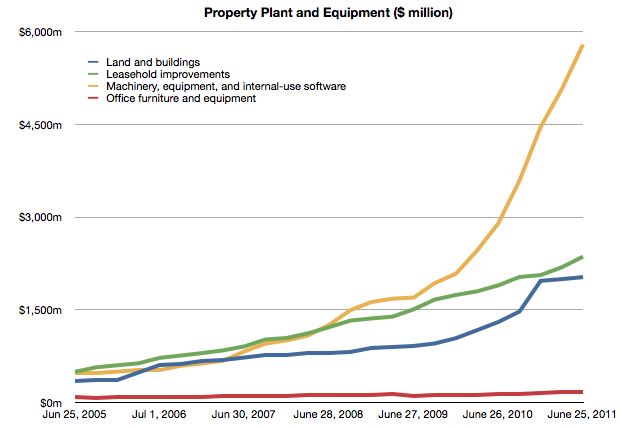
To complete the picture, I will look at the third asset: "Machinery, equipment and internal use software." It's the yellow line in the chart below:
It's plain to see at first glance that it's the most significant asset. What does it represent and what conclusions can we draw about Apple's strategy?
Before I begin, I should make clear what this asset represents and what it does not represent. These expenditures cover equipment used in production. They do not include components used in the production nor loans to suppliers for purchasing equipment. These are fixed assets that can be depreciated on a schedule and have specific tax treatment as a result. These are, in plain language, instruments used for producing things to be sold. They are things Apple owns.[1]
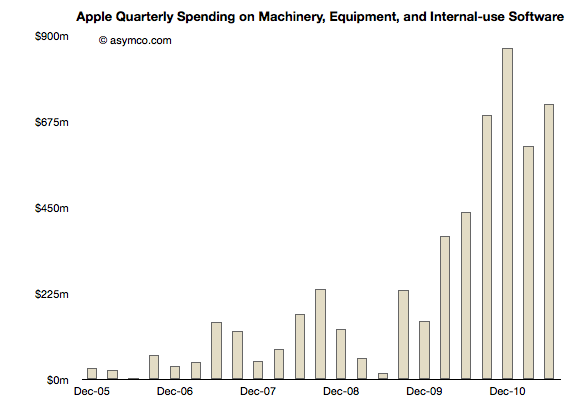
Using the same method as in the other asset analyses I took a measure of the sequential change in that asset over the time period and tried to see if there is a correlation between that spending and some other measure of output from the company.
Here is the sequential change chart since the end of 2005:
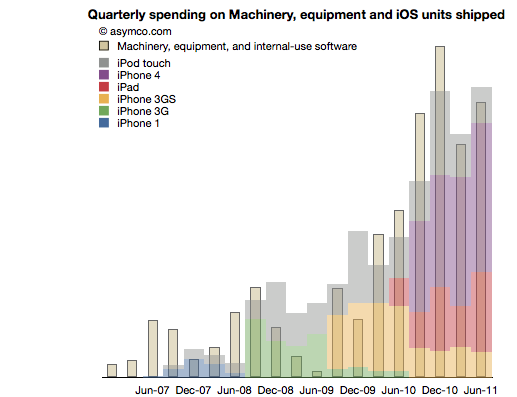
I noted that the pattern seems to relate closely with the increase in shipments of iPhones. More specifically, iOS devices. To test this I overlaid the overall volumes (with estimates of product types) of iOS shipments. This is a modified version of the chart published here.
There is a broad similarity. But again, as in the other analyses, the spending on assets typically predates the "output" from that asset. As we saw in land and buildings, the operational start of a facility may happen many quarters after the purchase is made. Similarly, stores open some time after the spending on fitting them out.
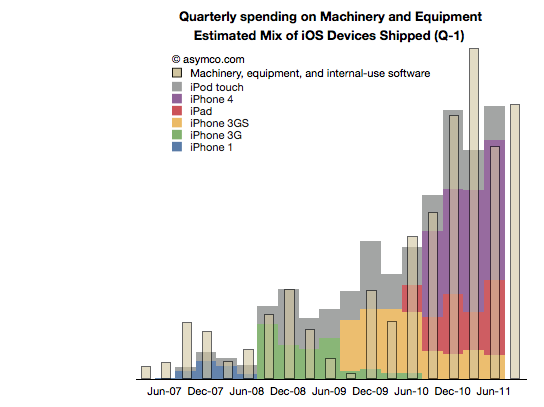
So it is with Machinery and Equipment. If we time-shift the output one quarter to account for spending before production we have a better fit (note the change in the title with "Q-1" indicating that the dates for the iOS shipments are offset by 1 quarter to the left).
We can even take the analysis further by breaking the spending and output into Phases corresponding to specific product cycles and introductions.
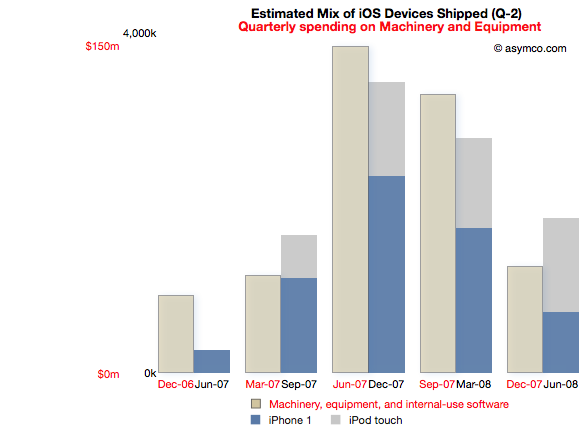
Phase 1: The original iPhone
Spending on M&E prior to the iPhone launch began two quarters in advance of sales. The following chart reflects this delay. Note that the M&E payments are marked with quarters ending six months earlier than the shipment schedule. Note also the scale (red denoting the M&E spending and black the units shipped). I also separated the two product types (iPod touch are my estimates, iPhone numbers are published by Apple).
This Phase corresponds to the first "bump" in the expenditure chart but offers more detail. There is an evident relationship between the "input" expense and the "output" of units shipped.
The cost of Phase I was $408 million.
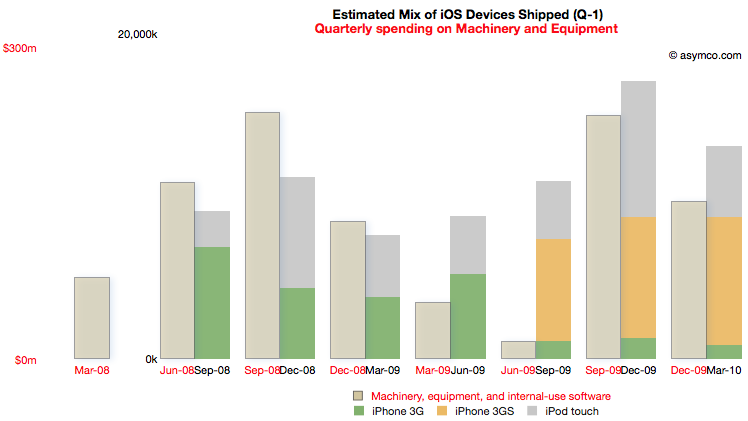
Phase II: The iPhone 3G series
Phase II covers spending from the quarter ending March '08 to December '09 and production from September '08 to March '10.
For this Phase the time shift is only one quarter but there is a quarter's worth of spending that is initiated prior to any shipments. I chose to demarcate this Phase to cover production for both the 3G and 3GS as they probably shared a lot of common equipment. Some spending on new production lines however still had to happen as volumes increased during 3GS production.
Note the scale change from the first Phase. Whereas the maximum in Phase I spending was around $150 million per quarter, the peak is nearly twice as much in the second Phase. The peak output is 5x higher.
The cost of Phase II was $1 billion.
[I had to guess whether the Sep 09 and Dec 09 M&E spending was for 3GS or whether it was to prepare for the ramps in the new products about to be launched in the third Phase.]
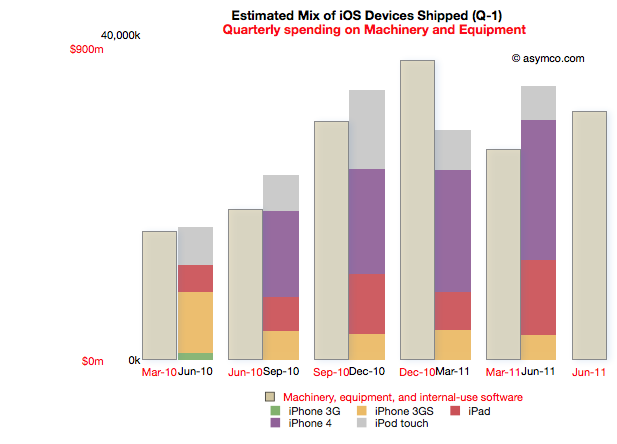
Phase III: The iPhone 4 and the iPad
Phase III begins with spending prior to the launch of the iPad 1 (March '10) to the last quarter (ending June 2011). Coupled to this is production starting in quarter ending June '10 and ending in the last quarter.
Note that due to the time offsetting on production, the output from the spending on the quarter just ended will not be known until Apple publishes their shipments for the June quarter (scheduled for October 18th).
The relationship between pre-dated spending and production one quarter later holds quite well. There is a "surplus" of spending in December 2010 but that could be seen as the ramp being prepared for the second iPad.
Phase III cost is $3.7 billion so far.
Note again the change in scale from the previous two Phases. Peak M&E expenditures are around $900 million per quarter while production peaks at around 35 million units. This is a tripling of spending coupled to about a doubling of output.
Observations
The data suggests spending on equipment is correlated with the volume of production of its iOS devices. However, Apple is understood to be a company that outsources its production and does not "own" its own factories. Claiming that it keeps equipment used in the production of iOS devices on its books is an extraordinary claim.
I make a further claim that the scope of spending itself is extraordinary.
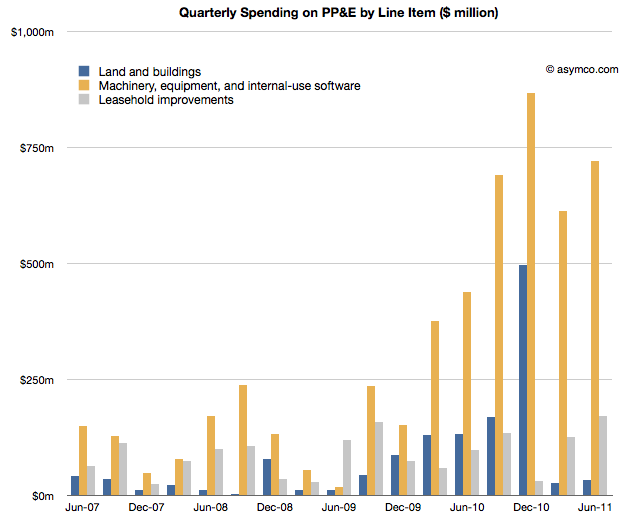
The following chart shows the three asset classes discussed in the three latest posts relative to each other (quarterly change in asset value).
In How much does an Apple store cost? I noted that the spending on leasehold improvements of $2 billion over a few years is significant and sustaining and largely asymmetric to competitors. You can see that spending in the grey bars above.
In The down payment on iCloud I noted that spending on Land and Buildings is significant and sustaining to iOS but not on a scale many can match. Those costs are shown in the blue bars above.
If, as I claim here, the yellow bars show the spending on Machinery and Equipment used in the production of iOS devices, then the commitment Apple has made to controlling production is even higher. In December 2010, M&E expenses were 50% higher than the spending on the data center and the new Cupertino campus put together.
The M&E assets have cost a total of $6 billion. The Apple stores have cost $2.3 billion and land and buildings $2 billion. In other words, Apple's machinery and equipment is worth much more than all its buildings and stores put together.
Compared with what Apple spends on other fixed assets, M&E is spectacularly significant.
In the twelve months ended June, Apple will have spent $2.9 billion in M&E to manufacture 118 million iOS devices. To put that in perspective, Nokia, which manufacturers a large (if not majority) of the 340 million phones it sells, expects full year 2011 capital expenditures of $1.1 billion.
Correcting for amortization and depreciation and deducting some spending on Mac M&E, it's very likely that Apple spent twice as much as Nokia on the instruments of production for one third the number of devices.
Conclusions
It may be too early to draw conclusions from this analysis. The claims should be debated and the claims should be tested, but I can suggest some tentative strategic implications.
Last December I wrote that I thought Apple should use its capital to own the means of production for iOS. I reasoned that device supply was its biggest deficiency and that perhaps ownership would allow them to become better at it.
Indeed, Apple has used capital to ensure it has better control over the supply of components and to also perhaps ensure capacity of production of those components.
But this analysis shows that Apple has gone much further toward integrating its value chain. It suggests that a large part of the tooling in its supply chain is owned by Apple. It suggests that those tools are put out of reach of its competitors.
The implications could be profound but given the length of this post, I'll leave that discussion for another day.
---
Notes:
Some of the capital expenditures were also allocated to servers or "information systems hardware, software and enhancements." From the Annual Report 2010: Capital Assets. The Company anticipates utilizing approximately $4.0 billion for capital expenditures during 2011, including approximately $600 million for retail store facilities and approximately $3.4 billion for product tooling and manufacturing process equipment, and corporate facilities and infrastructure, including information systems hardware, software and enhancements.
Balance Sheets are not typical targets of focus in software or services or "high tech" companies. Except for Cash, there are usually not much in terms of assets for analysts to contemplate. With outsourced manufacturing, even hardware companies don't maintain depreciable assets on their books.
Apple, as usual, is different. It turns out there is a lot there and there's a lot to learn from what's there. I've looked at the Cash and Long Term Securities in the past but in the next few posts I'll dive into fixed (non-current) assets. Specifically Apple's Property, Plant and Equipment.
Apple Inc. has selected North Carolina as the location for a new data center and will invest more than $1 billion in the project over nine years, Gov. Bev Perdue announced
When Apple committed to the North Carolina data center in mid-2009 the iPhone was two years old. Only 26 million iPhones had been sold to date (about as many as Apple now sells every quarter.) Clearly if the commitment was on such a scale there must have been a plan. A big plan.
We don't know for sure if NC was used last week or whether it was handling only part of the load, but let's assume it was. What I want to think about is how much iCloud would thus cost and hence what would be the cost for alternative providers of such a service. That analysis might let us determine if "cloud" forms a substantial barrier to entry for competitors.
Beside the public statement above (which may have been designed for political benefit) can we find any evidence of what Apple spent on data centers? That's where the PP&E line comes in.
The following chart shows the Property, Plant and Equipment asset in Apple's Balance Sheet.
Each line represents a particular type of asset and its value at a particular point in time. I will now pay attention to the blue line, Land and Buildings. I'll look at the other lines separately.
Note that each line represent current value so it does not say directly what was happening in the quarter. However, if we look at the change q/q for a particular line we get how much new spending occurred in the quarter for that particular asset.
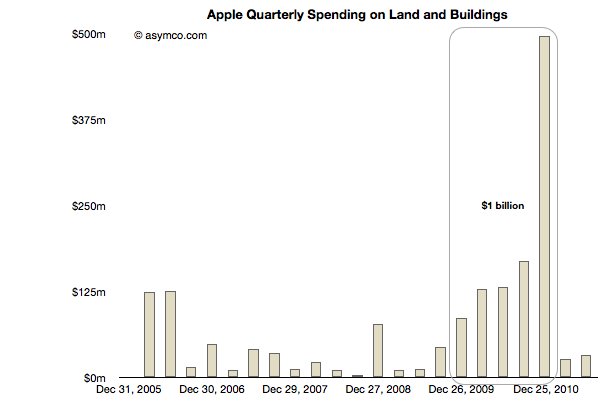
This change in Land and Building asset value is shown in the following chart:
Going back to 2005, there were minimal changes. Perhaps there is some significance in the $250 million spend in early 2006 or the nearly $78 million spent in Q4 2008, but there is a definite significance to the massive spending that occurred right after the NC commitment was made.[1] Some of that payment also included the old HP campus in Cupertino. "Local real estate experts said HP’s asking price may have been $300 million or more, but they also said the final amount may have been less."
There is also a clear cut-off on that spending at the end of 2010.
The total spending during this time adds up to nearly exactly $1 billion. If we subtract $250 million for the Cupertino expansion we still have $750 million that must have gone into NC.
Note that the original statement quoted above was $1 billion over nine years. We can see that Apple spent $0.75 billion in one year. On the building alone. This is why I consider this a down payment. It does not include any of the equipment in the plant. It does not include the cost of operation (incl. labor) or any development costs (R&D). In fact, it does not include any of the funds that would be part of the nine year commitment.
What this level of spending implies is that iCloud (and Siri and iTunes) are expensive. They may seem ephemeral and even trivial as services, but they require a staggering commitment few can make. Apple made that commitment and they made it early on, before the first quarter billion users were even on the horizon.
If platforms are moving from local to distributed and if value moves from selling things to "getting to know you" and if that knowledge requires infrastructure control then the number of companies that can participate in the market shrinks dramatically. Not only in terms of who has the capabilities, but who could even afford to acquire them.
The invoices Apple pays are shown above.
----
Notes:
Apple's retail stores are not included in these figures as Apple leases them. The cost of the stores will be discussed in a separate post.