There are several methods I turn to when estimating device sales.
Top-Down Demand analysis
The first is to look at so-called top-down views of the demand. This method takes a view of the overall phone market and assumes share for smart devices and, further, shares for individual platforms. There are several estimates out there. The most recent is Ericsson's Traffic and Market Data Report, released November 7 2011.
It concludes that in five years' time mobile subscriptions will reach 8.4 billion of which smart devices (incl. tablets) will total 6.2 billion. As iOS has approximately a 250 million install base at end of 2011 and as the total base from Ericsson's estimate for 2011 is 1.44 billion then Apple's share is approximately 17%. If we assume that Apple will be able to increase smart device share to 20% (3 percentage points in five years) then by 2016 Apple will need to have 1.24 billion iOS subscribers.
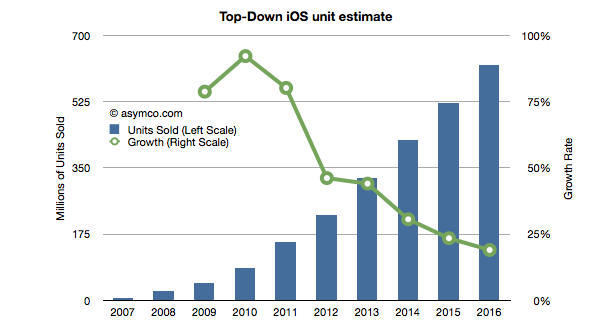
Assuming that half the installed base upgrades every year and Apple adds devices required to reach the install base necessary (1.24b or 20% share) leads to the following unit sales projection (I've added 2008 through 2010 actuals and 2011 estimates based on my own current Q4 projections).
This Approach yields an estimate of 225 million iOS devices to be sold in 2012. Note that the growth is linear which is not usually the case. Typically this growth is in the form of an S-curve which front-loads the volume in the more recent periods.
Production Estimates
The second approach is to look at supply. I use this method for Apple as I consider their devices to be supply constrained and thus look at historic performance to forecast their production ramps. Put another way, I try to answer the question of how quickly Apple can sustain growth in production given their yearly product cycles. I can also use capital expenditures (which the company releases in advance) to forecast device production as the two have been closely correlated in the past.
Using this method I currently estimate 260 million iOS units for 2012.
Customer behavior estimates
The third approach is to attempt to measure customers' loyalties and competitiveness of vendors. If we know the probability of upgrades and the historic split between "new" and "existing" users then we can roll the forecast forward.
To start, we need a probability of upgrade which can be obtained from surveys which measure "loyalty" by asking the intention of sticking with the brand on the next purchase or a measure "satisfaction". iOS product score in the high 80% to 90% range.
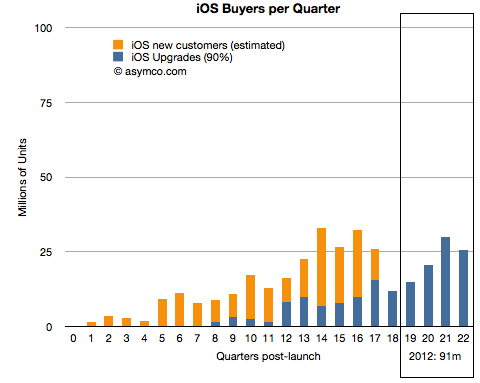
The following chart shows total iOS units sold and the ratio of upgrades (assuming 90% upgrades for 2 year old purchases). It also forecasts upgrades based on current installed base.
If 90% of iOS users upgrade two years after their device purchase then next year will result in 90 million iOS devices sold to existing users.
Given the ratio of new users to upgrades in the past, and if we assume some reduction in that ratio over time, we can obtain a measure of "new users" on top of the upgrades. (In other words we forecast forward the ratio between the dark blue and orange lines above).
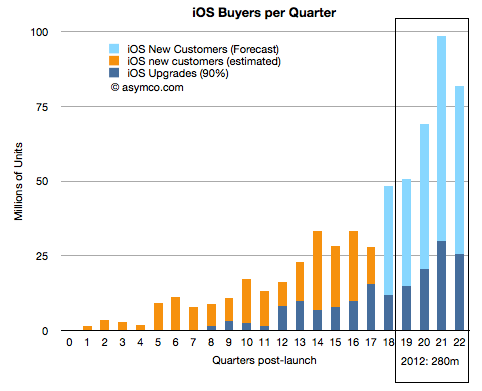
The ratio of new to upgrades has varied significantly from 30x to 0.8x upgrades. I created a schedule where the next quarter will be 2.1x, then 1.44x, 1.36x, 1.28, 1.2x for the quarters of next year. The result is shown below:
This yields a forecast of 280 million iOS devices to be sold in 2012. The forecast is very sensitive to the ratios shown above so obviously this is not going to be very accurate but it's interesting to note that the three methods yield growth rates of 46%, 69% and 82%. All three are far above the growth forecast for Apple (about 25%).
On October 27th, Nintendo published half year results for the fiscal year ending in March 2012. Management stated that the company lost over $900 million with a negative outlook. Nintendo cited weaker than expected sales of Nintendo DS hardware and 3DS software and Yen appreciation as the main reasons for the miss. Is this the end of Nintendo?
Before we look more closely, here is a quick summary: The company is exclusively involved in selling game hardware and software. Their console platform is the Nintendo Wii, which will be followed by the Wii U late in 2012. The Nintendo DS and Nintendo 3DS are the company’s portable game consoles. The Wii and the DS are nearing the end of their product cycles. On the software side, the company is known for gaming titles such as Super Mario and Zelda. Nintendo also pioneered the licensing model to allow third-party developers to produce games for its hardware products.
A closer look
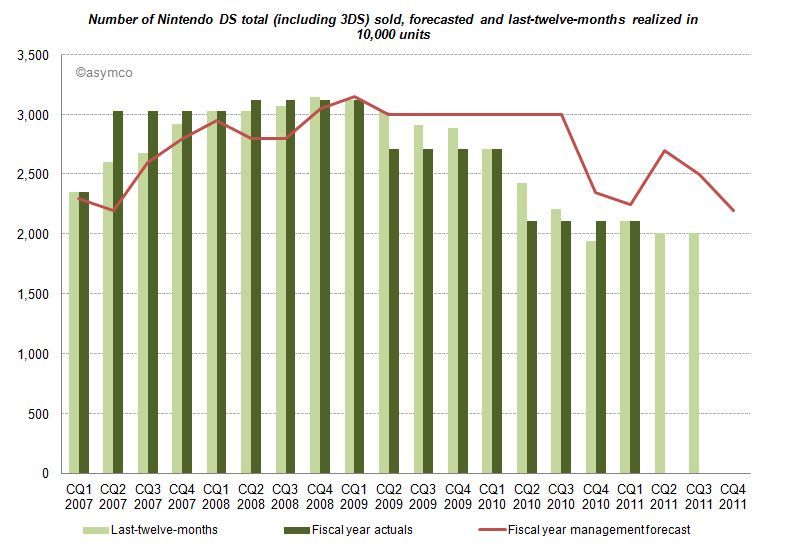
The good news for analysts is that Nintendo publishes their estimates for hardware and software unit sales. This allows us to measure management predictive accuracy. The red line (management forecast) should be as close as possible to the dark green pillars (realized unit sales in the fiscal year).
Until CQ1 2009 devices sales grew in excess of forecasts. A similar pattern can be found for consoles and game titles. After Q1 2009 forecasts have been always higher than results, and more worryingly, the deviation between forecast and sales is widening. Management missed and lowered forecasts for two consecutive years. Management's hope for an increase on the back of initial 3DS sales in the launch quarter (CQ1 2011) did not come to pass and they subsequently lowered forecasts again in the following two quarters.
Looking at all categories, management lowered forecasts almost continuously. The deviation remains the largest in the portable hardware business segment indicating that management was largely surprised about the development.
What caused this reversal of fortune?
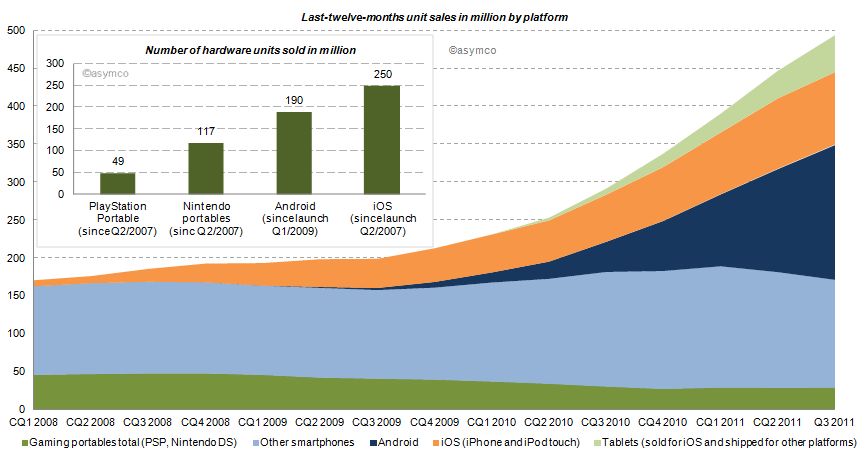
Two years earlier the iPhone had launched and by CQ1 2009 iOS reached an installed base of about 38 million, half the number of Nintendo portables in the same period. Furthermore, in CQ1 2009 Android phones came to the market. Smartphones (light blue area of the chart below) sold before (and after) the debut of iOS, but the iPhone redefined the category and an avalanche of smarter phones running iOS and Android followed (blue and orange area). Portable gaming devices from Nintendo and Sony declined ever since: 17% in 2009, 31% in 2010 and already 16% in the last twelve months.
How do the game players stack up?
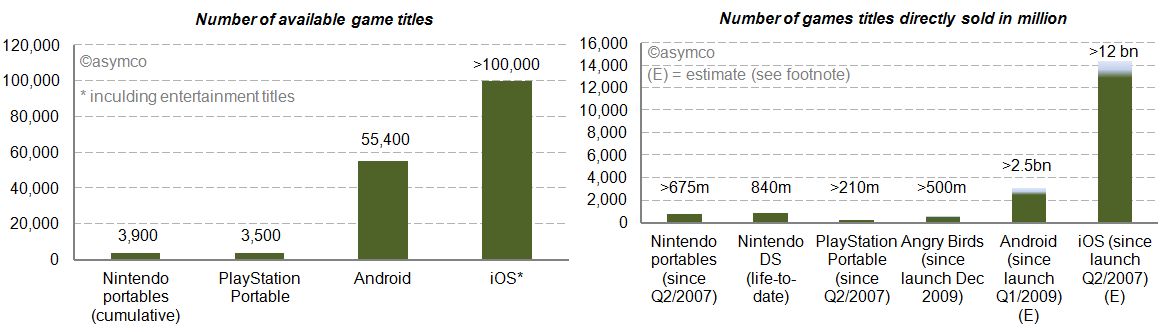
We already looked at the installed base in the chart above. iOS and Android have outsold Nintendo portable units by a factor of 2.1x and 1.6x. Furthermore, we can see (in the charts below) that the two main mobile platforms have 14 to 26 times more game (and entertainment) titles available. Nintendo and Sony also publish unit sales of directly sold software titles. For Android and iOS we know the cumulative app download statistics. By taking the share of Septembers’ paid and free app downloads as a proxy, we can conclude that also by this measure Android and iOS dwarf Nintendo and Sony [1]. The reach of iOS and Android is further underlined by the more than 500 million downloads of Angry Bird game titles - first released only two years ago - for any platform having sold more than twice the amount of Sony’s cumulative portable game titles and almost as many as Nintendo’s cumulative games titles since Q2/2007.
Who else has skin in the game?
Besides Nintendo, Sony, Apple and Google, who else is making a push into mobile gaming? Before investigating, let’s first have a closer look at Sony. Sony, just like Nintendo, is also active in stationary gaming segment with the PlayStation franchise. The Sony group also has access to entertainment most notable through Sony Pictures Entertainment and Sony Music Entertainment. Furthermore, Sony recently decided to buy Ericsson’s stake in the mobile phone joint-venture Sony Ericsson and is making a push with Android to bring its gaming titles as a differentiator for its own products to the platform. And the other major suspects? Microsoft, also active in the stationary gaming segment with its Xbox franchise, is pushing to bring the Xbox experience to mobile phones with Windows Phone. Amazon has retailed software and games for years and has started to distribute software and games via direct download on its own Kindle devices but also for the Mac. On the Kindle, Amazon is relying on a forked Android version on which it leverages its eBook and other entertainment assets. And then there is Facebook, a social network that wants to be on any platform or device. Out of 800 million users, 350 million access Facebook via a mobile device. Around 50% of Facebook members play games on the desktop. With Project Spartan, Facebook is aiming to bring the desktop experience to the mobile device including a stronger focus on gaming and video.
The competition between Apple and Google is already asymmetrical. Including the other contestants in the competitive landscape reveals Nintendo’s key weaknesses in the portable gaming market: attraction as a platform for developers in terms of ease and reach, pricing of hardware competing with operator-subsidized mobile phones and the jobs-to-be-done or value preposition. The new generation of mobile devices is standing against Nintendo’s dedicated approach. Although slowly adding features such as a browser and “app store” to its portables, Nintendo devices fall short in the variety of jobs-to-be-done compared to smartphones, let alone making a call.
Average selling prices and financial impact
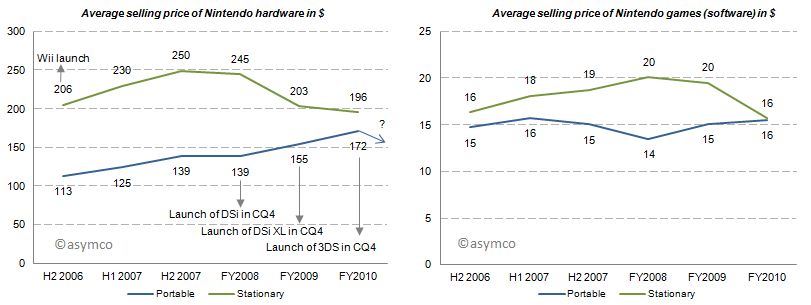
With this market pressure one would imagine that average selling prices decreased for Nintendo portables. But for the last three fiscal years average selling prices for portables have increased, all things equal, mainly due to new product launches. Game title’s average selling prices have remained relatively flat. Note that these are wholesales prices for hardware and a mix of retail and wholesale prices for games. In 2011, for which we do not have data yet, the price of the newest portable, Nintendo 3DS, was lowered from its U.S. debut of 320 250$ in February to 170$ in July which will have a negative impact on ASP going forward.
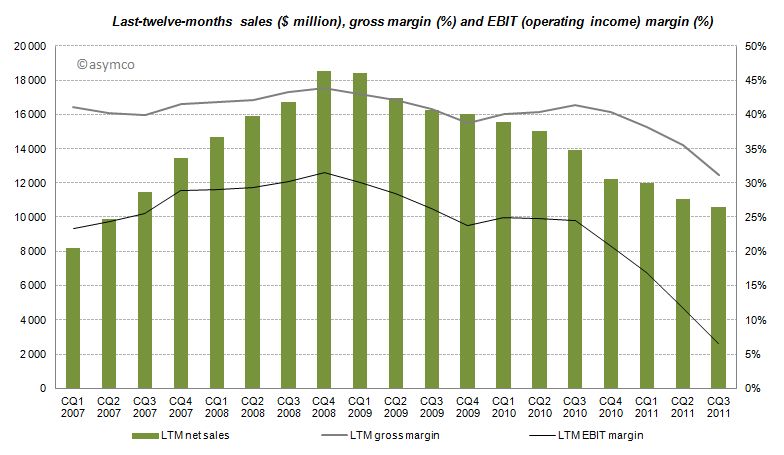
The effects of Nintendo’s rigid strategy and the fast changing competitive landscape are manifested in the devastating financial performance over the recent quarters with LTM sales, gross margins and EBIT margins declining starting from CQ4 2008 and even accelerating to decline after CQ3 2010.
Furthermore, even though the company has recognized its own difficulties, Nintendo has no intention of adjusting its strategy:
CEO Iwata on the question of whether Nintendo plans to bring its game library to other platforms:
This is absolutely not under consideration. If we did this, Nintendo would cease to be Nintendo. Having a hardware development team in-house is a major strength. It’s the duty of management to make use of those strengths. It’s probably the correct decision in the sense that the moment we started to release games on smartphones we’d make profits. However, I believe my responsibility is not to short term profits, but to Nintendo’s mid and long term competitive strength.
Although realized and obvious, the disruption’s invisibility is often manifested in the paralysis of the incumbent.
Conclusion
According to Isaacson, Steve Jobs apparently always worried who could eat Apple's lunch. The lunch of the iPod, he concluded, was ripe for mobile phones. Subsequently, Apple entered the mobile phone space. Google followed. Since then more powerful mobile phones have eaten the lunch of the dedicated gaming device. The jobs-to-be-done and their priorities in people’s life have not changed, but the tools people use to get them done have. Permanently.
---
Notes:
Estimated by multiplying total cumulative app downloads with September’s share of game downloads: For iOS ranging from 72-80% based on Top 150 free and paid app downloads, for Android ranging from 38-47% respectively. This is a very crude estimation, but the gist of it is that 4% for iOS and 11% for Android game downloads as percentage of cumulative app downloads would outsell Nintendo.
In the recently posted US Smartphone Landscape I used comScore's data to paint a picture of the growth of smartphones in general and the shape of the mobile platforms in the US. The source was survey data measuring the installed base. If we compare the installed base sequentially, we can get the increase (or decrease) of a particular platform. Comscore reports monthly but we can also summarize the data at a quarter-by-quarter basis.
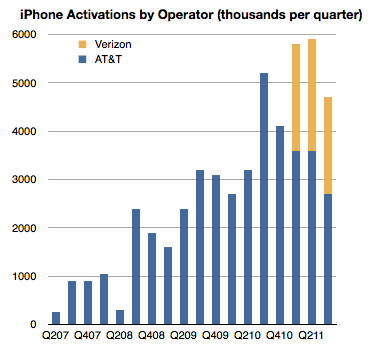
There is another source however for the US market, at least for the iPhone: operator activations. They report iPhone activations, shown below.
Can we use activations together with installed base data to learn something about the market? Yes, with some caveats.
First, it should be noted that install base should account for all sorts of devices. They could be new, old or hand-me-downs or purchased used. Changes in install base would come from addition of new devices but also from devices being discarded and users leaving the platform. Activations on the other hand include units new units but also those which have been re-activated after initial sale because they were either sold or given to other users. As far as I know operators do not report "net" activations so lost users are not included.
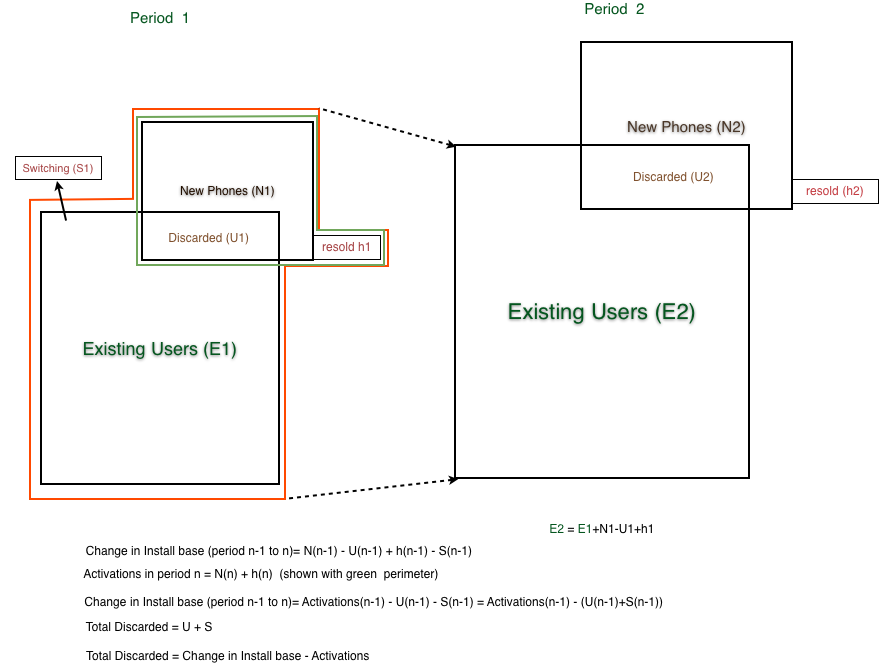
When the formulas are combined[1], what we get is the change in installed base is equal to Activations minus "discarded" iPhone, where "discarded" are both iPhones put aside in favor of a new iPhone or put aside in favor of another phone.
Since we have installed base change data and we have activation data we should be thus able to derive the number of iPhones being "discarded" or put out of use every quarter as the difference between activations and change in installed base.
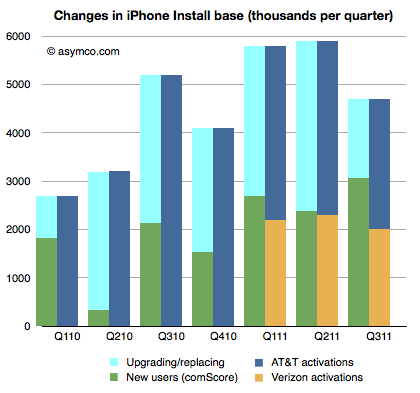
That allows the following chart to be built:
The green, dark blue and orange areas are given inputs and the light blue area representing discarded phones is derived.
This is an interesting (new) piece of information. What it suggests is that at least in the US the discard rate, i.e. number of phones being discarded over number of new phones is about 50% (56% on average over seven quarters.)
It's a rate I find surprising because I expected more of the phones to be re-used. But more surprising is that it leads to some surprising and possibly implausible behavior at AT&T.
If you look at the last three quarters, you can see that Verizon activations are very nearly equal to the increase in install base. As all Verizon users are new, they are certainly not replacing iPhones, so the green bars next to the yellow bars imply that all those new users are Verizon users. But that means that all the activations through AT&T were to replace existing phones and that AT&T only added a bit more than one million iPhone users in nine months.
In quarters prior to Verizon's launch, the AT&T discard rate was a modest 60% on average and after Verizon launch it went to 81%.
What does it mean?
---
Note:
The following diagram shows the derivation of "discarded" units.
Last week I proposed that there were two significant markets for the new iPhone: 1) the existing iPhone user base 2) smartphone "non-consumers". Today I want to dig a bit deeper into the first market to get an idea of what it amounts to.
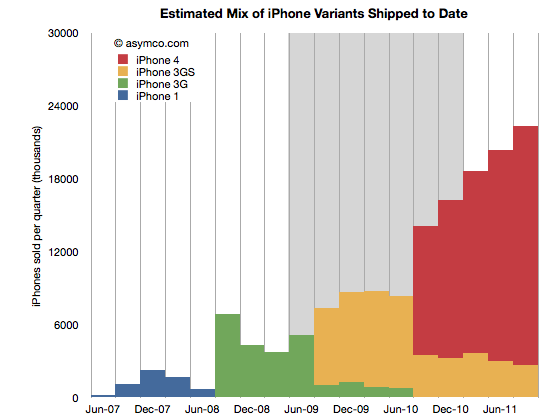
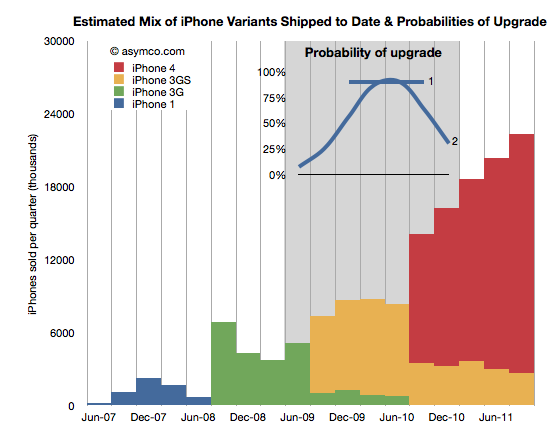
The following chart shows the total iPhone shipments over time with an estimate for the mix of models during the last two years.
The way I calibrated the mix is by taking into account the statement that Tim Cook made that half of all iPhones shipped were iPhone 4. I first estimated that this past quarter (ending September) included about 22.3 million units. That makes the total iPhones to end of Sept 151.3 million. Half would be about 75 million. Therefore the red area needs to add up to that total. The remainder must therefore be the yellow, 3GS volume.
This mix implies that the following shipments by variant (through end of Sept 2011):
iPhone 1: 6.1 million
iPhone 3G: 24.4 million
iPhone 3GS: 45.4 million
iPhone 4: 75.4 million
I also highlighted in grey the most likely target market for upgrades during the next 12 months. What I'm assuming is that recent buyers will not be likely to upgrade but those having purchased an iPhone two years hence will probably be looking to replace it. The naive approach is to assume all the iPhones beyond a certain age will be automatically upgraded. That would give almost 70 million units. However, not all those phones are in use and many of those phones may have already been upgraded to iPhone 4s. 70 million is a theoretical maximum. We have to be more specific.
In order to get a better figure for this I created a probability distribution (PD) which suggests the likelihood that the phones purchased in that quarter get upgraded in the next 12 months. I created two such PDs illustrated in the inset chart below:
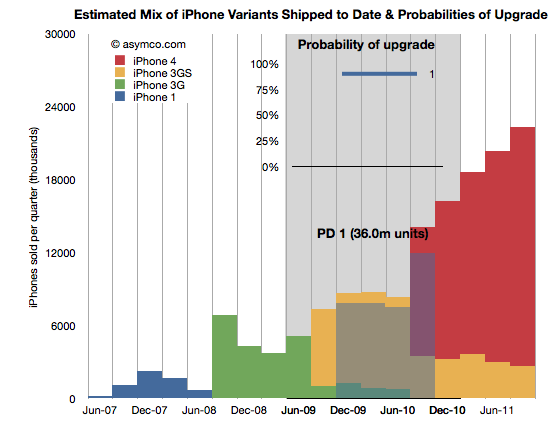
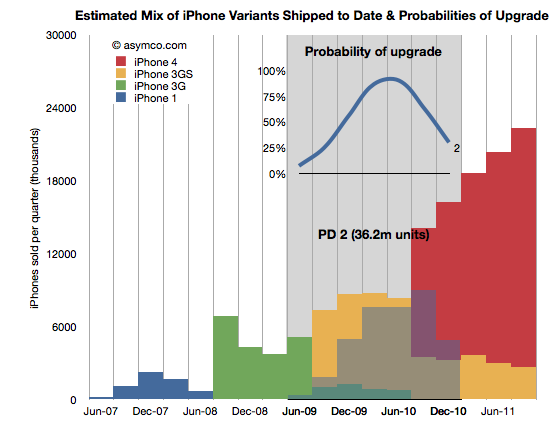
PD 1 is the simplest. It assumes that 90% of two year old iPhones will always be upgraded. PD 2 is a bit more nuanced where it assumes that there is a range of probabilities over a wider period, but with a peak in the 2 year old zone. These PDs are guesses but consider them starting points for debate.
By multiplying the probability in the line chart (PD1) with the area below it (the units it covers) we get get the shaded area indicating which phones (and variant) will be upgraded next year.
The areas not shaded are either left un-upgraded or represent phones which were already upgraded to iPhone 4's last year. The PD1 assumption yields 36 million units.
Doing the same with PD2 yields a different upgrade set shown below:
This assumption leads to about 36.2 million units upgraded in the next 12 months. Very similar to PD1 but approached from a different angle. Are these figures credible? I don't know. The real PD may be quite different but I think these are pretty conservative figures. They are about half of the theoretical maximum.
Why is this Interesting?
This is interesting because of two reasons.
Firstly, it lets us calibrate our forecast for iPhone sales next few quarters. My own estimate stood at 140 million prior to this analysis. Is it reasonable? Remember that the target market includes non-consumption or non-iPhone, non-Smartphone users. Given the "guaranteed" market above at least 36 million, it makes the non-consumption target about 104 million. Does it sound reasonable?[1]
Yes. Primarily because most iPhones sold during the last 12 months were sold to non-consumers. And there were 76 million of them. Apple's distribution has increased since and will continue to increase[2]. That means that Apple does not need to stretch much more than it already has to get the additional growth from un-penetrated markets. We know that this market is still measured in the billions of users. The demand is there.
Secondly, this is interesting from a competitive point of view. When competitors like Microsoft claim that Apple left open an opportunity by not launching a new iPhone "5" they are not looking at the world through the lenses shown above. From their point of view each new phone sold must come from their installed base or non-consumption.
But they don't have any installed bases over 2 years old looking to upgrade. There are few Galaxy users who are yearning to upgrade since they just bought their first units. There are no Windows Phone users (and no Windows Mobile users) who are ready to upgrade to Mango. Since they don't don't see the world through upgrade "lenses" they see their marginal buyer as somebody who might have bought an iPhone 5 because it was the latest and the greatest in terms of specs or novelty.
However they cannot be hopeful that any existing iPhone buyer will switch because they know the satisfaction scores are above 90%. They also know the legendary Apple brand loyalty that keeps Mac and iPad and iPod users glued to their devices. They are also aware of the moats of iTunes, iCloud, hundreds of installed Apps and iMessage all designed to preserve Apple's customer base.
Competitors have none of these things. They don't have upgraders, or switchers to target. They can only target non-consumers. There their odds are better but Apple's are at least as good.
---
Notes:
The 140 million target for next 12 months is probably well above consensus. It assumes a growth rate of 84%. I've seen a few estimates where the growth is forecast at less than 30%. If we are to believe the analysis above, the consensus begins to appear catastrophic.
Apple's distribution measured as number of carriers and countries covered is still about half that of RIM and about a third that of Nokia or Samsung.
The August comScore mobile survey (MobiLens) is out. It measures the penetration or consumption of various mobile products and services in the US over a three month period.
I track the change in this data over time. Here are some highlights:
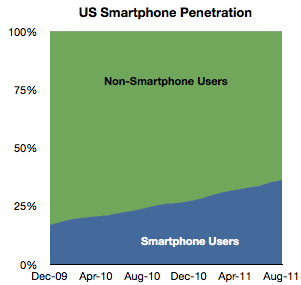
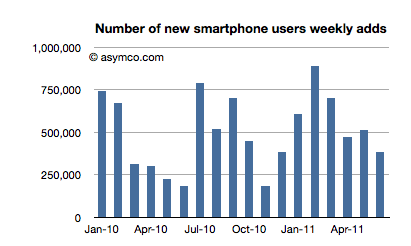
In August about 520,000 users switched to using smartphones (from non-smart phones) as their primary phone. This is a bit down sequentially from July but about average for the period starting January 2010.
Penetration increased by about 1 % to 36%.
Extrapolating this growth implies 50% penetration by September 2012. However growth is accelerating slightly so that tipping point may come sooner. Separately, T-Mobile reported that 75% of its device sales during this year have been smartphones, so if this is indicative of overall US market, then by next year it may in fact be quite difficult to find any non-smart phones to buy.
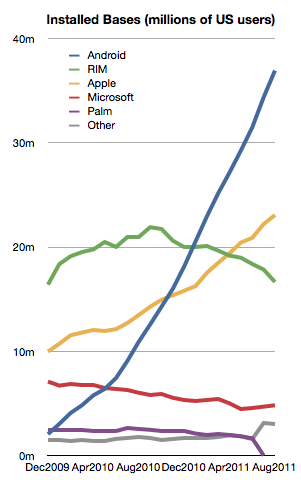
Among the smartphones, the different OSs have the following installed bases:
The growth in both Android and iOS has been fairly constant for the last 18 months.
Microsoft seems to be stabilizing at around 6%
But RIM shows an alarming deterioration. The company has lost 4.3 million users in the last year and is now at about the same number of users it had in late 2009. This is in a market that has more than doubled.
With only about 16.5 million US users and an average loss of half a million users per month, unless something drastic happens, RIM could lose its entire US user base by the end of next year.
During the last month alone RIM lost 1.2 million users. Management insists that new devices will boost sales but here we're measuring the erosion in core users, not upgrades. It's much more likely that those 4.3 million who left BlackBerry went to other smartphones. To move from a BlackBerry to a feature phone seems very improbable to me.
That means that BlackBerry's pain is probably iPhone or Android's gain. This sort of switch is often painful and I can only imagine that it's done with some reluctance. All the more remarkable then that RIM could not offer incentives to stay. The BlackBerry brand is fading rapidly and brand value is very hard to re-build.
There's one more thing.
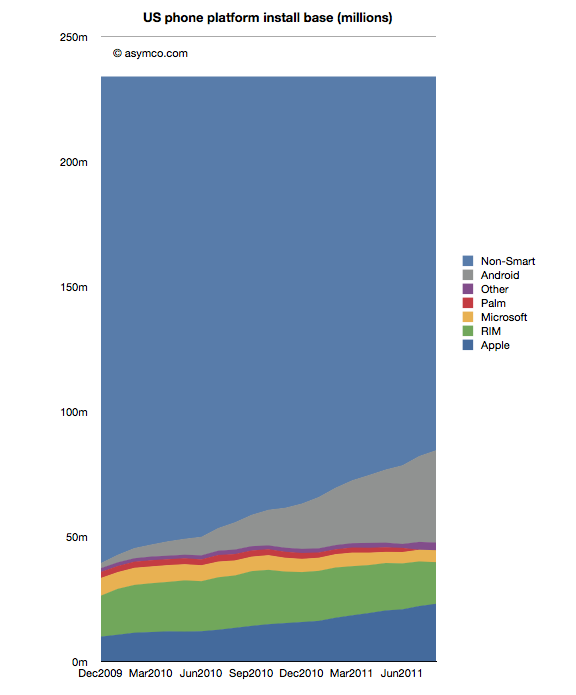
We can see platform rivalry in the installed base chart but the bigger battle is the competition with non-consumption. The following chart shows how overall platforms are faring as they carve up the feature phone market.
There are still 150 million Americans whose primary phone is not a smartphone. The conversion of those users is happening at a consistent pace but there are many years of growth remaining. I've often wondered if and when this pace would moderate. I suggested perhaps at 50% there would be an inflection point as the "easy money" would already have been made.
Much of that will depend on how the product (device + service) will be priced. It's hard to get data on overall pricing. We can get some subsidized phone prices (for example now ranging from $0 to $400 for iPhone and probably similar for Android). What we don't have is an average device+service price point for the industry. That's what I would like to keep an eye on.
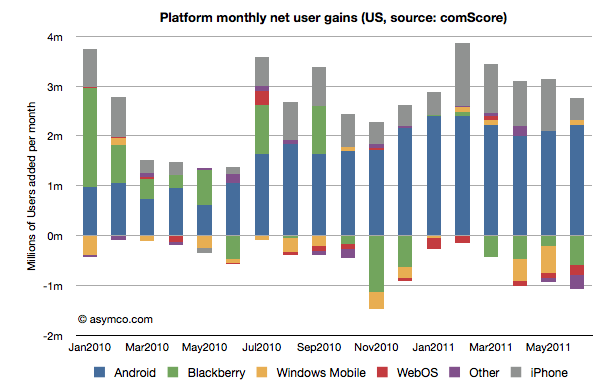
ComScore's latest survey data shows the following net user gains in the US smartphone installed base:
In summary, the key data points for June:
2.8 million new smartphone users in three month period ending June (vs three month period ending May)
Of the total 78.5 million users, about one million switched platforms
RIM had a net loss of about 600k users
WebOS lost about 195k users
"Other" (mostly Symbian) lost 273k users
Windows Mobile/Phone reversed two months of decline and added 100k users
iPhone added 452k users (considerably below its approximately 1 million/month run rate for last four months)
Android gained 2.2 million users, consistent with average over 7 months.
Platform "churn" was at 1.36%, about average over three months
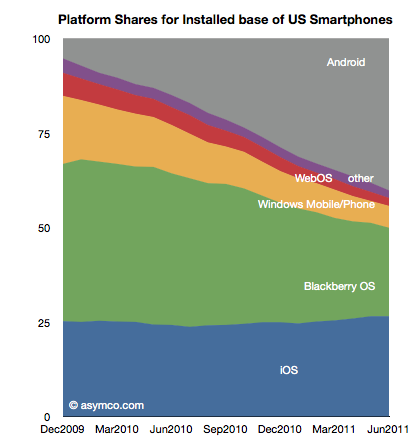
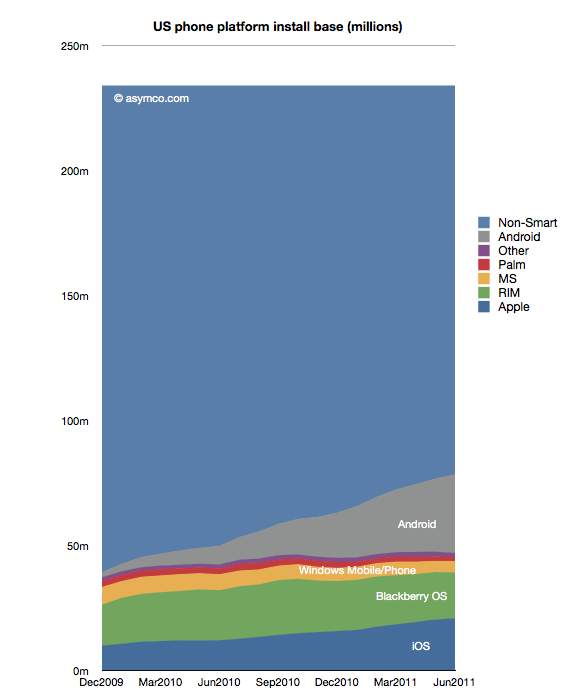
Installed platform shares for the US market are shown in the following chart
Platform Installed base vs. non-smart devices is shown below:
The penetration of smartphones slowed down in June (though that seems to be seasonal). The following chart shows weekly smartphone adds (or feature phone losses as total user base has held constant.)
Averaging the adoption rate over six months gives a "tipping point" forecast (50% penetration) of October 1st, 2012. That still means that 155 million American mobile phone users don't use smartphones.
In the quarterly smartphone summary published here, I noted the significant acceleration of Android sales at the expense of "other" and Windows Mobile/Phone. Some share was also lost to Symbian. This might be seen as justification for the "platform jump" that Nokia undertook.
In a second discussion, I published the history and life cycles of the smartphone platforms, identifying 10 platforms (out of 16) still in the market. This challenged the view that it was a two horse race today and that it will become no more than a three horse race in the future.
Questions came up about the "quality" of these platforms. Clearly some are barely viable while some are thriving. To explain the value of a platform, one metric we can use is the cumulative sales which allows us to derive the installed base.
The following charts do just that.
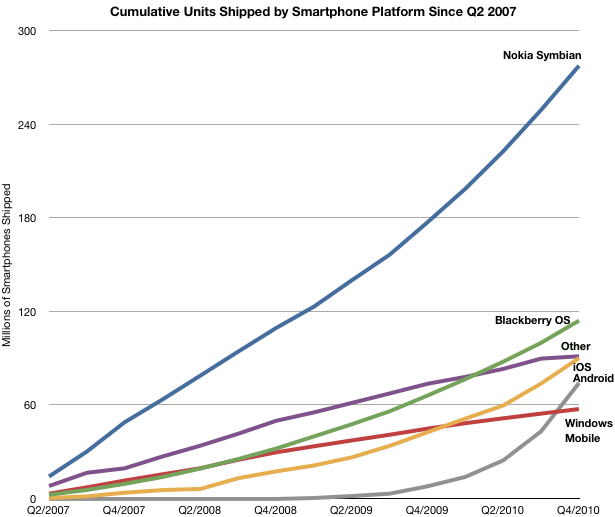
This first chart shows the cumulative total of units sold since Q2 2007. This is the sum of all smartphones sold in the last 3.5 years. There are some interesting patterns here, but right now we want to focus on the installed base.
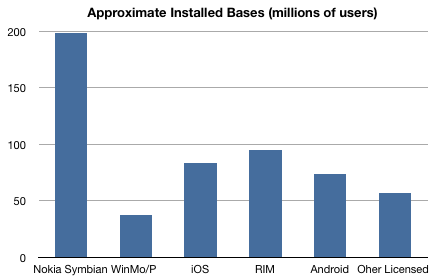
3.5 years of cumulative sales is an upper bound on the installed base. We can get a better estimate the phones in use by subtracting from the base phones older than 2.5 years. This is shown in the second chart below:
As of the last quarter, Nokia's Symbian is likely to have 200 million in use. Apple may have about 85 million iPhones in use (this excludes iPod touch and iPads) and Android about 75 million. RIM is around 95 million and Windows Mobile less than 40 million.
What's interesting is that of these installed bases, the largest is the one that's just been abandoned, and the smallest was chosen as its replacement. Even that's not quite fair since Windows Mobile is not a valid replacement. It's Windows Phone that was chosen and that probably has an installed base of about 1 million [Unlike the measurement of units shipped, Microsoft reported two million licenses were sold to OEMs who had to build those into phones which would be shipped to carriers and distributors. One million may be a generous estimate.]
The bottom line is that there are about 5 Windows Phone users for every 1000 Symbian users. In other words, Nokia jumped from the "burning" 200 million user Symbian platform to the "ice cold" 1 million user Windows Phone platform.
The disposal of such a large installed base must count among the largest divestitures in technology history and, when coupled with the adoption of the least-tested alternative as a replacement, elevates platform risk-taking to a new level. It may seem bold, but there is a fine line between courage and recklessness.
I'll do my own "dive" into the possible justification for this in a future posting.
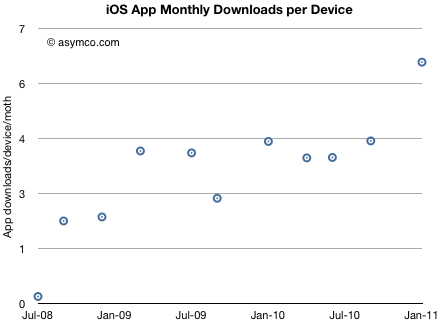
Thanks to a reader for asking this question: "Wouldn’t it be more telling to look at the monthly rate of downloads / device at any given time?"
Yes it would.
Here's what can be derived based on download rates and installed base of devices.
Please note that I am assuming that the number of devices put out of use is negligible. In defense of this, I would argue that the vast majority of iOS devices sold are still serviceable and are re-sold. However, the estimate should be rounded down.
The data shows that there's been a slight trend upward in download rate/user but it's been fairly steady.
The implications are interesting: if you know the number of iOS devices in use, you can determine the app economy turnover with reasonable accuracy. If you also know app ASP, you know sales, and even margin.
Conversely, if you know the app download rate you can derive the device installed base.
So in September I looked forward to an iOS user base of 500 million. It could be reached by 2013. Assuming each user downloads 5 apps per month that would mean 2.5 billion downloads per month.
When comparing smartphone platforms it's tempting to consider the global market as unified and commonly addressable. However, when you look at individual countries some strange patterns of behavior emerge:
Indonesia, the fourth most populous country in the world (230 million people) loves Nokia's Communicator. It's the ultimate mobile status symbol.
Japan had one of the largest installed bases of Symbian phones. The version running in Japan is not compatible with versions elsewhere. Famous for its Galapagos mobile culture, the iPhone is changing what the Japanese consider the basis of phone performance.
The iPhone just became Korea's favorite smartphone even though hegemonic Samsung and LG are doing a roaring trade selling Android phones elsewhere.
The US has four incompatible 3G network technologies in widespread use. No widely distributed smartphone phone works with any two. Blackberry ruled supreme until AT&T started promoting the iPhone and Verizon started promoting Android.
Latin America loves BlackBerry. BBM is wildly popular as an SMS alternative.
Saudi Arabia loves BlackBerry. When face-to-face conversations are taboo, the BlackBerry is a social lubricant.
Australia loves the iPhone. Android is almost non-existent.
Italy has more smartphones per capita than the US. The majority are made by Nokia.
China uses two incompatible 3G technologies. The most popular (TDSCDMA) is not available anywhere else. WiFi was illegal in phones until this year.
Germany has a disproportionally large installed base of Windows Mobile
There are no Blackberries in Finland.
Although some of these idiosyncrasies may be cultural (like the Indonesian penchant for large devices) most of them are due to operator decisions. In some cases operators choose incompatible network technologies to protect from competition. In others they promote local vendors or price certain products out of reach.
Sometimes big bangs take place and demand explodes for "banned" technologies or vendors. However, it's just as easy to see how the pendulum can swing against free market choice.
Ultimately users and device vendors are at the mercy of operator decisions. In the long term operator control over platforms might diminish but it will take many years.
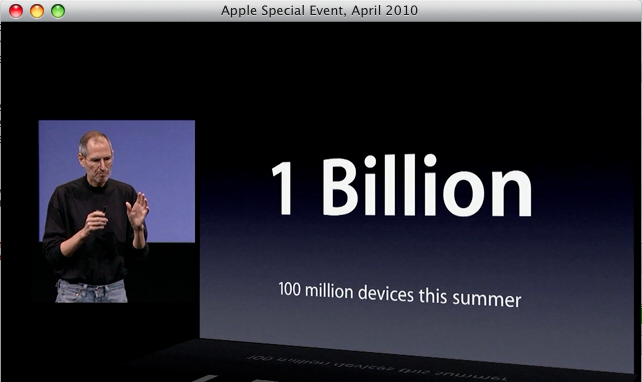
My prediction is that sometime next year Apple will announce the 100 millionth iPhone OS device sold, making the iPhone the fastest selling platform in history. The iPhone will have been on the market for three years.
Did anybody else see the line below the "1 Billion" header in the iPhone 4.0 Launch Event? The segment was about the 1 Billion impressions that iAd will be able to target. Interestingly this is one of only two forward looking estimates that Apple has ever made on the iPhone.
The 100 million threshold in units is important in several contexts.
First, on April 9th, 2007 Apple announced that the 100 millionth iPod had been sold, making the iPod the fastest selling music player in history. The first iPod was sold five and a half years earlier, in November 2001. The iPhone will reach this in 3 years.
Second, no other platform comes close. On November 3, 2003, Microsoft announced that it intends to sell 100 million Windows Mobile devices by year 2007. Two years after that goal, in 2009, Microsoft sold 15 million units, down from 16.5 million in 2008. It has not reached half the targeted installed base.
Although there could be more than 100 million Symbian devices in use, they are not all running the same software, so they do not offer a targetable installed base.