Asymco

Asymmetric Intelligence

iOS

  1. The tipping hand of production: How Apple foreshadows iOS volumes

    Research · 74 comments

    Prior to the third quarter earnings report I discussed a part of Apple's balance sheet related to tangible assets (Plant, Property and Equipment). In a series of three posts I covered the Land and Buildings (data centers and campuses), Leasehold Improvements (store investments) and Machinery, equipment (tooling and factory equipment as well as servers.)

    The data shows that there is a consistent pattern of investment in pursuit of strategic goals: extending reach into distribution through stores, extending services through cloud infrastructure spending, and extending control over the supply chain. One story that still remains largely untold is how much does Apple know in advance what it will spend.

    In other words, can we tell if Apple can anticipate demand and does it plan its expansion well in advance?

    For an answer, the 10 K report comes in handy. Published only once a year, this document shows some data that is not present in any other public release. For example, Apple makes forecasts for capital spending.

    But first, an update.

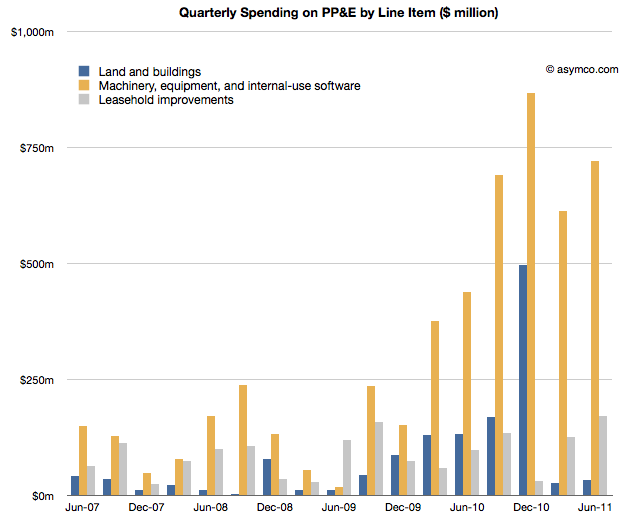
    Since the last discussion on PP&E, Apple reported third calendar quarter data. The 10K offers the details on how much was spent in the last quarter. Leasehold improvements increased by 240 million, a new record high. That might have gone into the 30 new stores opened in the quarter but it also signals more openings and renovations still to come.

    Land and buildings did not see any significant increase ($31 million).

    Machinery and Equipment growth was explosive. Over $1.1 billion was added to the value of those assets. The previous high was $868 million in Q1, presumably getting iPad and iPhone production ramped. The total for Q3 is about half of what was spent in all of 2010. The chart below shows the three items:
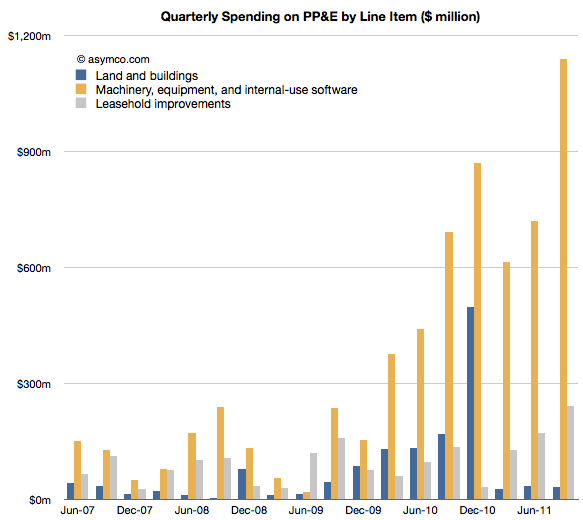
    The increase in M&E foreshadows increased device production so, while not very precise, it gives an idea that volumes are expected to be substantially higher in the following quarter. More about this when I make my forecast.

    Now I want to focus on Apple's ability to forecast its own production. As I mentioned, once a year, Apple predicts its CapEx. That prediction is broken down further by Retail expenditures and M&E+Real Estate. Let's look at Retail first.

    The following chart shows three bars: a previous year's forecast (from the 10K), reported expenditure (from the next 10K) and my own running estimate based on asset value changes.
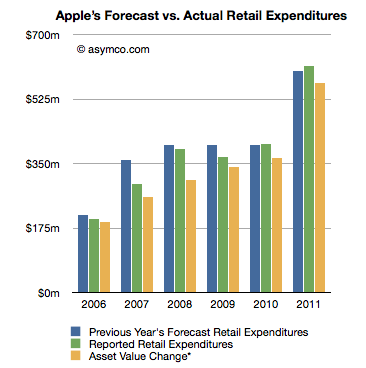
    If we consider the forecast as a "budget" for the next year, what can be observed is that the spending was closely "within budget".

    Going by reported expenditure, the company was within 1% of expected budged for store spending in 2010 and 2% in 2011. It underspent for the years 2006 through 2009, though again, but modest amounts.

    What this suggests to me is that store roll-outs are predictable for Apple. The costs involved are also quite predictable and things seem to be happening on schedule. The retail expansion is a steady slog.

    The next chart does the same comparison but with Machinery and Equipment and Real Estate.
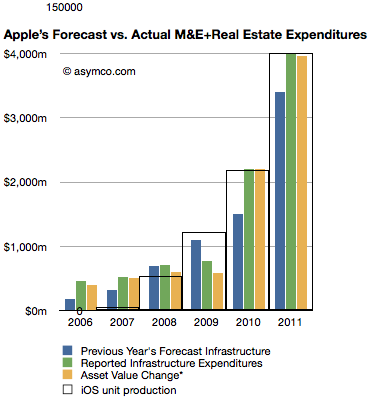
    Here the story is different. The company has typically over-spent what it forecast.

    Here are the "deficits" for this asset class by fiscal year:

    • 2006: 154%
    • 2007: 68%
    • 2008: 0%
    • 2009: -30% (surplus)
    • 2010: 47%
    • 2011: 18%

    This suggests that unlike retail, production for Apple has been far less predictable and that the predictions for spending were mostly lower than actuals. It might imply that production was higher than expected as well.

    What this analysis suggests overall is that although production (and spending) are increasing, the rate of increase is a bit higher than what Apple expects a year in advance. Some of that might be due to increased costs, but some may be due to changes in capacity.

    Note the iOS unit production "wireframe" bar chart overlaid on the expenditure chart. As with quarterly data, the yearly (fiscal) production ramps remarkably consistently with M&E expansion.
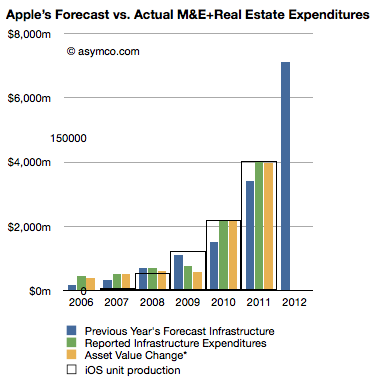
    Looking forward, the company predicts $8 billion in PP&E, exactly twice what it forecast last year. Retail expansion is forecast at $900 million an increase of 50% and "Infrastructure" (M&E) increase of 110% to $7.1 billion.

    Knowing that Apple tends to over-spend on M&E, we can assume that they will at least double spending on machinery and equipment. Knowing further that increase in M&E spending correlates to iOS device production (see chart at left noting the inset scale marked with 150 million units), it implies that iOS device production is set to continue growing at the same rate it always has: 100%.
  2. A tale of two disruptions

    Research · 58 comments

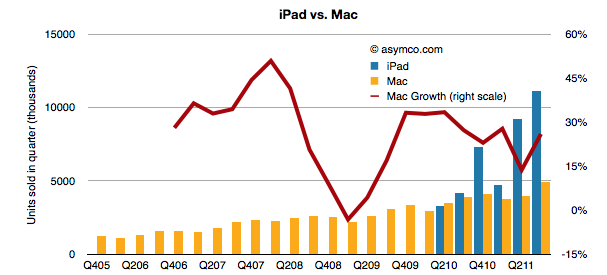
    Last quarter the iPad had unit growth of 166% with revenue growth of 146%. The iPad is selling more than twice the (also rapidly growing) Mac. The two product lines are shown below:

    A big reason the Mac is still growing is that it now consists of 74% portables and the MacBook Air and Pro products are still largely unmatched and have a near monopoly in their target price.

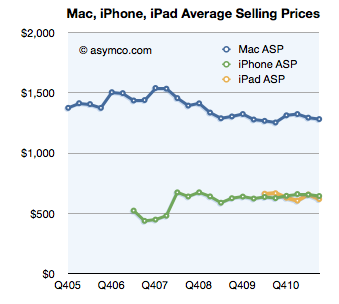
    The Mac's average selling price has remained remarkably steady for three years.

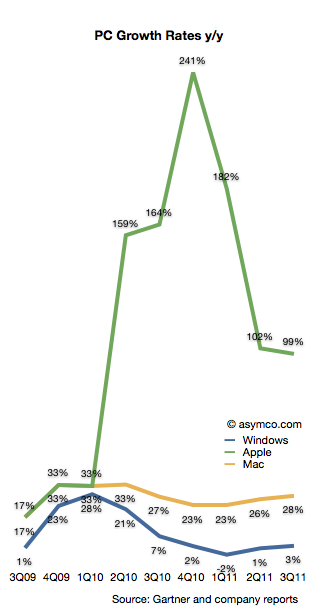
    But more importantly the iPad and the Mac both outgrew the PC market. Taken as OS X vs. Windows, the growth rates were 27.7% vs. 2.5%. If iOS is included along OS X, Apple grew its "computer" shipments at a rate of 99%.

    The following chart illustrates the growth rates for Windows, Mac and Apple as a combined OS X/iOS.

    The Windows platform still ran on 82% of PCs sold in the quarter with iOS taking second with 10.5%, OS X third with 4.7% and Android at about 3%.

    Even though Mac OS X grew faster than the overall PC market for 20+ quarters, its market share is still below 5%--lower than what the iPhone has been able to obtain in the far larger mobile phone market.

    That share has grown from 3.2% in the same quarter of 2008 but it's still a very slowly changing landscape.

    However, if we include the iPad, Apple begins to not only grow very rapidly, it moves up sharply in terms of ranking among PC vendors.

    Last quarter's 16 million OS X and iOS tablets brought it into second place behind the 16.6 million PCs that HP sold. That was enough to give Apple 15% share vs. 15.7% for HP. Over the last three years Apple has gained nearly 12 points of percentage of share.

    The other vendors mostly lost share but the most affected were the smaller OEMs. HP lost 2.6 points, Acer 3.9 and Dell 3.4. However "Other" lost 10.5 points. Lenovo is the only major vendor to gain share (+4.48 points).

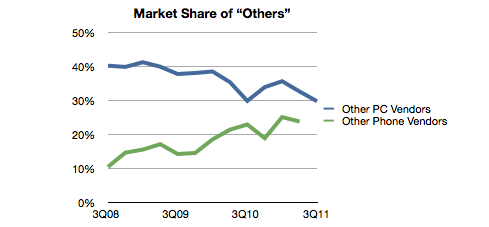
    What's interesting about this pattern is that whereas in the phone business "others" is a rapidly growing group of companies, in PCs the smaller vendors seem to be suffering. They still make up about 30% of the market but that's down from about 40% three years ago.

    In contrast, "Other" went from 15% to 24% of the phone market in the same time frame. Part of the explanation is that the entry of the iPad took the wind out of the "low end" netbooks and other cheap PCs. Consumers migrated low-end usage to a product re-built around those jobs.

    In the mobile phone market, the disruption is in the opposite direction: communication is moving rapidly up-market from real-time voice to latent messaging and from storage consumption to broadband consumption. The companies being rewarded today in the phone business are those who are leading the charge to new markets.

    In other words, on the PC, we are witnessing low-end disruption. On the mobile phone we are witnessing new market disruption. The irony is that the low end PC and the high-end mobile are very nearly the same thing but the industries, channels and incumbent business models are very different.

  3. Are Apple’s investments in PP&E extraordinary?

    Research · 34 comments

    In his recent posts Horace took a look at Apple’s fixed assets and their development over the recent years. He also tested the hypotheses that Apple is making investments into machinery & equipment on which iOS devices are produced by overlaying iOS volumes with preceding changes in property, plant and equipment (PP&E).

    The question that has arisen is: Are Apple’s investments in PP&E extraordinary?

    To answer, I have compiled the capital expenditures (CapEx) for our previously established peer group [1].

    But first we need to clarify what CapEx include and not include. CapEx includes investment into property, plants, equipment, office furniture, larger IT hardware and in some cases patents; CapEx do not include investment into long-term marketable securities or other long-term financial instruments, acquisitions or capitalized R&D. Furthermore, CapEx are gross values and are not net of any sold equipment [2]. CapEx are largely depending on a company’s business model and strategy. For example if you are a manufacturer you need equipment to operate, if you are a software company or a retailer, your business will not be capital intensive.

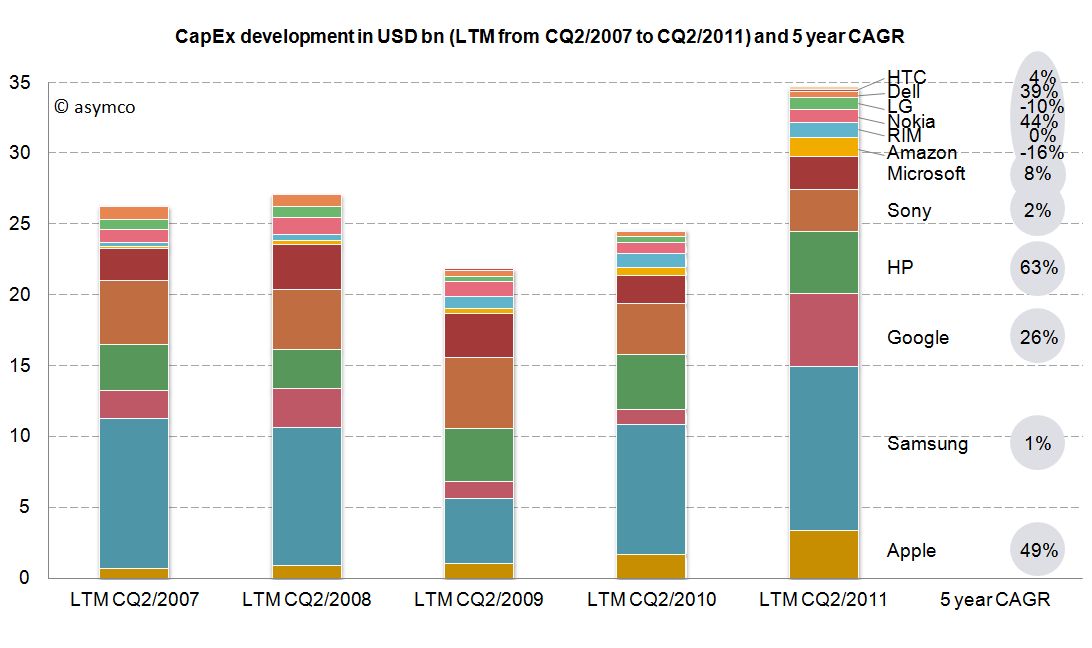
    As the second calendar quarter of 2011 is the latest quarter for which all companies have reported figures, we will take a look at last twelve months’ (LTM) figures from Q2/2011 backwards. The following stacked bar chart shows the combined CapEx of our peer group:


    The combined capital expenditures of our peer group for the LTM CQ2/2011 have outpaced even pre-crisis levels of investments and, combined, account for $34.7 billion. Samsung, a diversified manufacturer of IT hardware and other equipment, has invested more than $11.6bn with Google ($5.1bn), HP ($4.4bn) and Apple with $3.4bn following in line. While Google’s CapEx mostly account for its infrastructure of server farms and other IT hardware, HP’s CapEx mostly account for IT hardware it leases to its customers [3]. In absolute terms, Apple takes fourth place in CapEx spending for the last twelve months ending in CQ2.

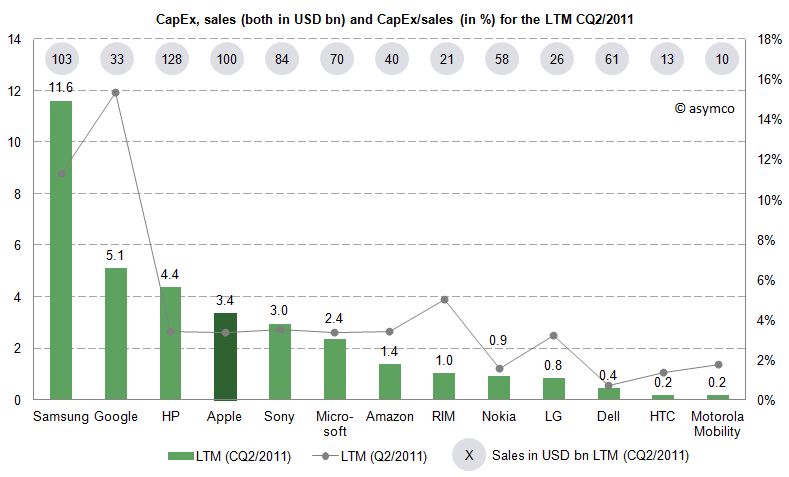
    Since the business model and sales magnitude varies largely in our peer group, we can also take a look at a common measure to compare CapEx intensity by dividing CapEx by sales achieved in the same period. For the last twelve months we can depict the following chart:


    The average of the peer group accounts for 4.4% of CapEx over sales. Samsung’s and Google’s business model are clearly more capital intensive, while Apple’s CapEx ratio of 3.4% is below the peer group average but above some of its peers like Nokia, Dell, LG, HTC or Motorola Mobility. Interestingly, capital intensity of HP, Apple, Sony, Microsoft and Amazon is at a comparable level of around 3.4%.

    As noted before, business models and strategies are significantly different among companies in our peer group. However, while Apple’s CapEx intensity is not extraordinary, Apple’s CapEx in absolute terms are among the largest in it this peer group and have grown constantly throughout a five year period.

    Is this a good thing and why does it matter?

    CapEx by itself does not tell us much. We still do not know in what companies specifically invest as financial regulations do not require detailed CapEx accounts. We know that even if a company is not growing assets they need to be maintained, upgraded and replaced – this spending is also called "Maintenance CapEx". Everything else can be called "Expansion CapEx" associated with new product launches, entry to new business area or geographies or expansion of (manufacturing) capacity.

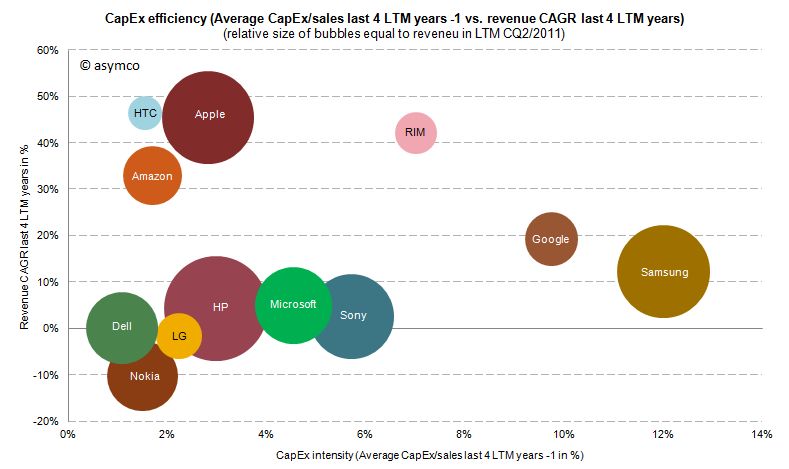
    Therefore, Expansion CapEx is closely linked to expected organic sales growth in the future. So let’s go ahead and link CapEx ratio of the previous years with the sales growth of the following year. The following chart shows the cumulative average growth rate (CAGR) over the last four years versus the average of CapEx/sales ratio of the four last preceding years:


    We can see that high CapEx efficiency has been achieved by Amazon, Apple and HTC with sales growth rates of 33-47%. RIM reached similar revenue growth but with higher CapEx intensity. Google and Samsung with high CapEx intensity have only reached modest growth rates. Dell, HP, Microsoft and Sony have not grown significantly but have close to average CapEx intensity.

    We cannot state that CapEx in absolute terms have been extraordinary for Apple, but we can witness that with below average CapEx/sales ratio Apple outgrew in absolute terms Dell, LG, Microsoft, Nokia and Sony and has grown close to the revenue size of Samsung and HP in the last four years.

    ---

    Notes:

    1. Excluding Lenovo (not reported) and Acer (extra-ordinary low numbers reported, to be investigated), Motorola Mobility figures only available for the last six quarters
    2. Minor differences may occur due to local Generally Accepted Accounting Principles (GAAP)
    3. HP assumes ownership of these assets and rents them to the customers who in turn have a smaller balance sheet and can run IT hardware CapEx through the income statement as lease expenses
  4. How much do Apple's factories cost?

    Research · 88 comments

    In the last two posts (How much does an Apple store cost?, The down payment on iCloud) I discussed two line items in the PP&E asset class on Apple's Balance Sheet. In isolation, the data is interesting as it gives us an idea of the cost structure of stores and facilities being developed to sustain its current business model. In aggregate, it provides insight into Apple's strategic intent.

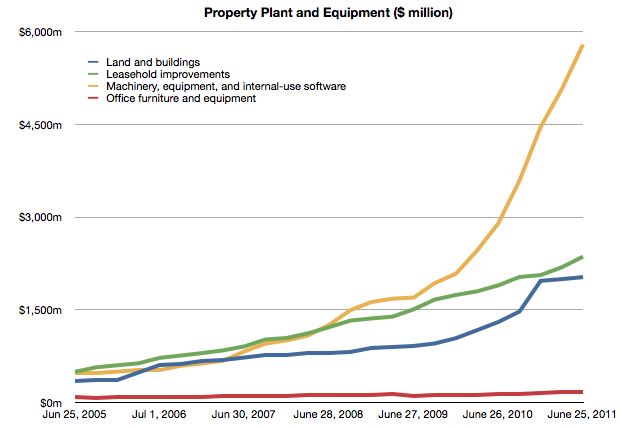
    To complete the picture, I will look at the third asset: "Machinery, equipment and internal use software." It's the yellow line in the chart below:

    It's plain to see at first glance that it's the most significant asset. What does it represent and what conclusions can we draw about Apple's strategy?

    Before I begin, I should make clear what this asset represents and what it does not represent. These expenditures cover equipment used in production. They do not include components used in the production nor loans to suppliers for purchasing equipment. These are fixed assets that can be depreciated on a schedule and have specific tax treatment as a result. These are, in plain language, instruments used for producing things to be sold. They are things Apple owns.[1]

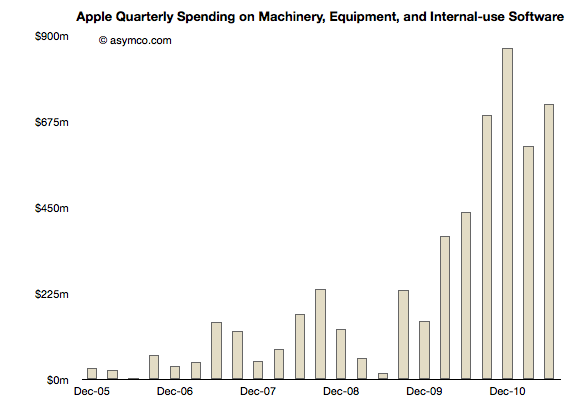
    Using the same method as in the other asset analyses I took a measure of the sequential change in that asset over the time period and tried to see if there is a correlation between that spending and some other measure of output from the company.

    Here is the sequential change chart since the end of 2005:

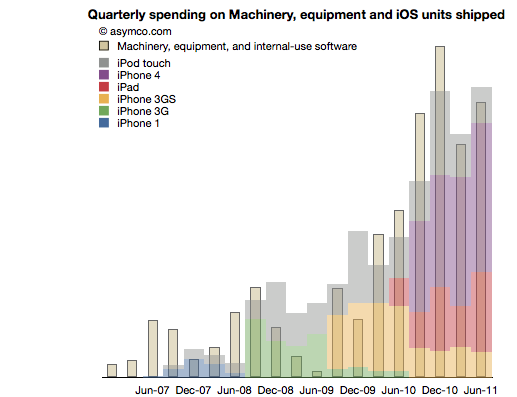
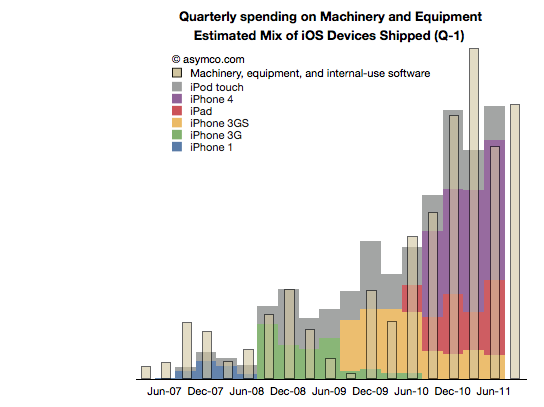
    I noted that the pattern seems to relate closely with the increase in shipments of iPhones. More specifically, iOS devices. To test this I overlaid the overall volumes (with estimates of product types) of iOS shipments. This is a modified version of the chart published here.

    There is a broad similarity. But again, as in the other analyses, the spending on assets typically predates the "output" from that asset. As we saw in land and buildings, the operational start of a facility may happen many quarters after the purchase is made. Similarly, stores open some time after the spending on fitting them out.

    So it is with Machinery and Equipment. If we time-shift the output one quarter to account for spending before production we have a better fit (note the change in the title with "Q-1" indicating that the dates for the iOS shipments are offset by 1 quarter to the left).

    We can even take the analysis further by breaking the spending and output into Phases corresponding to specific product cycles and introductions.

    Phase 1: The original iPhone

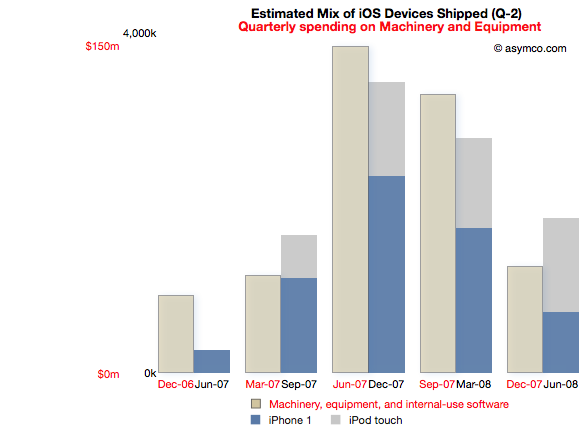
    Spending on M&E prior to the iPhone launch began two quarters in advance of sales. The following chart reflects this delay. Note that the M&E payments are marked with quarters ending six months earlier than the shipment schedule. Note also the scale (red denoting the M&E spending and black the units shipped). I also separated the two product types  (iPod touch are my estimates, iPhone numbers are published by Apple).

    This Phase corresponds to the first "bump" in the expenditure chart but offers more detail. There is an evident relationship between the "input" expense and the "output" of units shipped.

    The cost of Phase I was $408 million.

    Phase II: The iPhone 3G series

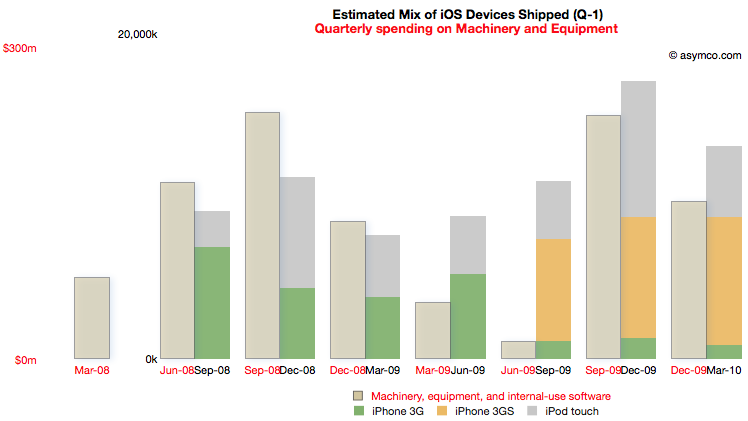
    Phase II covers spending from the quarter ending March '08 to December '09 and production from September '08 to March '10.

    For this Phase the time shift is only one quarter but there is a quarter's worth of spending that is initiated prior to any shipments. I chose to demarcate this Phase to cover production for both the 3G and 3GS as they probably shared a lot of common equipment. Some spending on new production lines however still had to happen as volumes increased during 3GS production.

    Note the scale change from the first Phase. Whereas the maximum in Phase I spending was around $150 million per quarter, the peak is nearly twice as much in the second Phase. The peak output is 5x higher.

    The cost of Phase II was $1 billion.

    [I had to guess whether the Sep 09 and Dec 09 M&E spending was for 3GS or whether it was to prepare for the ramps in the new products about to be launched in the third Phase.]

    Phase III: The iPhone 4 and the iPad

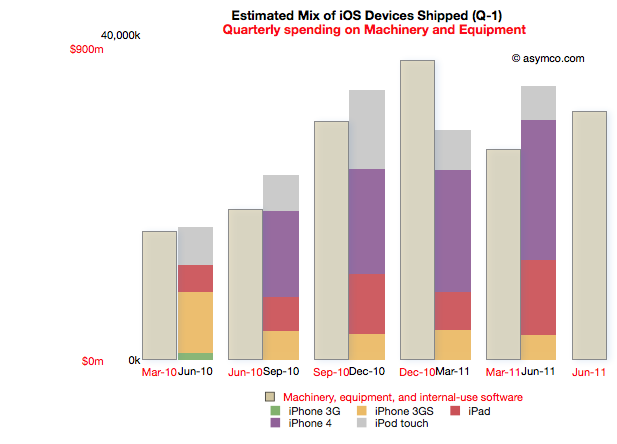
    Phase III begins with spending prior to the launch of the iPad 1 (March '10) to the last quarter (ending June 2011). Coupled to this is production starting in quarter ending June '10 and ending in the last quarter.

    Note that due to the time offsetting on production, the output from the spending on the quarter just ended will not be known until Apple publishes their shipments for the June quarter (scheduled for October 18th).

    The relationship between pre-dated spending and production one quarter later holds quite well. There is a "surplus" of spending in December 2010 but that could be seen as the ramp being prepared for the second iPad.

    Phase III cost is $3.7 billion so far.

    Note again the change in scale from the previous two Phases. Peak M&E expenditures are around $900 million per quarter while production peaks at around 35 million units. This is a tripling of spending coupled to about a doubling of output.

    Observations

    The data suggests spending on equipment is correlated with the volume of production of its iOS devices.  However, Apple is understood to be a company that outsources its production and does not "own" its own factories. Claiming that it keeps equipment used in the production of iOS devices on its books is an extraordinary claim.

    I make a further claim that the scope of spending itself is extraordinary.

    The following chart shows the three asset classes discussed in the three latest posts relative to each other (quarterly change in asset value).

    In How much does an Apple store cost? I noted that the spending on leasehold improvements of $2 billion over a few years is significant and sustaining and largely asymmetric to competitors. You can see that spending in the grey bars above.

    In The down payment on iCloud I noted that spending on Land and Buildings is significant and sustaining to iOS but not on a scale many can match. Those costs are shown in the blue bars above.

    If, as I claim here, the yellow bars show the spending on Machinery and Equipment used in the production of iOS devices, then the commitment Apple has made to controlling production is even higher. In December 2010, M&E expenses were 50% higher than the spending on the data center and the new Cupertino campus put together.

    The M&E assets have cost a total of $6 billion. The Apple stores have cost $2.3 billion and land and buildings $2 billion.  In other words, Apple's machinery and equipment is worth much more than all its buildings and stores put together.

    Compared with what Apple spends on other fixed assets, M&E is spectacularly significant.

    In the twelve months ended June, Apple will have spent $2.9 billion in M&E to manufacture 118 million iOS devices. To put that in perspective, Nokia, which manufacturers a large (if not majority) of the 340 million phones it sells, expects full year 2011 capital expenditures of $1.1 billion.

    Correcting for amortization and depreciation and deducting some spending on Mac M&E, it's very likely that Apple spent twice as much as Nokia on the instruments of production for one third the number of devices.

    Conclusions

    It may be too early to draw conclusions from this analysis. The claims should be debated and the claims should be tested, but I can suggest some tentative strategic implications.

    Last December I wrote that I thought Apple should use its capital to own the means of production for iOS. I reasoned that device supply was its biggest deficiency and that perhaps ownership would allow them to become better at it.

    Indeed, Apple has used capital to ensure it has better control over the supply of components and to also perhaps ensure capacity of production of those components.

    But this analysis shows that Apple has gone much further toward integrating its value chain. It suggests that a large part of the tooling in its supply chain is owned by Apple. It suggests that those tools are put out of reach of its competitors.

    The implications could be profound but given the length of this post, I'll leave that discussion for another day.

    ---

    Notes:

    1. Some of the capital expenditures were also allocated to servers or "information systems hardware, software and enhancements." From the Annual Report 2010:
      Capital Assets. The Company anticipates utilizing approximately $4.0 billion for capital expenditures during 2011, including approximately $600 million for retail store facilities and approximately $3.4 billion for product tooling and manufacturing process equipment, and corporate facilities and infrastructure, including information systems hardware, software and enhancements.
  5. iOS vs. Microsoft: Comparing the bottom lines

    Research · 60 comments

    I began comparing Microsoft and Apple's financial performance with a review of "top line" or revenues by product lines over a four year period.

    This post is about the "bottom line" for the same companies and products.

    Before I jump in I would like to make sure there is no confusion about the terms. I will be comparing "operating income"[1] as a measure of "bottom line". This is a common way to compare the profitability of companies because it excludes taxes and interest income. These non-operating expenses/income can distort a comparison of performance because they can be the result of investment activity or changes in tax law or where the company is domiciled. One should not make judgements of comparative performance on those non-operational bases.[2]

    Another challenge is that some companies report operating income by division while others don't. We can usually compare overall operating income but usually not on a division or product-level. This is the challenge I will try to overcome in this analysis between two very different operating models.

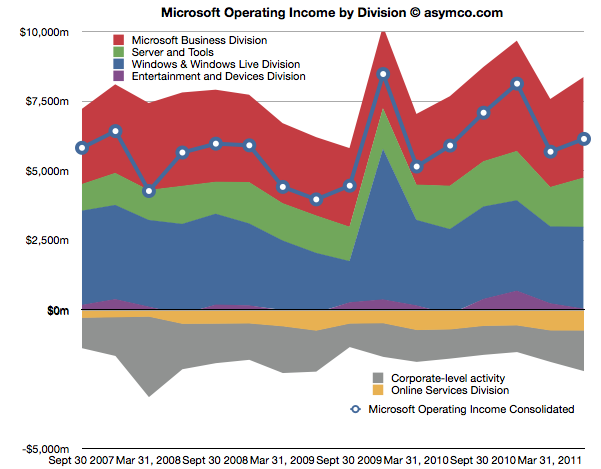
    The first chart shows Microsoft's Operating Income by Division as reported by the company.

    Each area represents a business division. Note some are showing negative income (losses).I've added a line representing consolidated operating income which is the sum of all areas (including the negatives).

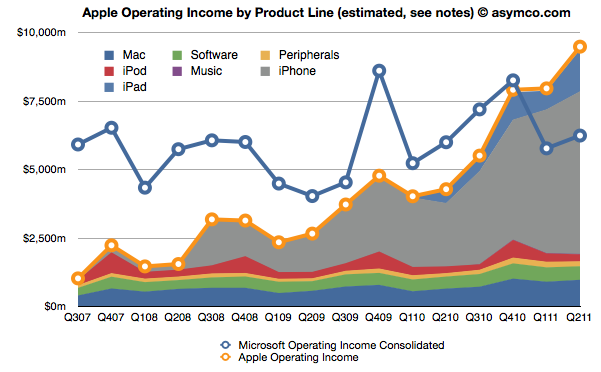
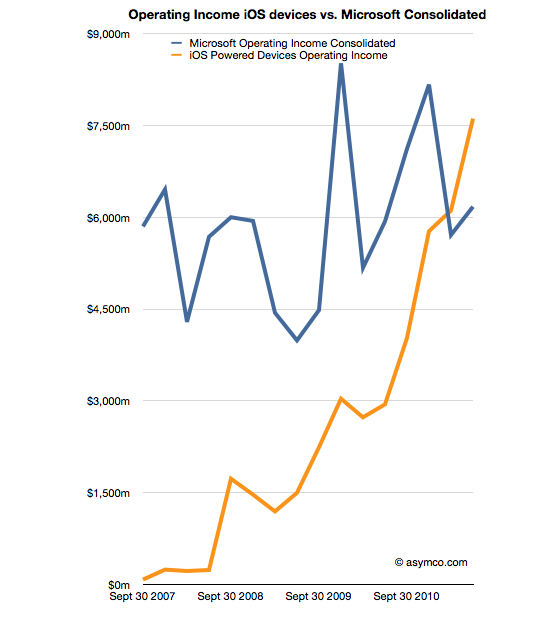
    The same line from the chart above is super-imposed on the chart below and is comparable to the orange line that represents the operating income that Apple was able to obtain over the same time frame. Note that both axes are using the same scale.

    The Blue and Orange lines are indisputable but the allocation of the areas under the orange line may be open to debate.

    As Apple does not report a break-down of each product line or division, getting the areas in the Apple chart is a matter of analysis and estimation. The method I used was to estimate gross margins per product (the overall gross margin is known) and assigning a portion of OPEX (also known) in a ratio equal to the sales level of that product. [3][4]

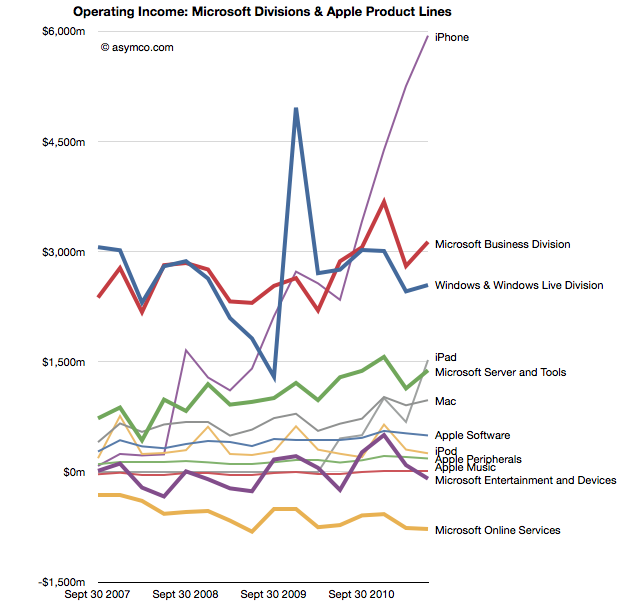
    To make the contrast sharper (though more cluttered), I took all operating incomes from all product lines and divisions of both companies and laid them out as time series line charts in the following chart. I allocated Corporate Level Activity as an expense proportionate to each business unit in a ratio proportional to its sales. This allows comparison of product lines individually.


    Finally, I combined all the iOS product lines (iPhone, iPad and iPod touch est.) as one line and laid it alongside overall Microsoft Operating Income (consolidated).

    The second chart in this post showed that Apple has reached higher operational profitability than Microsoft by the end of last year. This fourth chart shows that iOS products combined are more profitable than Microsoft as a whole.

    Microsoft invented the software business and built it to become the world's most valuable business by the year 2000. It's still been growing since and after 35 years it is reaching a profit of $27 billion per year. It did this while maintaining enormous margins and a highly disruptive monopoly business model the likes of which the world had never seen before.

    It is scarcely believable then that a device business has been created to overtake it in four years.

    ---

    Notes:

    1. The operating income is almost the same as EBIT  which is explained here: Earnings before interest and taxes - Wikipedia, the free encyclopedia.
    2. On the other hand, one should not use Gross Margins alone. The crucial difference between Gross Margin (Sales Revenue - Cost of Goods Sold or COGS) and Operating Income is that fixed costs are also accounted for. These fixed costs are typically Selling, General and Administrative Expenses and Research and Development Expenses (commonly summarized as Operational Expenses or OPEX) which can be allocated to a particular business or division. For different business models, gross margins can be widely different. In the case of Microsoft for example, software has negligible direct variable costs. A CD or download is of tiny cost compared to the price of the license to use it. As a result software often has 80% gross margins. Hardware on the other hand can have very thin margins in single digits (e.g. PCs). Conversely, Microsoft will have very high fixed costs to pay for developers, product management and sales forces. A hardware vendor may have few engineers and sales could be handled through resellers. Thus Microsoft will have very high OPEX and a PC company will have very low OPEX.
    3. So, for example, In Q2 '11 the iPad had an estimated gross margin of $2.06 billion (which assumed 34% margin on published revenues of $6.06bn). As it also was 21% of total revenues that quarter, I assigned 21% of OPEX to the iPad. That means 21% of $2.54bn or $540 million was the operational expense allocated to the iPad. This results in operational income estimate of $1.52bn for the iPad in Q2.
    4. To summarize, the assumptions this estimate depends on are gross margin estimates and the allocation of OPEX in proportion to sales. Gross margin analysis has been a matter of iteration and peer review for some time and I'm fairly confident in my estimates. The allocation of OPEX is more arbitrary. Chances are that these expenses vary greatly with each quarter where more work is done nearer to launch of a new product and less in late season. If there are better methods available to allocate expenses by product, I'm open to suggestion.
  6. The perils of possession without utilization

    Research · 184 comments

    [Updated with new charts including data from StatCounter and not NetMarketshare]

    Generally speaking there is an equivalence drawn between iOS and Android as technologies and even as user experiences. However, as I've pointed out on several occasions there is a very clear nonequivalence in business models and thus the "fuel" which keeps each platform running. But does this difference in models lead to some difference in the way the products are "hired" to do what they do. Does it imply anything about how the products are likely to evolve?

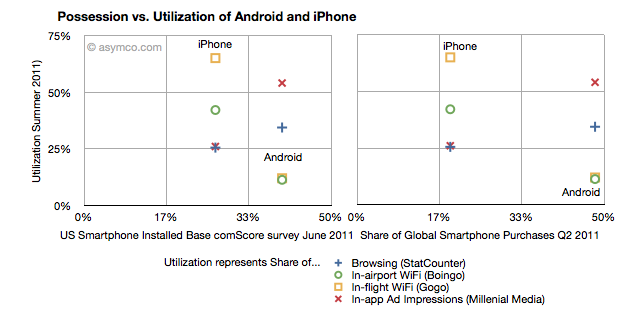
    I collected into one place all the data I could find about utilization (how much of a service and how often it's used) and possession (both in terms of current ownership and new acquisitions) of iOS and Android.

    Possession data comes from comScore survey data of share of US installed base of smartphones by platform at the end of June 2011 (first chart) and share of Global Smartphone Purchases as of Q2 2011 sourced from company reports and IDC (second chart).

    Utilization data (vertical axes) comes from August  2011 shares of mobile browsers (from StatCounter June 2011), in-airport WiFi associations from Boingo in June 2011 (iPhone vs. Android), in-flight Wifi associations from Gogo in June 2011,  and In-app Ad impressions from Millenial Media also in June.

    The charts are divided into nine sections corresponding roughly to "low", "medium" and "high" utilization vs. possession.

    The first chart compares a US-only population for possession vs. a mixture of global and US-only populations for utilization. The second chart compares a global population to the mix of US and global metrics.

    What I found interesting is that if we take ad impressions (red X) and browsing (blue +) data out, the two platforms are indeed quite distinct. iPhone has a medium level of possession with a high level of utilization of data services while Android has a high level of possession with a low level of utilization. The data is also nicely clustered.

    If we take just the ad impression or browser data then the platforms are quite similar: medium utilization for medium possession and high utilization for high possession. If the two platforms were to swap places in possession (i.e. market share) then they would probably also swap places in utilization (i.e. impressions).

    What the data seems to suggest therefore is that for data services the iPhone is a far more popular tool than Android. But for in-app ad impressions and browsing the products are used in a similar manner.

    The big difference is however that the services where iPhone utilization is high are those where users have to pay something. Most (if not all) of the ad impressions in apps are for free apps. So ad consumption scales with possession. But non-free services don't. This data seems to support the hypothesis that Android users are disproportionately less willing to spend money (note that the data does not say that users don't have money, but simply that they are not spending it). The other data which backs this hypothesis is that paid app sales on Android trail quite far behind the rate of purchase on iPhone. That could be due to payment problems in the Android marketplace but this data shows that there is some other effect as well.

    Why is this important?

    We can argue that Android is a low end product and that it disrupts and that this is consistent with that positioning. However it also indicates that the value is not in that ecosystem. And ecosystems are what sustain a platform in the long term. This debate will continue but I am reminded of other platforms which had similar patterns.

    Both the Blackberry and Symbian had high possession (in terms of share) with very low utilization. There were lots of surveys which showed that browsing, app downloads and "monetization" of services after the sale of the handset were low. Much was written about it being due to poor experiences. But learned observers today insist that the experience on Android is as good as on the iPhone.

    So why is there less economic participation from Android users? It's not just about these proxy services, but all manner of activities which enrich an ecosystem. Possession without utilization implies a product that does not do its job. Its features are not being absorbed. Why would that be?


  7. OS turning circles: Questioning Windows' maneuverability

    Podcast · 137 comments

    [Updated with Mac OS versions. See footnote 3.]

    I'm glad Windows 8 is named the way it is. With Windows 7 Microsoft went to a numbering system which is much more rational than the mixed naming of the past. The number 8 actually corresponds to the actual sequential number of major versions of Windows released to date.

    Windows proper actually did not start with what was called "Windows 1.0". Windows actually started in April 1992 when Windows 3.1 was released. It was the first Windows which was an operating environment onto itself, apart from DOS. It was followed by Windows 95 (which we can call "2"), Windows 98 ("3"), Windows 2000 ("4"), Windows XP ("5"), Windows Vista ("6"), Windows 7 and now Windows 8.

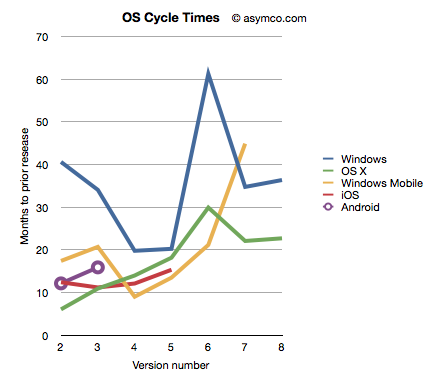
    Given this nomenclature and the dates of general availability of said versions, we can derive a measure of the frequency of upgrades. For example Windows "2" followed about 41 months after "1" and "3" took 34 months after "2". If we continue this for all the versions, and assume "8" will launch by October next year, we can plot the cycle times of new Windows versions.

    To make the story more interesting I added the same data for other OS platforms. OS X, iOS and Android have version numbers which correspond to the sequential order in which they were released. I am assuming that the numbering system (1.0, 2.0, 3.0 etc.) are meaningful and that major releases are given a new integer value.[1]

    I also added Windows Mobile which suffered from the same confused numbering that Windows suffered until the current Windows Phone 7. To create a map to integer values I used the following: Pocket PC 2000 is "1", Pocket PC 2002 is "2", WinMo 2003 is "3", WinMo 2003 SE is "4", WinMo 5 is "5", WinMo 6 is "6" and Windows Phone 7 is "7". There is no clarity when and what Windows Phone 8 will be so that is left off the chart.

    The chart above does give a clue that Windows is a bit slower (more months between releases) than alternatives. However, the point I want to convey is that this cycle time can be a strategic advantage. A faster upgrade cycle means more rapid adoption of improvements, not to mention more revenues. Rather than a line chart, the better way to visualize it is as a turning circle.

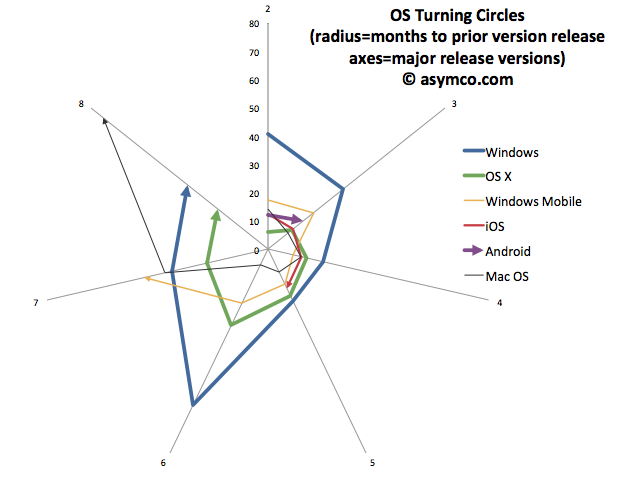
    The analogy is from aerial combat where a plane that can "turn inside" an opponent can get into a firing position. The tightness of turning circles also means that a competitor can iterate more quickly and thus move up the trajectory of improvements necessary to remain competitive more rapidly. To that end, I re-plotted the data above with radial axes.

    The chart clearly shows how among desktops, OS X has been tighter than Windows[3]. Furthermore, mobile OS's have been, typically, more agile than desktop OS's. The exception being Windows Mobile which had significant architectural and business model challenges. It will be interesting to watch the radius of Android. So far it seems to be tight, but as tablet functionality has been added, the speed of change has slowed slightly.

    However, the big contrast is between mobile and desktop. Microsoft tries with Windows 8 to merge the two. But these are different ecosystems. Buyers, OEMs, users, all have different behavioral patterns (jobs-to-be-done) for mobile OS vs. desktop/portables. Will the cycle time for Windows 9 and Windows 10 tighten up? Can Microsoft operate its OS division at this new cycle time?

    What is even more bad news is that the most important customers for Microsoft, enterprises, actually upgrade every other version. The Windows "radius" is nominally averaging about 35 months but large account adoption is closer to 60 months.

    The contrast is then striking: Consumerized devices with over-the-air updates on a 12 month cycle are five times more agile than a traditional corporate Windows desktop. Another way to look at this is that for every change in a corporate desktop environment, the average user will change their device experience five times. Although Microsoft might find comfort in Enterprises' leisurely pace of change[2], those are the wrong customers to keep happy going forward.

    The implications are left as an exercise to the reader, but I would argue that along with the asymmetry in business model around pricing that I highlighted in the last Critical Path podcast, Microsoft has a significant operational asymmetry with devices as a new class of computers.

    ---

    Notes:

    1. The dates of general availability of various versions of operating systems.


      Version
      Windows
      OS X
      Windows Mobile
      iOS
      Android
      1
      4/6/92
      3/24/01
      4/19/00
      6/29/07
      10/21/08
      2
      8/24/95
      9/25/01
      10/1/01
      7/11/08
      10/26/09
      3
      6/25/98
      8/24/02
      6/23/03
      6/17/09
      2/22/11
      4
      2/17/00
      10/24/03
      3/24/04
      6/21/10
      5
      10/25/01
      4/29/05
      5/9/05
      10/1/11
      6
      11/30/06
      10/26/07
      2/12/07
      7
      10/22/09
      8/28/09
      11/8/10
      8
      11/1/12
      7/20/11
       
    2. While at Nokia's Enterprise Solutions I was witness to this difference between the cycle time of devices and the pace of adoption of Enterprises. The fundamental disconnect was that the sales cycle for a "solution" was longer than the shelf life of a device upon which that solution was predicated. Needless to say, Nokia Enterprise Solutions did not last long. Nor do we see today any significant Enterprise-focused mobile device businesses (RIM itself moved to consumerize its products years ago.)
    3. I added Mac OS data to the second chart to also illustrate that no company is immune from spinning out of control. Mac OS clearly went spun out after version 6 with increasing delays leading to its demise and replacement. You can also note that its replacement (OS X) was able to straighten-up and fly right. The lesson may be perhaps that ditching and starting over is a viable option.
  8. The fate of mobile phone brands

    Research · 99 comments

    The violence with which new platforms have displaced incumbent mobile vendor fortunes continues to surprise.

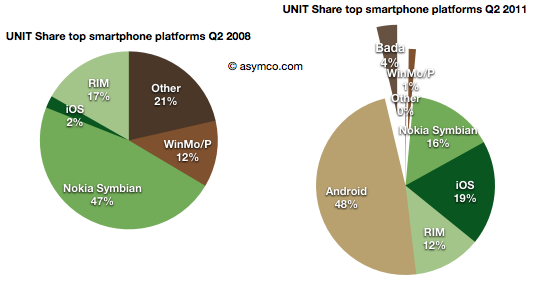
    • Nokia's Symbian platform has gone from 47% share to 16% in three years
    • Microsoft's phone platforms have gone from 12% to 1%
    • Other platforms have gone from 21% to zero
    • Although far less dramatic, RIM's decline from 17% to 12%  is causing acute pain and anxiety

    This while entrants have grown share in spectacular fashion:

    • Android from zero to 48% (A two year period)
    • iOS from 2% to 19%
    • Bada from zero to 4% (two quarters only)


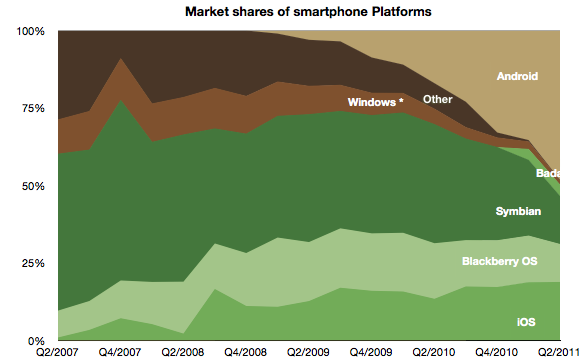
    The picture of platform share over time looks like this:


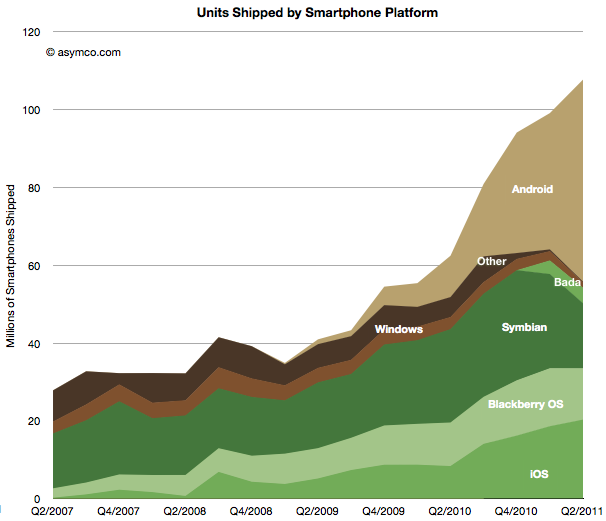
    The platform volume growth is shown in the following graph:

    Shocking

    Or is it?

    The surprising thing is that it should not be surprising. When the iPhone re-defined the basis of competition (at the beginning of the time frame of these charts) it unleashed forces which are still spinning the industry into a new configuration.

    In that context, Android is a natural consequence. As iPhone created a threat, the response from all other vendors (other than Nokia and RIM) was to seek something that would sustain their business. Android was salvation.

    It enabled the pursuit of better margins and hence better returns. So much so that Android offers the escape up-market they have always sought. It enables vendors to abandon the profit-free feature phones to low-end entrants like ZTE and Huawei.

    LG, Samsung, Motorola and Sony Ericsson all took the bait. They are racing as quickly as possible to turn their feature phone portfolios into Android portfolios. This is certainly something that Google also wants to see happen and has been planning all along.

    However one of the consequences of the modular (aka "open") approach is that the low end disruptors gobbling up low-end share are also motivated to move into the Android business as soon as it comes within reach.  The only reliably predictable consequence of Android will be the postponement of displacement of the existing brands by the low-end entrants.

    Is this fate unavoidable for all brands?

    Clearly some vendors see the trap. For all its apparent failings, Nokia saw this outcome and chose to attempt a "Hail Mary Pass" with Microsoft. The strategic point being that because they no longer had faith in their ability to execute on an independent platform, they would pick a platform that gave them at least some control or leverage. There are serious risks and problems with this approach--something which has been covered here already--but the bet being made is a clear rejection of the slippery Android slope.

    RIM is trying to resist with QNX which is a similar approach but timing may also be the undoing of this strategy. HP's approach with WebOS and Samsung's Bada are also hedges to avoid this fate.

    And what about Apple?

    Apple is always skating in a different direction. iOS needs to be seen as not so much a phone platform but a computing platform. Given what we know, iOS was always conceived as the future of computing. Voice, after all, is just an app on iOS. So my expectation is that Apple's iOS will continue its attack on the mobile computing market, skimming (or carving as the case may be) profits from the phone business to sustain its ultimate target of reclaiming the computing universe.

    By this thinking iOS lives only by improving more rapidly than anything else in dimensions that redefine the basis of performance. In other words, doing more of what the iPhone did in the first place to set off this disruption.

  9. The Frontiers of Platform Adoption

    Research · 46 comments

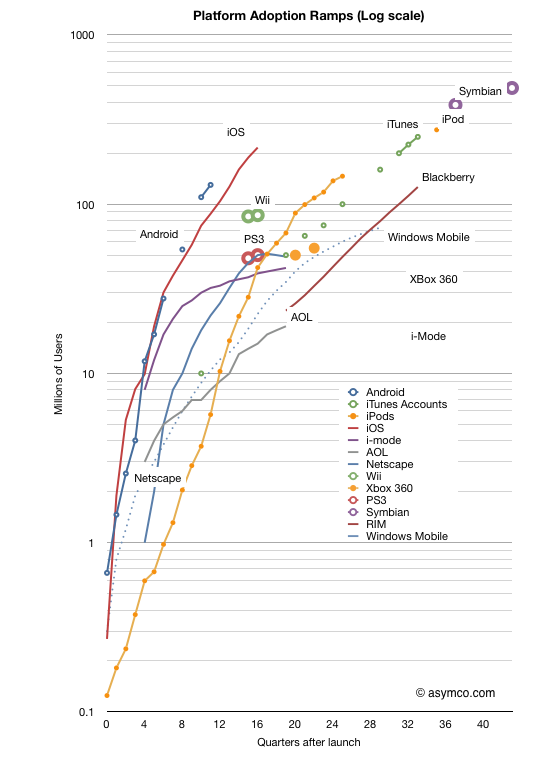
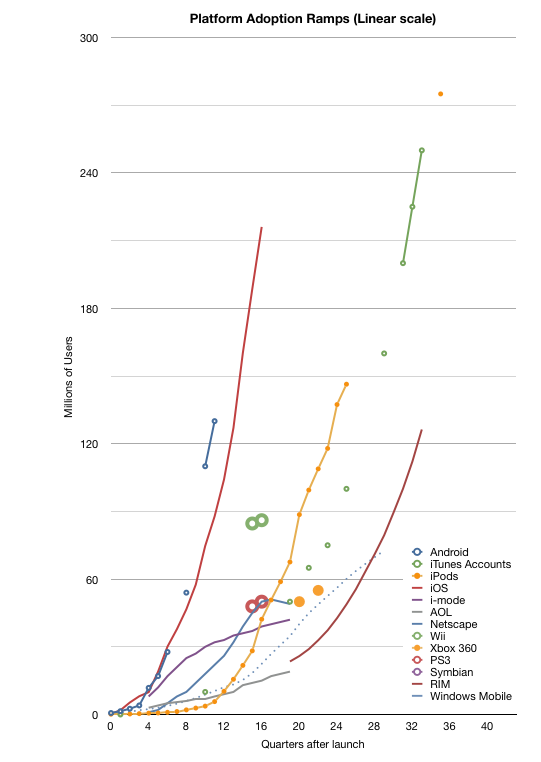
    In the last two weeks we received two more data points which allow an update to the "race to a billion" platform growth trajectories. Android reached 130 million active users and iOS reached 200 million.

    The updated picture looks like this:

    Note again that this is a log scale graph. Every major horizontal gridline is an order of magnitude (10x) larger than the one below. It's a busy graph. The linear version follows:

    For the detail-minded, it makes for some interesting comparisons, but I want to create a more compelling visualization. One where each platform can be judged for potential and impact at a glance.

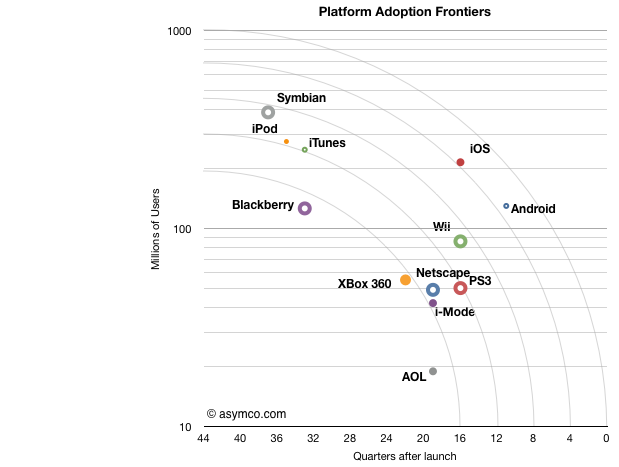
    To that end I came up with something I call the platform "adoption frontier" view. Based loosely on the Pareto efficiency concept the chart is reduced to show the latest known figure of (users,time) and overlay concentric arcs centered on 10 million/10 years and radii of unit years (x-axis).

    Note that the time axis is reversed from the chart above. This was to allow the best performers to be shown at the upper-right of the chart.

    The way to read this is as follows:

    • Each platform is represented by a point which shows its currently known peak in users and time to reach that number of users.[1]
    • The arcs (frontiers) represent possible performance classes.
    • The lowest frontier spans "four years to reach 10 million" to "10 years to reach 200 million". The highest frontier spans "<1 year to reach 10 million users" to "10 years to reach 1 billion users". Each frontier can be read in a similar way.
    • The main assumption is that a platform can reach more users but it takes time. Better performance is when a platform moves toward a frontier further from the origin.[2]
    • I chose the limits of the chart specifically: 10 years is roughly the limit of most platforms[3] in the current cycle time of technology disruption; One billion users is an upper bound set by Windows.

    One thing you can read from the chart is to say that "from a growth point of view, Blackberry is weaker than any of the other platforms." Sitting below the lowest frontier with fewer users than Android which has been in the market for less than a third of the time it seems to be less impressive. It is, however, in a similar band of growth as Xbox 360, which, by some measures, is a success story. So the performance standard is relative.

    One can also see the rough equivalence in growth between iPod and Symbian, both having crossed the second frontier. But iOS and Android are in a different league. They sit alone beyond the fourth frontier. The fifth frontier is the "billion user in a decade" potential and it seems within reach for both.

    What this view also offers is an answer to the question of competitiveness. Although platforms can co-exist and don't necessarily overlap, the question of becoming overwhelmed with "good enough" by widespread low end alternatives looms for the specialized platforms. For example, game consoles look very vulnerable because they simply do not have the potential to cross high frontiers and orders of magnitude of casual gamers (with potential TV connected devices) might orphan the consoles.

    I've also included some platforms that have peaked and faded (AOL and i-Mode and Netscape) as a warning. The frontiers illustrate of how hard it is to reach the upper limits of growth. Each level is exponentially more difficult than the last and achieving it with paying customers is a remarkable story of value creation.

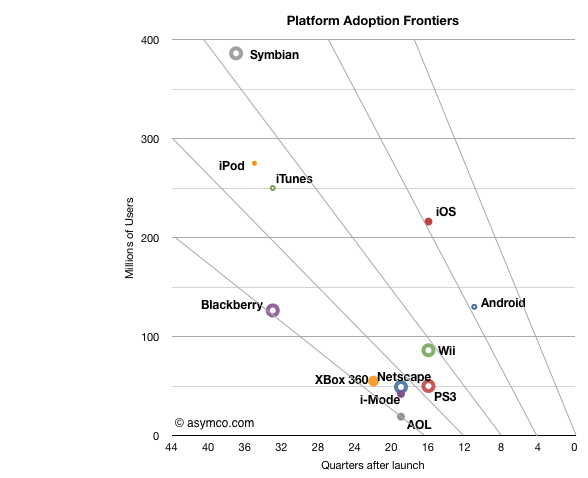
    [UPDATE]

    I add below the frontier chart with a linear vertical axis. Note that the frontier lines are not equivalent to the frontier arcs in terms of coverage.

    ---

    Note:

    1. The data I have is for platforms where users have to pay something to participate. I exclude platforms where users are the only merchandise being sold (i.e. social networks or email provision).
    2. I only include the initial ramps not upgrades. Windows is anomalous because it is so old. During its first decade (1985 to 1995) it reached over 17 million users but placing it on this chart does not do it justice given the growth occurred in its second decade.
    3. See Symbian and Windows Mobile. However again, Windows which is nearly 30 years old, is an exception.


  10. Is the tablet computer a new PC or post-PC?

    Research · 60 comments

    Steve Ballmer stated and Andy Lees confirmed that Microsoft views iPad and other tablets as "just PCs". From a market measurement point of view Canalys agrees. IDC and Gartner don't, calling the new devices "media tablets."

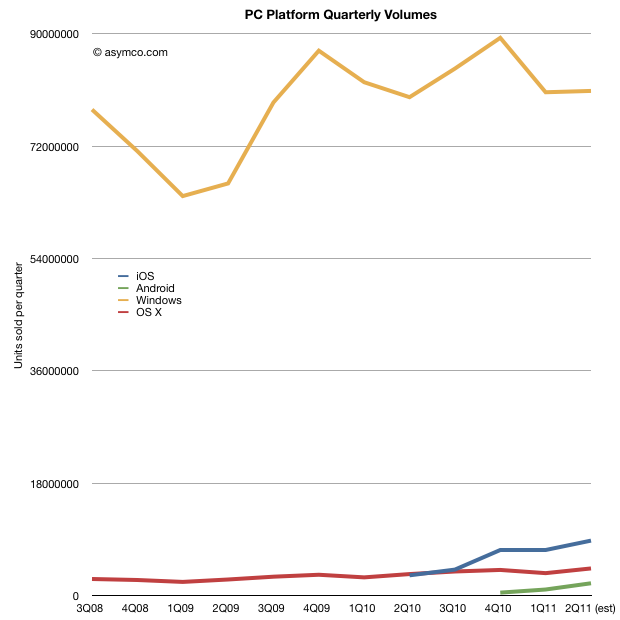
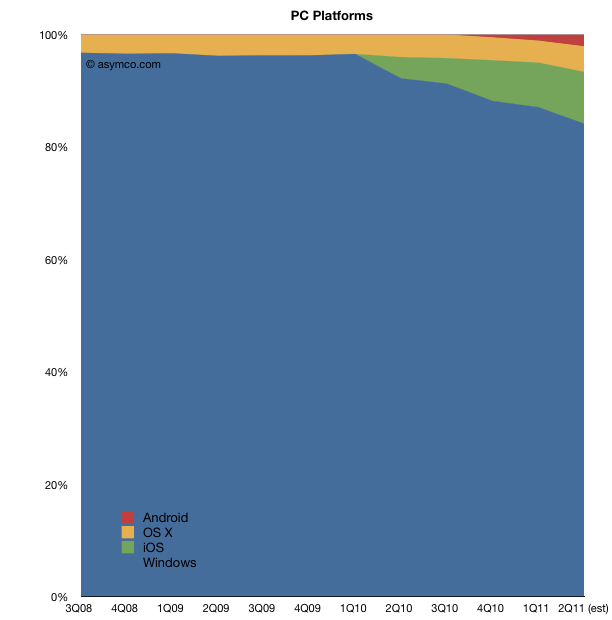
    Before deciding whether tablets belong with PCs in market metrics, it would be interesting to look at what the data shows. When seen as a combined market, the focus should be on platforms. The following chart shows the four main PC+tablet platform volumes since late 2008 [1].

    The second chart shows the same data as share of total market:

    This comparison allows for some fresh observations:

    1. Excluding iPads, Apple is very close to being 5th largest global PC vendor. Global share likely to be above 5%. Including iPads, Apple would be 2nd.
    2. Platform year-on-year growth was Windows: +1.3%, OS X: +26%, iOS: +170%. Android growth cannot yet be measured since Android tablets have not been on the market for more than 1 year.
    3. In Q2 2011 one million more Windows PCs were sold than in Q2 2010. In same time, 903k more OS X PCs and 5.5 million more iPads.
    4. Excluding tablets, nearly 50% of the global PC growth was due to the Mac. Including iPad, Apple was responsible for ~70% of the growth in the PC market in Q2.

    The picture that emerges is that while Windows continues to be dominant with 84% of units sold in the last quarter, the growth belongs to tablets which captured about 90% of it. If Windows remains marginal on tablets, the "PC market" will likely tip away from Microsoft in two years (depending on how quickly Apple can build iPads.)

    Microsoft is making the commitment to move Windows to a tablet form factor but they are doing it while retaining the user interaction model of a desktop. This may or may not work but they are also conceding that a separate experience is also necessary. By rejecting the notion that a mobile OS alone can do the job, they are essentially building a "hybrid" tablet/laptop/desktop product which may be challenging to use but preserve their presence in the form factor.

    Whether Microsoft succeeds or not will depend on whether the new form factor is disruptive in more than user experience. In other words whether this is just a "new PC" or a "post-PC". The argument comes down to business model changes. For example the new model comes with different cycle time of product development (deep, integrated, yearly changes), different ecosystem (apps), different cost structures (high R&D in hardware), vast scale (device economics, components, ramps), and potentially new distribution (operators in the channel mix.)

    Summed up, the real challenge for Microsoft is whether they can keep their business model (selling OS licenses to hardware vendors) as PCs become more device-like. Not only is iOS setting the benchmark for performance but Android is potentially ready to take share if the market turns slightly more modular. Microsoft's differentiation looks to be primarily its legacy of PC software.

    It may also seem that much remains to be discovered in this market but I think the main bets have already been made. The PC market as we know it is in the end game.

    ---

    Notes:

    1. I used Gartner data for overall world-wide PC market and merged it with Mac and iPad data from Apple. Android data is estimated.
  11. The Android (in)adequacy: How to tell if a platform is good enough

    Research · 97 comments

    About 10 years ago I met an advertising executive in New York who explained the difficulty of advertising a new brand of deodorant to consumers. “Most people never change their deodorant,” I remember him saying. “They pick one brand when they are young, and stick with it for a long, long time. If it works, why switch?”

    The same theory can be applied to customers who are making the switch to smartphones today. Once they have picked a type of phone, whether it’s Apple iOS, Google Android or something else, it’s difficult, and often expensive, to switch. Consumers become comfortable with the interface and design of the phone and the apps they have purchased on that platform. If it works, why switch?

    Many Smartphone Customers Are Still Up for Grabs - NYTimes.com

    This quote says a lot. The notion that customers remain captive to a platform is well understood. After all, it seems impossible to get people to switch out of Windows (or Mac or iPod). Platform vendors are aware of this as the land grab for users seems to be running at full pitch.

    However, there is a critical condition described in the quote above: "If it works, why switch?"  The condition which keeps users loyal is that the product they chose is good enough--i.e. "it works." That's a symptom of over-service and commoditization. If a product, like deodorant, is good enough you won't be tempted to move to another brand even if it's marginally better since the new brand has switching costs in the form of uncertainties ("Will it be as good? What if I don't like the smell? etc.) People are inherently conservative and you can't compete with comfort and familiarity by launching a marginally better product.

    So with that in mind, why is it that millions are switching mobile platforms?In this blog I've cataloged the massive shifts occurring away from mobile platforms that have been around for years with deeply entrenched user bases. Microsoft's Windows Mobile, Nokia's Symbian, Palm's PalmOS and RIM's Blackberry have collectively lost tens of millions of users. A net of half a million Blackberries are being abandoned in the US every month.

    So we would need to say that the condition of "it works" or being good enough was not met with those platforms. The attraction of something better is clearly greater than the switching cost.

    So this highlights a good test for how to tell if smartphones are good enough: If users are fiercely loyal with a given platform then it's probably good enough but if they are willing to switch (i.e. disloyal) then it's probably not good enough. It seems like a trivial observation but it's a very important clue to the bigger question of whether we can "call the end" of the market. Just like it would have been premature to call the end in 2006 when Symbian and RIM seemed unbeatable, it will seem premature to call the end now in the event that a significant innovation is yet to appear.

    The correct calling of the end has profound investment implications. Do you (like Microsoft) invest billions in a new platform if you know that there is no more room for entrants? Should Samsung bother with Bada or HP with WebOS if the game is already over? Even more, should Apple even bother to improve iOS if they have no shot at switching a billion likely Android adopters. Why not just nurture the current installed base and work on building walls and moats around them?

    So with this hypothesis in mind, it makes sense to analyze whether Android or iOS, the current presumed champions, are "good enough" on the basis of how often users switch out of them. My bet is that neither is good enough and that there will be increasing churn between platforms. I imagine that Android is less sticky (and hence less than good enough) based on app consumption but there is little evidence of churn because most phones in use have been bought less than one device generation ago. More importantly, there have been few opportunities yet for switching as many Android buyers don't even have the choice of other platforms either due to where they live or how much income they have available.

    To really tell where we stand, we would need to collect stats on switchers to know just how satisfactory the platforms may be. Remember that a choice of a new deodorant on the same shelf at nearly the same price is the test for loyalty. For an adequacy test we need to see better distribution and more choices for consumers. It's still very early even in the US for any conclusions to be drawn about the adequacy of Android.