During the last WWDC Apple revealed that there were 54 million active Mac users. If we look at the history of the product we can see that it took about 5.5 years to sell 54 million Macs. If we assume therefore that the average lifetime of a Mac is 5.5 years and knowing that Mac sales generated revenues of about $73.8 billion then we can estimate the average revenues/year/mac user: $250.
Repeating the exercise with 180 million current iOS users who purchased about 200 million iOS devices and assuming a life span of 3.5 years gives the average revenue/year/iOS user of about $150.
These are recurring figures. If we assume these users are loyal then they will likely spend this amount indefinitely and each additional user will be worth a similar amount.
So, for example, if we assume that the number of Mac users reaches 100 million then we can also assume that they will generate about $25 billion/yr in recurring revenues.
Likewise, if we extrapolate growth of iOS to 500 million users then we can assume they will generate $74 billion/yr in recurring revenues.
Adding these together gives a potential recurring income level of $95 billion/yr for installed base alone (excluding iPods, Peripherals, iTunes apps/songs, and Software sales.) Today that figure is about $40 billion/yr. [1]
Interesting valuation exercises can follow. [2] It would also be interesting to perform a similar analysis for other vendors/platforms.
---
Notes:
Note that actual sales are considerably higher than this figure as new customers are added. These figures should be considered "baseline" sales.
Thanks to a kind reader for suggesting this line of analysis.
There are 225 million iTunes account holders. 25 million joined in the three months. As the iTunes store has been operating since April 2003 it's possible to step back and look at its history and measure the rate of growth relative to other ecosystems.
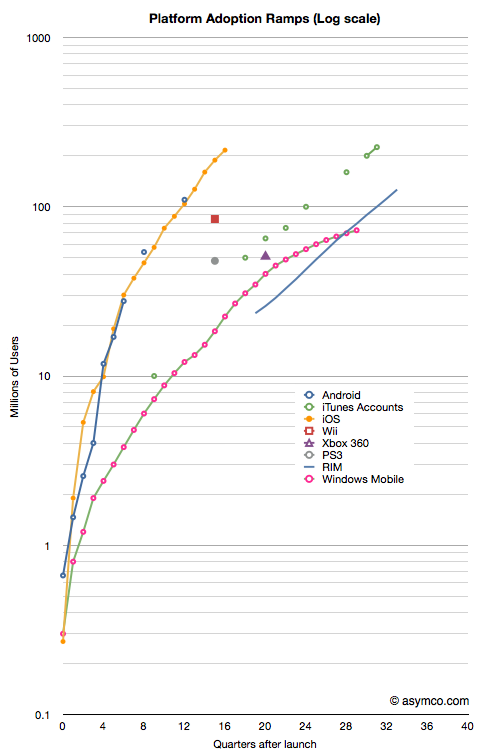
The following chart shows various platforms/ecosystems in terms of adoption. In the case of phone operating systems and consoles, the cumulative units sold is shown. The scale is 10 years by 1 billion users with users measured on a logarithmic scale.
What can be easily observed is that iTunes continues to grow on a logarithmic scale even at its advanced age of 7 years. This cannot be said for console-based gaming systems or for some alternative mobile phone platforms (e.g. Windows Mobile or Symbian).
The reason for this prosperity at an advanced age may be due to the fact that iTunes has survived the transition from one device (the iPod) to a device platform (iOS). It also was able to embrace multiple media from music, to movies to TV and apps. iTunes turned out to be far more flexible and resilient given what was technologically foreseeable at its birth.
Looking to the future, is it possible that iTunes could grow in parallel with iOS toward the 1 billion user limit that the slope in the chart implies? Much will depend on gaining users who are unlikely to have credit cards and live in emerging markets. If there is one obstacle to the iEmpire it's the addressability of markets which lack consumer credit infrastructure. I suspect, however, that these problems are not unsurmountable given that telecom infrastructure leapfrogged credit infrastructure growth with nary a ripple. Apple could certainly offer that service directly to the consumer.
In their monthly survey update on US phone usage, comScore reported that by the end of April 74.6 million people in the U.S. owned smartphones. In the same period a year ago only 48.1 million did. The percent of smartphone users out of total phone users has reached 32%.
The following data points can also be deduced:
2.1 million or 474k people/week became smartphone users during April.
62% of smartphones in use in the US are either Android or iOS. The sum a year ago was 37%.
There are about 20 million iPhone users and 27 million Android users in the US today. A year ago there were 12 and 6 million respectively.
RIM's US user base peaked at 22 million in Sept 2010. It is now 19 million and dropping.
Usage of Microsoft mobile operating systems in the US is in steady decline dropping from 7 to 5 million users in one year.
During April 475,000 people abandoned their Blackberries.
Android and iOS gained 3 million users in April. One million switched from other smartphones and 2 million switched from non-smartphones.
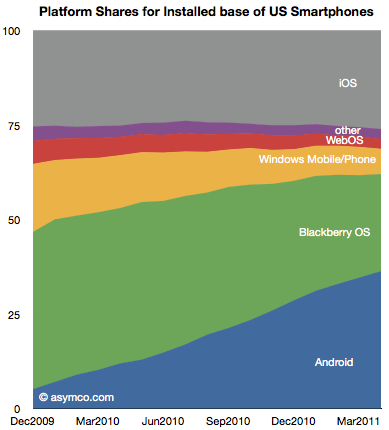
The following chart shows the evolution of installed base share of platforms among users of smartphones in the US.
The impressive share gains for Android are apparently at the expense of RIM and Microsoft. Over the period shown, Android gained 25 million users while RIM gained only about 2.8 million.
Although perhaps comforting to see some growth overall, the situation for RIM is more grim than that. During the first half of the period (December 2009 to August 2010) RIM had gained 4.6 million users. During the second half (Sept 2010 to April 2011) RIM lost 1.8 million users.
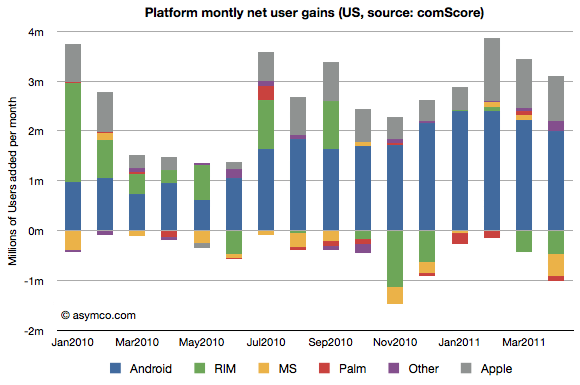
The net user gains and losses for the various platforms is shown in the following chart:
Note how RIM (green bars) went from being a consistent net usage gainer to a consistent net usage loser during this 16 month period. In addition, note how Microsoft's platforms (yellow bars) have had a very poor showing with very small gains during four months and moderate losses during the others. The losses in usage even increased after the release of Windows Phone late last year suggesting no traction whatsoever for Windows Phone.
The other point to be made is that if we assume smartphone users remain smartphone users, then those platform losses are gains by other platforms. In other words, the areas less than zero in the chart above represent smartphone "churn" or switching between platforms (As a percent of all smartphone users that number represents 1.35%.) That number is far lower than the total smartphone gains, so it's safe to say that most of the iOS and Android gains were at the expense of feature phones rather than other smartphones. And since iOS share is consistent (and supplies are constrained), few if any Android gains are at the expense of iOS.
There are many interesting patterns to observe in the data, but I think the most evocative is the erosion of Blackberry usage. If the Blackberry peaked, and a follower platform not yet in sight, the question is how long will RIM survive?
While a lot of the credit for Apple's success is rightfully assigned to the iOS franchises, the OS X business has more than quadrupled in five years. This has happened without drastic price fluctuations. Neither holds for the overall PC industry which has seen both volume and sales decline while prices have eroded along with profitability. On top of that, growth has nearly evaporated.
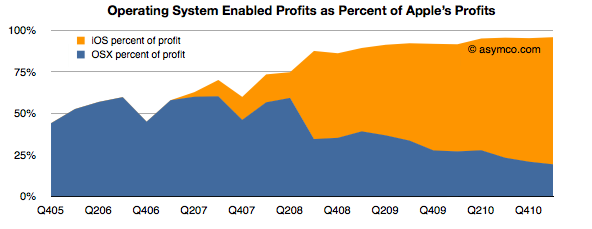
Even with this success, as a percent of total value created, the Mac accounts for a mere 13% of Apple's profit. Including software as part of the OS X franchise implies that OS X is enabling about 20% of Apple's profits.
iOS, on the other hand, is accounting for more than 75%. These two platforms combined amount to 96% of Apple's profits (up from 50% four years ago).
That's $9.8 billion from integrated platform-based devices. One can be very confident that this profit would be negligible without the software differentiation only Apple can offer.
So $10 billion is a lot of profit to obtain from a business enabled by operating system platform software. How can we get a handle on this size? How big is this? We could compare this with another operating system business: Microsoft Windows.
Microsoft's Windows and Windows Live Division obtained sales of $4.445 billion in the last quarter with an operating income of $2.764 billion.
So although Windows earned about twice what the Mac earned[1], iOS and OS X together enable 3.5 times the profits of Windows.
The end of an era is the end of growth in one dominant business model. The PC era was epitomized by the concentration of profits in a dominant operating system vendor. That growth has slowed if not ended. The post-PC era is being kicked off by a new business model where profits are being concentrated in a hardware+software+service integrator.
--
Or you could read this as: The Mac generates half the profits of Windows while iOS devices generate 2.3x Windows profits.
Apple's last quarter's sales growth was an impressive 83%. It was not as high as the 92% earnings rise because there was a higher mix of iPhones this quarter than in the past. The iPhone is the most profitable product in Apple's portfolio so it impacts the gross margin significantly.
The iPhone is, in fact, a huge part of Apple's business. In units it reached 5% global share and 14% US share. I'll go over the overall industry data as soon as all the major reports are in, but already it has been estimated that Apple is the largest phone vendor by profit and sales.
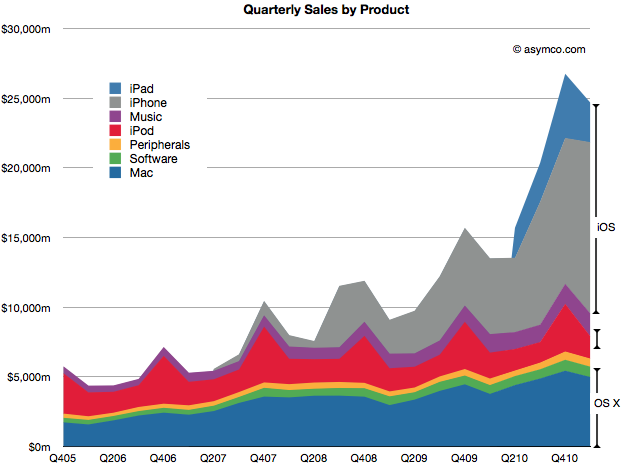
In the following chart, you can see just how important the iPhone has become. Together with the iPad and iPod touch, iOS-powered devices make up about 65% of sales. That's almost three times the value of OS X based products which make up 23% of sales. That also leaves just 12% of sales not directly affected by these two juggernaut platforms (though music and peripherals are clearly indirectly affected by Apple's own platform products.)
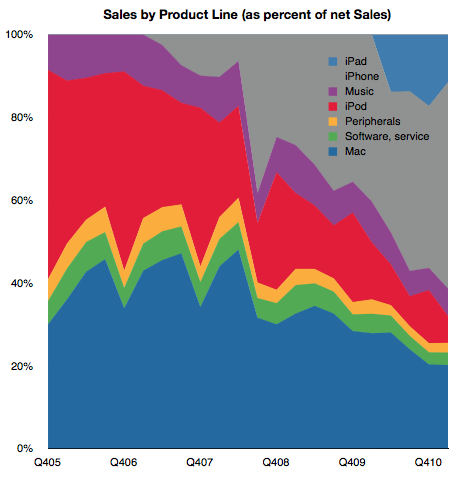
The following chart shows the same information as shares of total net sales.
I've read that some of the uncertainty around Apple's future prospects is driven by the perceived vulnerability of these new blockbuster iOS products. At first glance this growth looks quite unprecedented and hence risky. 65% of sales from iOS did not exist four years ago. If you look at the sector it's hard to find any company that has doubled its sales in a few years from completely new product lines. Especially a mature company over 40 years in the business.
Well, there is one.
If you look again at the second chart above, you'll note that the proportion of sales held by iOS devices has mostly replaced the sales share that used to be held by iPod, itself a product that did not exist four years prior to the time of these charts.
Apple consistently doubled its sales on the basis of the iPod. It's now consistently doubling on the basis of iOS.
Exceptional claims require exceptional evidence. But that's exactly what the investment thesis for Apple should be: Exceptional growth is no exception.
Steve Jobs himself said it well once: "I wasn't alive then, but from everything I've heard, Babe Ruth only had one home run. He just kept hitting it over and over again."
Even this exceptionalism is not unique. It happens not just at Apple, but at another of Jobs' creations: Pixar.
Perhaps this magic formula for exceptionalism is itself a fluke but what if it's not. What if blockbusters are really something that can be built with repeatable consistency. What would that be worth?
Yesterday I wrote about the growth in Android vs. iOS. The two platforms' can be said to be enjoying healthy growth, though in markedly different patterns.
The consequences of this growth are being felt across the telecom and computing industries. There are almost 300 million platform devices in use today that were not even dreamed of three years ago. Operators are transporting petabytes more data and dozens of phone vendors are scrambling to meet demand. There are tens of billions of app downloads and hundreds of thousands of apps being sold by tens of thousands of new app publishers. There is a lot of hay being made while the sun shines.
But what about the poor saps that are funding the development? What about the shareholders of the companies behind these platforms. Are they being rewarded or punished?
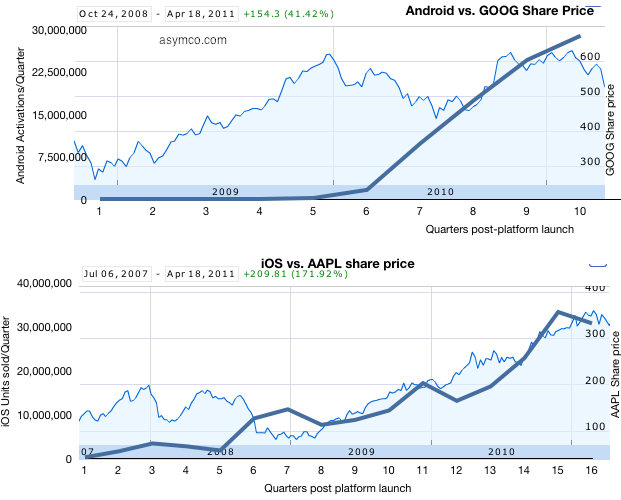
The following charts tell the story:
I took the platform growth data published yesterday and overlaid it on the share price data (source: Google finance). Each plot begins at the point in time when the respective platform was available in the market and ends today. There are two vertical axes: the left side axis shows "activations" or units sold and corresponds to the thick blue line; the right side axis shows share price and corresponds to the area chart. Overall date range and growth in share price is shown in the upper left corner.
What can we interpret from this superimposition?
Both Apple and Google shareholders saw share price appreciation during the two platforms' histories. Apple shareholders benefited more (+172% vs. +41%)
Apple's share price appreciation seems highly correlated to iOS growth but Google's doesn't. Google share price had dramatic growth during 2009 while Android was moribund and was flat to down during 2010 when Android growth was explosive.
We can also interpret the difference as Google's fortunes being far less dependent on mobile platforms than Apple's. Google has been subject to selling pressure this year due to corroding cost structures irrespective to platforms growth. Conversely, Google may not benefit from mobile computing as handsomely as Apple.
Correlation is not causation and clearly there are many factors at work in share price changes but I think it's fair to say that Apple is obtaining fuel for growth with iOS while Google is in a more precarious situation with mobility--partly benefiting but partly threatened. The market behaves in bizarre ways in the short term but in the long term one can see logic and reason.
There is precious little data on Android units sold. There are estimates but no actual summary. Google themselves don't seem to know as they don't report sales, preferring to report "activations."
Assuming that activations means "unique activations of new devices" then we can draw some equivalency between Google's reports and the reported units of iOS sold. There is some uncertainty with respect to iPod touch units, but that is not very big (estimates are drawn from Apple's reporting of overall iOS units at several points in time.)
To estimate Android, I took the download rates currently available and placed them in the month when they were published. I then interpolated the data monthly and quarterly.
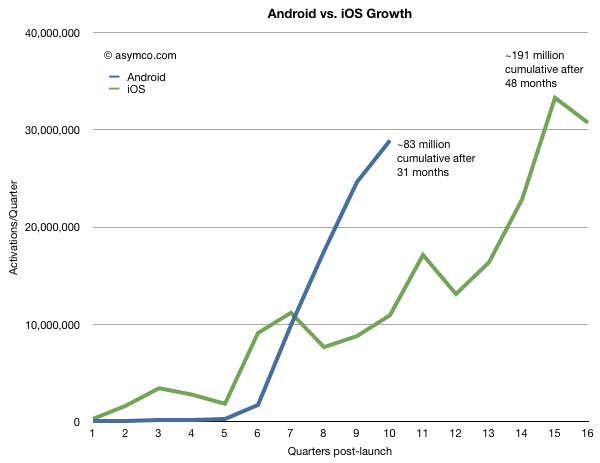
To make the comparison more valuable, I chose to index the starting point at the launch of each respective platform and plot quarterly units (or activations). This way we can observe how the platforms ramped in growth and where they were at similar points in their lifetimes.
The following graph results.
There is likely to be more seasonality in Android data than is shown, but the impressive thing is that Android is running at three times the equivalent adoption rate for iOS at similar points in time. In fact Android is being "sold" as rapidly as iOS today even though iOS has been in the market about 15 months longer.
Overall, cumulative units sold for iOS are still about twice as many but if Android will continue to grow as rapidly as it does now, it will likely overtake iOS in installed base in less than a year.
One should be careful about drawing conclusions that this implies effective competition. Both platforms are growing very quickly. iOS is growing at at least 100%/yr and Android's second year was 65x bigger than its first. iOS growth is limited by the ramp rates of a limited portfolio of products. Android growth is limited by how quickly vendors can bring out products. Neither platform is demand constrained and hence they are competing for share of growth not for share of a fixed pie.
Extrapolation is a dangerous game, but the chart above shows some predictability in Apple's curve whereas Android has a "step function" or discontinuous feel to it and that's a curious thing.
Not so much for its lack of predictability but because it's so asymmetric to iOS.
A dictum of classical physics states that in nature everything is continuous. However, in quantum physics everything is discontinuous. Both models of the physical universe have their uses.
It should be noted that both business models represented above can also co-exist, at least for the foreseeable future.
IDC released a new forecast for the worldwide smartphone market which included a long range forecast--all the way to 2015.
Most people fixated on the share data in 2015. Not hard to do since whoever wrote the press release highlighted this flashy headline. Putting aside the three significant digits of accuracy on every data point and the hard to swallow declaration that a painfully underperforming (in more ways than one) Windows Phone will overtake iOS and BlackBerry to become the second largest platform by units/year in 2015, there is much more to the report.
Using only the public data from the press release we can put together a pretty good picture of the transition being forecast and determine some of the (unstated) assumptions being made. It's these assumptions about the underlying market dynamics which illuminate far more than the falsely precise share data.
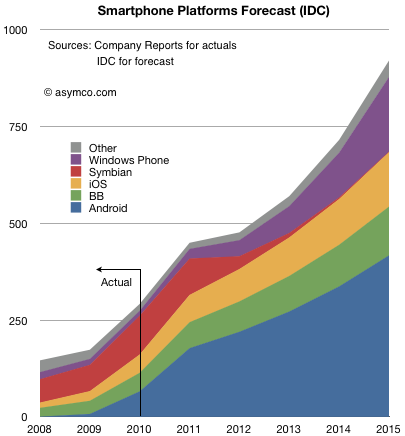
The following chart shows both historic platform performance (which is detailed in the Asymco Interactive data sets on a quarterly basis) and the forecast based on the given compound growth rate published.[1]
I see three main assumptions being made:
Nokia (or more precisely Symbian) share will be swapped for Windows Phone. The transition period 2011 to 2015 shows approximately 150 million Symbian devices will be sold which is the stated goal for Nokia. IDC is making an assumption that the hardware vendors will roughly maintain their respective shares irrespective of platform dynamics and that Nokia will switch its share of users from one platform to another in a predictable way.
iOS and BlackBerry will maintain share. Presumably this is also driven by hardware channel dynamics and relationships with carriers.
Android will grow share slightly but the vast bulk of growth will come from market growth.
Market growth is strong but undramatic.
Overall this is not a controversial set of assumptions.
Except perhaps that it assumes that the basis of competition in the market is unchanging. Of course it's well understood that the basis has shifted during the tumultuous 2007 to 2010 and forecasts made before the iPhone was launched sound absurd today.
But IDC says that the unpleasantness won't happen again. From listening to the conversations going on today on this blog and elsewhere, their assumption that things will not change (again) is fairly deeply ingrained, indeed conventional wisdom. In that sense IDC is not taking any liberties with the future. The projections of current realities onto the future leads to this type of forecast and status quo defenders should be satisfied, if not rejoice.[2]
However, there are a few more consequences of even this uncontroversial forecast which should make keen observers sit up and notice.
If we look at more than the before and after snapshots and comfortable pie-splitting sound-bites there are some profound seismic things being implied.
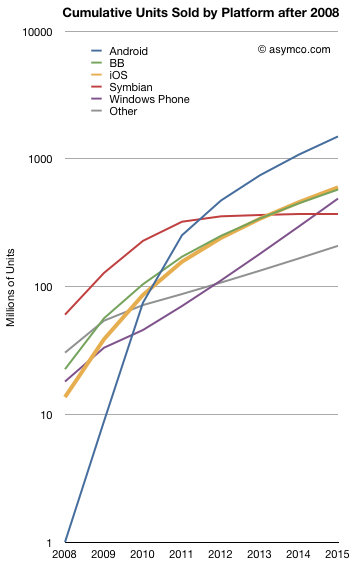
For example the entire market will be nearly 1 billion smartphones a year (in four years!). Even more startling, considering the "race to a billion" discussion we've been having, some of the platforms seem to be reaching that threshold rather quickly. The following chart shows the cumulative unit sales for the candidate platforms on a log scale:
Android is considered likely to break one billion units in five years post-launch. Windows Phone will sell nearly half a billion units and Blackberry will be well over that number.
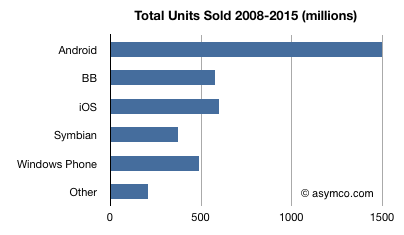
I tallied the cumulative platform unit totals below:
No less than four platforms will have sold half-billion units by 2015. The suggestion that Android will "win" by having the most units sold seems as hollow as the suggestion that Symbian "won" by having the most users in 2008. Not so much because it will go on to lose them, but because there were plenty of viable alternatives for users to buy and developers to build for. Half a billion users cannot be easily ignored.
So even "safe" assumptions can lead to astonishing results in this market. Namely, IDC is saying that the smartphone market will not have any platform losers.
There is one more thing the report implies. If you look at the ranking of leading platforms (by units/year) in 2008, 2015 and, with a little extrapolation, 2016/2017 you get:
Rank in 2008
Rank in 2015
Rank in 2016/2017
Symbian
Android
Android
Other
iOS
Windows Mobile
RIM
RIM
iOS
Windows Mobile
Windows Mobile
RIM
iOS
Symbian
Other
Android
Other
Symbian
In other words, there is a complete reversal being projected. An almost perfect flip: those on top end up at the bottom and those on the bottom end up on top. That's about as controversial as it gets. Pretty impressive for a set of safe assumptions.
--
Notes:
You should ignore the shape of the curve between 2011 and 2015 as it assumes the CAGR is applied to every year. Although the press release shows a CAGR, the actual report may include various fluctuation in yearly growth. The starting point of 2011 and the end result in 2015 however should be the same.
If, on the other hand, you believe that exponential growth, rapid gains in communications speed, new breakthroughs in interaction with devices, and entrants winning with new business models are causes for a disruption, then perhaps extrapolation may not be the way to forecast this market.
When tallying up the race to a billion users, I noted that both iOS and Android seem to have the potential to reach that size of user base. However, that raises the question of where those users will come from. We have to note the fact that there aren't a billion users to be captured today.
If not today, then how soon, and where are they?
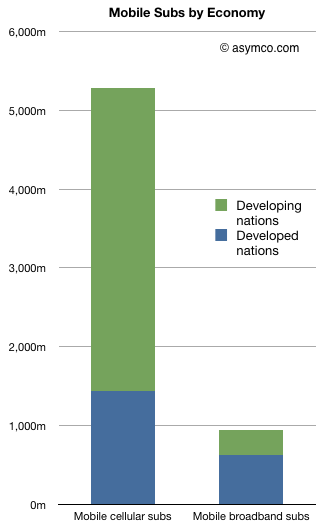
The first question is who is addressable. If we stick with mobile cellular subscribers, there seem to be plenty of users (at least 5.3 billion as of October 2010 according to the ITU). However, the number of "mobile broadband" (i.e. 3+G network subs) is about 940 million. The chart to the left shows the difference and adds the subdivision between developed and developing economies.
Over half (51.1%) of developed nations' populations have signed up for mobile broadband while only 5.4% of developing country populations are on 3G. And whereas developing countries have added 2.6 billion mobile subs in 5 years, they added only 293 million mobile broadband (MB) subs. Developed nations added 574 million MBs in the same time frame.
As a result, two thirds of mobile broadband subscribers reside in developed nations as of 2010. This number will decrease rapidly as MB penetration reaches saturation in developed countries, however the race to a billion is being run in these markets first.
Which leads back to the question of platform potential. Platforms that target developing nations have the challenge of low broadband availability in the near term in addition to the challenge of device pricing. There are still 800 million developed country subscribers who have yet to upgrade to mobile broadband.
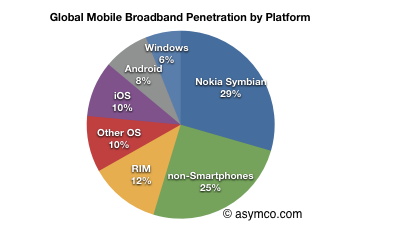
At the time these statistics and knowing the platform sales histories, my estimate is that only 18% of mobile broadband subscribers were using either iOS or Android. 25% were not even using a smartphone and 29% were using Symbian. (See pie chart).
But existing smartphone users are not the most attractive market to target with a new platform device.
A new smartphone user could come from the following groups of users:
Existing smartphone users: 700 million. This is tough head-to-head competition for every new user.
Existing mobile broadband users who are not smartphone users: 240 million. The easiest group to switch to using smartphones.
Developed nation mobile subs who don't have mobile broadband or smartphones: 800 million. This seems very attractive since they can be mostly upgraded using subsidized phones into an available 3G network.
Developing nation mobile subs who don't have mobile broadband or smartphones: 3.5 billion. This is a very tough market because the availability of 3G will take time and until it appears, the buyers are unlikely to adopt devices that are useful only though a 3G data plan. They are also a difficult market to target with high ARPU phones/plans.
To assess the timing, one could assign some probability weights to these categories to create various scenarios for adoption. My own guess is that the next 500 million smartphone users are easily within reach in the next two years without a significant amount of inter-platform rivalry (See stacked bar chart to the left).
Only after two years will existing smartphone users become attractive for poaching and even that assumes that developing nation networks will still be largely unaddressable.
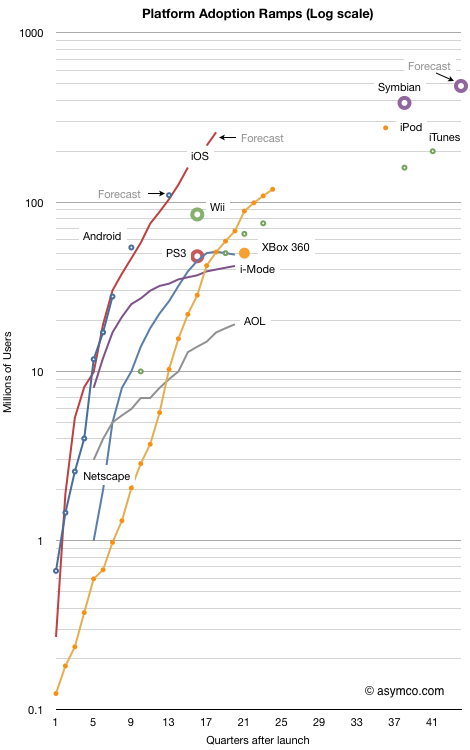
I last looked at the race to a billion in September 2010. I've now added a few more data points to the tracked platforms and also added points for the major console game platforms and Symbian.
The chart shows the cumulative number of users (approximated by units sold) for 11 platforms indexed to the same starting date. The horizontal axis is the number of quarters since a platform launched. Every fourth quarter is numbered so each number on the axis represents a new year. The last number on the axis represents 10 years.
The vertical axis is the cumulative number of users on a logarithmic scale. Each number of the vertical axis is 10x more users than the previous number. The top of the graph represents a billion users.
The overall chart shows how quickly a platform has grown and is bounded by a billion users and a decade of usage.
When judging the performance of a platform, the adoption slope and sustainability over time is perhaps the most interesting measure.
One can see how many platforms slow down before reaching 100 million and so far none have hit the billion mark (Windows has but not in the 10 year time frame of this chart.) Looking at game consoles also shows the limits of a narrowly focused platform. They performed better than i-Mode and Netscape but not as well as iTunes or iPod which themselves have growth limits.
If you're looking for the "fastest growing" title, it's a toss-up. Both iOS and Android are following almost identical trajectories.[see Notes]
The absolute highest cumulative sales total is Symbian, though now that it's been deprecated, it's set to be bypassed.
It does appear that Android and iOS each have the potential to reach a billion users in less than a decade. Perhaps Android will do so faster but the mobile computing platform race will not play out as the personal computing platform race did.
---
Notes:
For Android I used my own summary data for historic performance except for the last estimate and forecast which came from IMS Research.
iOS forecasts are my own.
Symbian data comes from VisionMobile. Forecast is based on Nokia's 150 million additional sales prediction.
Game console data is current as of end of 2010 via Wikipedia.
As iPad shipment volumes increase and as the iPod touch becomes the de-facto iPod, it's time to look at the overall split between iOS devices.
I will focus the discussion between iPhone and iOS "others" because I believe the two categories differ greatly in terms of their positioning and market strategy due to the different channels.
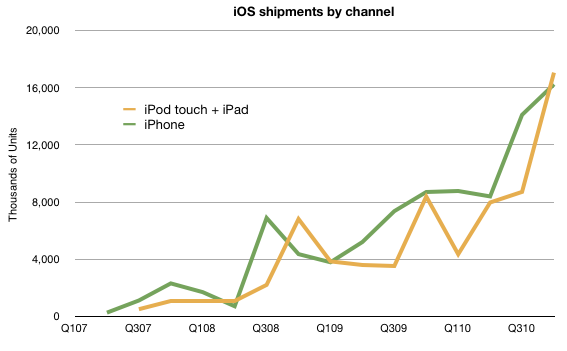
The company does not provide iPod touch units shipment data but it can be estimated that, based on overall iOS numbers released in September, iPod touch represents approximately 50% of iPod units sold.
If we put all we know together about volumes, we have the following chart:
Note that iPod touch has, occasionally outsold the iPhone. The pattern of approximately equal volumes for the two types of products is likely to continue depending greatly on the growth rates.
Next, I turn the spotlight on revenues.
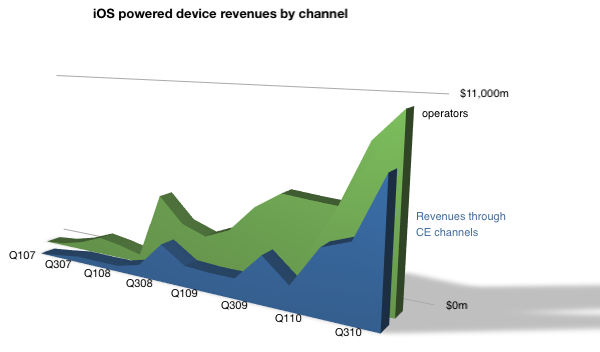
Over $10 billion flowed in from Operators, and a bit under $8 billion from other channels.
Note that I labeled the iPod touch and iPad as non-operator channel (Consumer electronics) distribution. Although this is not entirely true (and conversely iPhones are often sold through Apple stores) this gives a rough indication of split.
The iPhone business is staying ahead of the other iOS businesses but the gap is narrowing.
As previously noted, the iPhone is a unique product in Apple's portfolio. It depends on a distribution channel that no other product was designed around. This has advantages and disadvantages. The advantage is a high margin due to service revenue sharing but the disadvantage of network incompatibilities, politics and a range of telecom-related regulations.
What I believe is that the non-operator channel will grow as a proportion of iOS revenues. This is both as iPad grows to disrupt personal computing and as the iPad emerges as a communications tool.
As time passes, I believe Apple is motivated to also move revenues to its traditional channels. Whether, or to what extent, cellular phones will move in that direction remains to be estimated.