Asymco

Asymmetric Intelligence

iOS

  1. Tim Cook's outburst [Updated]

    Research · 64 comments

    When trying to assess the success of an ecosystem, the primary measure is the size of the user base or the "audience" for the product. Companies like FaceBook and WhatsApp and Twitter are measured first and foremost on this metric. Companies like Google, Amazon, Apple and Microsoft are less so. When revenues are firmly attached to products the focus shifts to "follow-the-money" rather than "follow-the-users" metrics.

    That's as it should be, but for the sake of understanding the competition between ecosystems, they should be compared on some similar basis. If the basis of competition in this day and age is ecosystems ((As Microsoft, Apple and Google seem to agree it is.)) how does one evaluate Facebook's vs. Microsoft's? Or, more poignantly, how does one compare WhatsApp's valuation with that of iMessage?

    It's common to value a company which aggregates audiences at a multiple of that audience size. The implication being that each member of the audience returns a certain cash flow to the aggregator and the discounting of those flows is the net present value. Which is why, for example, a newspaper is valued in terms of its subscribers. As is a TV network and as might be a social network. Using this metric, a WhatsApp (i.e. free messaging) user is worth $40 and the average social media user may be worth around $100. ((The degree to which a user is actually worth the sum of all the subscriptions she may have made is a good topic for discussion.))

    The implication is that users/subscribers/audience members are loyal and will stay with the programming for some time. There is also a second implication that businesses which are not measured by audience size don't have this loyal and recurring revenue base. The absence of an "audience" implies transience and impermanence and results in deep discounting of long-term viability.

    Which is why ecosystems are the desired business construct for technology companies. They allow a more consistent and repeatable transaction model and offer predictability which is sorely lacking in the rapidly changing technology industries. It allows a company to define itself on its customers rather than on its products.

    However, old habits die hard. Regardless of the exhortations of product companies, the notion of being valued on audiences is reserved for the service-oriented. Hence the outburst from Tim Cook at the latest shareholder's meeting. Reports have him saying that:

    Apple now has 800 million iOS users and has handled over 16 trillion push notifications, with 40 billion new ones occurring every day. Apple also delivers several billion iMessages and FaceTime requests every day. Cook added that iPad now accounts for 78 percent of all tablets used throughout the enterprise.

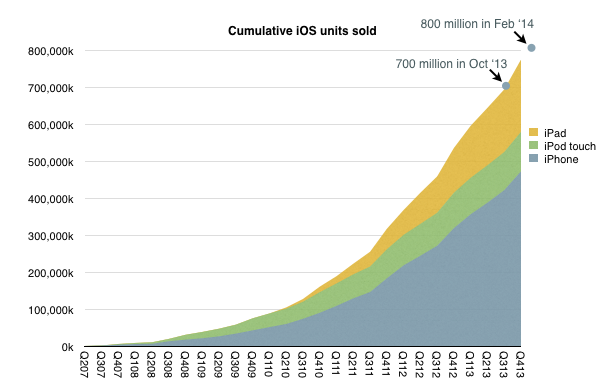
    Trillions of push notifications aside, the claim that Apple has 800 million iOS users seemed way out of line. This is because the number of iOS devices (excluding Apple TVs) shipped through to the end 2013 was exactly 774,336,000. One could easily imagine another 25 million or so since, giving us about 800 million sold, but I cannot see the number in use being the same, and even if they were, the number of users being the same.

    The following graph shows the claim in context of shipments.
    Screen Shot 2014-03-05 at 9.54.13 AM

    Note that last September Cook made the claim that 700 million iOS devices "by October", which did indeed happen. The 800 million claim in February is certainly believable in that context.

    Determining the total number in use is a very speculative exercise. Assuming useful life of 9 quarters for iPhone and iPod and negligible iPad retirements yields about 560 million iOS devices in use. Obviously this can be very inaccurate as also there can be multiple users per device but the claim of 800 million users seems very hard to reconcile.

    Perhaps he was mis-quoted or he mis-spoke but the real question isn't the exact number but rather the implication that Apple should be seen for its users rather than its quarterly shipments.

    Them's fighting words, Mr. Cook.

    [Update: Thanks for Philip Elmer-DeWitt's investigation, Apple clarified that Tim Cook referred to 800 million as the number of iOS devices sold not users of iOS. He was mis-quoted.]
  2. A margin of error

    Research · 142 comments

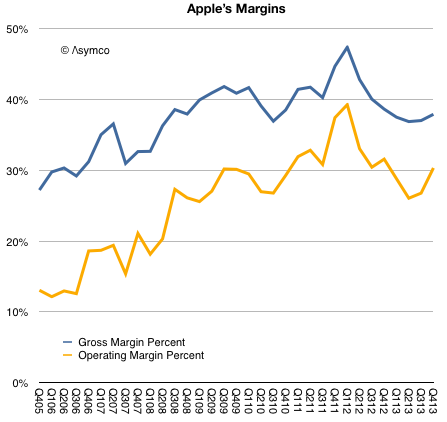
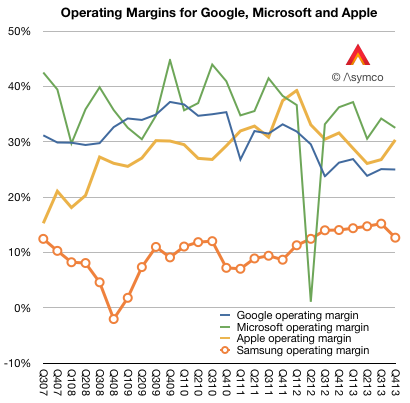
    Prior to Apple's earnings report I read at least one article suggesting that the most important indicator to watch was Apple's margin. I suppose this was due to a recent decline in margins from a peak gross margin of 47.4% in Q1 2012 to 36.7%.

    As the graph below shows, margins began to recover by Q3 2013 and are nearly on par with year-ago levels.

    Screen Shot 2014-02-12 at 10.32.50 AM

    The guidance for the present quarter is a gross margin between 37% and 38%. This would imply a flat q/q GM line (blue line above.)

    This is not quite catastrophic.

    To better understand margins, it helps to compare them with other companies. When Apple reached that peak of near 50% gross margin I noted that such a level was higher than Microsoft's and Google's. The irony being that Apple was nominally an (implied) low-margin hardware company while Microsoft was an (implied) high-margin software company and Google was an (implied) high-margin internet services company.

    Here is the picture with the last two years added:

    Screen Shot 2014-02-12 at 10.02.17 AM

    In the last two years Apple's margins have declined but so have Google's. And although Microsoft's fell, they fell less than Apple's and thus overtook it to remain slightly more profitable (32.5% vs. 30.3%) into Q4.

    I also added Samsung Electronics' operating margin. ((As a large conglomerate, Samsung will have a lower blended average. Separating the Telecom group's operating profit shows a 16.14% divisional operating margin.))

    So although Apple stabilized, it did so at an extraordinarily high level, well out of band for a hardware company. Thus the question remains: Are Apple's margins a fluke? Is the recent rise of margins to levels far above those of a comparable hardware company and into the realm of software and services sustainable?

    The simple answer is to assume that the iPhone and iPad, which make the bulk of revenues and which explain much of the rise, enjoyed a temporary buzz which allowed them to be priced at a premium but as that buzz wore off, the pricing and margins would decline. This is common with fads and fashions.

    But the situation is far more nuanced. If the margins were due to mere novelty, the effect should not have persisted over so many years. Pricing data shows that the iPhone remains exceptionally valuable and that the iPad, excluding line extensions, has also held the line on pricing.

    The missing piece in the puzzle is that the iPhone and iPad and iPod touch and Apple TV are pieces of an inter-dependent network of assets. The iTunes stores, Apple's services and Apple Retail are easily ignored because they are not "profit centers" but I believe they are a key component to the sustainment of these margins.

    In other words, the iPhone and iPad enjoy margins not just because they are new and well designed. But also because they form part of a ecosystem. The key word is 'system'. The user buys into a system not just what the device embodies.

    This is why I've always said that the iOS product businesses should be thought of as "hardware as a service". The inspiration comes from the notion of "software as a service" which posits the idea that software purchases should be thought of as services and thus recurring revenues.

    iOS devices are part of a service matrix: the user experience in the stores, the after-sales support (including the easily ignored Applecare), the broadband supplied through operator service (which is part of a trillion dollars of value), the apps and content that can be purchased (which add up to a mountain of money), the network effects of iMessage and iCloud and now iRadio and Match and Siri.

    These services attachments are well understood as great business models and underpin some of the most celebrated businesses to emerge in the last decade including Google, Amazon, Facebook, Box, Dropbox, Windows Live, etc.

    It's curious therefore that whereas these other businesses are highly valued as services, in the case when the service is a component within a larger system, the value is missed. In an integrated context the connection between services and high margins is not understood. The reason may be the absence of robust systems analysis and a preference for the facile explanation.

  3. Fortune 130

    Research · 74 comments

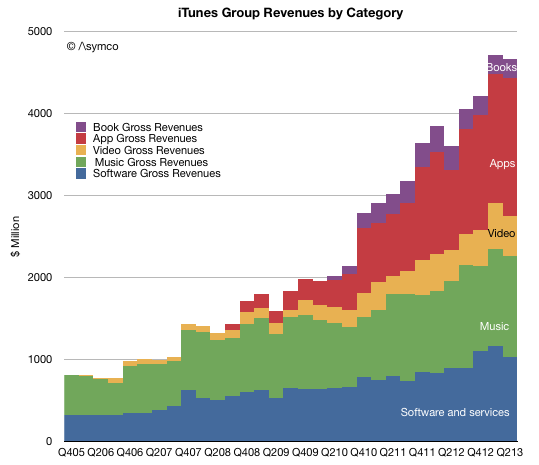
    The increase in net sales of iTunes, Software and Services in the first quarter of 2014 compared to the first quarter of 2013 was due to growth in net sales from the iTunes Store, AppleCare and licensing. The iTunes Store generated a total of $2.4 billion in net sales during the first quarter of 2014 versus $2.1 billion during the first quarter of 2013. Growth in the iTunes Store, which includes the App Store, the Mac App Store and the iBooks Store, was driven by increases in revenue from App sales reflecting continued growth in the installed base of iOS devices and the expansion in the number of third-party iOS Apps available. Net sales of digital content, including music, movies, TV shows and books, from the iTunes Store was relatively flat in the first quarter of 2014 compared to the first quarter of 2013.

    Apple Inc. Form 10-Q.

    During the last quarter Apple changed the pricing for iWork and OS X to zero ((OS X server is still priced at $20 and iWork for previously unlicensed devices and computers is still priced above $0)).

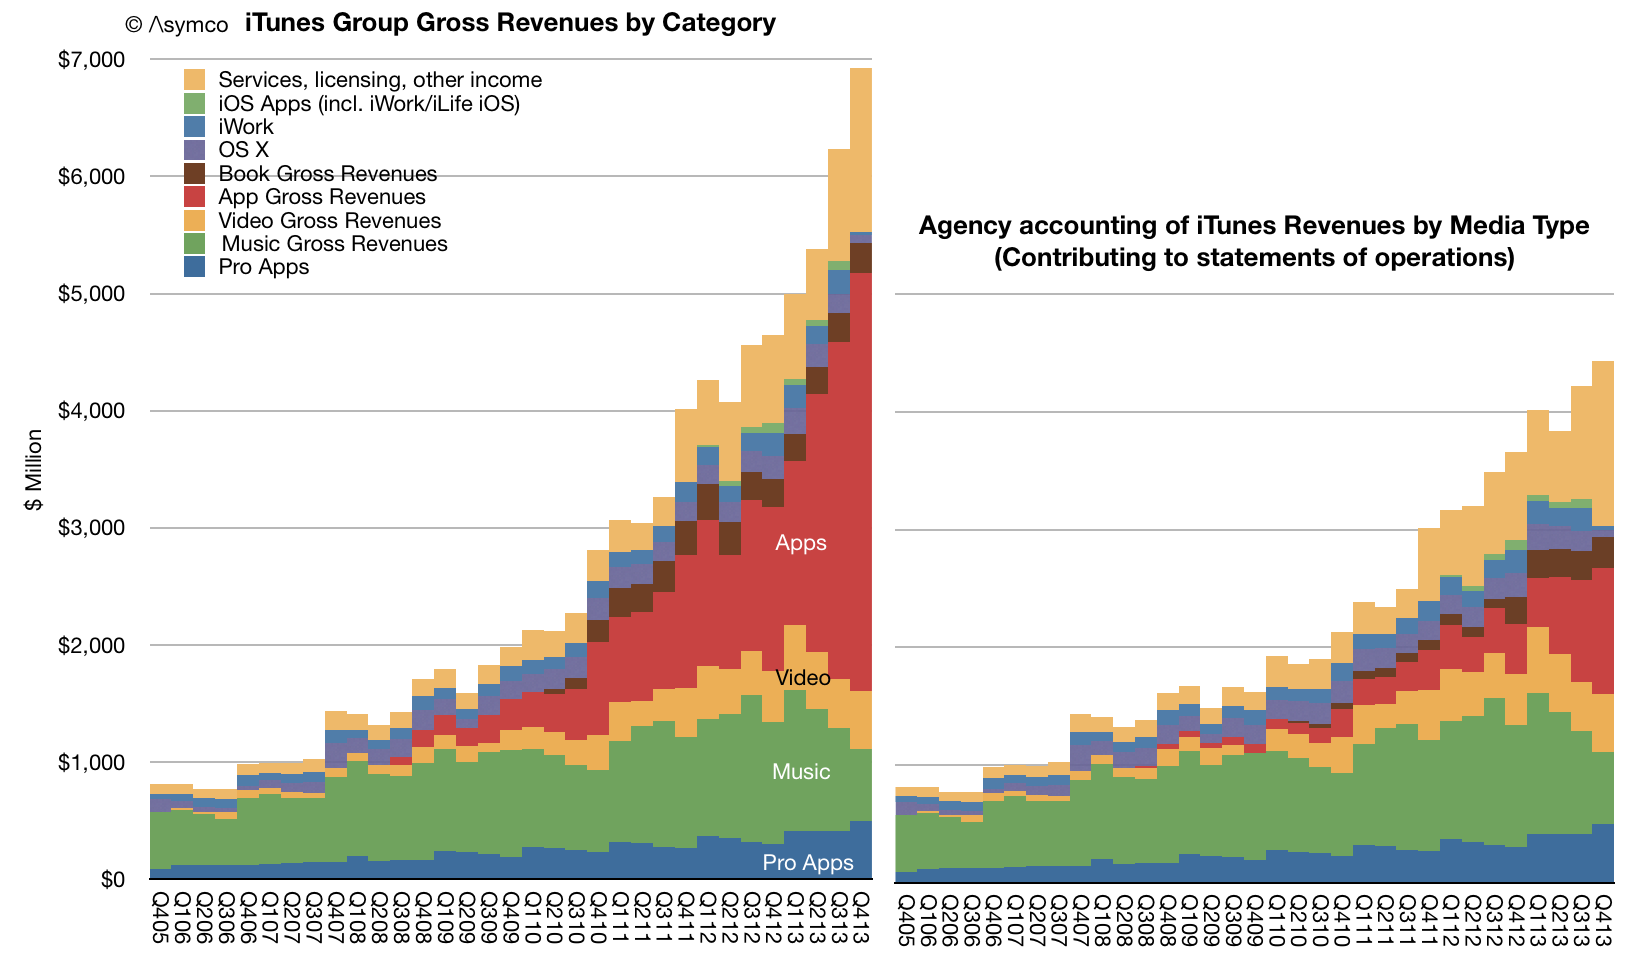
    I estimate the net effect to have been a reduction in revenues from those software titles of about $350 million for the quarter. Nevertheless, increases in services and app revenues means that the iTunes total reported revenues increased to a new record.

    The total with estimated contributions by media and service components is shown below right.

    Screen Shot 2014-02-10 at 10.05.11 AM

    Note that revenues do not reflect total billings. As Apple reports only the 30% of App transaction values, the full iTunes/Software/Services transaction values are shown in the above graph on the left.

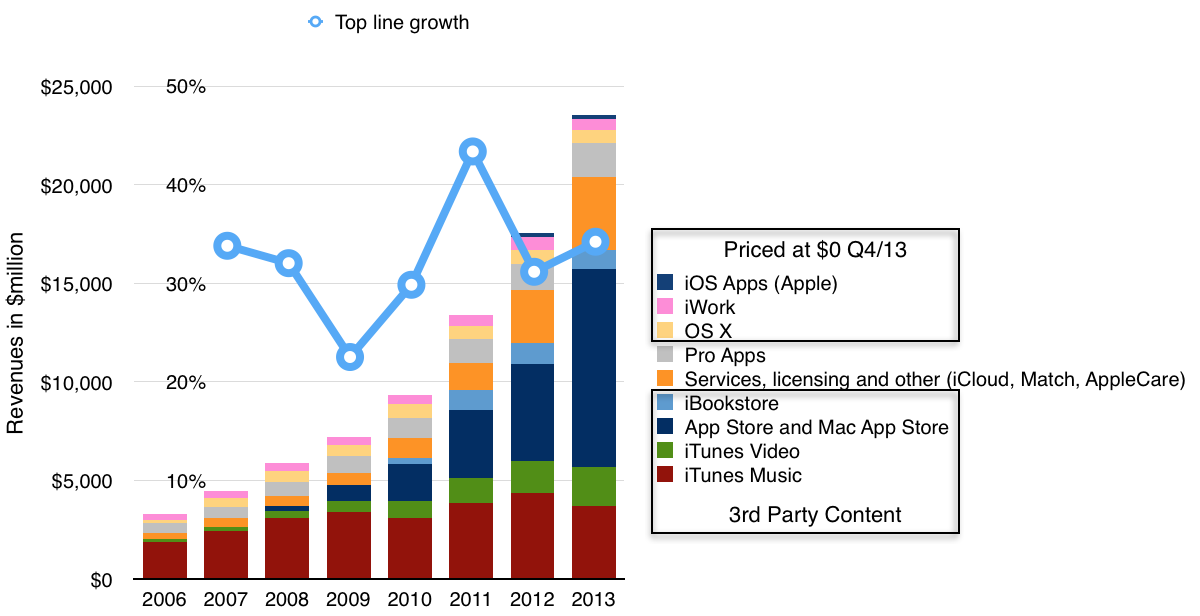
    The "gross" revenues are now nearly $7 billion per quarter. On a yearly basis the iTunes/Software/Services group had gross revenues of $23.5 billion with growth of 34% y/y.

    Screen Shot 2014-02-10 at 10.03.28 AM

    Other estimates for full year 2013 growth are:

    • Third party content +46.6%.
    • Music downloads -14%
    • Video +19%
    • Apps +105%
    • Books -9%
    • Services +37%
    • Pro apps +29%
    • OS X -8%
    • iWork and iLife -8%

    Although iTunes/Software/Services are not usually included in a "sum-of-the-parts" total contributing to Apple's overall enterprise value, the scale of volume and value of transactions is becoming harder to ignore.

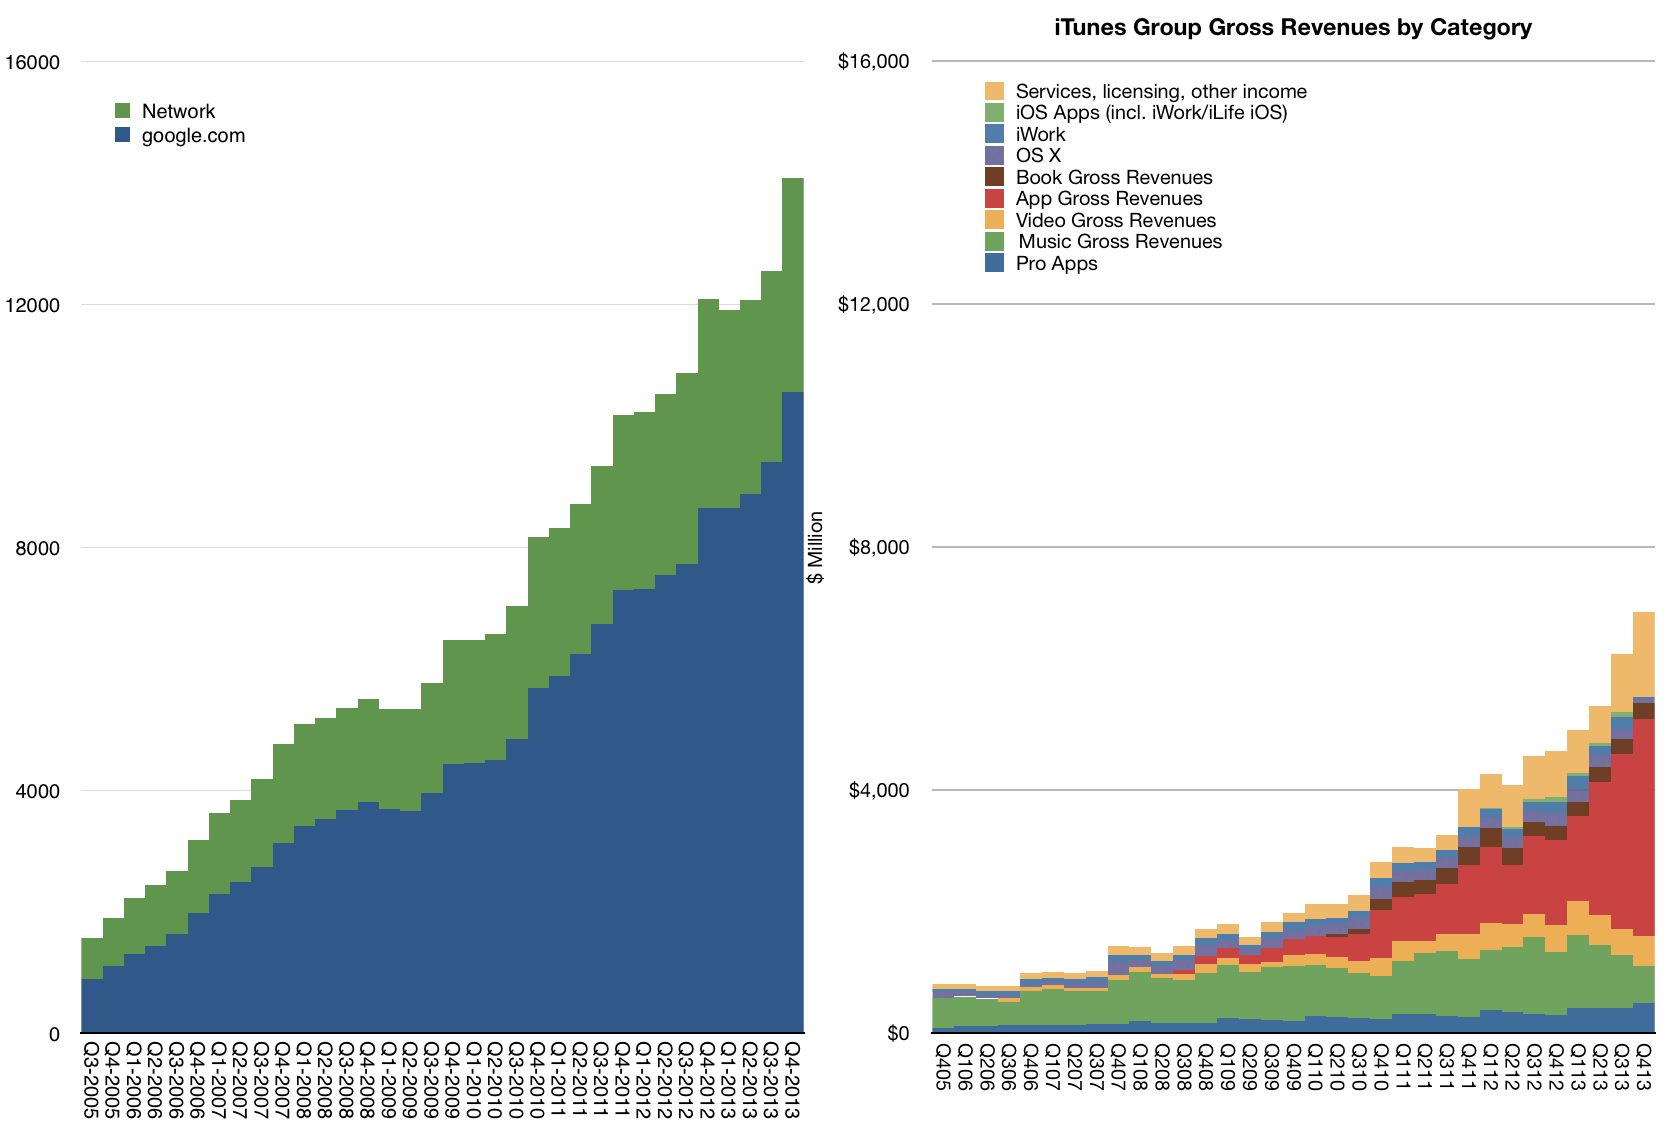
    To illustrate this, I plotted the history of gross iTunes revenues vs. Google's search business ((Excludes Motorola and "Other" segments as reported by Google))

    Screen Shot 2014-02-10 at 10.03.55 AM

    On a yearly basis iTunes/Software/Services is nearly half of Google's core business and growing slightly faster.

    The iTunes "empire" of content and services would be ranked as number 130 in the Fortune 500 ranking of companies (slightly below Alcoa and above Eli Lilly).

  4. When Apple reached parity with Windows

    Research · 419 comments

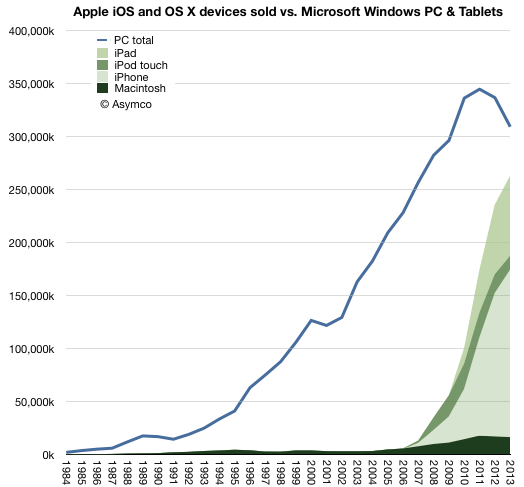
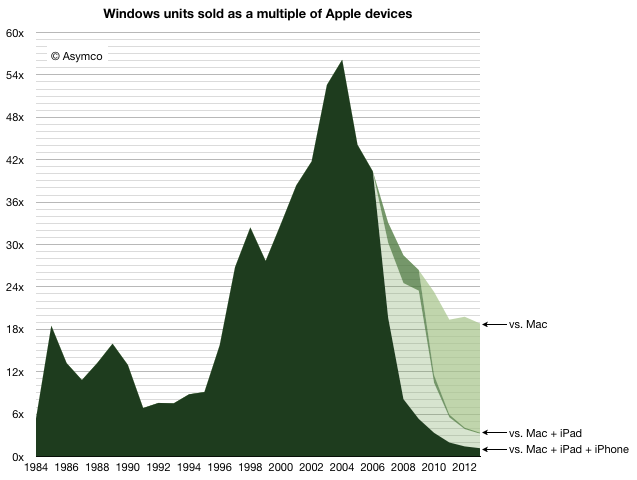
    In 2013 there were 18.8 times more Windows PCs sold than Macs. This is a reduction in the Windows advantage from about 19.8x in 2012. This decline is mostly due to the more rapid decline in Windows PC shipments relative to the more modest decline in Mac unit shipments. Gartner estimates that about 309 million Windows PCs were shipped, ((This figure is not published publicly but can be derived from subtracting Mac shipments from the total PC shipments which are published)) down from 337 million in 2012 (which was down from 344 million in 2011, the year PCs peaked.) I estimate about 16.4 million Macs were shipped in 2013 down from 17 million in 2012.

    The history of PC shipments relative to Mac shipments is shown in the following graph:

    Screen Shot 2014-01-13 at 1-13-3.09.21 PM

    I chose to graph the Mac data as an area with additional areas for iOS devices layered on top.

    When comparing these platforms, the contribution of the Apple mobile platform becomes striking.

    Nevertheless, it's still important to understand the role of the Mac. In years gone, the advantage of Windows was measured in multiples of Mac sales. That peak occurred in 2004 when there were 56 times more PCs sold than Macs. At that moment, when the Windows advantage peaked, the Mac sold 3.2 million units  into a market where 182 million PCs shipped. This means the Mac had 1.7% market share.

    Screen Shot 2014-01-13 at 1-13-3.09.51 PM

    And yet, remarkably, even with 1.7% share, the Mac did not disappear. The figure of 3.2 million units was not great and below the peak to date ((which was 4.5 million in 1996)) but it was enough to sustain Apple while it developed its next products. At the time the iPod was starting to grow rapidly and development on iPhone/iPad was already underway. The point being that there were new products. 3.2 million was a sufficient volume to preserve the company until such time when they would be ready.

    Today the situation is quite different. The total number of platform products Apple sold in 2013 was about 260 million ((This includes my estimates for Q4. We'll have the exact figure in a few days.)) The total number of users Apple has is above 550 million. ((Possibly 600 million.))

    Note the effect in the graph above. Even if we only consider the Mac, the Windows advantage has decreased considerably, and the platform was certainly not extinguished. The new form factor Mac Pro and the continuing improvements in the thinnest of laptops shows how Mac has not just survived but prospered as the underdog which easily captures the bulk of profits.

    But the bigger story is how Apple's mobile platform has nearly reached the sales volume of Windows. In 2013 there were only 1.18 more Windows PCs than Apple devices sold. Odds are that in 2014 they will be at parity. ((The prediction I made in 2012 was that "it’s safe to expect a “parity” of iOS+OS X vs. Windows within one or two years". The data so far does not change this expectation.))

    But will it last?

    It's important to understand just how the quantities involved here have a quality of their own. The quantities themselves speak of a change. It's not convincing to suggest that what comes around goes around and a reversal of fortune can be reversed yet again when there are several zeros added to the end of the figures involved.

    We have to understand that the Windows advantage itself came from the way computing was purchased in the period of its ascent. In the 1980s and 1990s computing platform decisions were made first by companies then by developers and later by individuals who took their cues from what standards were already established. As these decisions created network effects, the cycle repeated and the majority platform strengthened.

    But it was the large companies who made the core decisions. In the 1980s if the Fortune 500 companies all standardized on Windows then their suppliers and customers would also standardize on it. Add governments and other institutions and 80% of the market is probably decided. There was concentration in decision making. In other words, in the 80s a platform could win by convincing 500 individuals who had the authority (as CIOs) to impose through fiat a standard on the centers of gravity of purchasing power.

    Today, with mobile products there are billions of decision makers. 500 decisions mean nothing. In fact, Apple with at least 500 million loyal and wealthy users is considered to be in a precarious situation. That's partly due to the way other platforms like BlackBerry and Symbian found themselves in crisis with tens of millions of users. ((and hundreds, perhaps thousands, of corporate buyers deciding to support its platform exclusively. What IT does matters for little.))

    The decision making process for buying computers, which began with large companies IT departments making decisions with multi-year horizons, has changed to billions of individuals making decisions with no horizons. Companies have become the laggards and individuals the early adopters of technology.

    The fundamental shift is therefore in the quantity of decision makers and the quality of those decisions. Those who buy are also those who use and their decisions will be perhaps whimsical, maybe impulsive and not calculated, but fundamentally, in the aggregate, wise.

    Ultimately, it was the removal of the intermediary between buyer and beneficiary which dissolved Microsoft's power over the purchase decision. It's not just unlikely that this situation will be reversed, it's impossible. Computing decision making has moved to the furthest edge where use has been for decades. The computer has become personal not just in the sense of how it's used but in the sense of how it's owned.

  5. When will the migration from PCs be complete?

    Research · 129 comments

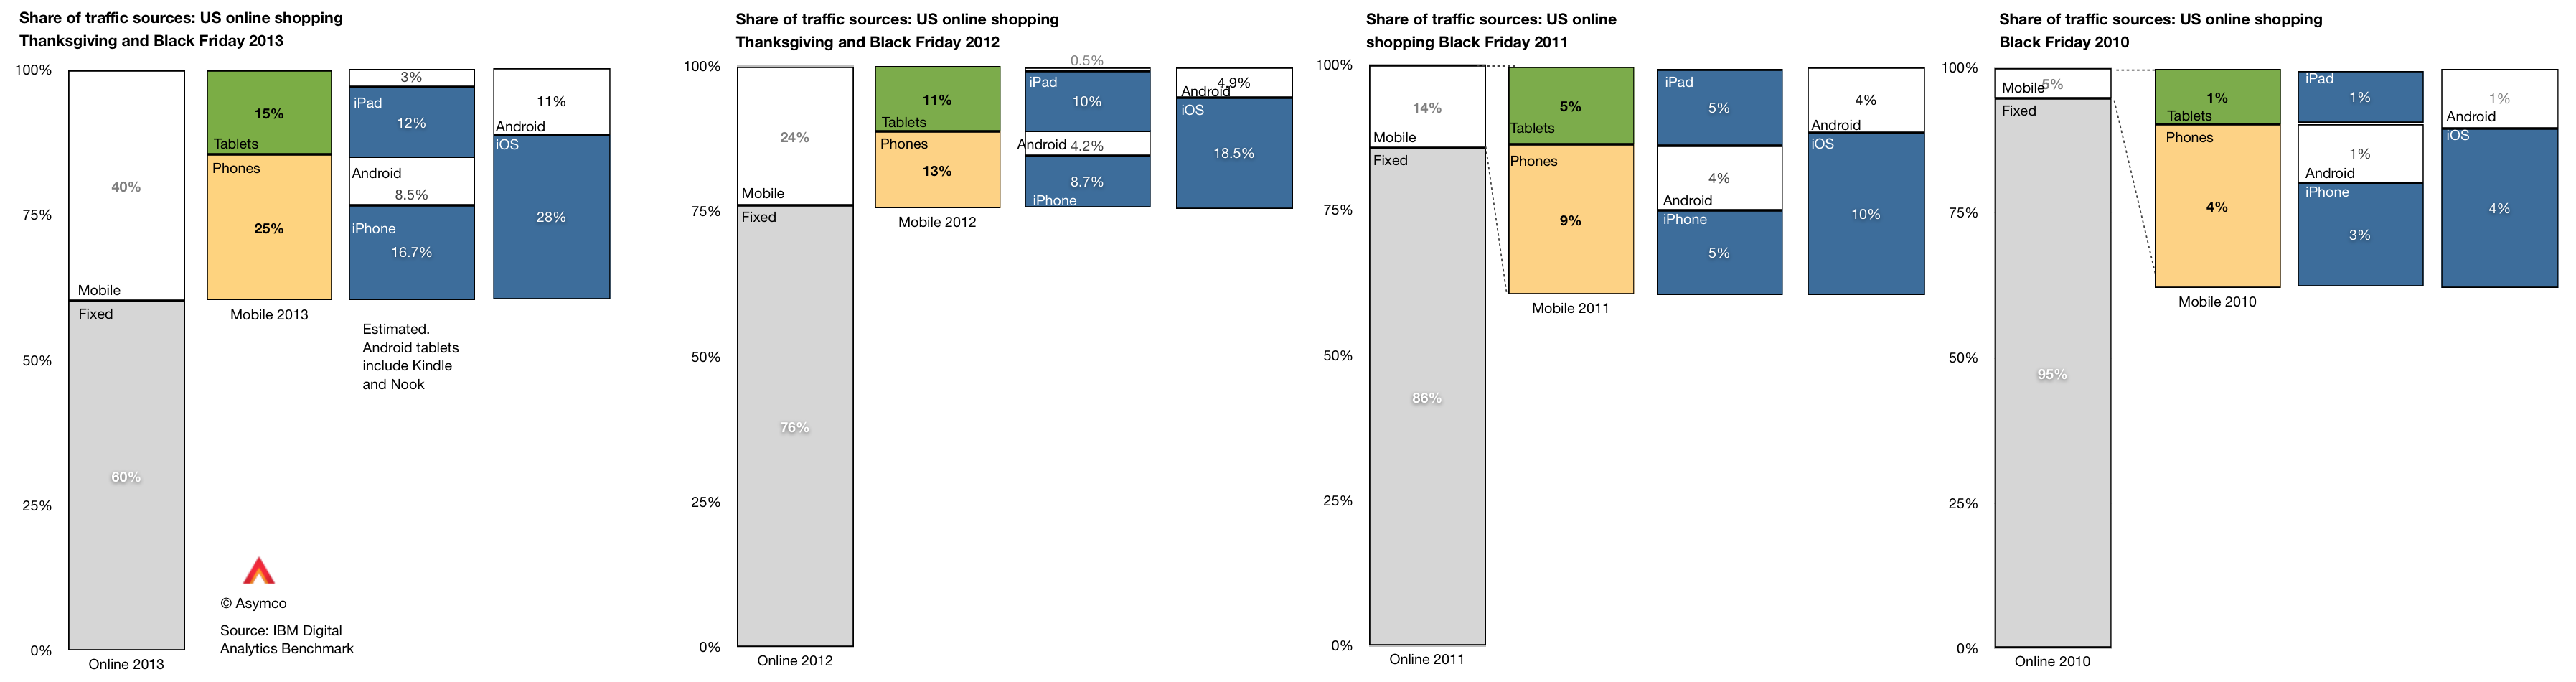
    IBM Digital Analytics Benchmark (report is here) has published, for the fourth year in a row, US online shopping traffic data with a split between mobile and fixed online traffic. It reveals a pattern of consumer behavior which is quite startling: people seem to prefer to shop using mobile devices.

    The data is shown below:

    Screen Shot 2013-12-02 at 12-2-6.45.34 AM

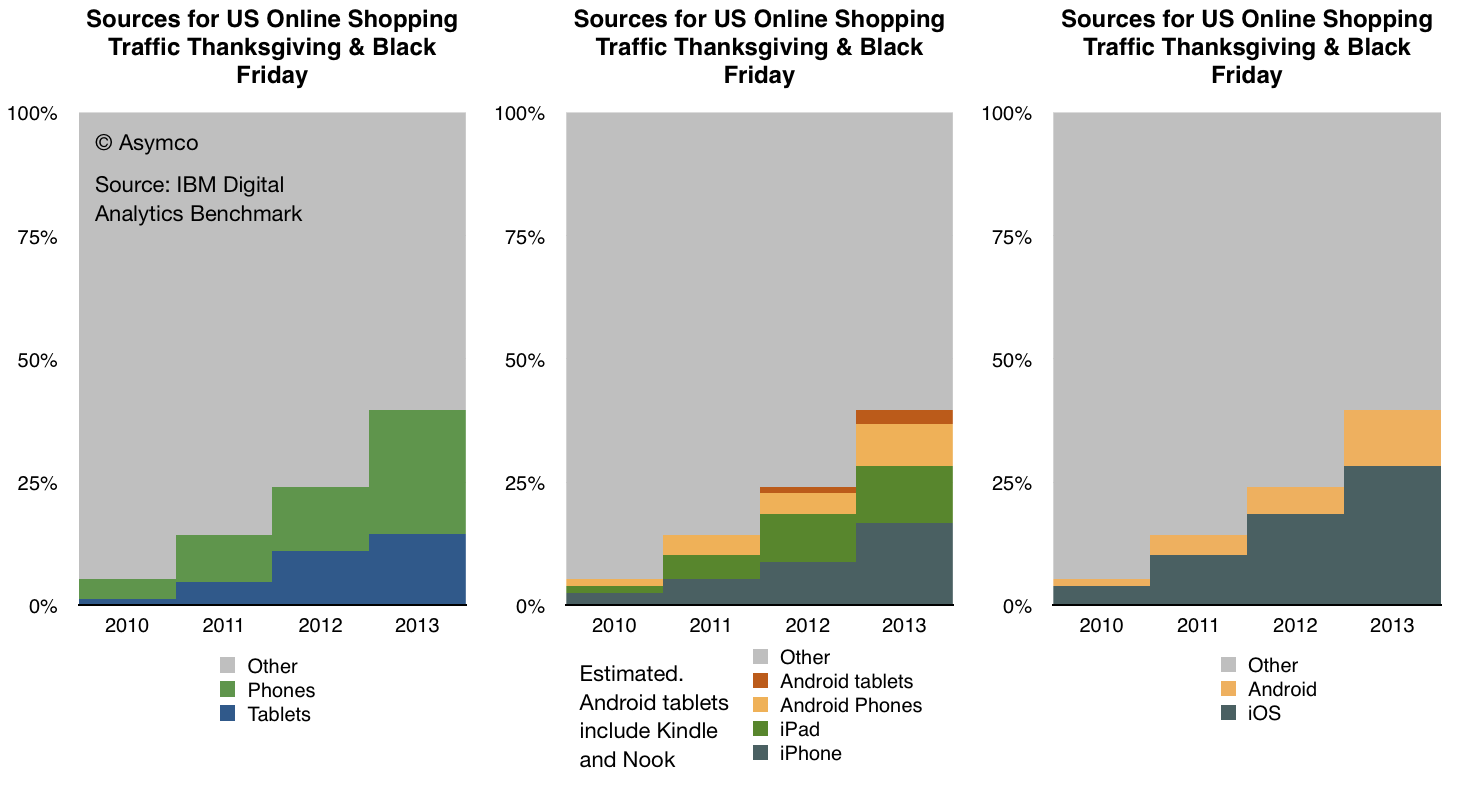
    In terms of sources of traffic, mobile devices (including tablets) have increased from about 5% of all online traffic to 40% in four years. Last year the volume was 24% implying that 16 points of share were gained in one year. If that is extrapolated to next year then more than half of holiday shopping traffic in 2014 will be on mobile devices.

    Put another way, next year less than half of users will hire a PC for the job of online shopping.

    If this conversion from PC-based shopping to device-based shopping follows a logistic substitution curve then the conversion to devices will probably be 90% complete in another 5 years or by 2018 or 2019. I see no reason why this particular job to be done (shopping) should not be considered a proxy for other jobs as well. Therefore it's not a stretch to imagine that the transition to post-PC consumption will also be practically completed by 2020.

    Within the data there is also a significant amount of detail beyond the mobile/non-mobile split in behavior. There is a distinction drawn between tablet and phone traffic and a further distinction between Android and iOS devices. ((The split between Android and iOS for tablets and phones was not published for 2013 but I extrapolated from previous years and assumed that 80% of tablet traffic was sourced from iPads vs 88% in 2012 and 99% in 2011. Note also that non-iPad traffic is assumed to be Android but that includes the Kindle and Nook products which are using partial and unsanctioned versions of Google's Android.))

    This more detailed view of the traffic is shown in the following diagram:

    Screen Shot 2013-12-02 at 12-2-7.00.20 AM

    A few observations:

    • The pattern of slowing tablet growth is likely due to the slowing growth in iPad sales. This itself is due to the lull in product launches as the shift to fall only iPad releases took place in 2012.
    • The consequence is that iPad traffic contribution only increased by 2 percentage points, from 10% in 2012 to 12% in 2013. Compare this with the doubling the previous year (from 5% to 10%).
    • Among phone users, both Android and iOS grew their contributions to traffic by roughly 100%. Android phone traffic increased from 4.2% of all traffic to 8.5% and iPhone traffic increased from 8.7% to 16.7%.

    As we also know the approximate number of phone users for each platform (via comScore) then we can also determine the per user contribution of traffic of each platform. ((Note that this is phones only.))

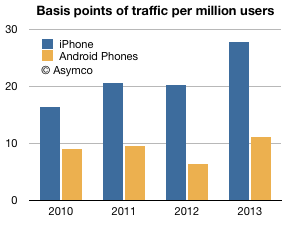
    The measure is "basis points of traffic per million users" and it is the result of taking the traffic data (in percent of total online traffic) and dividing by the population of users of a particular platform. The result is shown below:

    Screen Shot 2013-12-02 at 12-2-3.05.53 PM

    The way to read it would be that each million iPhone users generated about 28 basis points of traffic while each million Android users generated about 11 basis points of traffic.

    A way to compare these audiences would be to define the ratio between traffic usage by platform user. That ratio was

    • 1.83 (iOS:Android) in 2010
    • 2.16 in 2011
    • 3.15 in 2012
    • 2.51 in 2013

    So, as far as phones are concerned, US iPhone users are about 2.5 times more likely to shop online than US Android phone users. The data is reliable: with the US population now over 65% penetrated with smartphones, these populations of users (totaling over 130 million) are vast and representative. As the technology is reaching deep into the late adopter segments the difference in behavior between iOS and Android usage is becoming easier to explain. We have to eliminate quirks of demographics or income or other possible causes.

    The platforms themselves are becoming the last remaining suspects as causes for differences in the behavior of their users.

    It may seem preposterous to suggest that a platform can affect shopping behavior but let's remember that the PC, the subject of this article, is a platform in itself. The migration of usage away from the PC to alternatives can only be explained by the alternatives being superior at the particular job that needs doing. The argument is naturally extendable to each alternative individually.

  6. When will there be one billion iOS devices in use?

    Research · 94 comments

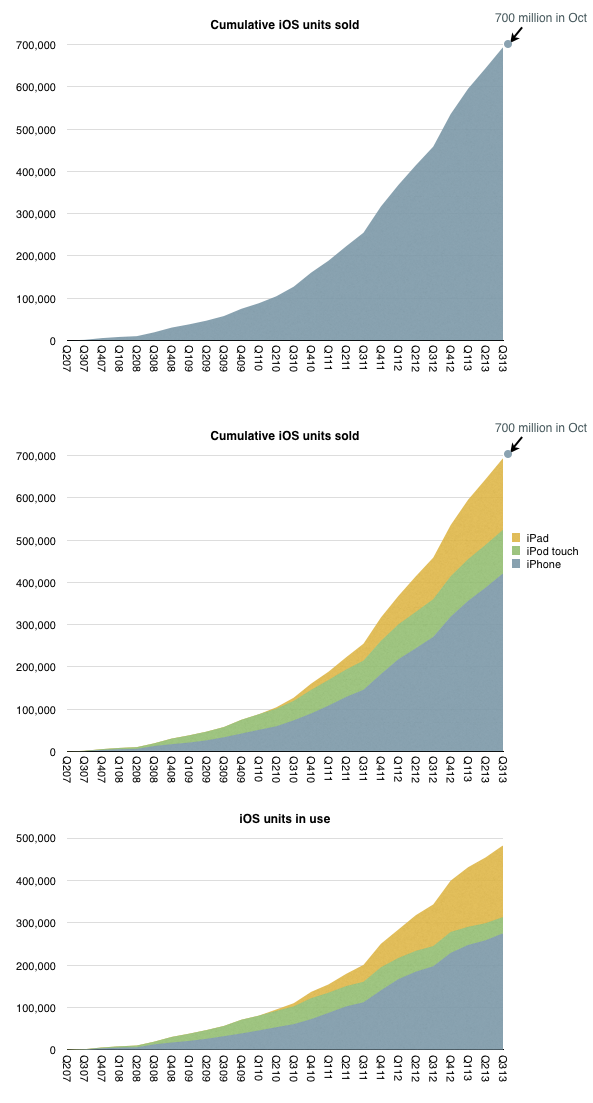
    iOS unit sales crossed over 700 million units last month. That is a significant milestone but the total number of units in use is likely to be lower. My estimate based on device replacement assumptions is that about 500 million are still in use.

    The estimated break-down of units sold and in use by device type is shown below:

    Screen Shot 2013-11-25 at 11-25-2.59.59 PM

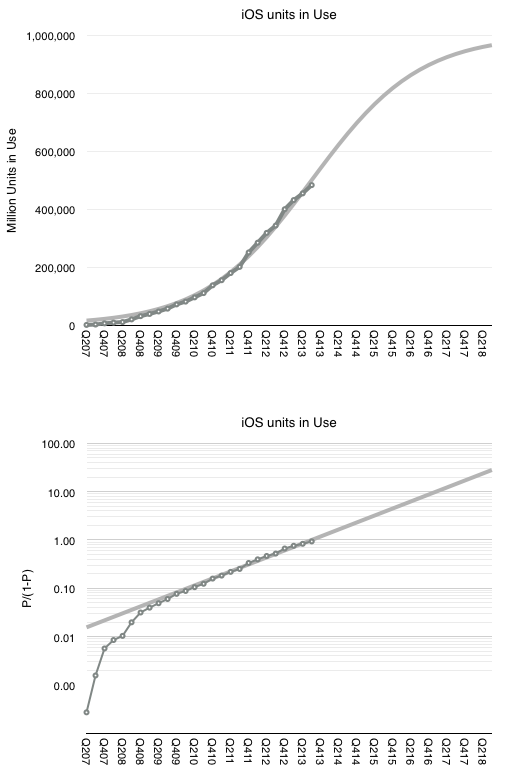
    When I looked at the penetration of iPhones in the US (as a part of smartphones in total) the surprising pattern was that it followed a logistic curve (while other platforms didn't.) If this is indicative of a particular learning process to be observed in the market, then can we extend the logistic growth pattern to iOS overall?

    I tried it with the assumption that at 500 million, iOS is at the half-way point in its growth. This assumption comes from growth being near an inflection point. It could be that iOS might accelerate further in which case peak penetration could be higher than 1 billion, but might take longer to reach.

    The 500 million as 50% penetration point assumption fits the model as shown below.


    Screen Shot 2013-11-25 at 11-25-3.23.10 PM


    The fit is pretty good for the period after the iPhone 3G launched. This assumption would therefore imply (nearly) one billion iOS devices in use by the end of 2018.

    Note that this does not mean one billion iOS users. The attach rate for iOS devices per user could well reach 2 by then placing total user base at 500 million. Note that this size of audience is very nearly the existing total Apple audience already (counting iTunes/iCloud accounts).

    This means that we already have "existence proof" that Apple can reach half-a-billion users. Apple does not need to discover a large new set of non-consumers. The idea of 1 billion iOS devices is simply the projection that each current user could some day use two devices.

  7. What's an Active User worth?

    Research · 86 comments

    Apple has sold 700 million iOS devices. Google claims one billion Android device activations. Microsoft has about 1.5 billion Windows users and Facebook about 1.19 billion. LinkedIn has 259 million users and Twitter has 232 million. Amazon has 215 active account holders and PayPal 137 million.

    Markets place a value on these users implicitly when company shares are priced. For example, Twitter whose users are worth about $110 or FaceBook's $98 and LinkedIn at $93.

    This consistency suggests a universally accepted value per social media user but what is the value of an ecosystem user? Apple, Google, Microsoft and even Amazon aspire to enable ecosystems which should be seen are more valuable than mere communities. Ecosystems enable a higher level of economic activity because they are unbounded by the medium itself. Any number of media can be created. Or so the theory goes.

    If we could determine a value for an ecosystem user we could test it against the going value of a social media user. Fortunately we have enough data to do so.

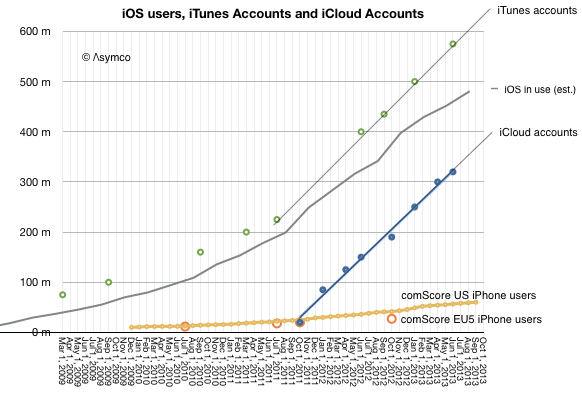
    The total number of iOS devices sold per quarter allows us to measure the install base of device users. With some assumptions regarding the retirement and attrition rate we can get the following history:

    Screen Shot 2013-11-11 at 11-11-11.52.34 AM

    Since the total number of iTunes accounts is updated with some regularity I've added it to the graph. I've also shown on the same graph the total number of iCloud accounts. For calibration, I included survey data showing the number of iPhone users in two regions (US and EU5).

    These combined graphs give us an upper bound of active users (iTunes accounts) and a lower bound (iCloud) calibrating our device-based estimate. The regional iPhone data offers some additional test on growth.

    The result is "about 500 million" ((482 million by my count but with quite a bit of margin of error)) with a growth of about 11 million per month.

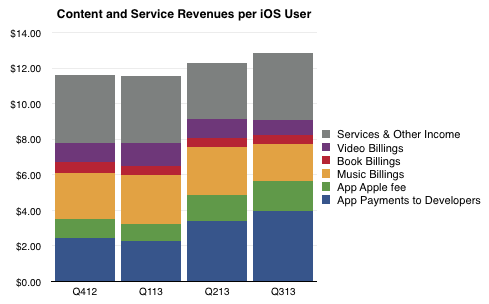
    So if we know with some confidence that there are about 500 million active users as part of the iOS ecosystem, how do we know how much value they generate? The answer is in the consolidated iTunes revenues as reported by Apple: $4.26 billion/quarter. With some attention to the reported media retail and purchases, the following picture of the average iOS user's quarterly spending emerges:

    Screen Shot 2013-11-11 at 11-11-11.50.23 AM

    The bottom line is that in the last 12 months the average iOS user contributed  about $48/yr to the ecosystem via Apple's own properties. They also bought the device and paid for cellular service in most cases. They may also have engaged in quite a bit of browsing and online purchases which fed other ecosystems. But as far as Apple is concerned, it transacted about $48 per user.

    As Twitter revenues last year were $317 million, the Twitter user today generates about $1.36 of revenue per year or one thirty-fifth of what an iOS user generates through iTunes and iCloud alone. And note that the number of iOS users is about twice that of Twitter.

    Of course one could argue that the iOS user's participation is not profitable for Apple. It does obtain massive cash flow from iTunes which finances its fashionable data centers and bandwidth but it does not presume to value itself primarily through this revenue.

    Or at least the market doesn't think so. We don't hear much about how Apple is worth so many dollars per user. ((I suppose the corollary to this is that Apple users are disloyal or fickle or fleeting, and quite contrary to observed behavior.))

    The paradox is that while the device which enables this commerce is where Apple guides the consumer's perception of value, markets discount devices and bid up services. In other words, users continue to pay for the devices which delight them enough to participate in services (especially the monthly billable kind) but markets walk right by these shiny baubles and and shower money on services which have negligible sales and even fewer profits. There must be some serious misdirection going on here. The question is who's being fooled.

  8. How many iOS devices will be produced in the next 12 months?

    Research · 57 comments

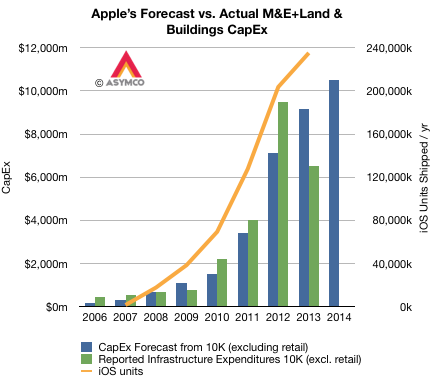
    Apple's capital expenditures for product tooling, manufacturing process equipment, corporate facilities and infrastructure has followed very closely their production of iOS devices. The pattern is shown in the graph below.

    Screen Shot 2013-10-30 at 10-30-2.12.28 PM

    Note that although reported expenditures did not match forecasts for 2012 and 2013, the differences nearly cancel each other. ((I suspect that the difference might be caused by a payment being brought forward in 2012.)) The company's forecast for fiscal 2014 is shown as well.

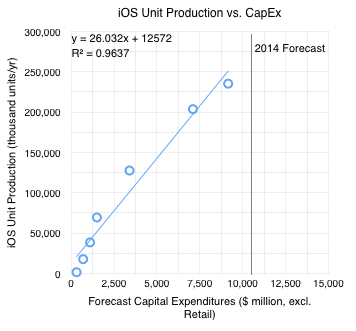
    The orange line shows iOS unit production ((Technically, shipments)) with the scale on the right-side axis. Note the correlation with forecasts on CapEx. The relationship can be seen more clearly in the following scatter plot.

    Screen Shot 2013-10-30 at 10-30-2.33.26 PM

    I added the 2014 Forecast ($10.5 billion from the latest 10-K filing). If the relationship holds into next year then the iOS unit shipments should be between 250 million and 285 million. ((The equation for the trend line shown suggests 285,908,000 units)).

  9. The value of zero-priced software

    Research · 129 comments

    Apple's latest product launch (new OSX, iPads, Macs and iWork/iLife) came with a change in pricing for software. OS X and iWork and iLife and updates are now made available free on new Macs and, in the case of the suites, on iOS devices as well.

    Recall also that iOS updates are now free as well and that OS X had been reduced in price from about $129 to $29 with Snow Leopard in August 2009 and to $19 with Mountain Lion in July 2012. The iSuites have also dropped in price over time so the pattern of evaporating software prices is long-running.

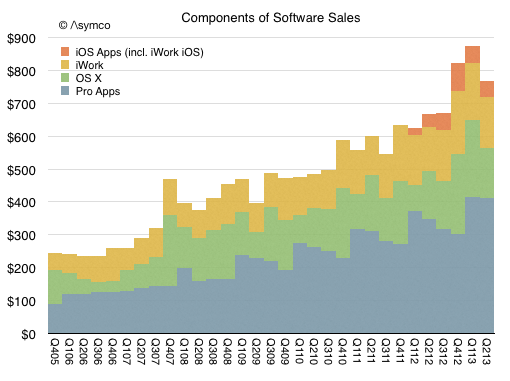
    But how fast and what is the impact? The historic performance Apple's Software business is not easily determined since it was always blended with additional businesses. Until September of last year, Software was reported as part of "Software and Services" and since then as part of "iTunes, Software and Services." Some assumptions allow the following picture to be drawn:

    Screen Shot 2013-10-24 at 10-24-5.07.03 PM

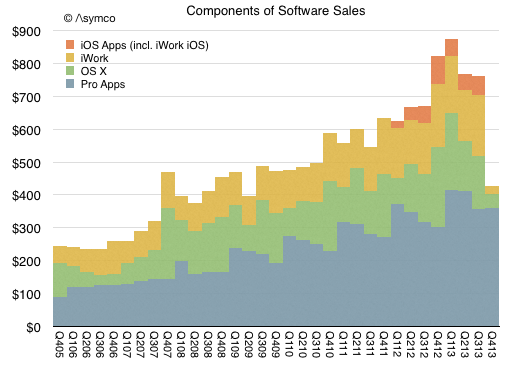
    One additional wrinkle to the Apple software story is that OS X and iWork/iLife are not all the software titles available. Apple's software includes Pro apps as well as the non-free OS X server. The non-free software US prices are:

    • Aperture: $79.99
    • Final Cut Pro: $299.99
    • Motion: $49.99
    • Compressor: $49.99
    • Logic Pro X: $199.99
    • MainStage 3: $29.99
    • OS X Server: $19.99
    • Apple Remote Desktop: $79.99

    Given that and additional assumptions can lead to the following picture of the components of Apple's Software sales (in $ million/quarter).

    Screen Shot 2013-10-24 at 10-24-5.08.54 PM

    Given this picture of the software business and the change in pricing, here is my forecast for the third and fourth quarters (in $ million/quarter):

    Screen Shot 2013-10-24 at 10-24-5.21.30 PM

    The foregone revenues could be as much as $450 million from what would have been received with existing pricing model.

    So the question that naturally arises is whether this is "worth it". Whether by offering free software hardware or service revenues rise.

    Perhaps. Certainly service revenue in the form of iCloud might rise with more usage of iWork and iLife. But I don't think that this is the calculus underlying the decision. Remember that Apple does not have a Profit/Loss accountability. It's not necessary (and perhaps not even preferred) that a division balances costs and revenues. ((The graphs in this post (and the preceding 1900 on this blog) were created using Numbers.))

    Fundamentally Apple remains a systems company where software is a key element in its definition of value. That is not changing. What is changing instead is the bundling of application software with the systems software and the system itself. The presence of iWork and hassle-free updating of that suite (and the same for the OS) means that utilization rates will increase.

    I believe the logic for Apple is that usage of the products determines their value and therefore placing powerful software in the hands of more users means they will value the entire system more. This leads to the notion of greater "stickiness" or "lock-in" but also to higher satisfaction and loyalty, rate of upgrades and even more third party purchases and yet more usage.

    This is the virtuous cycle platform custodians seek to engender. This is what Apple is trying to build and the transition of apps into the system bundle is part of this re-enforcement.

    One wonders how long before Apple's approach becomes the norm for other platforms.

  10. Think local, act global

    Research · 113 comments

    One of the curiosities of the mobile phone market is how vast it is but also how heterogeneous it has always been. I wrote about this in 2010:  Smartphone parochialism: How operator policies prevent or promote platform adoption. This observation was influenced by my time at Nokia where I became amazed at how differently users behaved in different countries.

    There were many causes. Some cultural, some historical, some economic and some policy-driven. The result was that it presented a challenge to any company with global ambitions and indeed it was rare to see the same company do well in every market. Japanese companies did well in Japan, European companies did well in Europe and US (and Korean) companies did well in the US. Nokia was most successful because it was able to apply an European model more broadly (but not in the US). Samsung succeeded by simply adapting to each and every market with hundreds of products. But it was a particularly "provincial" market.

    My assumption was that when smartphones would become the majority of phones in use there would be a normalization of behavior and thus a homogeneity of preferences. This is, after all, what happened in other platform games. PC form factors are globally consistent, PC operating systems are equally preferred around the world, FaceBook, Google and Twitter are also, unless censored, uniformly popular. Apple's iPod eventually also became a global phenomenon with no material difference in preference by market. Likewise for game consoles. ((Although Japanese do seem to prefer Japanese platforms more.))

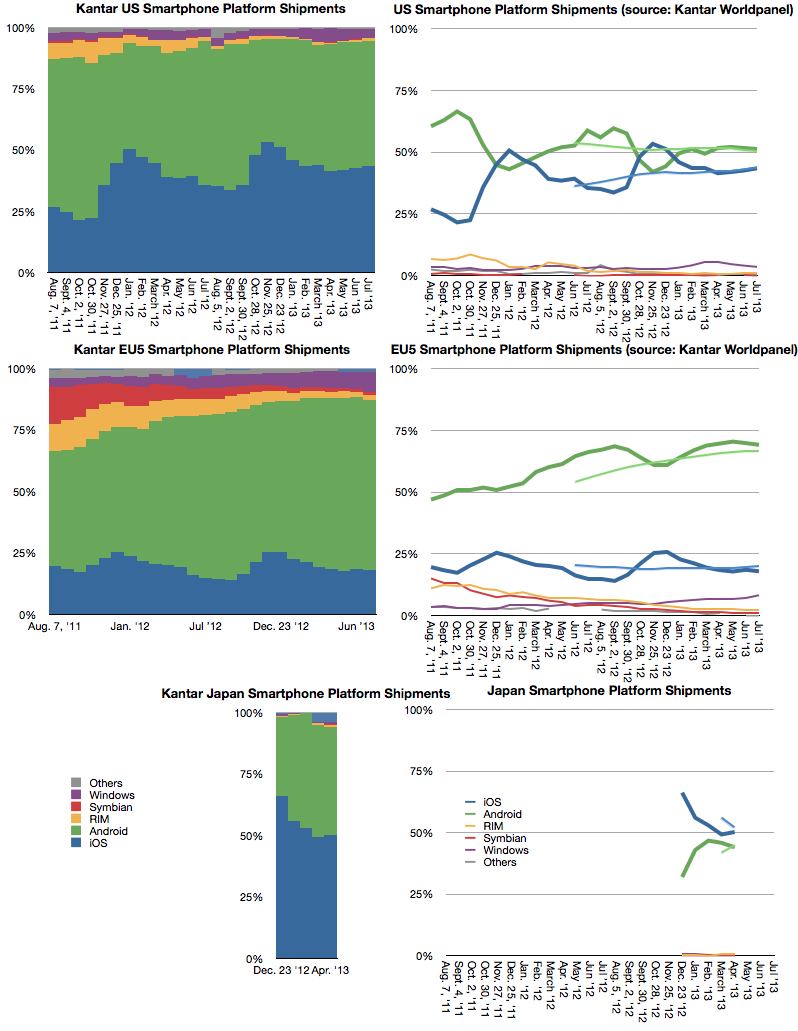
    However, a decade after the broad adoption of smartphones, the relative popularity of various platforms is still unevenly distributed. Prior to the iPhone, Symbian was strong everywhere but the US and BlackBerry was very strong in the US but weak elsewhere. Windows Mobile had footholds in some markets but little traction in others. Today the picture has changed but it's still a patchwork of preferences. Consider the following graphs.

    Screen Shot 2013-09-18 at 9-18-12.57.15 PM

    They are the most detailed sets of data on platform phone purchases but they not the only data: We also know that Android is vastly more popular in India from web usage statistics. We know that BlackBerry is sensationally popular in Latin America and the Middle East. We know that within Europe there is a gap between North and South in iOS vs. Android and even more pronounced between East and West. We know that whereas iPhone was a huge hit in Korea upon its launch there, Samsung and LG swamped it in the last two years.

    But the data shown above is the story of iOS being very popular in Japan and increasing its share in the US while being flat in EU5. Again these three markets are different but each contradicts the global picture.

    Note the differences in trend not just absolute performance. This is what is puzzling. There seems to be a divergence between markets: Markets are become more islands onto themselves rather than one whole. This contradicts all the theories of how computing markets should behave (network effects, ecosystems, monopoly power, etc.) It implies that there is still a great deal of friction in the market; friction which I suspect to be due to the peculiar nature of telecom economics.

    I wonder if this observation is, as usual, late on my part and that Apple's iPhone product marketing has seen it years ago.

  11. A new platform classification

    Research · 35 comments

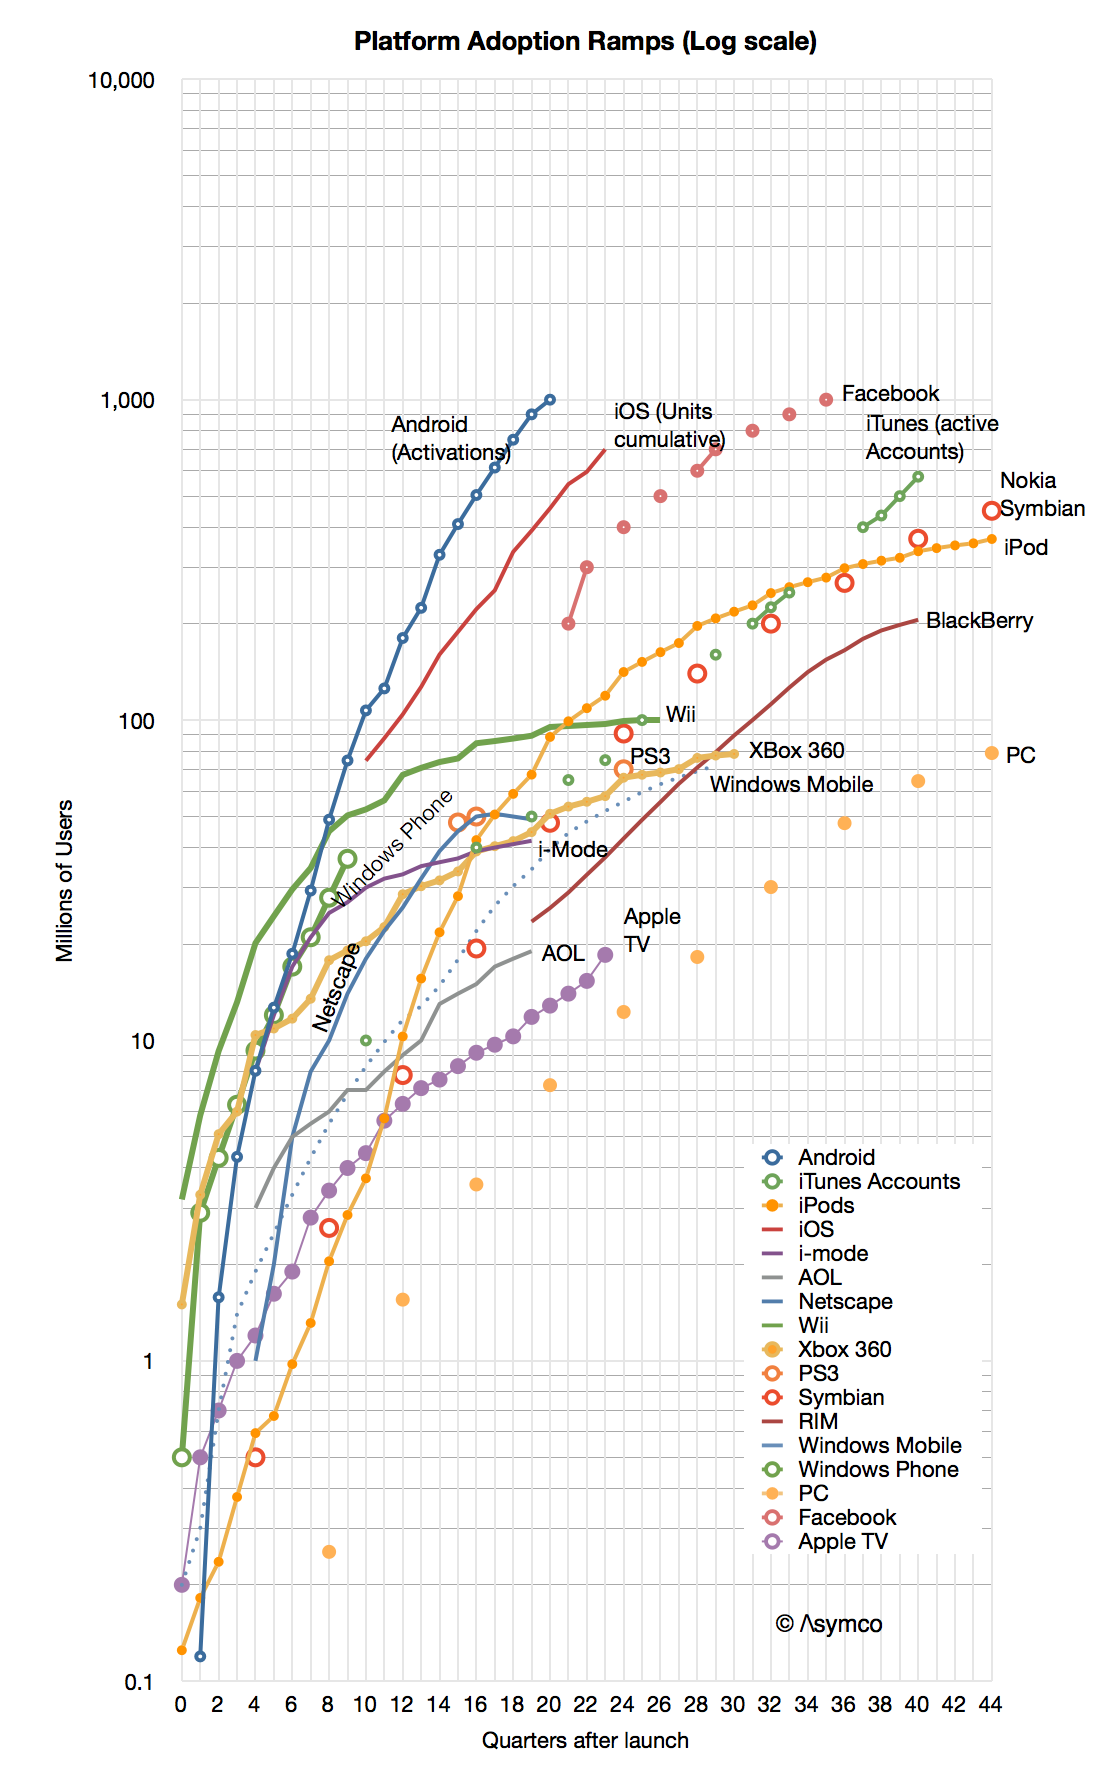
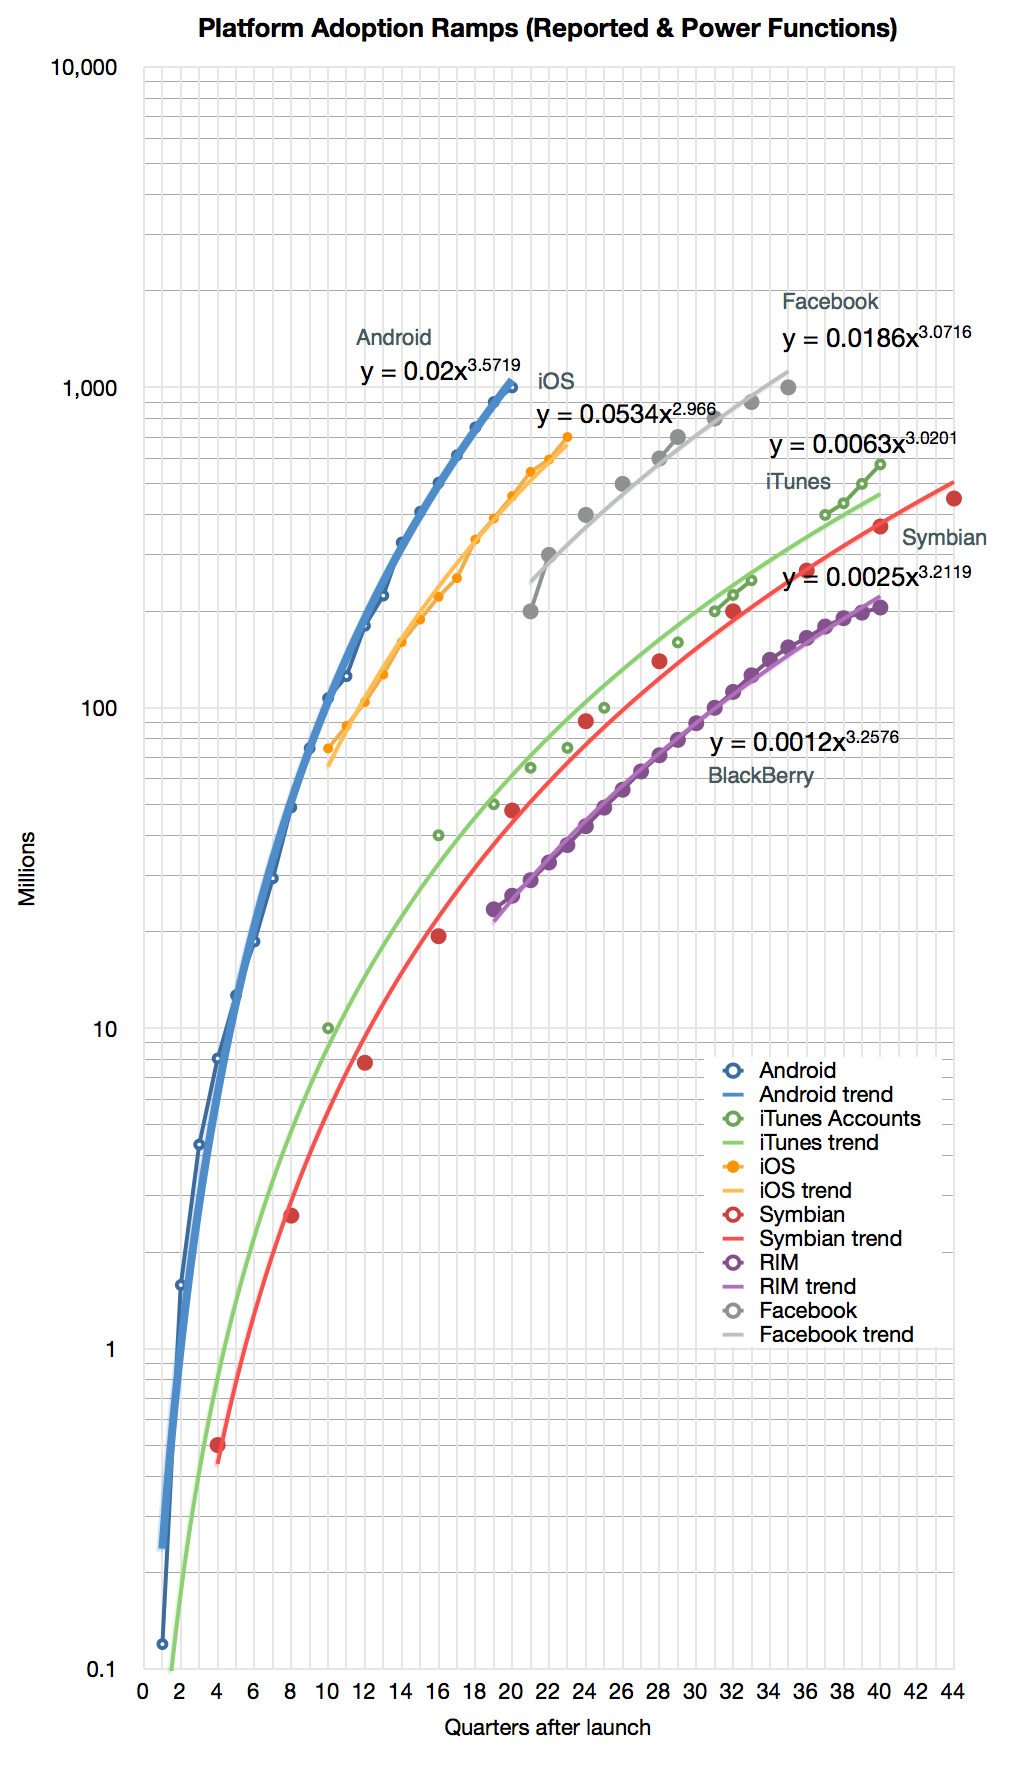
    When looking at the Race to a Billion data I noticed that some platform adoption ramps look quite different from others. It's not just a matter of "slope" or rate of growth but a distinctly different shape.

    If you look at the graph below you might see the difference yourself.

    Screen Shot 2013-09-12 at 9-12-4.41.13 PM

    First, note that the graph is logarithmic. A straight line on a log chart implies exponential growth (the y values are a constant to the power of the x value). However, none of the graphs show straight lines. None of the platforms follow exponential growth ((Except perhaps in the very early periods)).

    Second, we can eliminate linear or logarithmic functions. They simply do not fit.

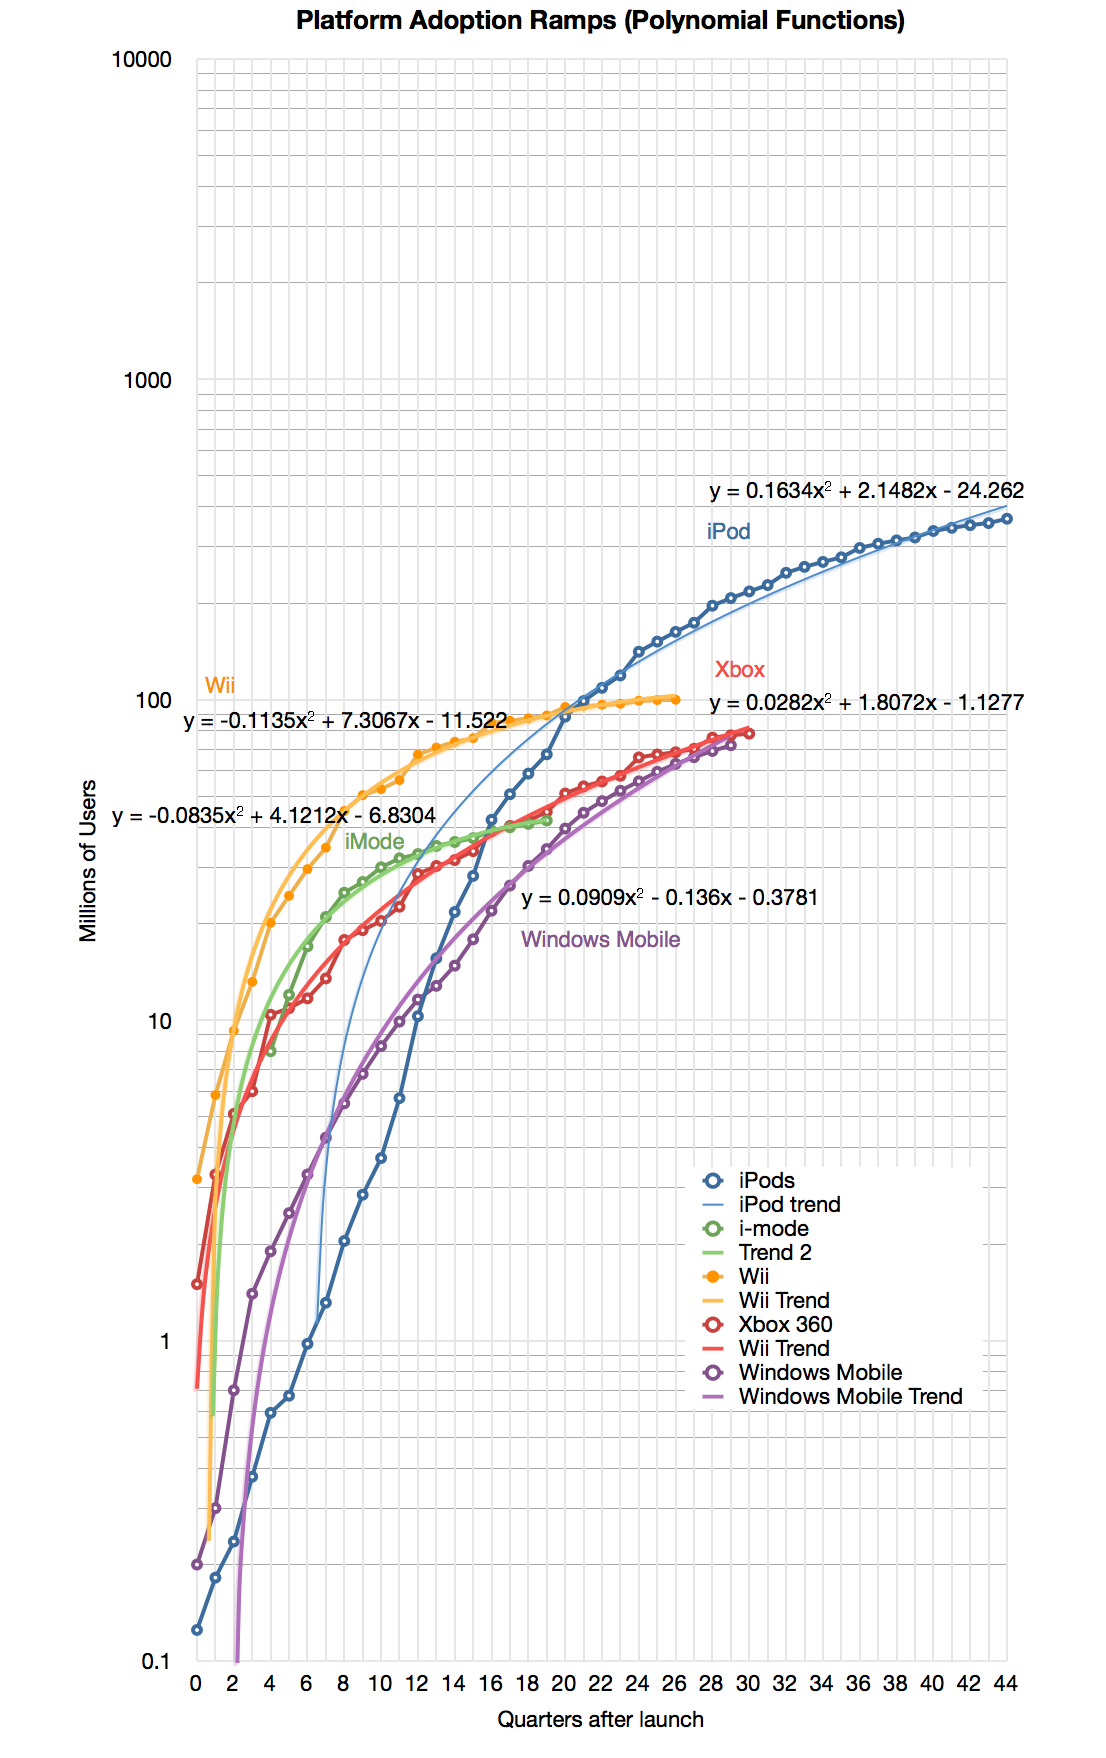
    That leaves: polynomial or power. It's easy to test these alternatives for all the functions and it becomes clear that most of the platforms split into one of these two classes.

    Here are the classes ((Some of the platforms had to be dropped because there was no easy fit. My observation is that some of these platforms went through some crisis or change in strategy during their history which caused the pattern of growth to change)):

    Screen Shot 2013-09-12 at 9-12-4.43.43 PM
    Screen Shot 2013-09-12 at 9-12-4.44.58 PM

    Note that I added the formulas for the selected platforms.

    I named these classes after their function types: "Power platforms" or "Second Order platforms" ((Note that all Polynomial functions found above are second order)).

    This classification has two benefits:

    1. It allows a clearer distinction in scope. Both may exhibit signs of network effects, but Power platforms seem to exhibit "global" or unlimited reach while Second Order platforms may have a strong upper bound on reach.
    2. It allows more reliable forecasting. If a platform classifies as Power, the forecast could be created with fewer data points.
    3. It allows us to guess at the causes of entry into each class for any potential platform challenger.

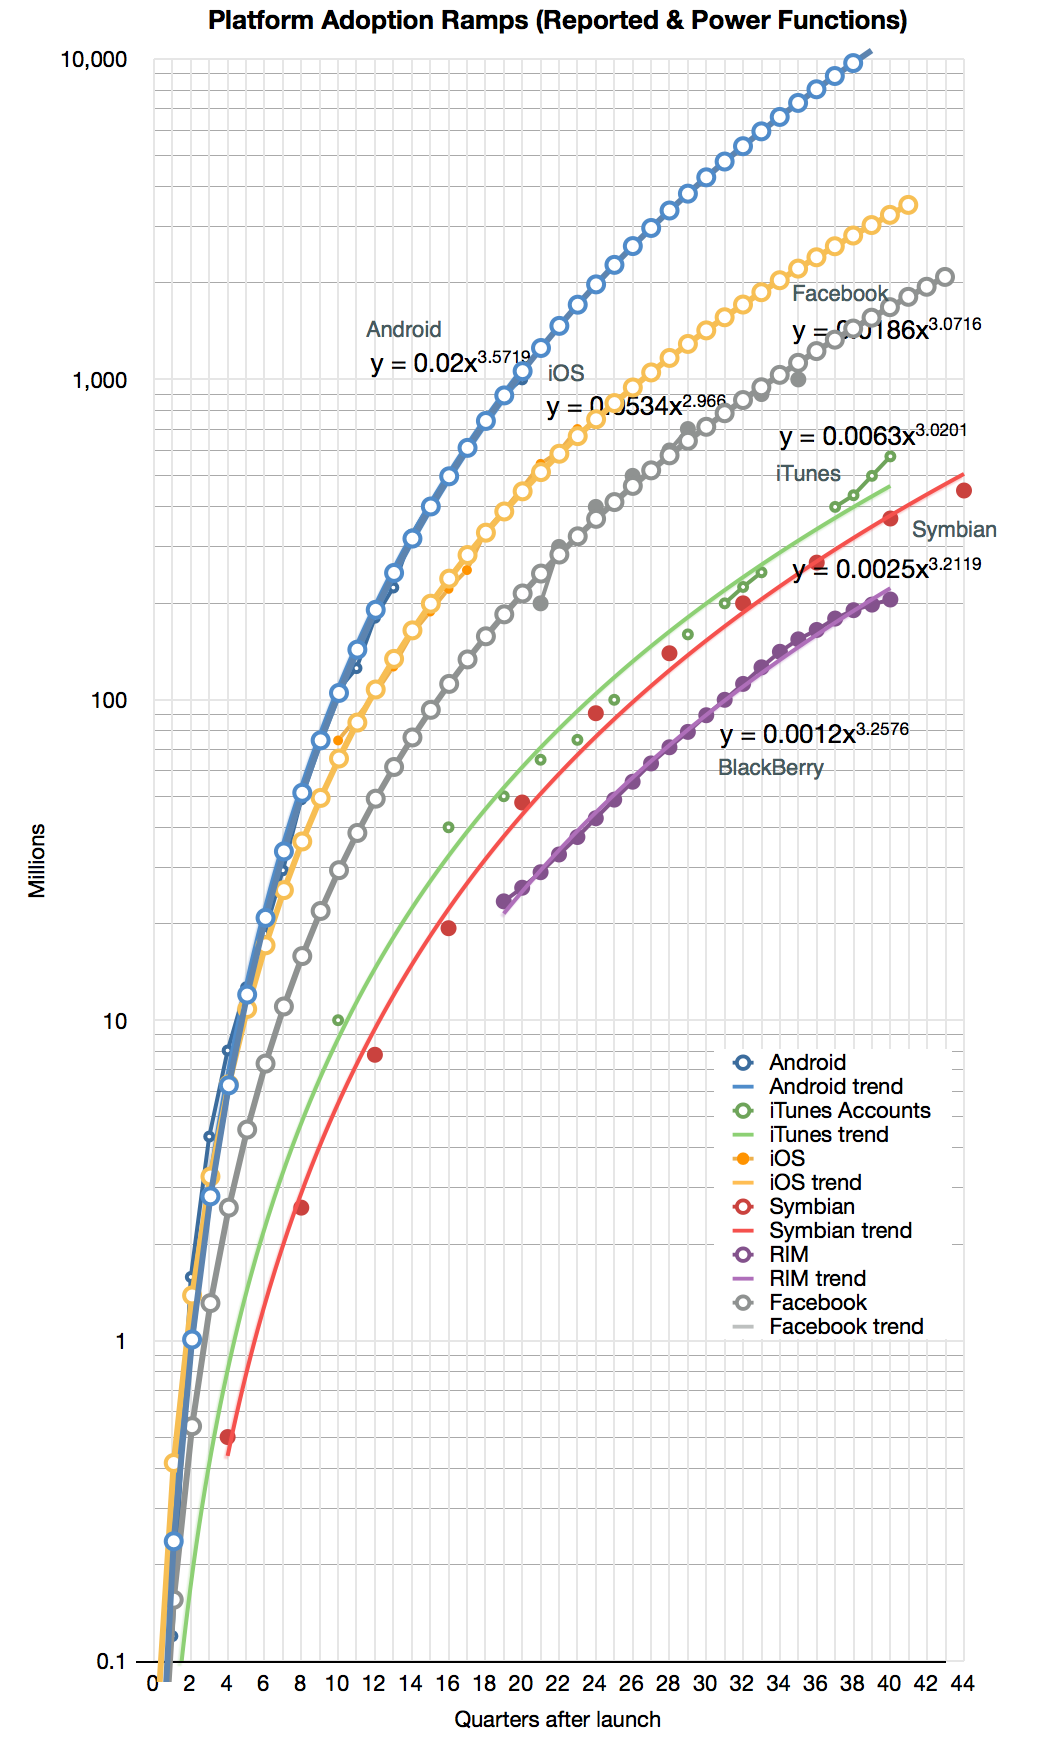
    To illustrate the second benefit, I took the Android, iOS and Facebook power functions and modeled (i.e. extrapolated) them for a few quarters into the future. The result is shown below:

    Screen Shot 2013-09-12 at 9-12-4.46.01 PM

    The forecast shows the following:

    • Android will reach 10 billion activations 10 years after its release (mid 2018)
    • iOS will reach 1 billion units sold by end of next year and 3 billion units by its 10th anniversary in 2017.
    • Facebook will reach 2 billion users by 2015 after the end of its 10th year.