Asymco

Asymmetric Intelligence

iOS

  1. Third to a billion

    Research · 168 comments

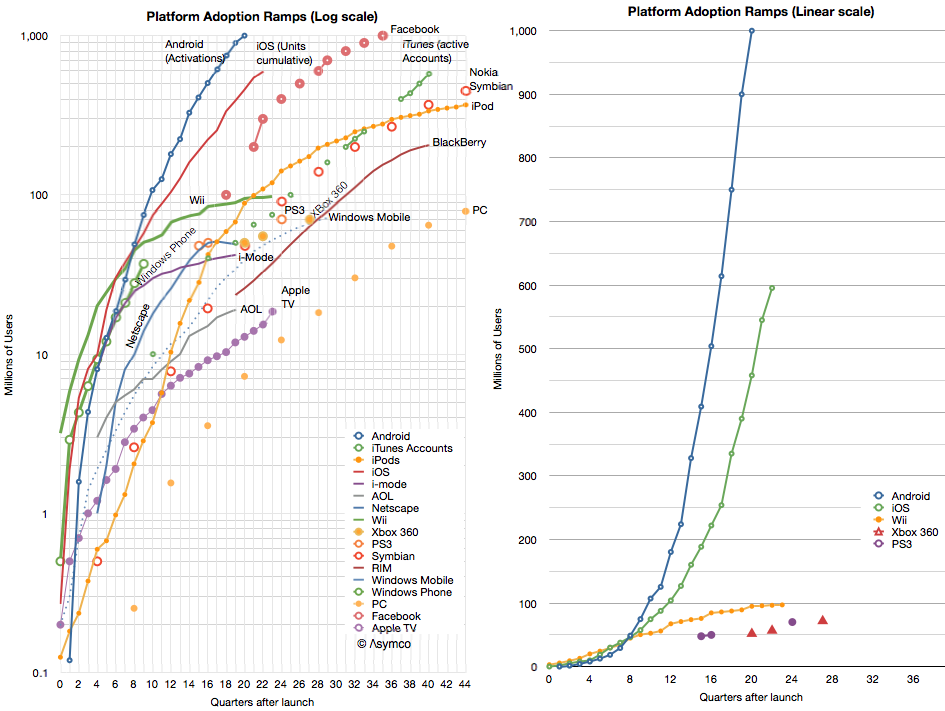
    Android is the third platform to reach a billion users ((Although activations are not users, I'm assuming that usage is not far behind and the cumulative sales figures I gather are roughly comparable.)) .  The first was Windows and the second was Facebook. Apple sold around 650 to 700 million iOS and is expected to be the fourth to a billion sometime next year. ((Separately, iTunes reports 575 million account holders.))

    If we define the Race To a Billion to be bounded by a time limit of 10 years, then Windows does not qualify and Android is actually second. The race is shown in the following graphs (the one on the left is logarithmic scaled, the one to the right includes only a few contenders for illustrative reasons).
    Screen Shot 2013-09-06 at 9-6-4.06.29 PM

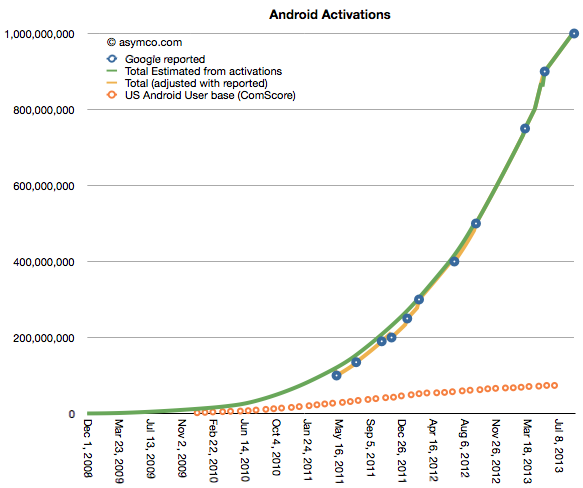
    Android's activations as reported are shown in the following graph:
    Screen Shot 2013-09-04 at 9-4-1.15.38 PM

    Without qualification, Android has been a viral success story. It reached one billion activations in about five years, almost half the time it took FaceBook and far faster than Windows.

    However, Android growth can be qualified. I added another set of data which is the number of US Android phone users as deduced from measurements by ComScore. ((ComScore surveys users on their primary phone. Survey includes only those aged over 13 years and excludes phones issued by businesses.))

    One way to read the two graphs is: Between March and August, of the 250 million Android devices activated, 4 million were to new Android consumers in the US. In other words, In the last six months, 1.6% of Android activations went toward new usage in the US. The equivalent figure for iOS is about 6%. Note that these are new users, not included are upgrades. It's likely that more of the US buying goes toward upgrades because iOS has been in use longer.

    So whereas Android is growing very rapidly, there is a question of reliability of that audience. Engagement is one thing, but in the market which shows highest penetration (and deepest distribution of an alternative) Android is peaking.
     

  2. iTunes Update

    Research · 29 comments

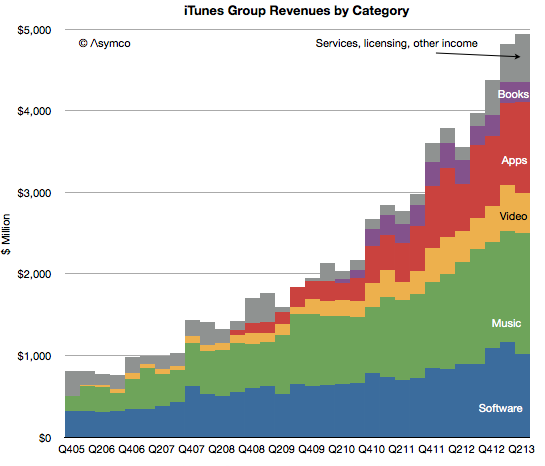
    In the latest quarter the iTunes group top line grew by 25%.

    Additional newly reported items:

    • Quarterly revenues dipped slightly to $4 billion (second highest after $4.1 billion last quarter).
    • iTunes Stores billings (i.e. gross content revenues) were $4.3 billion
    • Reached the best month and best week ever for App Store billings at the end of the quarter.
    • iTunes billings translated to quarterly revenue of $2.4 billion, up 29% from the year ago but flat q/q. Company reports “strong growth in revenue in both content and apps.”
    • New content added includes HBO GO and WatchESPN available on Apple TV. Apple TV catalog now includes over 60,000 movies and over 230,000 TV episodes.
    • Users have downloaded more than 1 billion TV episodes and 390 million movies from iTunes to-date. They are purchasing over 800,000 TV episodes and over 350,000 movies per day.
    • iOS developers have now created more than 900,000 iOS apps including 375,000 apps made for iPad. Apps created grew by 50,000 overall and 25,000 iPad apps.
    • Cumulative app downloads have surpassed 50 billion.
    • App developers are being paid at the rate of $1 billion per quarter.
    • App developers have been paid over $11 billion for their sales through the App Store (half of which was earned in the last four quarters.)
    • There are now over 320 million iCloud accounts
    • There are 240 million Game Center accounts
    • Almost 900 billion iMessages have been sent
    • Over a 125 billion photos have been uploaded and over 8 trillion notifications were sent.

    Some observations and estimates:

    • Music revenue growth remains at around 15% while video revenue growth remains around 25%
    • Apps continue to accelerate with a near doubling of revenues
    • Book revenues are contracting as pricing pressure is being felt
    • The software group grew moderately at 15% as Apple’s apps are reaching saturation within the iOS user base and as Mac sales stagnate.

    As a reminder, you can order the iTunes Business Review from the Asymco Store.


    Screen Shot 2013-08-05 at 8-5-4.21.54 PM
  3. The iPhone Stores

    Research · 29 comments

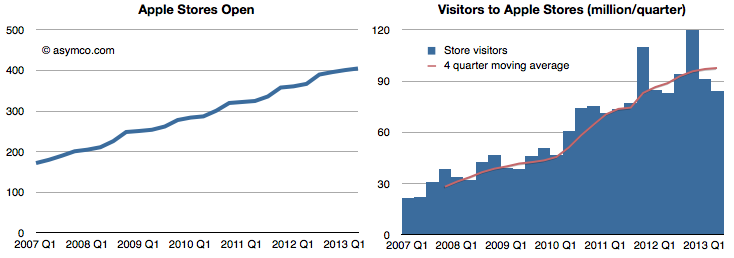
    Here are the latest performance figures for the Apple stores:

    Stores Open and Visitors

    Screen Shot 2013-07-30 at 7-30-2.17.25 PM

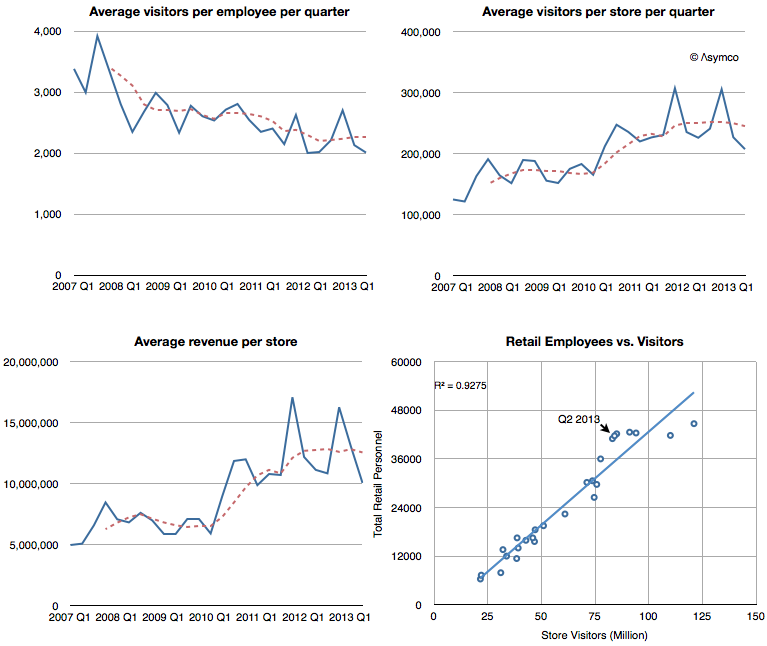
    Visitors per employee,Visitors per store, Revenues per store and Employees correlated with Visitors.

    Screen Shot 2013-07-30 at 7-30-2.15.23 PM

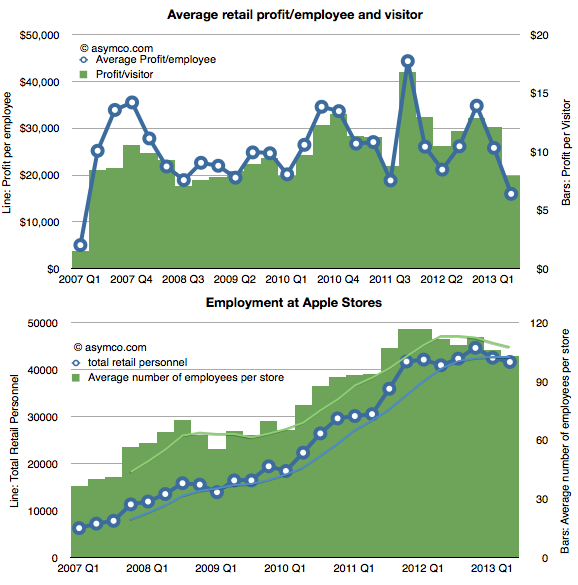
    Employment and Profitability (per Employee and per Visitor)

    Screen Shot 2013-07-30 at 7-30-2.17.48 PM

    The pattern that seems to appear is one of a plateau or peaking of sales, especially when values are seen on a per-store basis. Revenues, employment and visitors per store are all flat or slightly down when seen on a seasonally adjusted basis (trailing four period average).

    Profitability has been more steady over a long period, though more volatile in a short-term window.

    Seen in isolation, Apple Stores would appear to be coming to a point of quiescence.  But they should not be seen in isolation. Apple Stores mainly sell Apple products, so if Apple products slow then retail sales should also slow.

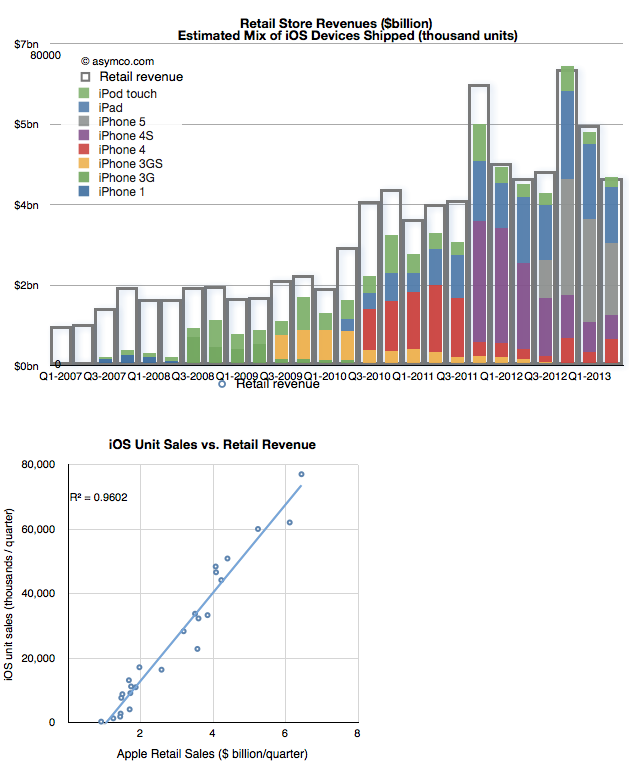
    Indeed, in 2007 Steve Jobs told Fortune that the Apple stores had been built to sell the iPhone and in 2010 Ron Johnson said the Apple stores had been built to sell the iPad. These statements were meant metaphorically but they are literally true when looking at what is actually sold. The following graph shows the relationship between iOS device sales and Retail revenues.

    Screen Shot 2013-07-30 at 7-30-2.17.56 PM

    The first chart shows the relationship plainly enough and the r-squared coefficient of 0.96 puts a finer point on it.

    So at the end of the day, the performance of the Apple stores depends on the performance of Apple's portfolio of products. It stands to reason that as iOS units slow, Apple stores should as well.

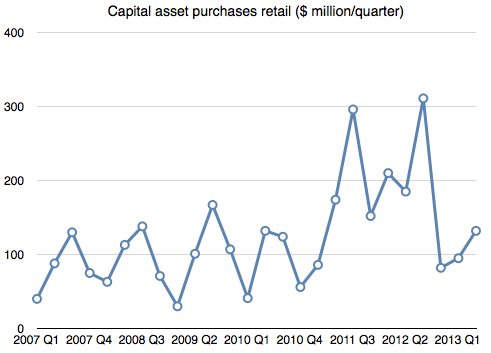
    This is something Apple management should be well aware of. Therefore, if Apple were confident in the future of iOS it would be investing in retail (as it would in other capital projects like manufacturing.)

    And that answer would be here:

    Screen Shot 2013-07-30 at 7-30-2.47.21 PM
  4. Apple’s 3Q FY13 Review (Padcast)

    Research · 16 comments

    Preview 3Q-13 screenshot

    Using interactive graphics and narration, this latest Apple Earnings Review discusses Apple's performance in relation of its historic performance as well as to expectations (published in the Preview) on the following topics:

    1. Guidance vs Actual performance: Now that Apple changed the way it provides guidance, are we seeing a new degree of precision in their signaling. We look at the history of earnings guidance and how effective (or not) the current method is in helping predict performance.
    2. Gross and Operating Margins analysis: What is the pattern of margins and how important are margins to the perception of competitiveness?
    3. Margins by product. How are margins allocated by product?
    4. Average selling prices for each product. Any surprises in Pricing? What was the magnitude, cause and significance of iPhone ASP drop.
    5. iOS product shipments. Comparison with expectations, trends and explanations. Overall iOS growth story.
    6. Cash balance and the effect on cash of share re-purchase.
    7. Sales growth and Earnings growth, a long term retrospective.

    Duration is about 1hr.

    As a reminder, the Padcast can be reviewed interactively users can access to the underlying data.

    It's available for download on the iPad for $19.99. Those who already bought the Preview will be receiving an updated version soon that includes the Review at no extra charge.

  5. Switcher

    Research · 91 comments

    Nokia's Windows (Smart)Phone performance was drowned out last week by Microsoft's big announcement of the Surface inventory write-off. They are pieces of the same puzzle however.

    First, a look at Nokia.

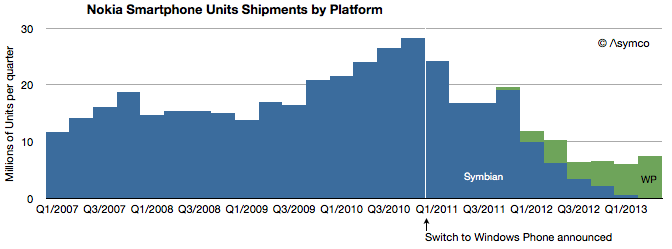
    There were 7.4 million Lumia phones sold in Q2 with 0.5 million sold in the US. Although Windows Phones grew sequentially from 5.6 million the previous quarter, and up from 4.0 million in the same quarter last year, total smartphones are down y/y and nearly flat over the last four quarters. This is of course because Symbian phones have finally disappeared from volume shipments. The following graph shows the history of Nokia's smartphone shipments.

    Although it's tempting to compare Lumia to iPhone (given the premium positioning in the US) the average price of €157 or $206 shows that Lumia is more adequately compared to Android. This is about a third of what Apple gets for its iPhones.

    That's not necessarily a bad thing. Nokia's always had a knack for mass-market phones and certainly that was one reason Microsoft was attracted to them. Presumably, the promise of the relationship was to insert Windows Phone into the Nokia development and distribution pipeline, squeezing out costs and filling up channels.

    Screen Shot 2013-07-22 at 7-22-3.24.21 PM

    The problem for the brand has been that although priced at Android levels, volumes are nowhere near and the gap is widening. At current activation rates, Android is selling 16.5x faster than Windows Phone (assuming 90% of Windows Phones are Lumia).

    So Nokia's problems become Microsoft's problems. As bad as Nokia seems to be doing with Lumia, it's doing a lot better than Microsoft with hardware. Here the story of the great Surface write-off should give pause. Microsoft announced that it would write off $900 million of Surface.  In terms of write-offs this is pretty significant. Compare it with the debacle of the PlayBook write-off when BlackBerry (then known as RIM) wrote off $485 million for tablets it could not sell. Or with Microsoft's own write-off for the Kin which took $240 million out of its shareholder's pockets. The only charge for hardware that I found higher was Microsoft's own Xbox 360 which cost it $1 billion for the "red ring of death".

    But this is not an unusual situation at Microsoft. Besides Xbox, Kin and Surface, Microsoft also declared victory in (read: shut down) SPOT watches, the Smart Display, Tablet PCs and the Zune. This is why when I heard about the Surface I asked who would be Microsoft's Tim Cook.

    By the way, $900 million write-off could amount to over 3 million devices, more if Microsoft is assuming some residual value in the inventory. Misjudging demand to such a degree that more units are disposed of than sold implies a basic failure of understanding of hardware businesses.

    Which brings up the question of what Microsoft will do. They are likely to double down on hardware (also signaled by their re-org) simply because in a device world (read: post-PC) the economics of licensing Windows and Office are evaporating. The price points of EULAs simply don't hold and there are good enough alternatives in use by the hundreds of millions of iOS and Android devices out there already. By withholding Office from iOS and Android, Microsoft has shown a billion people that they can live without it and they already knew they could live without Windows.

    So rather than fight, Microsoft chose to switch. Switching from software to hardware, however, is proving very hard. I'm sure quite a bit harder than management  thought.

  6. Measuring the latest iOS accessory market

    Podcast · 45 comments

    One of the most startling announcements during the WWDC 2013 was iOS in the car. The mockup that was shown seems to indicate the use of the car's in-dash display as an "external monitor" for an iOS device while control would come from inputs using Siri.

    The technical details were not released so it's hard to know the protocol used to accommodate this interface. However it seems that it will be generic enough that a number of launch brands signed up for the launch. The list includes Honda, Mercedes-Benz, Nissan, Ferrari, Chevy, Infiniti, Kia, Hyundai, Volvo, Acura, Opel and Jaguar.

    Is this a significant opportunity?

    Before we get excited, it's important to note that this will likely take a very long time. It won't even begin until 2014 and the number of new models may trickle into showrooms quite slowly. Consider that the time it took for automakers to universally support external audio input (mostly the trivial line-in) was about a decade.


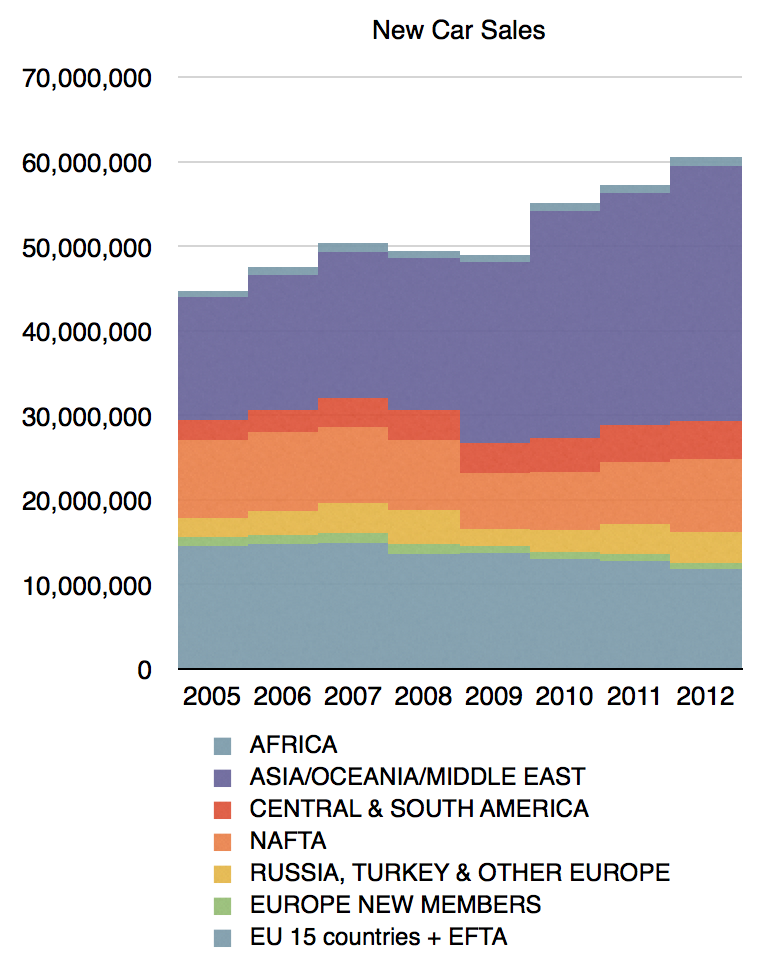
    To also curb our enthusiasm we need to realize that the car industry does not produce many units. In 2012 there were over 60 million cars produced (with the following regional mix:)

    Screen Shot 2013-06-11 at 6-11-6.02.32 AM

    In contrast, 60 million is about the number of phones sold every two weeks. In 2013 there will be more iPads sold than cars.

    In particular the companies mentioned had the following production figures in 2011:

    • Honda (including Acura): 2.9 million
    • Mercedes Benz (Daimler): 1.44 million
    • Nissan (including Infiniti): 4.5 million
    • Fiat (Ferrari parent): 2.4 million
    • GM (Chevy, Opel parent): 9.1 million
    • Kia: 1.6 million
    • Hyundai: 6.6 million
    • Volvo: 315k
    • Tata (parent of Jaguar): 1 million

    Including the parent companies and all vehicle types they produce, the total is about 30 million units, or about half of the world-wide production. Obviously, not many of the cars produced will have iOS in the car capability.

    Therefore the total unit opportunity is not very significant, perhaps less than 10 million a year. Is there a per-unit cost that compensates for this?

    This is harder to answer. The way Apple has been licensing accessory makers is through the MFi (Made for i) program. There used to be a flat 10% fee off of the retail price of the accessory sold. However, there may have been changes. The licensing fees are not public and it's quite possible that the price is a flat amount per unit and that it's a negotiable. It's hard to know what terms are being negotiated with automakers but my bet is that it's not likely to be a significant source of revenue per unit.

    So the total revenue from licensing the "Made for iPhone" trademark to automakers won't be significant.

    But it is significant for the car industry. The significance is that cars have finally risen to the role of being phone accessories. They have acquired the ability to participate in a computing ecosystem. During all these decades when the world has embraced the information society and intelligence has been embedded in the fabric of life, automakers have resolutely avoided being a part of it. Automotive information, connectivity and user experiences have remained in a Galapagos Syndrome-like isolation from reality. The reasons are rooted in the crisis of rigidity that plagues the industry, something I've touched on briefly in The Critical Path podcasts (e.g. Asymcar).

    So this is a hopeful development. If.

    If it actually moves at a slightly-faster-than-glacial speed.

    If sufficient cars get display systems (billions are produced for the pockets of  young and old, poor and rich; but cars have to be considered "luxury" to be graced with an LCD)

    If standards are adhered to.

    If all brands (which operate individually as autonomous divisions irrespective of group-level strategy) accept the notion.

    If these and many other conditions are met, it would allow, finally, the migration of autos to the status of information appliances and, eventually, to being hired for jobs that are currently left undone.

  7. Measuring US Mobile Platform Shares: Kantar vs. comScore

    Research · 34 comments

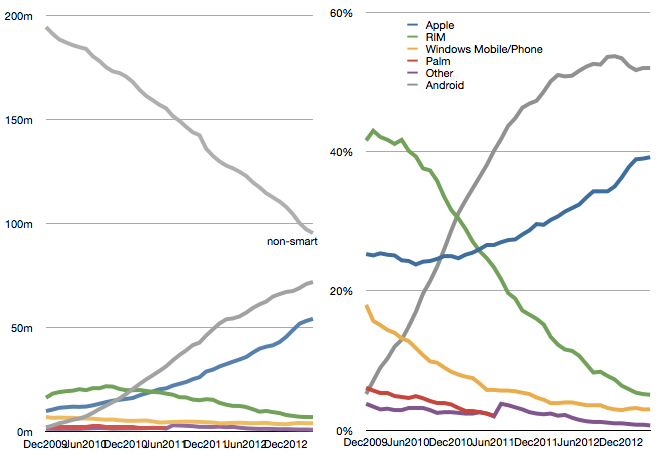
    The latest comScore US smartphone install base data is in and there are few surprises. iPhone has reached a new record high penetration (39.2%) and user base (54.3 million). Android has reached a new high in user base (72 million) but share at 52% is below the peak reached in November 2012.

    Screen Shot 2013-06-05 at 6-5-3.48.35 PM

    This pattern of gradual iPhone share gain in the US has been consistent for over two years even while Android has catapulted into an overall lead. The surprising thing is how Android seems to have peaked in share. There are still 95 million non-smartphone users and there seems to be headroom for growth even though the other platforms have been tapped out. But it does not seem that Android phones have any particular advantage over iPhone. My hypothesis remains that as price is taken out as a differentiation, the adoption of iOS is slightly higher than Android.

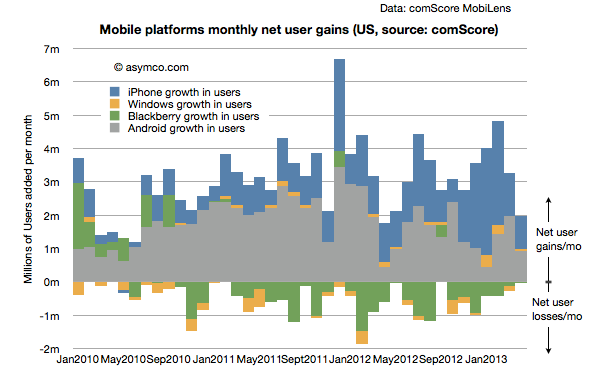
    Another measure of market performance is the implied net platform user gains which is shown below:

    Screen Shot 2013-06-05 at 6-5-3.23.55 PM

    It shows that iOS added more users in the last few months than Android.

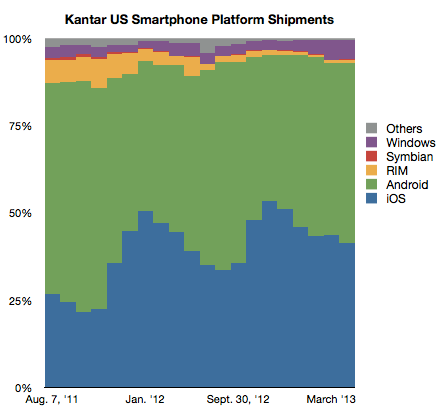
    The problem is that Kantar Worldpanel measures shipments and their share data shows a seemingly different picture.

    Screen Shot 2013-06-05 at 6-5-3.22.23 PM

    In their data Android is shown as selling more units during January through April while Apple sold more during October through December. Of course we don't have the absolute number of units so can't see the effect of higher holiday overall sales volume. Nevertheless, the balance of growth seems to be disproportionately in favor of Android relative to the data from comScore.

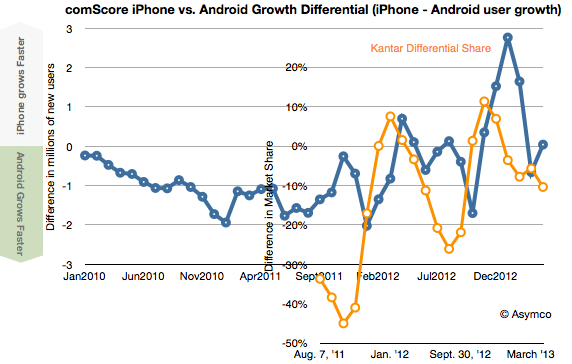
    To look at the situation more closely I measured the differential in user adds for comScore and the differential in market share for Kantar's data. Then I overlaid the two differentials so that months are matching, as shown below:

    Screen Shot 2013-06-05 at 6-5-3.51.57 PM

    There is a similarity to the frequency of oscillation with comScore data showing a delay (as would be expected since their data is sampling over a three month period). However, we are still facing a vertical offset where there is apparently more growth bias for iPhone in the comScore data.

    Possible factors which might be explanatory:

    • Methodologies used. comScore data excludes ages below 13 and non-personal devices (business expensed phones.) 
    • Replacement sales are invisible in comScore data since the user base does not change when phones are replaced (and old ones are discarded.)
    • Missing data from Kantar. Given their survey methods it's possible that their panels miss some market segments.
  8. 100 billion App downloads

    Research · 38 comments

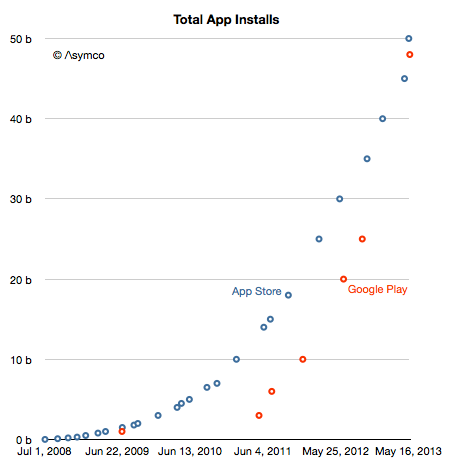
    By the end of May there will be 100 billion mobile apps installed on iOS and Android devices.

    Screen Shot 2013-05-31 at 5-31-9.45.21 PM


    Not bad for a five year old medium.

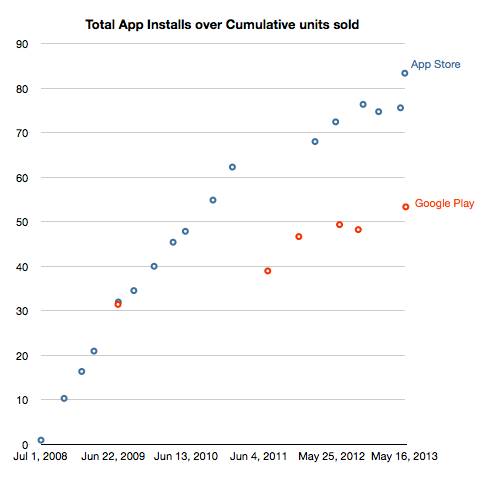
    With respect to attach rate, the total downloads/install base are currently 83 apps per iOS device sold and 53 apps per Android device activation. The history of this is shown below:

    Screen Shot 2013-05-31 at 5-31-10.18.03 PM

    The sheer weight of Android units will generate more downloads but on a per device basis the iOS devices do seem to consume more apps and the gap is not narrowing. What would be valuable would be the revenue per app on Play (the figure for iOS is about $0.23). That, as far as I know, remains unknown.

  9. The allure of iTunes

    Research · 132 comments

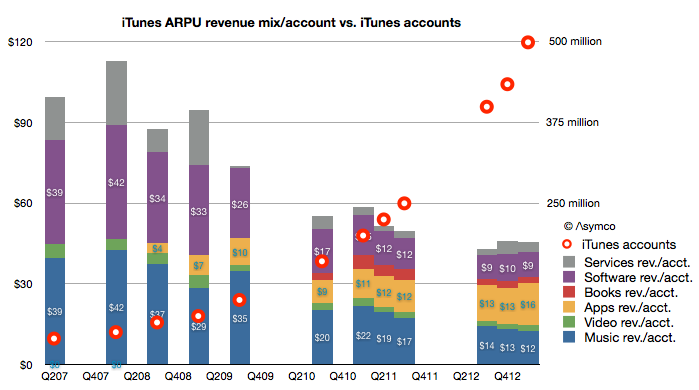
    My estimate of last quarter's iTunes gross revenues suggested a spending rate of $40 per iTunes account. It would make sense to consider how that figure changed over time. The following graph shows the pattern:

    Screen Shot 2013-05-14 at 5-14-9.49.40 AM

    You can read each bar in the graph as the total "ARPU" or average revenue per iTunes user[1].

    I overlaid a graph showing the total number of accounts as reported by Apple to the (retroactively) estimated revenue structure. Account totals are measured with the right axis and ARPU with the left.  Note that I also broke down each component of iTunes as currently defined (Music, Video, Apps, Books, Software and Services.)[2]

    The time frame covered is from Q2 2007, or the quarter prior to the iPhone launch. A few patterns emerge:

    • When there were no iOS devices (and hence no iOS apps) the revenues of iTunes consisted mostly of music sales. Those revenues were, on a per account basis, roughly comparable with Apple's Software revenues.
    • As iOS devices proliferated, the number of accounts (and users) grew. They doubled in the first two years (2007 to 2009) and doubled again in the following year (2010) and doubled again the following year (2011) and doubled again in the following 18 months. This rate of growth was accompanied by a reduction in the iTunes ARPU of about 50% (from $99 to about $45).
    • The reduction in ARPU has moderated in the last few quarters. ARPU fell 10% from $50 to $45 during the last doubling of accounts (from 225 million iTunes accounts to  500 million accounts.) In contrast ARPU fell 20% from $74 to $58 during the penultimate doubling (from 100 million to 200 million)
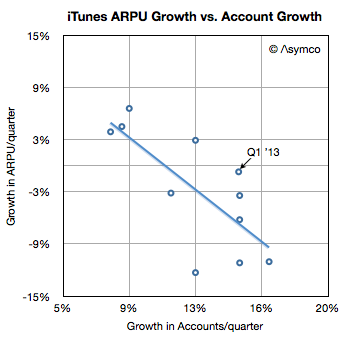
    • However, growth in accounts is broadly inversely proportional to growth in ARPU. In other words, the faster the growth in users the faster the decline in ARPU. The recent moderation in ARPU erosion is also coupled to a moderation in user growth (most recent doubling took 18 months vs. 12 months for previous doubling.) This is as would be expected as a broader, later user base tends to consume less than a narrow, early base. This can be seen in the following scatter plot:
    Screen Shot 2013-05-14 at 5-14-10.35.02 AM
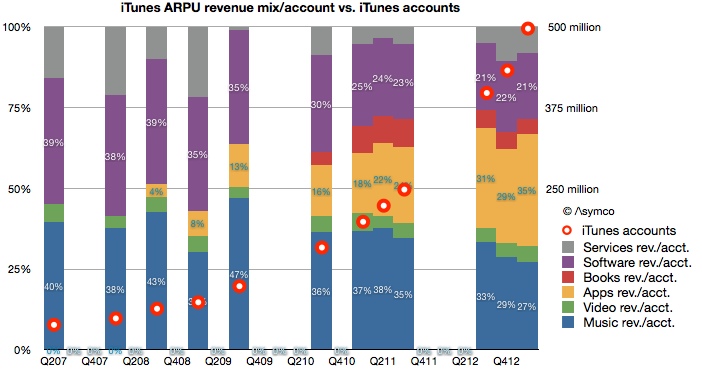
    • When seen as a percent of mix, Apps have grown to be the largest component of iTunes spending. Apps have 35% "share of wallet" while music has dropped steadily from 40% to 27% (or $39 to $12/yr.) This is shown in the following graph.
    Screen Shot 2013-05-14 at 5-14-10.34.45 AM

    As apps have grown to consume more and more of users' time it stands to reason that they should consume more and more of users' wallets.

    And as accounts reach one billion, we can begin to think about the disruptive impact on other media types. Whereas video, books and music are targeted to smaller user bases, apps are broadly consumed. Developers like Rovio or Supercell can offer their products to billions while TV producers can only hope for millions. Apps are becoming the universal medium for entertainment and iTunes the universal distributor.

    Talent is catching on to this faster than those who manage and distribute their work. The inevitable result will be a mass migration of talent away from the established content industries. Old media won't fade due to a loss of users. It will fade due to a loss of talent.

    --

    Notes:

    1. An account is not necessarily a user so perhaps more appropriately the acronym should be ARPA (average revenue per account). Unfortunately that acronym is taken.
    2. The complete model is available for purchase through Asymco Store.
  10. iTunes users spending at the rate of $40/yr.

    Research · 77 comments

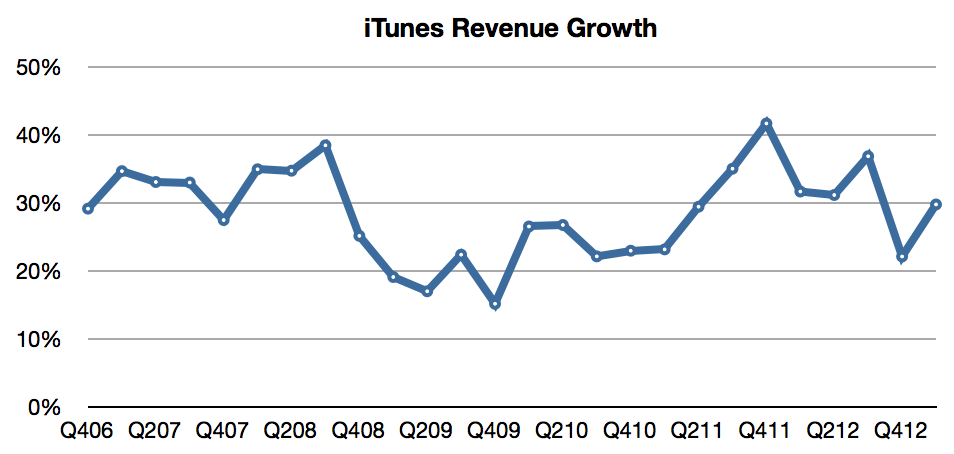
    In the latest quarter the iTunes top line grew by 32%. Additional newly reported items:

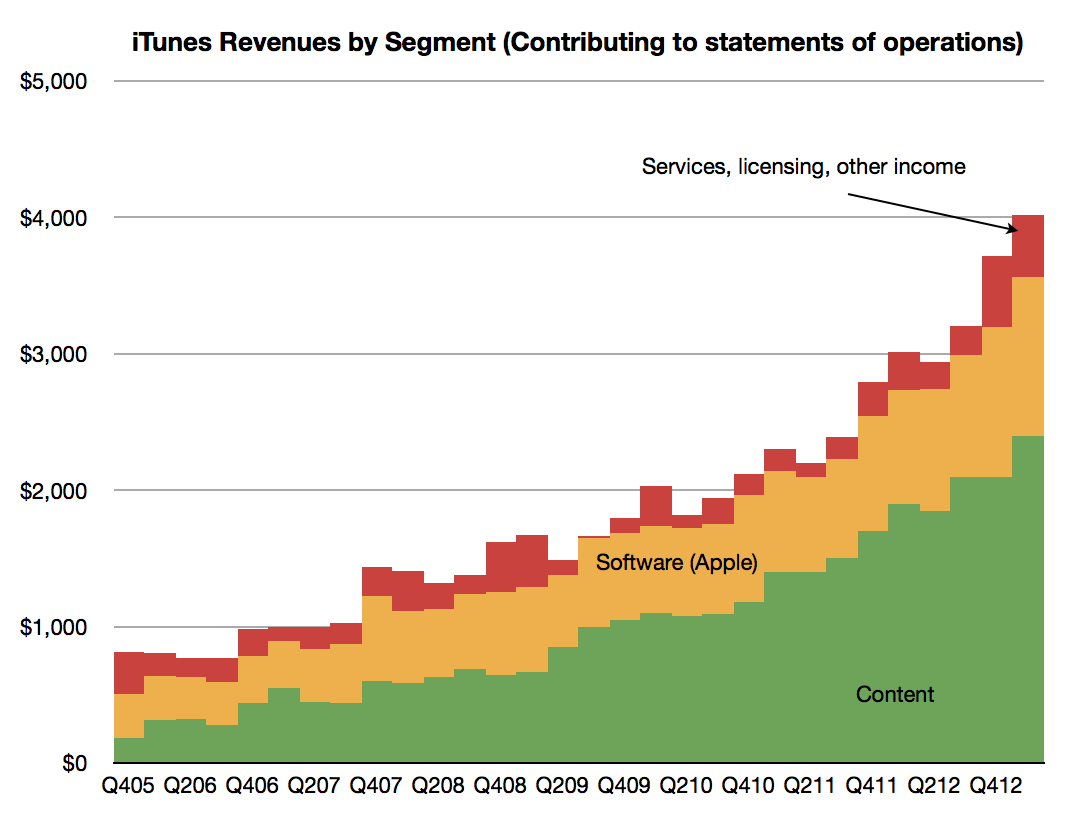
    • Quarterly revenues topped $4 billion (a new high) and the company suggests that this rate is maintainable by stating it has a “$16 billion annual run rate”. The pattern of revenues is shown below.
    Screen Shot 2013-05-12 at 5-12-8.12.30 AM
    • The content portion of iTunes revenues was $2.4 billion, up from $2.1 billion sequentially. Growth into Q1 is not unusual as many holiday iTunes gift cards are redeemed during January.
    • Revenue growth has been surprisingly steady, averaging 29%/quarter for more than six years.
    Screen Shot 2013-05-12 at 5-12-8.20.06 AM
    • Music is now available in 119 countries.
    • The Music catalog now consists of 35 million songs.
    • Movies are available in 109 countries. 60,000 titles are offered.
    • iBookstores are present in 155 countries offering 1.75 million iBooks.
    • There are iTunes App Stores in 155 countries whose residents make up about 90% of the world’s population.
    • iOS developers have created more than 850,000 iOS apps, including 350,000 made for the iPad.
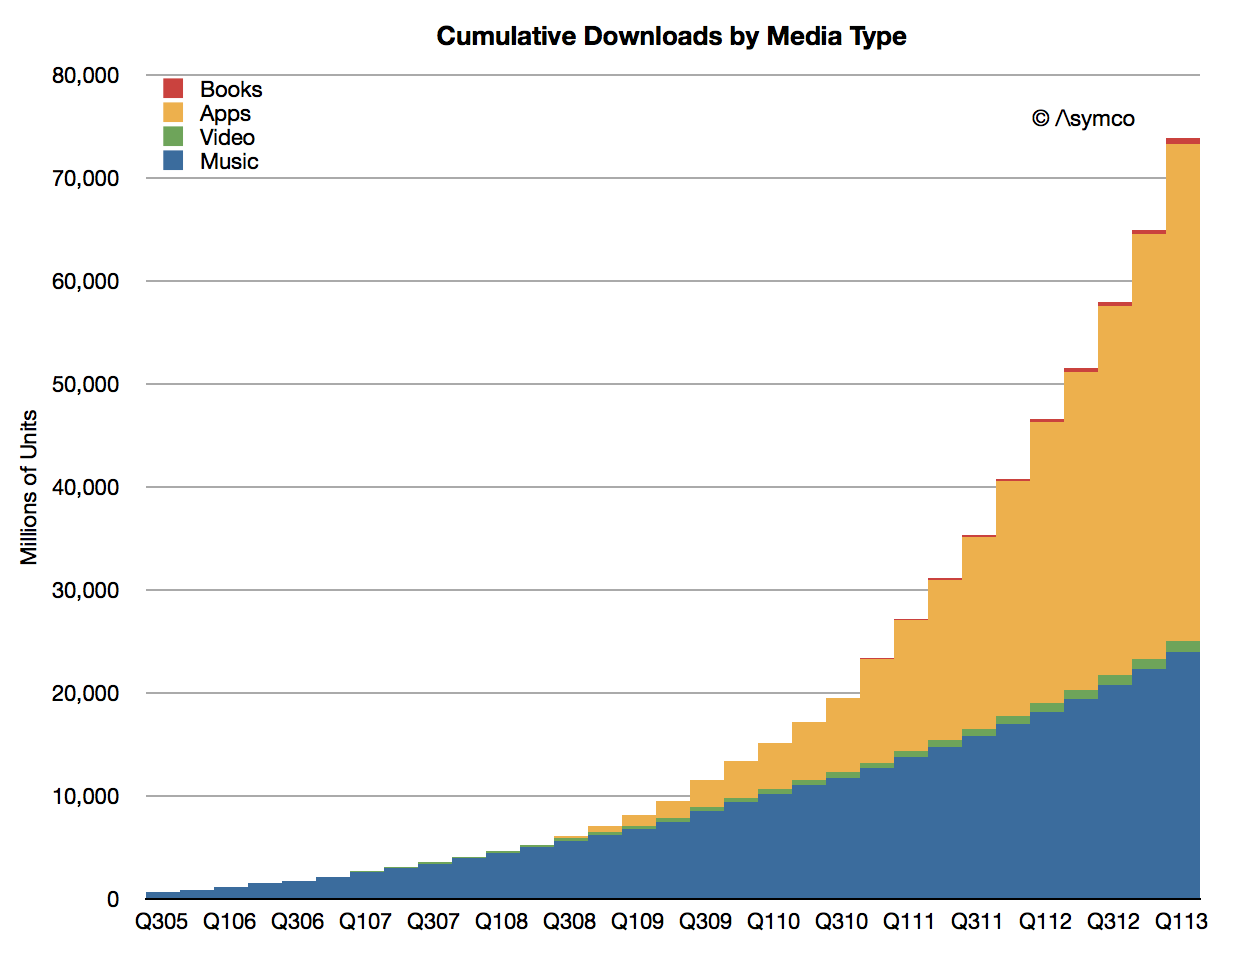
    • Cumulative app downloads have surpassed 45 billion and are on track to reach 50 billion at time of writing (estimated to be reached mid May).
    Screen Shot 2013-05-12 at 5-12-8.21.31 AM
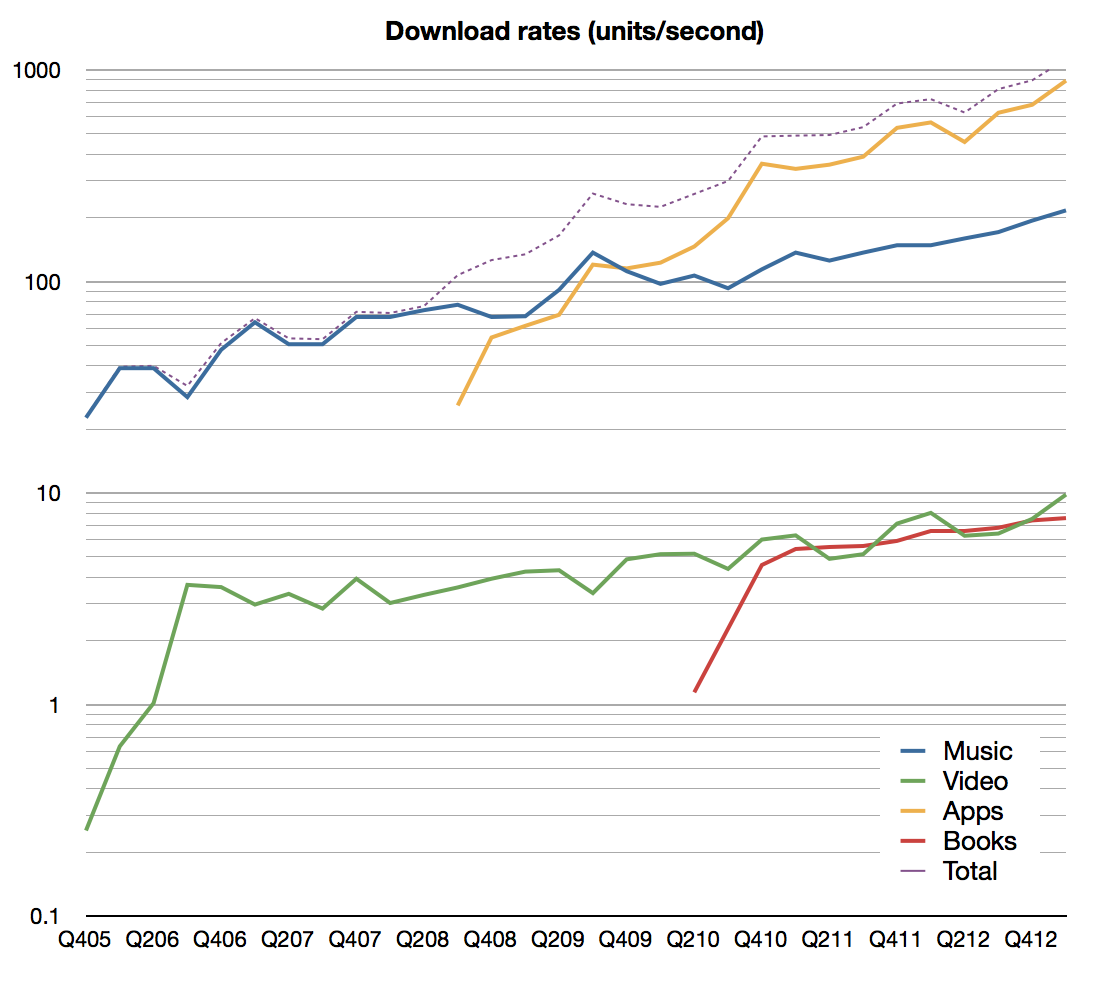
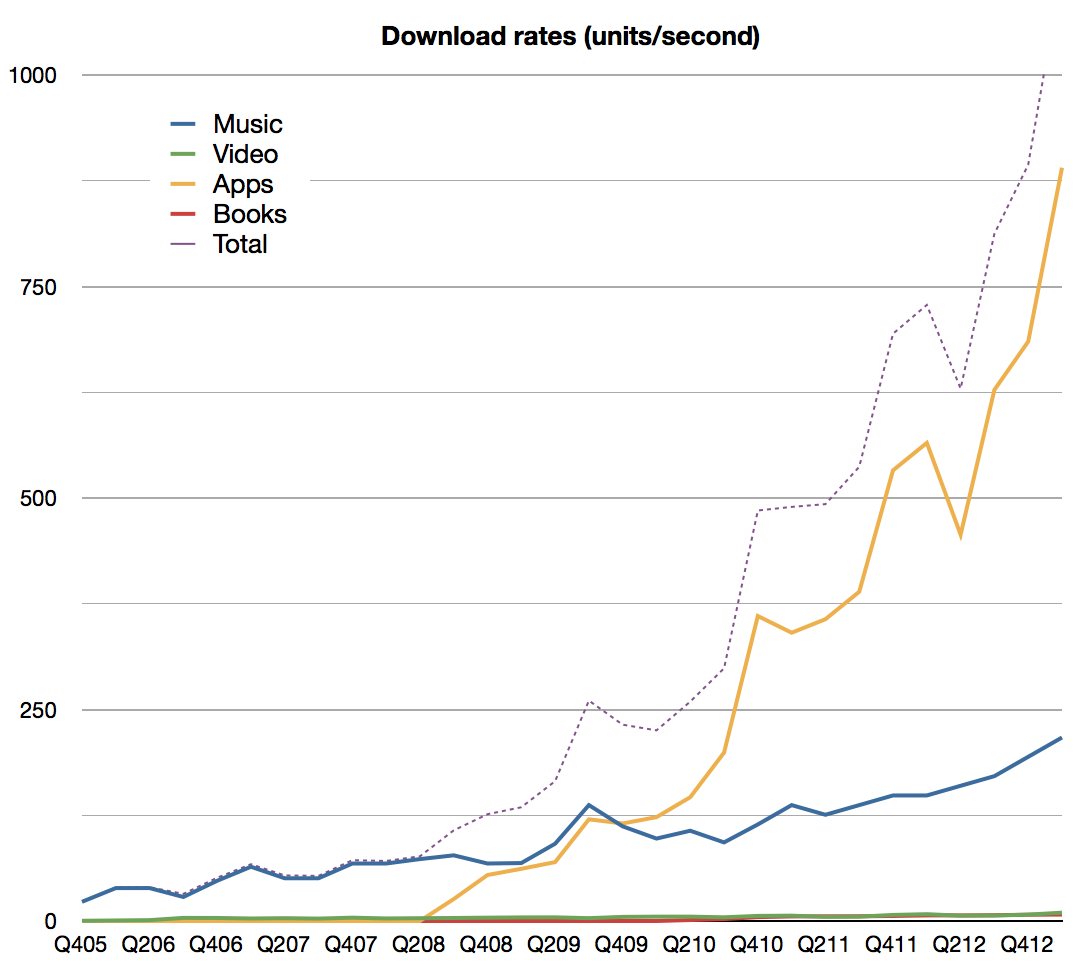
    • The company reports that over 800 apps are downloaded per second. Including all media, the download rate is now above 1000 items per second. Estimated download rates by media types are shown below (note: first graph is plotted on a log scale):
    Screen Shot 2013-05-12 at 5-12-8.34.37 AM


    Screen Shot 2013-05-12 at 5-12-9.07.49 AM


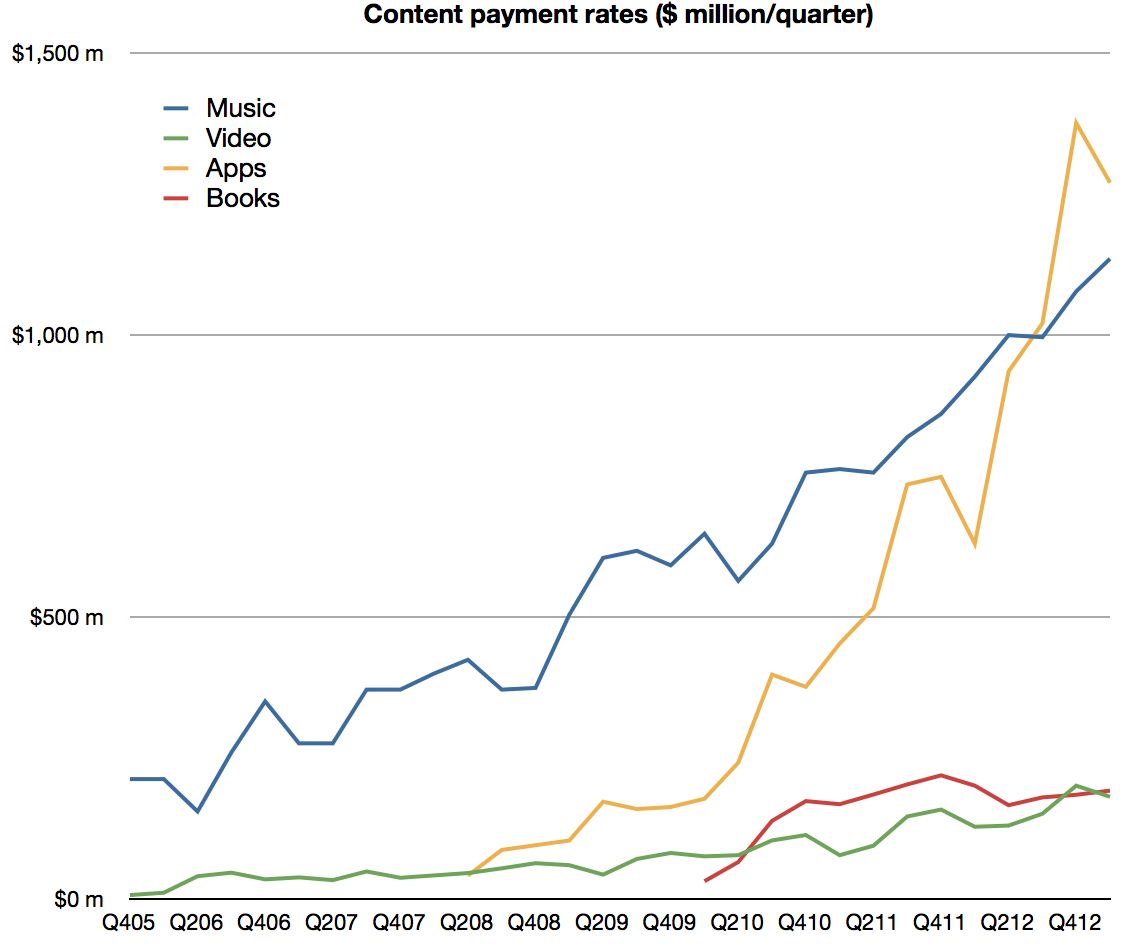
    • App developers have been paid over $9 billion for their sales through the App Store including $4.5 billion in the most recent four quarters. I estimate the split between media types as follows:
    Screen Shot 2013-05-12 at 5-12-9.13.48 AM
    • Canalys estimates that sales from iTunes App Store accounted for 74% of all app sales worldwide in the March quarter.
    • iOS app revenues more than doubled year-over-year.

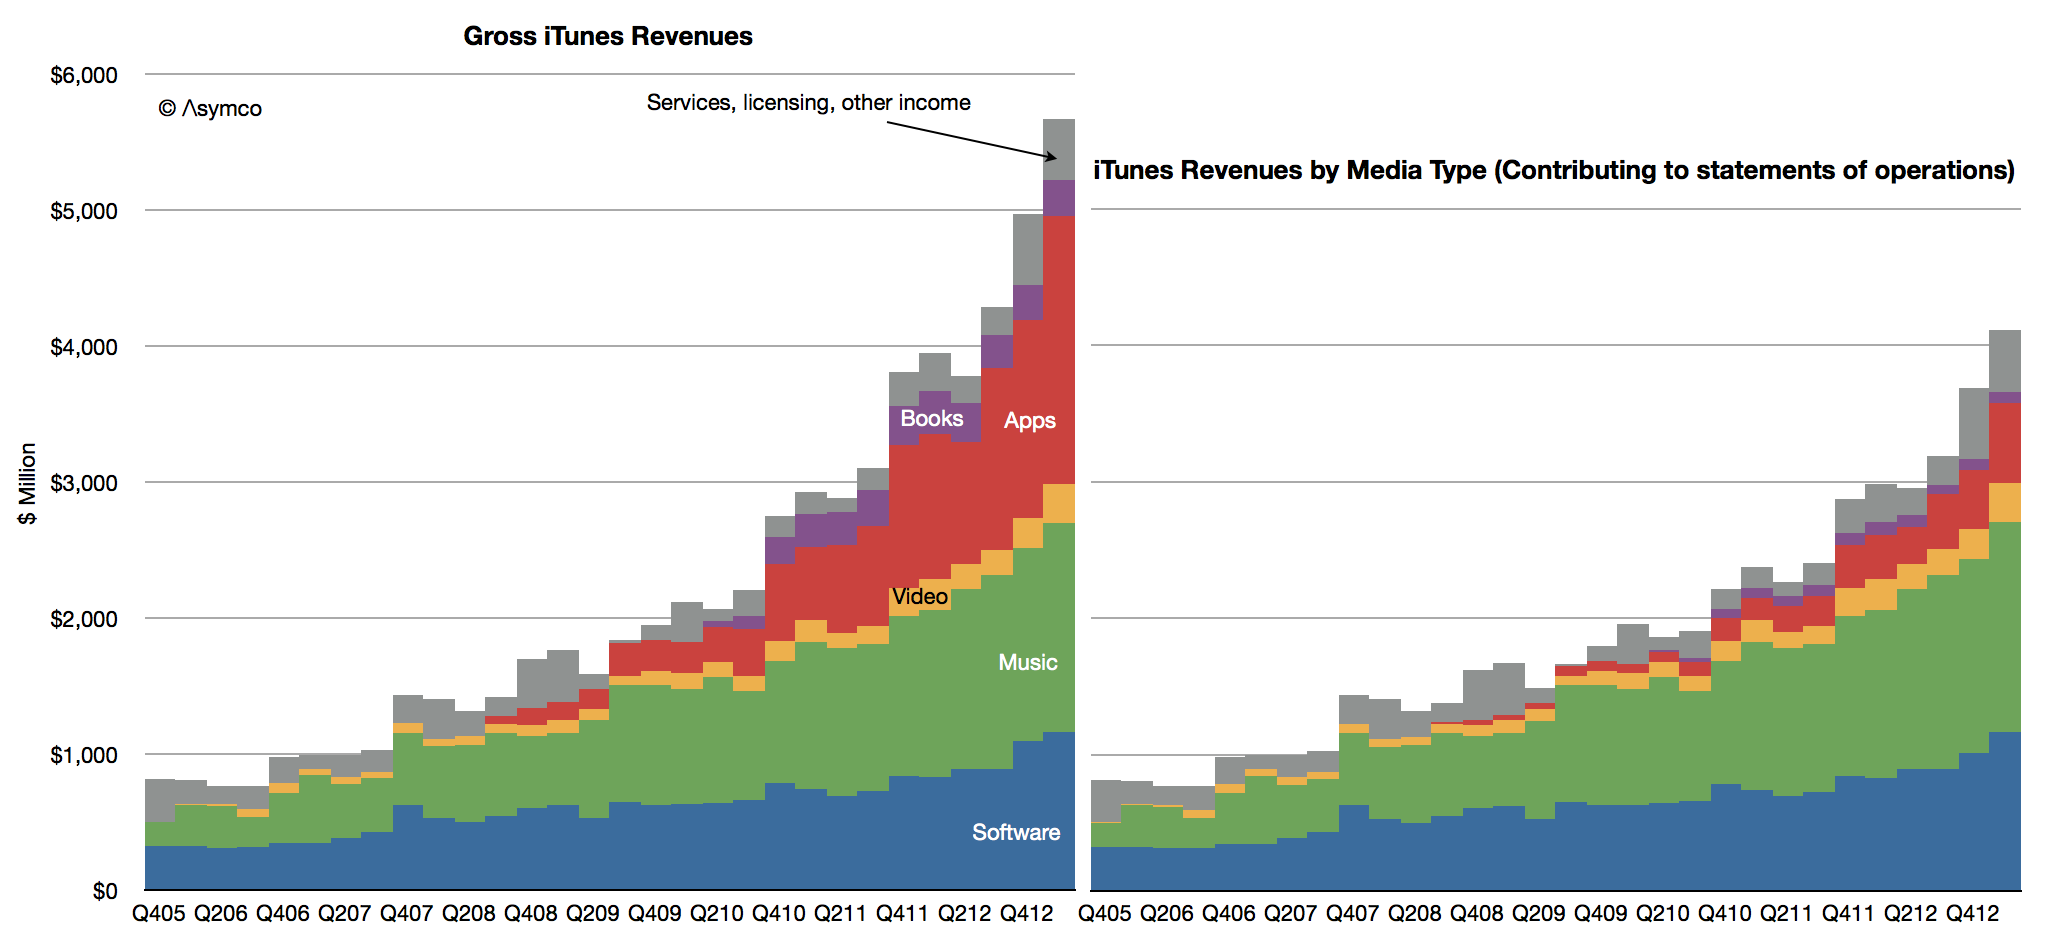
    Including all (gross[1]) content revenues, the sales rate is now nearly $5 billion per quarter ($4.94 billion). Including services, the iTunes consolidated business cleared over $5.5 billion.

    Screen Shot 2013-05-12 at 5-12-9.18.30 AM

    In March Apple reported that they have 500 million iTunes so one way to think about the iTunes business is to say that  iTunes users purchase content and services at the rate of about $40 per year.[2]

    Bless them.

    ---

    Notes:

    1. "For third-party applications sold through the App Store and Mac App Store and certain digital content sold through the iTunes Store, the Company does not determine the selling price of the products and is not the primary obligor to the customer. Therefore, the Company accounts for such sales on a net basis by recognizing in net sales only the commission it retains from each sale. The portion of the gross amount billed to customers that is remitted by the Company to third-party app developers and certain digital content owners is not reflected in the Company’s Consolidated Statements of Operations." From Apple SEC filing 10-K, October 2012.
    2. Apple users spend about $1/day for each Apple device in use making the iTunes franchise an incremental 11% marginal revenue source (assuming one device/user.)
  11. The job the iPhone is hired to do, part II

    Research · 52 comments

    I repeat what I’ve mentioned before: The iPhone is primarily hired as a premium network service salesman. It receives a “commission” for selling a premium service in the form of a premium price. Because it’s so good at it, the premium is quite high.

    The job the iPhone is hired to do 

    The original post on the hiring of the iPhone by operators was anchored in data about the revenue per unit (or price) that the product was able to obtain. The remarkable resilience in the exceptionally high average price showed that the iPhone was still getting a premium for moving users to higher levels of spending on network services.

    The evidence was circumstantial however: By knowing the price and knowing it was far higher than competing products and knowing that much of it was paid by the operator and not the consumer (at least not up-front) implied that it was the iPhone, and only the iPhone, that was hired as a network service sales tool.

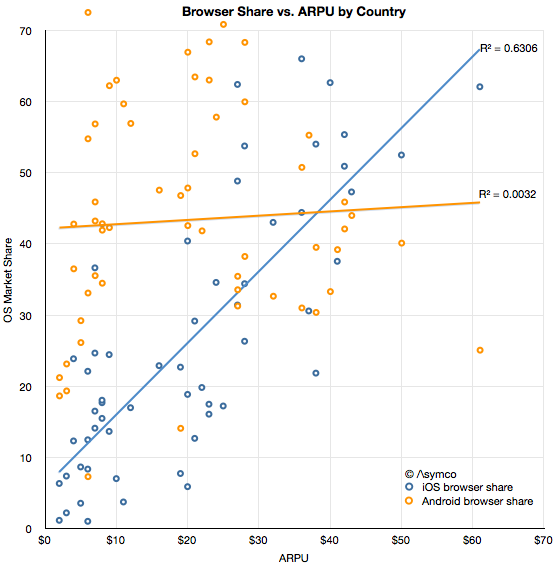
    Now we have more evidence thanks to Ben Thompson (@monkbent). I illustrate the data here as an x-y scatterplot.

    Screen Shot 2013-04-23 at 4-23-11.21.37 AM

    The data consists of ARPU (Average Revenue per User) ITU data from 2010 for 60 countries combined with browser share data on a country-level from the current period (sourced from StatCounter).

    The first observation is that there is a modest correlation between iOS usage and ARPU. It may not be particularly interesting by itself but it is interesting when compared with the lack of correlation between Android usage and ARPU.

    The presumption behind smartphone usage is that it leads to more browsing which leads to more network usage which in turn, leads to more network revenues and, finally, more network investment. If there is no additional browsing then there is a far smaller economic incentive to network operators to invest in infrastructure. It is this link between usage and revenues which I hypothesize drives operators to carry, subsidize and promote the iPhone. And the resilience of this link indicates that it still works.

    The ASP data seems to support this hypothesis and so does the ARPU data. The more iOS is in relative use, the higher the network revenue per user. Correlation is not causation, but when combined with data about Android, we can also say that the presence of the primary iOS alternative does not lead to more revenue. In other words, if a lot of iOS is present then revenues are higher and if there is little iOS present then revenues are not higher.

    I'm not suggesting that Android users use less bandwidth—the share data is after all relative—but rather that Android use itself does not seem coupled to paying more (or less) for service.

    If there is something to be concluded it's that not all usage is created equal. The data regarding how apps and ads are consumed is consistent with a qualitative difference between iOS and Android. This data is more of the same.

    It's something of a cliché to say that audiences vary in terms of quality, but that does not make it less true. Indeed, network operators depend on it being true.  And so does Apple.