Asymco

Asymmetric Intelligence

iOS

  1. 5

    Research · 60 comments

    It looks like the next iPhone will be called the iPhone 5. What's in a name? As it turns out, quite a lot.

    Every hardware product that Apple has released has had a brand and a sub-brand. Macs for example use the Mac brand and a sub-brand as follows:

    • iMac
    • Mac Pro
    • Mac mini
    • MacBook

    Thus each sub-brand imparts certain meaning to the buyer. i, Pro, mini, book are all evocative. MacBook even has its own sub-brands:

    • MacBook Pro
    • MacBook Air

    These Mac sub-sub-brands of Pro and Air are specifically designed to also distinguish and convey meaning.

    iPods as well use the iPod brand followed by a sub-brand.

    • iPod Classic
    • iPod touch
    • iPod mini
    • iPod shuffle
    • iPod nano

    Note how the mini  sub-brand was retired from the iPod line to be used exclusively in the Mac product line. That may not be specifically necessary or desirable but it is an interesting coincidence. (The Pro sub-brand is shared between different Mac lines)

    However, when we look at the iPhone and the iPad, the nomenclature has been distinctly different. Both products have been using generational naming conventions. This implies no sub-branding as the iPhone and iPad are the only identifiers of brand and hence the only meaning being imparted to the buyer. You either get an iPhone or and old iPhone.

    That changed with the iPad however. The third generation iPad became just iPad. This was deliberate (why would they want to confuse buyers?) I think there is some logic to this.

    Note the parallel to the convention of the original iPod. When the iPod launched it was just the iPod. Subsequent versions were identified by a generation, but not a specific sub-brand. After the third generation iPod (still called iPod), the mini version was launched, creating the sub-brand convention that remains in use to this day. The iPod therefore was born generational but switched to sub-branding in adolescence.

    The possibility exists, therefore, that there will be a sub-brand for the iPad. Perhaps "mini" is being reserved for a new iPad, to distinguish it from the regular iPad (no sub-brand) that is likely to remain in production. The logic is to make room for sub-brands when the core brand begins to cover a wider array of form factors, themselves proxies for separate use cases or jobs to be done.

    So what about the iPhone?

    The iPhone has remained, stubbornly, after five years, stuck with a generational naming convention vis-à-vis the sub-brand convention used in every other mature product line from Apple. (Note that software from Apple adheres strictly to a generational naming convention because there is no "room" for a sub-brand under a software brand. There can be no "iWork Pro" or "Final Cut EZ". [Update: there once was Final Cut Express])

    Prior to today I entertained the possibility that the new iPhone will follow the iPad in dropping generational naming in favor of sub-branding thus implying that the brand would develop into a portfolio of sub-brands (like the iPad seems about to.)

    Alas, that possibility now seems moot. The launch announcement seems to clearly point to "5" being the name of the new iPhone. The brand remains iPhone and there will be no sub-branding.

    This can only mean that Apple intends to preserve a single product strategy for the brand. There will be no "special" iPhone for different (e.g. low-end) markets. There will be no different form factor to accommodate different use cases. There will be no new jobs to be done for the iPhone.

    What a bummer.

    However, there may be something more curious happening. Note all the service brands being launched on the iOS platform. There's Siri, (as yet unnamed) Maps, GameCenter and PassBook. These are not Apps. These are services designed to be unique to iOS, perhaps even unique to the iPhone. The difference with the iPhone brand may not be that it spans a multitude of sub-brands in hardware but that it covers a multitude of new service brands. As brands imply meaning, the iPhone brand may imply that it's a platform in and of itself.

    Now that's an interesting development.
     

  2. It’s costly and has unpredictable consequences

    Research · 26 comments

    ``It’s costly and has unpredictable consequences. That makes it a very bad business model. I suppose both companies have agendas that are not visible in court and perhaps Apple is signaling to other parties, and perhaps Samsung is using it to raise its profile. It still seems that unintended consequences may arise and the result could be very bad for everybody,’’ said Horace Dediu, founder of equity-research firm Asymco, in an e-mail interview with The Korea Times.

    The above was a quote from the article  Samsung can’t afford to lose Apple fight by Yoo-chul Kim from The Korea Times. Yoo-chul contacted me via email with a series of questions. I want to share all his questions and my answers as well:

    Samsung wides market gap with Apple, according to research firms. You think the gap will further be widen and please tell me why

    As Samsung converts its phone portfolio to be all smartphones, it is very likely to reach much higher smartphone volumes. One year ago Samsung sold about 56 million feature phones. Last quarter it sold about 43 million. The smartphone portion increased from 20 million to 50 million. At the same time, Apple has maintained a growth in its smartphone business of about 100% on a yearly basis. I expect that to continue into 2013 as well. Therefore it's possible that Samsung could sell 290 million smartphones in the next 12 months and Apple could sell about 200 million in the same time frame.

    However, it's important to understand that the companies compete on different bases. What I mean is that what generates a profit (i.e. payment by the consumer above what a product costs) is different for each company. Apple is a platform company that sells access to the iOS ecosystem across many other device types. Samsung sells consumer electronics with limited "network effects" but desirable features. In this view, the gap in device sales is "asymmetric" and not reflective of the actual competition which is between Google's Android and Apple's iOS as forms of access.

    Samsung's rapid rises mainly due to the company's heady dependence
    on Google Android. If Google applies better software for Motorola,
    then you think Samsung will face difficulties?

    Think of Google as a supplier to Samsung. No manufacturer wants to have a situation where they are dependent on only one supplier, especially when there are huge substitution costs for another supplier. And even more especially if that supplier owns one of your competitors. However, it's unlikely that Motorola will become a strong competitor to Samsung. I also don't expect Google will damage their OEM "customers" by favoring Motorola. Motorola can't become big enough quickly enough to be a threat to Samsung. What is more likely to be a problem for Samsung is ZTE and Huawei. They are on the same trajectory that Samsung was on 10 years ago. For Samsung to beat them in the future it will need to develop products that nobody can copy.

    How about software? Samsung is good to roll out price competitive
    models, however, software is always problem. Any advice for this
    issue?

    Software is hard and expertise can't be quickly acquired. It takes time. Only advice [I have] is that efforts must be patient and there need to be many experiments like Bada and Tizen. Google started with Android in 2005 and Apple started with iOS in 2003 or 2004.

    How about the patent dispute with Apple and Samsung. The patent war
    is helping Samsung see a rise in its brand awareness and that also
    worked for Samsung to grab more shares in smartphones?

    It's very difficult to measure the impact of litigation, both in the positive and negative. It's costly and has unpredictable consequences. That makes it a very bad "business model". I suppose both companies have agendas that are not visible in court and, perhaps, Apple is signaling to other parties and perhaps Samsung is using it to raise its profile. It still seems that unintended consequences may arise and the result could be very bad for everybody.

    Samsung wants to become a market creator not just a fast follower.
    For me, it's quite negative for Samsung to create a wholly-new
    eco-systems because Samsung's edges are coming from manufacturing, not creative thinking. What do you think? If Samsung wants to be a
    creator, what conditions should Samsung need and what things should
    the company do?

    Unfortunately, manufacturing excellence is not enough to remain successful long term. US companies were successful, then the Japanese, Taiwanese, Hong Kong, and now Chinese. Companies either adapt or become irrelevant. Building ecosystems is the new basis of competition but it's not the only option. Unfortunately we don't know what will be necessary to build the next basis. What matters is experimentation and the building of new businesses. I can't offer specific recommendations as there is no recipe book for how to create new markets.

    For your views, who is much better so far since the trial has begun
    in the US. Samsung or Apple?

    I cannot comment on this. Performance in court can only be judged by those present and I'm sure everybody present disagrees.

    You think Apple is enjoying its so-called a homeground advantage
    for the trial and is there any possibility that the issue to go for
    the highest court in the US. My Samsung contacts say that's the
    possibility, though.

    Again, I don't have an opinion on legal matters. Broadly speaking, IP litigation is similar to playing the lottery.

    Need your perspectives about Google's support for Samsung. Google
    confirms its supports for Samsung for an united front against Apple
    because the fight between Samsung and Apple is a kind of version that
    represents Google and Apple fight.
    Any comments about that?

    I believe Google does support Samsung. I question however how this relationship will develop over time. I attached below commentary from a researcher at Deutsche Bank on Android in China. I think it has some clues about how Google treats its partners.

    What are pre-conditions before Samsung making an action to sign a
    peace treaty with Apple?

    It depends on the motives behind Apple's actions. I think they want to see a "no copying" rule. They don't mind competition and Android could be a help in the long run by moving users from feature phones to basic smartphones which could later be upgraded to Apple phones. But what I think they want is to signal to others that direct copying is unacceptable. Essentially, the work of their designers is very important to them and copying destroys [the designers'] incentives to do breakthrough products.

    ---

    See also: Who Cares If Samsung Copied Apple? by James Allworth - Harvard Business Review

  3. American exceptionalism

    Research · 45 comments

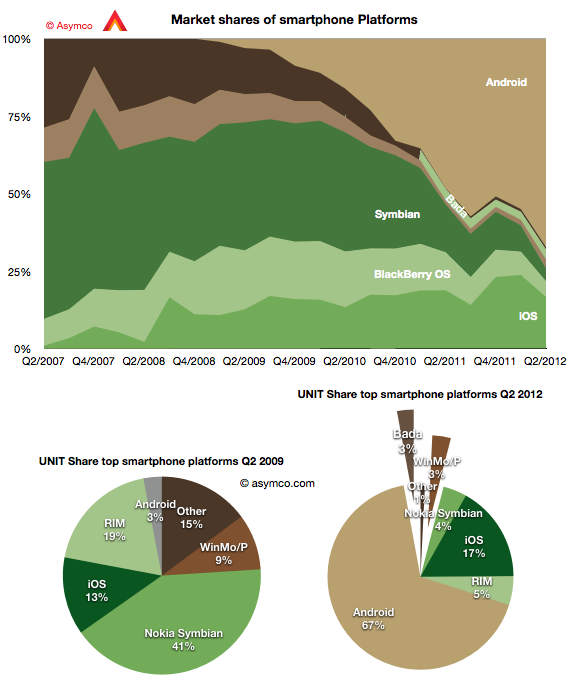
    The second quarter showed continuing growth for Android with 19 points of share growth from a year ago. Only Windows Phone showed a gain y/y in share up 1.6 points to about 3%. In the same time, Bada lost half a point, iOS lost 2.1 points, RIM lost 7.2, Symbian 11.4.

    The result is shown in the graph below:

    I also show a "before-and-after" pair of pie charts which show the difference in smartphone platform market share from the same quarter three years ago. Android went from 3% share to 67% while Symbian went from 41% to 4% and RIM went from 19% to 5%. iOS increased its share from 13% to 17%.

    If this trend continues Android could reach 50% of all phones sold in a few years. That's a run rate of 200 million per quarter. And it's likely that 100 million of those will be shipped by Chinese vendors.

    However, looking at the global picture can also miss some important trends in local markets. Had one looked at the global smartphone business in 2005, the conclusion would have been that Symbian would be the dominant platform in perpetuity.

    What affected the global market was a change in the US: the launch of iOS and thereafter of Android. The US, a smartphone backwater until then, became the most vibrant market and today it's the most penetrated and has the highest ratio of smart to non-smart of any of the major regions.

    The curious thing about this vast market is that it's still not truly open. There are technology and political reasons why some platforms are permitted to sell in one region or not. The iPhone is not available on either the largest Chinese operator or on the largest Japanese one. It's largely absent from India because of distribution (i.e. subsidy) and much of South America. Even in the US, the iPhone is still, after five years, not available on one of the top four operators and has only reached another less than a year ago.

    What intrigues me is what would the market look like if distribution were not an issue. What if there was equal choice to all buyers. We can't test this question directly but we can ask. But there is some pattern we can look at in the US data. Thanks to recent revelations at the Samsung vs. Apple trial we can see the effect of increasing distribution in the US.

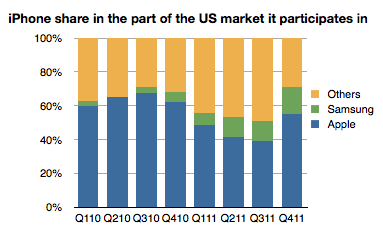
    The data on smartphone market share by carrier can be blended with data from carriers about iPhone activations (which are a proxy for sales, see note below) to give a more precise figure of market share in markets where iPhone participates.

    For example, when the iPhone was only available on AT&T, one could measure iPhone market share vs. the global smartphone market, or the US smartphone market or within AT&T alone. Some assumed that the AT&T share would be reduced once the product would become available on Verizon or other US carriers. However there was no appreciable drop. Share in Q4 2010 was 63% at AT&T and it was 63% a year later after the iPhone was available for four quarters at Verizon.

    So the share of iPhone within those operators which carry it tells a story independent of distribution.

    The following graph shows the share of the iPhone vs. Samsung in the market defined by its availability. (I.e. the volumes of smartphones sold by AT&T throughout the time period, Verizon Q1 2011 to end and Sprint in Q4 '11).

    The share of iPhone thus defined shows a slight decline but it's an overall number that is remarkably resilient as distribution increases and is remarkably high overall. Note that globally, the iPhone gets only about 17% share of smartphones--a value that has not varied greatly since mid 2009.

    So at least in the US, on carriers where it's available, the iPhone is holding on to a significant share. In a global market it's expanding distribution but not yet covering the world. As a consequence it's keeping up with overall market growth and staying between 17% and 20% share.

    The big question is what will happen if and when its availability matches that of Android in terms of points of sale. Or even that of BlackBerry or Symbian. Is America a different market from the rest of the world? It was different in being isolated while Symbian roamed globally. It was different in being a launch platform for BlackBerry and then iOS and then Android. But now that iPhone is beginning to be widely available there, will it be exceptional in how it rewards Apple?

    ---

    Note:

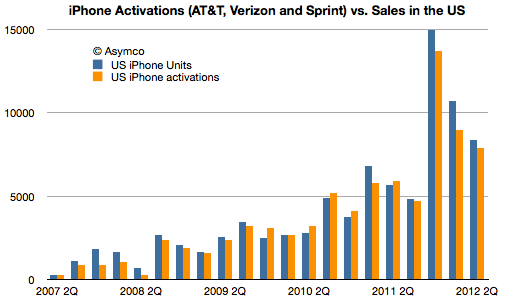
    1. Activations data can be seen next to Apple's testimony of US sales in the following graph. Note that more phones were sold by Apple than were activated in total of the life of the product. 86 million sold and 80 million activated. This implies that an analysis based on activations undercounts the iPhone. 
  4. Measuring iOS as a gaming platform

    Research · 37 comments

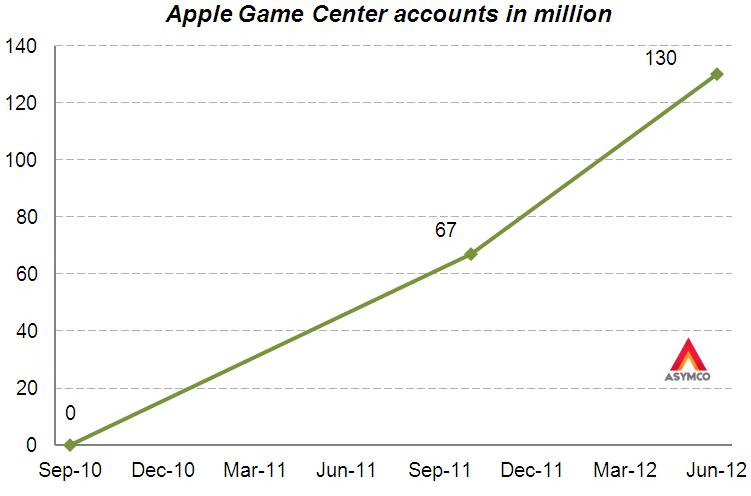
    At this year's WWDC Apple offered an update on Game Center accounts. The data we have so far is shown in the following graph.

    Before being acquired, another network, OpenFeint, announced 180 million iOS accounts in October 2011. Another figure to consider is the 40 million subscribers to Xbox Live (out of 66 million Xbox users). This subscriber base is paying for a service (about $1 billion per year) so it's not the same as the free Game Center model.

    Rather than being a revenue source, Game Center is designed to engage users and to capture usage information. It also lets us gauge gaming "consumption" on iOS devices. That itself allows us to contemplate it as a gaming platform vis-à-vis alternate platforms.

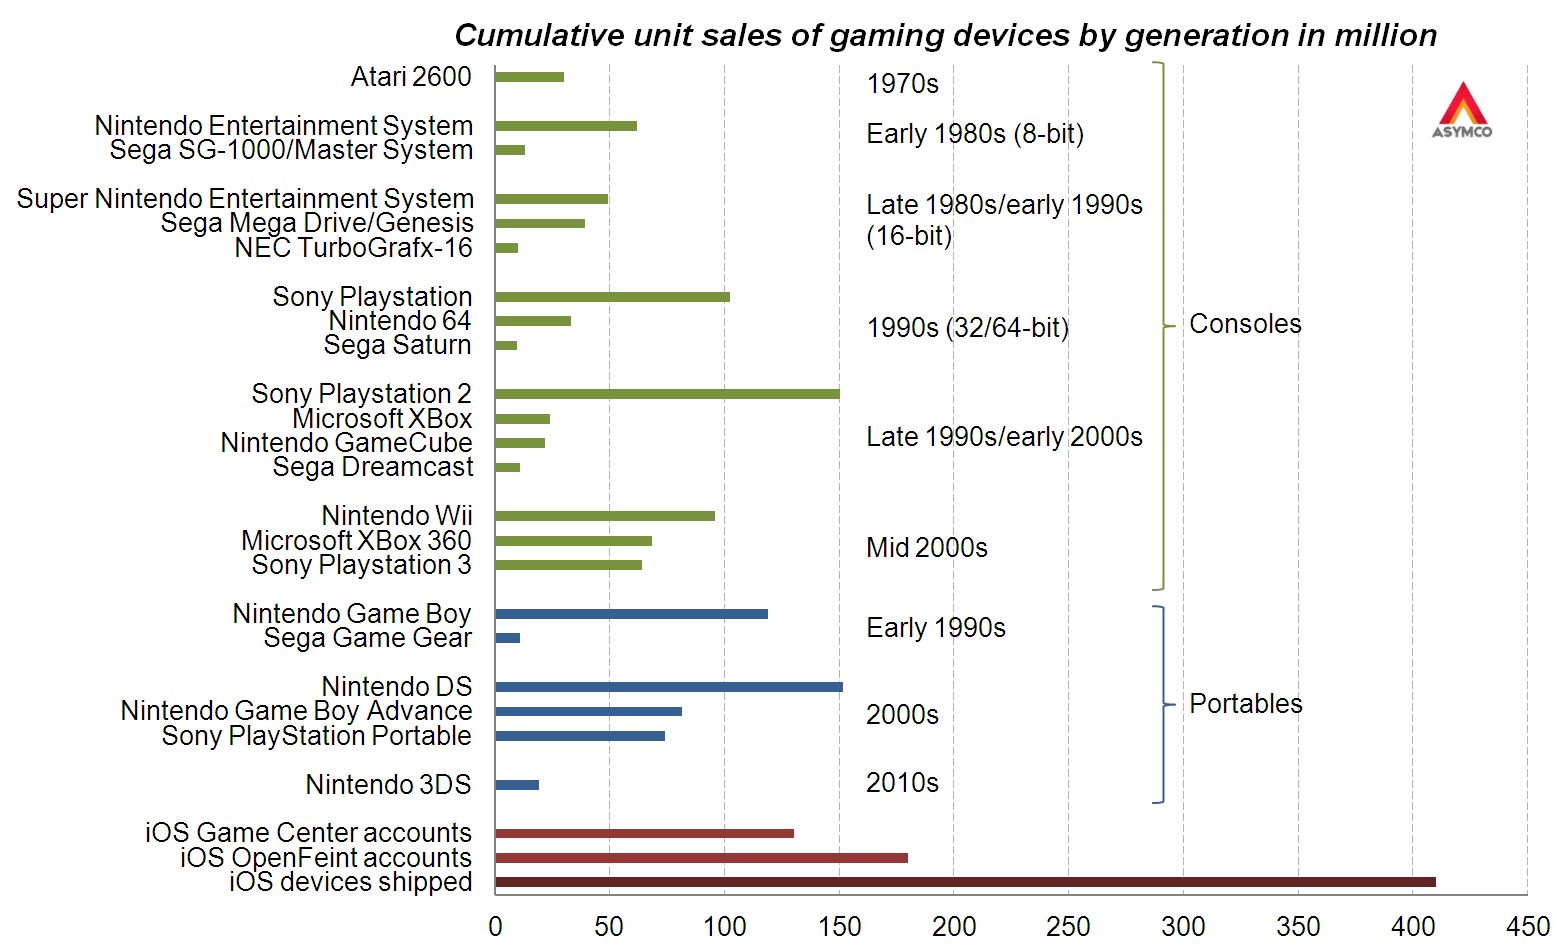
    To consider the figure as a proxy of penetration and engagement, the graphic below shows cumulative sales of gaming devices.[1]

    Here are some observations:

    • There is a pattern of turnover of market participants
    • Each console "generation" had a clear market leader
    • The best-selling gaming device was the Nintendo DS closely followed by the PlayStation 2 [2]
    • Considering the 130 million Game Center accounts, iOS is already the third largest gaming platform
    • Furthermore, considering the OpenFeint iOS figure of 180 million accounts announced in 2011, iOS has already surpassed the cumulative sales figures for the Nintendo DS
    • No gaming device has ever reached the 200 million mark
    • At the current growth rate the number of Game Center accounts will surpass 200 million before the year end

    Apple cites the number of games, downloads and payments to developers as evidence of ecosystem health and growth. The figure of Game Center accounts is yet another indicator. It shows growth in and of itself, but it also has the side effect of offering comparative measurement of performance. That measurement compares favorably with other game platforms.

    The economics are different but they always are when a disruption takes root.

    ---

    Notes:

    1. Based on reported cumulative sales (Wikipedia), excluding gaming devices with less than 10 million cumulative sales (excludes for example PlayStation Vita), excludes also “home computers” due to missing reported figures
    2. This Wikipedia article contradicts the previous.
  5. Estimating third and fourth quarter iOS shipments

    Research · 47 comments

    In the 2011 Annual Report(10K) published October 26th Apple states:

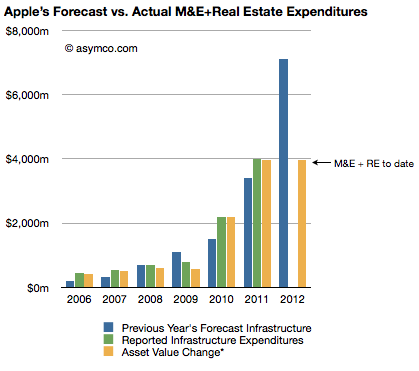
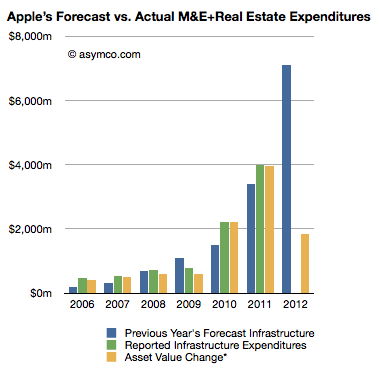
    The Company anticipates utilizing approximately $8.0 billion for capital expenditures during 2012, including approximately $900 million for retail store facilities and approximately $7.1 billion for product tooling and manufacturing process equipment, and corporate facilities and infrastructure, including information systems hardware, software and enhancements.

    The history of these expenditures is shown below (the blue bars are statements from 10K reports including the one above shown as the right-most bar):

    Three 10Q reports so far this fiscal year have given us updates on asset values and the change in these values are shown as the right-most yellow bar. The asset value change suggests $3.9 billion has been spent so far of the $7.1 billion budgeted. Thus we can estimate that about $3.2 billion remains to be spent in the fourth fiscal quarter (thus bringing the yellow bar to parity with the blue bar in the chart above--a parity that was achieved or exceeded for five out of the last six years).

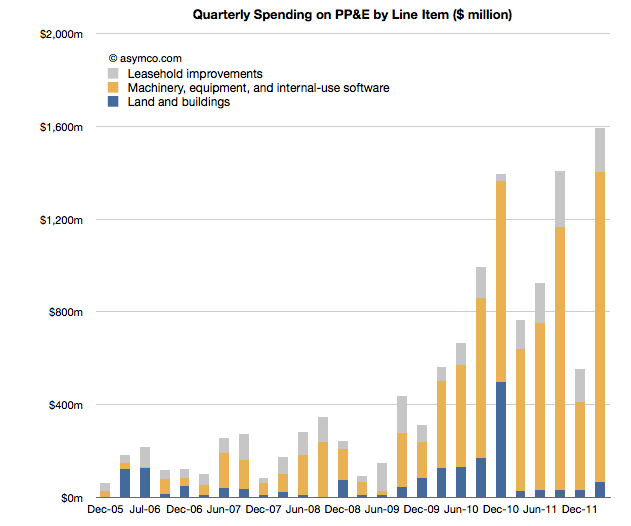
    Assuming $200 million of the fourth fiscal quarter budget will be for land and buildings[1] results in an estimated $3 billion remaining for product tooling and manufacturing process equipment and data centers.

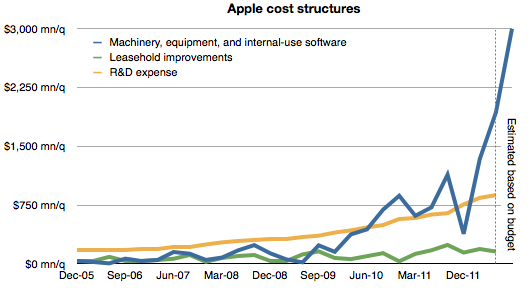
    The history of spending for various cost centers is shown below.[2]

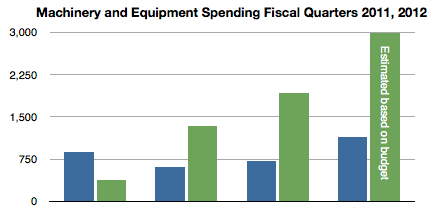
    Note again the forecast for the fourth quarter based on budget given last October. Also shown below is the spending on machinery and equipment by quarter for the fiscal years 2011 and 2012 including the estimate for FQ4 2012. (Blue bars represent 2011 quarters and green represent 2012.)

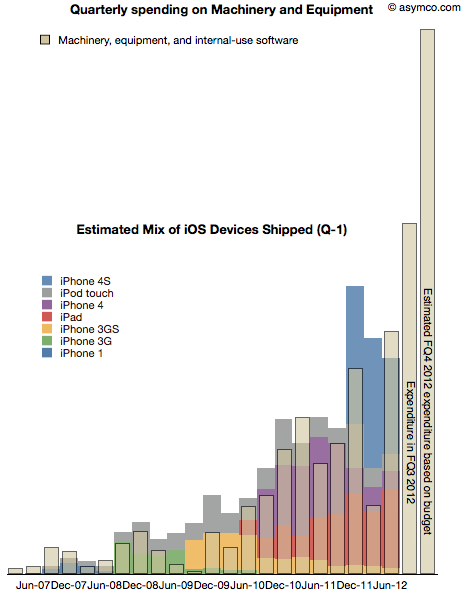
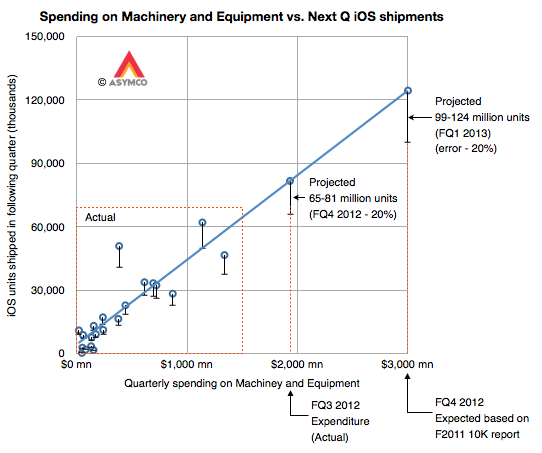
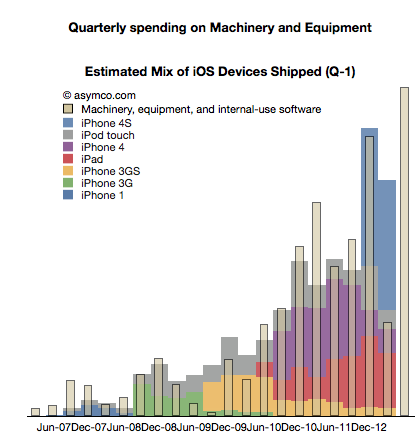
    As discussed previously, spending on machinery and equipment has shown a strong correlation with the output of iOS devices in the following quarters. The following chart shows the superposition of M&E spending in a given quarter and iOS output in the following quarter.

    Note that due to the time-shifting the Expenditure for FQ3 does not have a corresponding output--expected in FQ4--and that FQ4 expenditure is estimated based on budget.

    With this data in place, we can now begin to answer the question of what are the total iOS device shipments expected in the current (ending September)  and the following (ending December) quarters.

    Our eyes are pretty good at seeing patterns in data so perhaps it would suffice to know the scale to the graph above and thus fill in the colored output bars to match the spending. But to make it a bit more precise, I drew the following chart:

    It shows the same data but as an X-Y scatter plot where the X axis is quarterly spending and the Y axis is iOS unit shipments. Note that the actual data points are in the lower left area delineated with a dashed red rectangle.

    I drew the blue line corresponding to an assumed linear relationship between the two variables to project the iOS output based on additional expenditures for FQ3 and FQ4.

    I used error bars of -20% to show a possible conservative range.[3]

    This yields an iOS output of approximately between 65 and 80 million units in the current quarter and 100 to 125 million in the fourth calendar quarter. The sum of the low ends of this estimate is 165 million units.

    My current forecast is  53 million units in CQ3 and 110 million units in CQ4 which, together, add up 163 million. Close enough.

    Stay tuned for a padcast report with more details on this approach.

    ---

    Notes:

    1. The company spent $31 million, $66 million and $159 million for the first three quarters on Land and buildings. $200 million in the fourth quarter seems reasonable unless there is a pending large land deal closing in the next two months.
    2. I added leasehold improvements as a proxy for store openings and R&D expense as a proxy for overall product development. These are in contrast to expenditures for product production and support which are represented by Machinery and Capital Equipment.
    3. Note the other data points' error bars
  6. Activating 5.6 million units per day

    Research · 22 comments

    Google reported a new activation rate milestone: 1 million/day.

    The rate of activations has been increasing steadily which leads to a question: how high can it go?

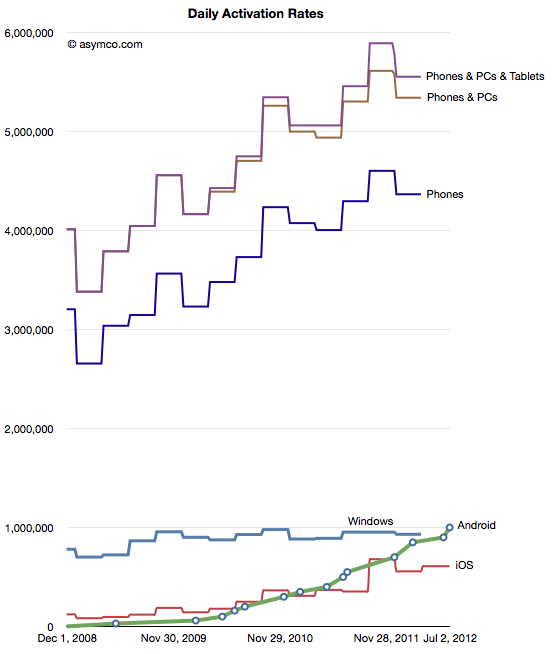
    The answer is easy to determine. It can go no higher than the sales rate of phones and tablets and PCs. So what's that sales rate? The answer is to take sales (shipments actually) per category and cast the data as "activations".

    The result is shown in the chart below:

    Defined as "activations" device and computers are being adopted at the rate of about 5.6 million units per day.

    As a percent of total activations, Android is running at about 15% and iOS is at 10%. Android has already overtaken Windows activations and with the new iPhone, it's likely iOS will do as well this year.

    In terms of available headroom this means that iOS and Android are running at a combined share of 25% of available activations.  They both should consider that three quarters of the opportunity is left to go.

    Will iOS and Android reach a duopoly in terms of activations, topping 5 million per day? Probably not, at least not without some fragmentation or platform diversification (to put it nicely). Nevertheless, 3 to 4 million per day seems an easy target to set.

  7. Up to eleven

    Research · 54 comments

    During my talk at the first Apple Investor Conference in January I said that I would pay very close attention to the Machinery, equipment and internal use software line item from its PP&E during the next quarterly report (it appears on Page 13 in the latest report).

    The reason I consider this important is because capital spending has provided reliable foreshadowing of iOS device production. This is itself because Apple invests in the equipment used in the manufacturing processes for its devices. The more spending on equipment, the more production capacity is brought to bear and the more units are produced. Since iOS devices tend to be supply constrained, the more units are produced then the more are sold.

    The first quarter of the fiscal year saw a very small increase in CapEx which caused me to "backload" spending later in the year. By watching this spending, we can assess approximately when and for which products is investment allocated. If the spending happens early then we can anticipate an early update to the iPhone. If it happens late then we can anticipate a late release. So has the ramp-up begun as of the second quarter (first calendar quarter)?

    The following chart begins to give us the answer. It tells the story of spending by tracking the change in asset values:

    Stripping out the Machinery and Equipment portion (in yellow above) and overlaying the following quarter's iOS shipments yield the following composite graph:

    It would appear that there is significant acceleration into the second quarter. Is it something significant?

    The increase in M&E is the highest for any quarter to date. Some of that is undoubtedly in service of the new iPad but some must also be the initial ramp-up for the new iPhone.

    To gauge it further however, we need to look at overall expectations. The company also signals future production plans though its yearly report. As I concluded from October's 10K, fiscal 2012 production should double from the year before (as it did from the year before that and the year before that, etc.)

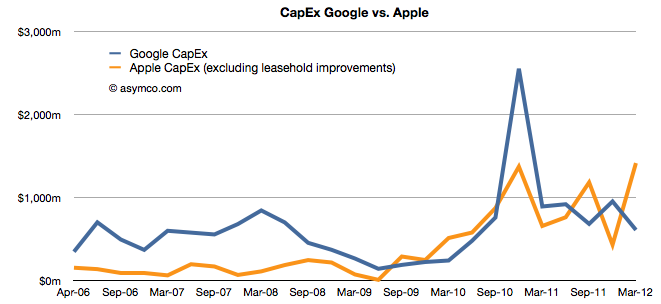
    At $1.3 billion, the spending is substantial and a new record, but it does not make a big dent in the overall budget for the fiscal year. Half-way through the year, the total spending on M&E and Real Estate is still only 26% of the budgeted $7.1 billion. You can see the gap in the following chart. The yellow line needs to match or exceed the blue line after the next two quarters.

    In order to reach its own expectations, the spending therefore needs to double from the current rate to at least $2.5 billion/quarter over the next two quarters.

    Such numbers are hard to grasp. They are unprecedented not only for Apple but for almost any comparable company. Just as a reference point, they will have to exceed the historic average CapEx rate for Google by more than 100%.

    Regular readers will note that there is nothing new in this analysis. This is only an update in a continuing story. The pieces are in place for continuing the existing rate of growth.

    ---

    Footnote: for those who are unfamiliar with the idiom in the title: Up to eleven - Wikipedia, the free encyclopedia

  8. Calculating Google's contribution to iPhone profitability

    Research · 16 comments

    In the iPhone cost structure analysis I showed how revenues and costs for iPhone are probably allocated. The revenue per iPhone was shown to include $29 for revenue items "above" the price of the phone to the channel. This total includes Apple's own iPhone accessory sales plus revenue from licensing the "Made for iPhone" trademark to third party accessory makers. Apple also receives some revenues from cloud services. But, pertinent to our recent discussions on the Android business model, Apple also receives revenues from Google.

    Wouldn't it be nice to know how much? Here's a way we can estimate it.

    I've read an estimate that 50% to 60% of ad revenues from Google search initiated via iOS are paid to Apple. This is believable because the TAC for Google overall is about 40% and Apple probably drove a hard bargain to get a premium for its, presumably, premium traffic.

    So if we knew the revenue run rate for Android search on a per device basis we could perhaps guess how much of each phone's revenue comes from Google. What we've heard last year in Congressional testimony is that two thirds of its mobile revenues come from iOS devices. This would imply that the run rate for iOS would be 2x the run rate for Android.

    Having a model of Android revenues helps at this point. Assuming Google obtains $4.4 from Android (excluding AdMob and App sales) and assuming negligible other mobile revenues from other platforms gives a possible Google revenue per iOS device per year of nearly $9.

    Taking the lower bound of the revenue share estimate above means that half of Google's revenue goes to Apple or $4.4/iOS device/year or $9 over the two year life of the device.

    That would put revenue from Google at about 1.4% of iPhone revenues (see average revenue per iPhone here). And that revenue comes without any costs and so flows straight to the bottom line. That, in turn, would imply that 3% of Apple's operating margin is provided by Google. Not a bad deal considering that some phone vendors can't get that for their entire product line.

    The interesting factors at work here are that this contribution by Google to Apple is higher than the contribution by Android to Google. In yesterday's post, I calculated that in 2011 Android contributed about $590 million to Google's operating margin (5% of total).

    If we consider that Google pays Apple $9[1] for every iOS device and since Apple sold 156 million iOS devices in 2011 then Apple received $1.4 billion from Google, all of which went to the bottom line.

    $1.4 billion from Google to Apple vs. $600 million from Android to Google. Three percent contribution of Google to iPhone profits vs. 5% contribution of Android to Google's profits.

    This sets up all kinds of game theorizing which will undoubtedly entertain and enrich us all.

    ---

    Notes:

    1. Perhaps this $9 value is not valid for all devices. Perhaps iPod touch does not get a lot of traffic and is less valuable. Perhaps iPads get more traffic and are worth more. On average, this may be plausible.
  9. Android economics: An introduction

    Research · 53 comments

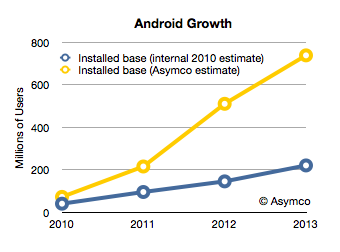
    Android has had unprecedented growth. Based on activation announcements, it's possible to estimate that thus far, about 370 million Android devices have been activated. The total number of devices in use is a lower figure which depends on replacement rate and retirement rate. This total number of devices in use at year end is estimated in the following chart.

    I added the blue line which represents what Google had as an internal estimate in mid-2010.[1] The difference between the two lines shows that Android's growth is far higher than what the company expected.  If the company itself did not expect this growth, it's unlikely anybody else did either.

    Unexpected, exponential user growth is usually accompanied by a dramatic positive improvement in the finances of a company and a higher return to shareholders. The curious aspect of Android's success is that it has not had an impact on either. The market has not "discounted" the half-billion anticipated Android users into a price for Google shares that reflects this growth. It can only imply that those users are not very valuable.

    But why would there be such a disconnect between the number of users and their value?

    In order to answer this question we have to come to grips with what I call "Android economics". We need to understand how Google uses Android to make money and whether it is succeeding and if it's not, why not.

    In many ways, the Android business model is straight forward. It's an extension of the existing Google business model: Revenue is obtained from Search, AdSense and the applications that enable these two.  In the case of Android there is also revenue from app sales (Google Play a.k.a. Android Market) and from AdMob. Of course, all these revenue sources (except for Play) are sold through other mobile channels that include alternative, competing platforms. They are present on iOS, Symbian, BlackBerry and even embedded OS phones ranged directly by carriers. For each of these alternatives, Google pays for placement of their search as the default search in the browser.

    To Google, total search revenue from iOS is far higher than it is from Android. That's because iOS users engage more with their devices and there are not yet a large multiple of installed Android users vs. iOS users.

    But it would make sense that having your own platform would be more economical because there would be none of these placement fees. In this sense Android is another "channel" for distribution of Search and AdSense. But one which may be a lot cheaper.

    However, it turns out that it does not work that way. Android has other costs.

    In fact, Android's distribution costs might be higher than other channels. What we have to understand is that all of Google's channel revenues have a "cost". The revenue from a particular distributor of search results that Google generates is offset by the cost to acquire the terms. You can think of it as Google paying for the queries through a revenue sharing agreement. Google does not get search terms directly and depends on distribution. Overall, it pays about 50% of revenues back to distributors. In the case of its own web sites the rate might be lower, perhaps 40%.

    Google even has a term for it: Traffic Acquisition Costs or TAC.

    This revenue sharing in exchange for search terms extends to Android. Google pays about 40% TAC to Android distributors of those searches. But since Android is owned by Google, who does Google need to pay for traffic? Who is an Android distributor? Who gets the revenue share?

    Google does not make a secret of it: network carriers and device vendors (OEMs) receive revenue share. From the latest earnings conference call:

    Yes. I mean, again, I'm not going to talk about specific of the TAC on mobile. But as you know, we get people using our devices both organically as well as through our distribution partnerships with carriers and OEMs. And typically, the OEMs and carriers participate in some of the economics that are on the Android marketplace or Google Play and some of them participate in the economics around Google Search just the way we would do syndication on the Web platform, which you do with many partners around the world. We have similar deals on the mobile front.

    - Nikesh Arora, senior vice president and chief business officer at Google Google Management Discusses Q1 2012 Results - Earnings Call Transcript - Seeking Alpha

    Arora made another point in the quote above. Not only is there revenue sharing with carriers and OEMs for Search and AdSearch but also for Google Play (app and content sales.)

    Device vendors and carriers get a cut. Google's model has always been one of giving a cut of revenue to their upstream distribution. It just might be surprising to hear that device vendors like Samsung and carriers get a piece of Search and apps.

    This basic observation leads to a series of questions:

    • How much is paid out and to whom?
    • Is that revenue sharing sustaining the ecosystem? Do vendors create Android devices and do carriers push Android to consumers because they get this revenue share or is the amount insignificant vs. device margin? What about tablets? Why haven't Android tablets they taken off as Android phones have? Are the economics to blame?
    • Is this a competitive advantage vs. other platforms? Does Windows Phone compete with revenue share for Bing? Is Microsoft offering a bigger carrot (as well as a stick?)
    • How does this economic picture show up in Google's financial and stock price performance? Or, more precisely, why doesn't it?
    • And, finally, what conditions create a virtuous cycle of growth and what conditions could turn it into a vicious cycle of decline? Is there a lurking factor which would cause Google to benefit greatly from this user base or is there an inherent point of failure in the model?

    I'll be answering these questions in a series of posts this week.

    --

    Notes:

    1. Google's internal documents were leaked as part of the Oracle trial (Exhibit 1061). They can be found by using Google search with the following search term: "OC quarterly review".
  10. Which is best: hardware, software or services?

    Research · 43 comments

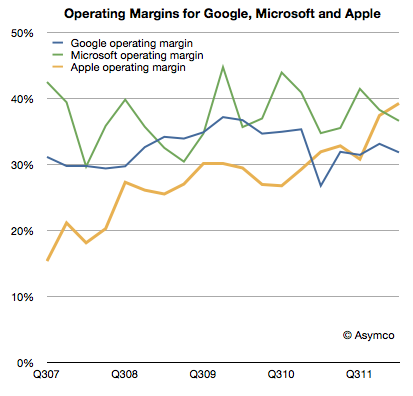
    Apple's recent margins are nothing short of spectacular. It's hard to convey just how remarkable 47% gross margin and 39% operating margins are. For a company that sells hardware these are simply unheard-of numbers.

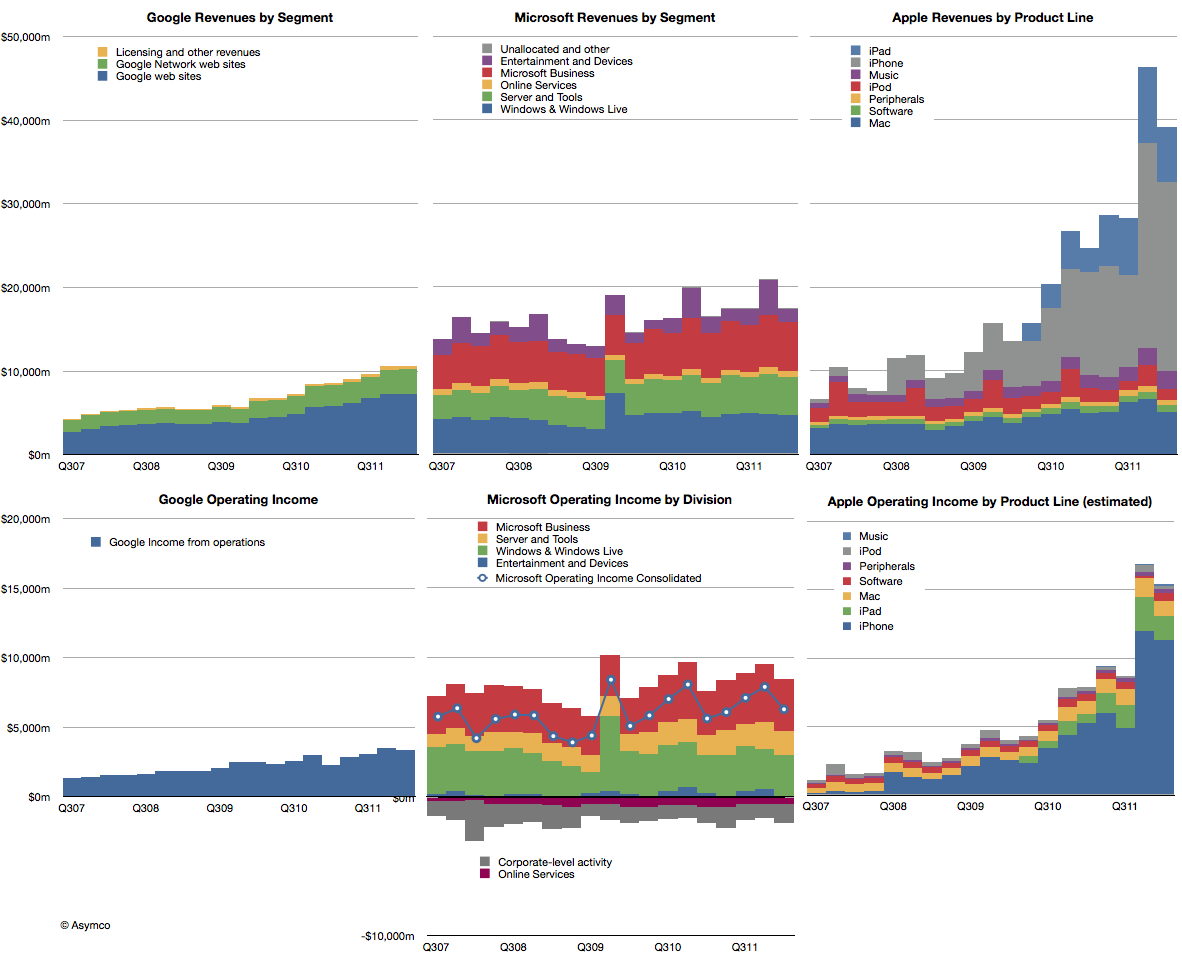
    The best way I can illustrate this is by comparing Apple's operating margins with those of two other platform-based companies, Google and Microsoft.

    Microsoft invented the software-as-a-business model and, as software is easily reproduced, their margins are phenomenal. The gross margins are typically in the 80% range for software. Overall, the company had higher R&D and SG&A expenses so their operating margins are a more modest 37% on average. However, Apple managed to exceed this value even though it has the disadvantage of actually having to build things made of atoms.

    Google also has led a charmed life free of inventory and factories. Its operating margins have been however hurt by investments needed to sustain the infrastructure for indexing the internet. That means that their margins have hovered around 33%.

    As the chart above shows, Apple has been creeping up on both these benchmark companies with exceptional operational leverage and, as of this last quarter, overtaken them.

    The reason Apple is able to do this is that its iOS businesses are extremely profitable and, as those businesses grow in absolute terms and relative to its other businesses, the overall margins are reaching into the stratosphere.

    The impact of iOS on Apple is shown in the right-most two charts below. The difference in growth relative to these other great companies makes Apple all the more impressive.

    But the temptation is to compare the "core" business models and ask which is best: hardware, software or internet services. It would seem that hardware is winning, suddenly getting the best margin and best growth--a dramatic reversal with prior technology business dogma.

    However, it would be a mis-reading of what allows Apple to succeed. Apple is the most valuable company in technology (and indeed in the world) because it integrates hardware, software and services. It's the first, and only, company to do all these three well in service of jobs that the vast majority of consumers want done.

  11. Android Economics

    Research · 88 comments

    Charles Arthur, writing for The Guardian, has noted that court filings seem to be revealing Google's Android revenues. If this is the case, we have a significant breakthrough in understanding the economics of Android and the overall mobile platform strategy of Google.

    The new data is a reference to a settlement offer Google made to Oracle of $2.8 million and 0.515% of Android revenues on an ongoing basis. The key assumption to make this data useful is that the $2.8 million offer represents 0.515% of revenues to date.

    In other words, that revenues from 2008 to end of 2011 multiplied by 0.00515 results in $2.8 million. That implies that revenues from 2008 to 2011 were $544 million.

    I think that's a fair assumption. I don't see why Google would offer a higher or lower royalty rate for years 2008 through 2011 than for years after 2011. The offer would seem to be 0.0515% in the future as well as retroactively in the past.

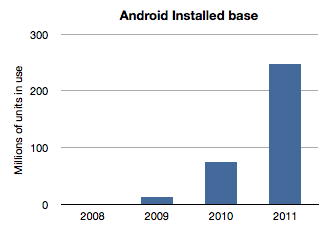
    If we work with this assumption then the next question is how to distribute this $544 million over the four years 2008 through 2011? The installed base of Android has grown exponentially and it would seem logical to assume that revenues have followed in a similar pattern. Here is a chart of installed base given activation data supplied by Google.

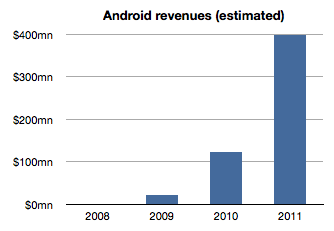
    If we assume revenues were distributed the same way we would get something like this:

    The sum of the bars in this chart equals $544 million and the ramp is approximately the same as the installed base. The relationship between the first graph and the second is a multiple equivalent to the revenue per device.

    Therefore a second assumption is that revenue per device remained fairly constant. In this model the revenue comes out to be about $1.70 per device per year. It's possible that rev/dev/yr. is increasing as Google services are discovered by users. It's also possible that the rev/dev/yr. is decreasing as later adopters are less likely to engage as early users. I just don't know how to adjust this value so by leaving it at the average, I can avoid introducing more assumptions.

    Now we can stop and look at this figure and do a test. Does $1.70 make sense as a device revenue for Android? Google had spoken about targeting $10/device/yr. but we have no indication that they are nearly at that level. If they did achieve that level, with an installed base of 300 million, Google could be collecting $3 billion a year in Android income. Are they getting it?

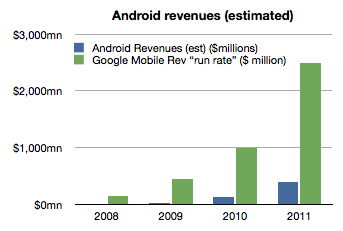
    As of October, Google mentioned that it had a $2.5 billion "mobile run rate". But we know that this figure is not only from Android. Mobile includes all mobile devices and services including those running inside iOS, Symbian, BlackBerry, Windows Phone, etc.  They could be counting ads on all mobile browsers as well as ads running inside all apps on all platforms. Furthermore, Google also testified that iOS accounts for two thirds of their mobile search revenues[1].

    Adding run rate to the Android revenue chart results in the following:

    So the step is to take the "run rate" figure of $2.5 billion and assume, as Charles Arthur did, that iOS income is what is left after taking out the Android part[2]. I also noted that Google previously mentioned a run rate of $1 billion and I will assign that run rate to 2010 and $2.5b to all of 2011. Since we know the number of iOS devices in use for years 2010 and 2011 we can calculate Google's revenues per iOS device in use.

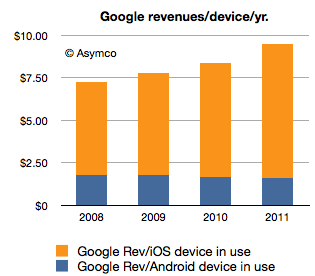
    If we thus combine all the data we know (revenues derived from settlement offer, units in use, run rate and iOS installed base) we get the following revenue profile:

    This shows a positive trend for Google: revenues per smartphone per year is increasing. However, the growth is coming from non-Android devices which means mostly iOS. Revenues per device for Android is probably declining.

    The story for iOS revenues however is not all rosy for Google. Google has to pay for that revenue. The mechanism is a payment that Google makes to Apple for the prominent and default placement of Google search on Safari.

    We don't know the terms of the arrangement but if we assume $2/device Google needs to shave $2 from the top of the chart above with that money going to Apple (attached as iPhone/iPad service revenues.)[3]

    That still leaves a healthy $8.33 in 2011 as operating income from mobile with $1.70 or so coming from Android.

    However, to make this operating income into bottom line profit, we have to extract the R&D and SG&A associated with mobile at Google. This would be, therefore, Andy Rubin's yearly budget.

    Andy Rubin has stated in the past that Android is profitable. That is certainly believable. The budget would have to be about $400 million/year in 2011.

    Charles Arthur concluded that Google obtains four times more revenue from iOS than from Android. My estimates indicate that in 2011 the revenue ratio was closer to 5 but if we subtract the cost of those sales in the form of payments to Apple then the ratio could well be four to one.

    Many of these figures begin to "hang together" as we balance assumptions about costs, revenues and statements made in public. There is a consistency within a comfortable margin of error. If that is the case, then the economics of Android begins to take shape.

    My take is that it's not a bad business. But it's also not a great one. As long as there is exponential growth in units, Android will improve its position inside Google relative to iOS. But from Google's perspective, iOS is today a bigger business. And iOS is not standing still. It's growing not only in terms of units but in revenue per unit.

    Strategically, and historically Android was never one thing. P&L considerations were not the only (or even at all) factors in investment for Google. Having a hedge against hegemony of potential rivals, having a means to learn and develop new business and having a role in defining the post-PC computing paradigm are all probably bigger considerations than profitability.

    So in terms of returns, Android is sustainable. However, in relative terms the value created leaves much to be desired. Whereas Android generates $1.70/device/year and thus an Android device with a two year life generates about $3.5 to Google over its life, Apple obtained $576.3 for each iOS device it sold in 2011[4]. The economics of Android are nothing like the economics of iOS.

    ---

    Notes:

    1. This figure is also not conclusive as search is not the only form of revenue on a mobile device but it does imply that Android is not the majority of Google's mobile revenues.
    2. Clearly this is overstating iOS as the non-Android income is broken up between several platforms. We can only say that iOS is the vast majority of non-Android income.
    3. Assuming a $2/device payment model means Google paid $312 million to Apple in 2011 and $171 million in 2010. This would go toward boosting Apple's revenue per iOS device. Naturally, if this distribution cost is higher or would be subject to re-negotiation then it could vary widely.
    4. The iOS figure includes accessories and licensing of trademarks but excludes income from App Store, iTunes music, movies, TV shows, iBooks, greeting cards or textbooks.