Asymco

Asymmetric Intelligence

iOS

  1. Samsung vs. Google: an Interview with Rafael Barbosa Barifouse of Redacao Epoca

    Research · 60 comments

    On Mar 18, 2013, Rafael Barbosa Barifouse - Redacao Epoca - Editora Globo asked (and I answered):

    Q: Why is Samsung creating Tizen?

    A: I believe they are collaborating on Tizen development because they want an alternative to Android and because Bada was not good enough to meet that goal. Tizen's roots include contributions from Intel, Nokia and several Japanese companies so it's not Samsung's OS per se. Historically it was the "open" alternative operating system for embedded and mobile systems. See https://github.com/kumadasu/tizen-history/blob/master/tizen-history.pdf for a historic perspective.

    In some ways Tizen seems to be a blend of several pieces of code including proprietary Samsung user interfaces. Samsung is presumably interested in having a unique, differentiated experience. This is something every device maker seeks. Put another way, if they did not seek this then it's unlikely that they would be profitable which would also imply that they would not invest in marketing and development of products. As Samsung invests both in marketing and development it can be concluded that they seek to offer a unique value proposition and, in today's market, that means a unique experience.

    Does it make sense to create a new mobile OS when it has had so much success with Android?

    Samsung would argue that the success it's had is not due to Android but to its products. Arguably they are right because if Android were the valuable component in a phone then buyers would buy the absolute cheapest device that runs Android regardless of brand. That is not the case. People still seek out a particular brand of phone because of the promise it offers. Consumers have been buying more Galaxies than no-name Android phones.

    Why is Samsung the most successful company between the Android devices makers?

    In my opinion it's due to three reasons:

    1. Distribution. Success in the phone business depends in having a relationship with a large number of operators. Samsung had these relationships prior to becoming a smartphone vendor [because it sold all other kinds of phones]. Few alternative Android vendors have the level of distribution Samsung has. For comparison Apple has less than half the distribution level of Samsung and most other vendors have less than Apple.
    2. Marketing and promotion. Samsung Electronics spent nearly $12 billion in 2012 on marketing expenses of which $4 billion (est.) was on advertising. Few Android vendors (or any other company) has the resources to match this level of marketing. For comparison, Apple's 2012 advertising spending was one quarter of Samsung's.
    3. Supply chain. Samsung can supply the market in large quantities. This is partly due to having their own semiconductor production facilities. Those facilities were in a large part built using Apple contract revenues over the years they supplied iPhone, iPad and iPod components. No Android competitors (except for LG perhaps) had either the capacity to produce components or the signal well in advance to enter the market in volume as Samsung did by being an iPhone supplier.

    Tizen was being treated as an OS for low and mid level devices, but recently Samsung said that it will launch a high-end device with Tizen on Q3, an area where it's very successful with Android. What has changed? What does this announcement mean?

    Planning for these product launches is done a few years prior to launch. I believe alternatives to the Android line (i.e. Galaxy) have been planned for a long time. Note that Samsung also has a line of Windows Phones and historically has supported Bada, Windows Mobile, Symbian, PalmOS and LiMo smartphone platforms. Samsung's involvement with Android is only about three years old, and arguably only enjoyed two years of prominent growth. That's less than one product launch cycle and far less than a platform or OS development cycle.

    I believe the company has a long term perspective and that includes a time span beyond the likely lifetime of Android [Note that platforms do have finite lives]. Keep in mind that phones last less than two years. If users are not loyal to a platform then they will very quickly move on. The "stickyness" of a platform depends on media or software consumption by the user. That level of consumption is not particularly high for most Android users. The same phenomenon happened with Symbian and BlackBerry and Windows Mobile users. Hundreds of millions switched or will switch out of those platforms. This happens far less with iOS, Mac OS X and Windows because of the significant investments users make in the ecosystems above the OS.

    Is Google dependent on Samsung's sucess with Android? Or Samsung is more dependent on Android since its the most popular mobile OS nowadays?

    Google is not dependent on Samsung because it's not dependent on Android. Samsung is not dependent on Google because Samsung is not dependent on Android. Android is valuable in theory but in practice its value is hard to identify. Historically it was planned as a defense against the hegemony of Windows, BlackBerry and iOS. In that respect it has succeeded. But playing defense is not enough to win a game. For Google to truly succeed in mobile it needs to define a better business model.

    So far its profitability from mobile is very weak and has not shown up in the bottom line. Furthermore, it's probable that Google has 'control' over only about 40% of Android devices in use. Control here means a guarantee that users will use those devices for the benefit of Google, and, more importantly, not for the benefit of its competitors.

    You can also think of it this way: If they "divorced" there would be minimal to no impact to their fortunes in the foreseeable future. Buyers of Samsung phones will still buy Samsung phones because they will look and feel very similar and Google services will still be available through browsers or apps (e.g. Google maps on iOS). Conversely, users of Google services will continue to use them because they will be available on Samsung devices, no matter what OS is running. The services Google offers are independent of Android and are cross-platform. They will make sure they are available on all major platforms (as they were before and during Android). Google is far more loyal to Search and Maps and Gmail and YouTube than they are to Android.

    Do you think Google is going to merge Android with Chrome OS?

    Google's chairman said they would so I assume they will.

    If so, how this could make an impact on Samsung?

    It depends on how the new OS would enforce licensing terms. If the result would be a restriction on Samsung services like S Pen, AdHub, Samsung Wallet, SmartTV, ChatON etc. then Samsung might reject the OS and either fork Android or move to Tizen more broadly.
  2. Reasons for iOS outperformance in the US

    Research · 147 comments

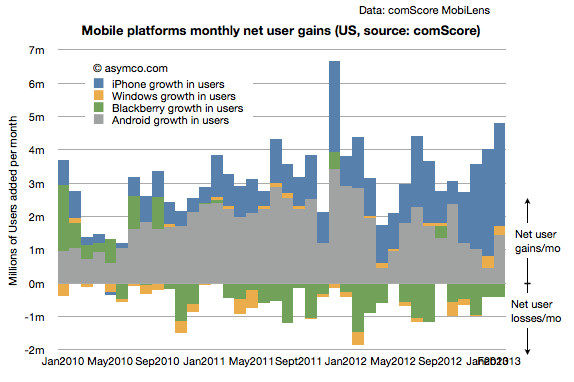
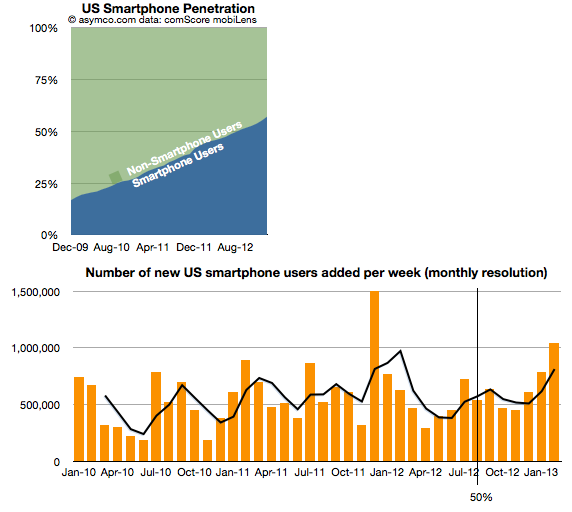
    The comScore mobiLens survey for the US ending February 2013 shows continuing rapid expansion of smartphone usage in the US. Even though the 50% penetration threshold was passed seven months earlier, the rate of new smartphone users was second highest ever recorded with over 1 million new-to-smartphones users every week during February.

    Screen Shot 2013-04-05 at 4-5-4.15.52 PM

    Overall penetration increased to 57% with nearly 2% of the population switching in one month. Using the average growth rate for the last six periods, the US could see 80% penetration in another 19 months or by Q3/Q4 2014.

    It remains to be seen if the consistency of growth which was preserved from 20% to 60% is maintained between 60% and 80%, but all indications so far are that it will be.

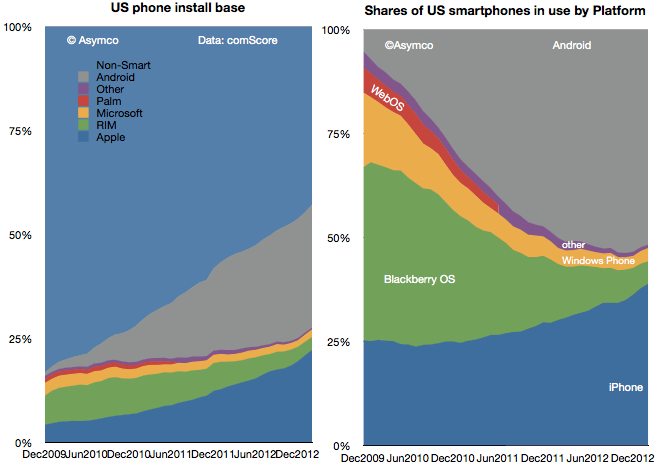
    The growth in smartphones has been driven by the two dominant platforms: iPhone (iOS) and Android. Together they now make up 91% of the user base with about 40% for iPhone and 51% for Android.

    Screen Shot 2013-04-05 at 4-5-4.19.14 PM

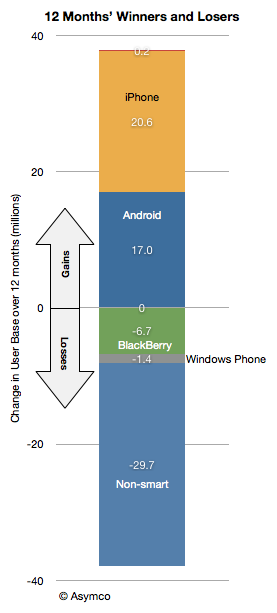
    Android alone gained 17 million users in the last 12 months while iPhone gained 21 million users.

    Screen Shot 2013-04-05 at 4-5-4.20.02 PM

    iOS user gains have out-paced Android for the last four periods which resulted in a decrease in Android share of users. A reduction in Android share was also visible in the spring of last year but the current decline is not only longer but more pronounced.

    Screen Shot 2013-04-05 at 4-5-4.22.13 PM

    The reason iOS is growing more rapidly may be due to three factors:

    1. Broader distribution with three out of four major operators carrying the phone
    2. Availability of three product variants with $0 starting prices.
    3. Increasing awareness and use of apps and content ecosystems due to network effects.

    As distribution is about to increase with T-Mobile being added to the carrier list the growth in iOS share is likely to continue even as the market expands.

  3. So long, break-even

    Research · 113 comments

    The following is another excerpt from a report titled "iTunes Business Review" which will soon be available for purchase through the Asymco Store. If you are interested in the product please get in touch.

    ---

    iTunes store will be 10 years old next month. From its inception Apple has stated that it aims to run the store "at break-even".  The business has grown so rapidly however that its profit-free nature has come under severe pressure.

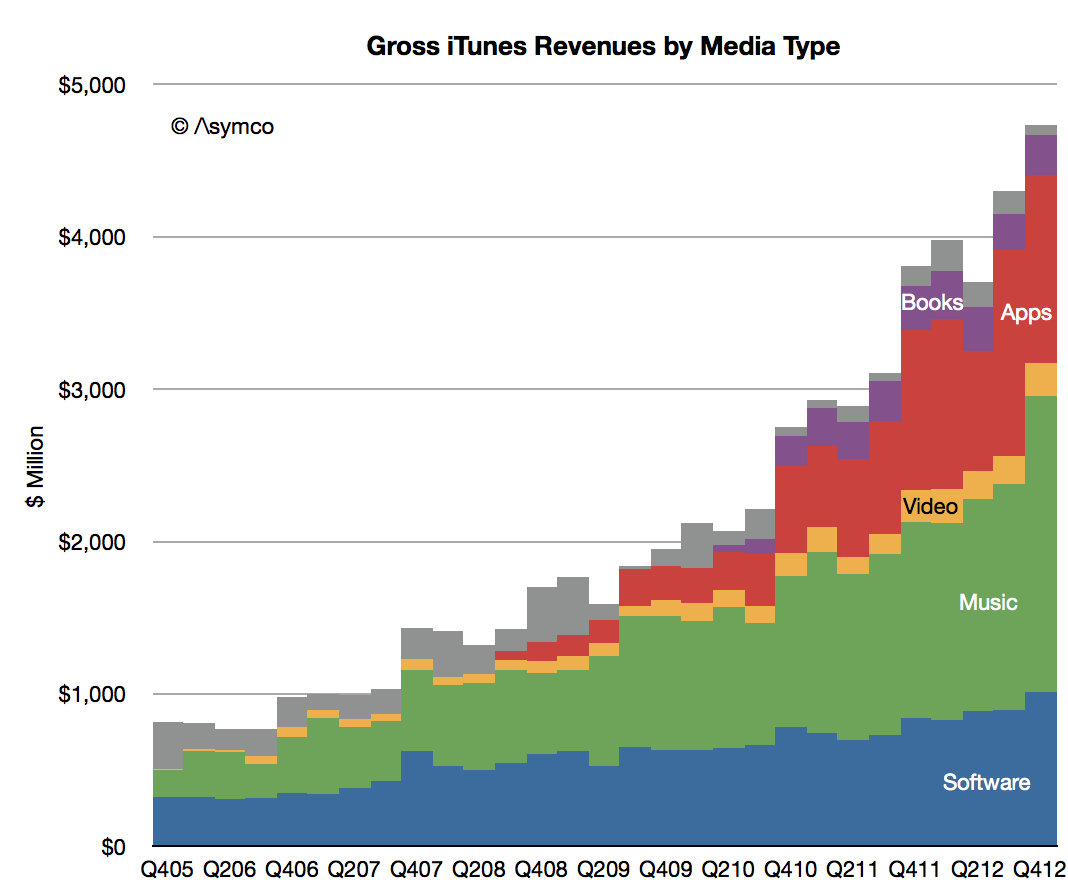
    The reasoning goes that as more media types have been added costs have increased but revenues have increased even faster. Consider the estimated gross revenue base as shown below:

    Screen Shot 2013-03-22 at 3-22-2.39.55 PM

    What is known as iTunes today has quintupled in seven years. Although cost of content sales are likely to have been preserved as a ratio (about 30%) the vastness of transaction volume (estimated at 23 billion item transactions in 2012 alone) implies that there are some significant economies of scale.

    This implies that the operating costs are spread more evenly and that therefore the possibility exists for some operating margin.

    Put another way, at break-even the cost of operating iTunes stores would be about $3.75 billion. It's hard to imagine this level of operational expense for digital content.

    For this reason, management has begun since 2010 to suggest that at least the App Store is run "a little over break-even". How little is a good question. A one percent operating margin (from gross revenues) would imply as much as $45 million margin. I estimate 2% is possible on Apps and 1% on Music.

    That's $150 million in margin content. Heady stuff.

    However, since folding its Software group into iTunes (the blue area in the graph above) the margin picture changes dramatically.

    The Software group is one of the forgotten heroes of Apple.

    Apple’s software division “Apple Software” is responsible for the following products:

    • iWork which includes Pages, Numbers and Keynote. These are available through the Mac App store at about $20 per product and the iOS App Store for $10.
    • iLife which includes iMovie, iTunes, iPhoto, GarageBand. The OS X versions are available free with new computers but they are also available as paid downloads for OS X through the Mac App Store at $15 each and for iOS devices through the App store at $4.99 per app.
    • OS products including downloads of iOS and OS X. These are mostly free but some OS X updates are not free (typically $19.99 for new version including the server version of OS X.)
    • Professional tools which include the following products: Final Cut Pro (Video editor $299.99), Logic Pro (Music editor $199.99), Aperture (Professional Photo workflow $79.99), Compressor (additional features for Final Cut Pro $49.99), Motion (video transition editing for Final Cut Pro $49.99)
    • Administration and development tools which include:  Xcode integrated development environment which is free Apple Remote Desktop which is priced at $79.99.

    All these products are now sold through either iTunes App Store or Mac App Store. They used to be sold as traditional boxed software for many years but Apple has transitioned them all to be download-only and folded them into the catalog of third party apps while lowering prices.

    My estimate is that Apple’s own software generated $3.6 billion in Revenues in 2012. As you can imagine, this is a high margin business  which grows at nearly 20%/yr. Although I estimate that the software business has been overtaken by the Apps and Music businesses in gross revenues, it keeps an operating margin similar to that of Microsoft or about 50%.

    This means that iTunes inclusive of Apple's own Software generates as much as 15% operating margin on gross revenues. That's over $2 billion a year.

    So much for breaking even.

  4. The race to a billion—2012 Update

    Research · 66 comments

    I last looked at the race to a billion in March 2011. Since then, I've been updating and adding data to the set giving a broader selection of platforms to compare.

    Before we dive in, an explanation: the initial review excluded Windows (PC) and Facebook mainly because (a)  the ramp scale I'm using is about a decade in duration and (b) I was reluctant to compare platforms that require payment to join to those that don't. The (DOS/Windows) PC ramped over several decades (starting in 1981) and Facebook is a service that costs nothing to join. There was much gnashing of teeth and shaking of fists as a result.

    Therefore, in the interest of inclusion, I added both to the data set and let the chips fall where they may.

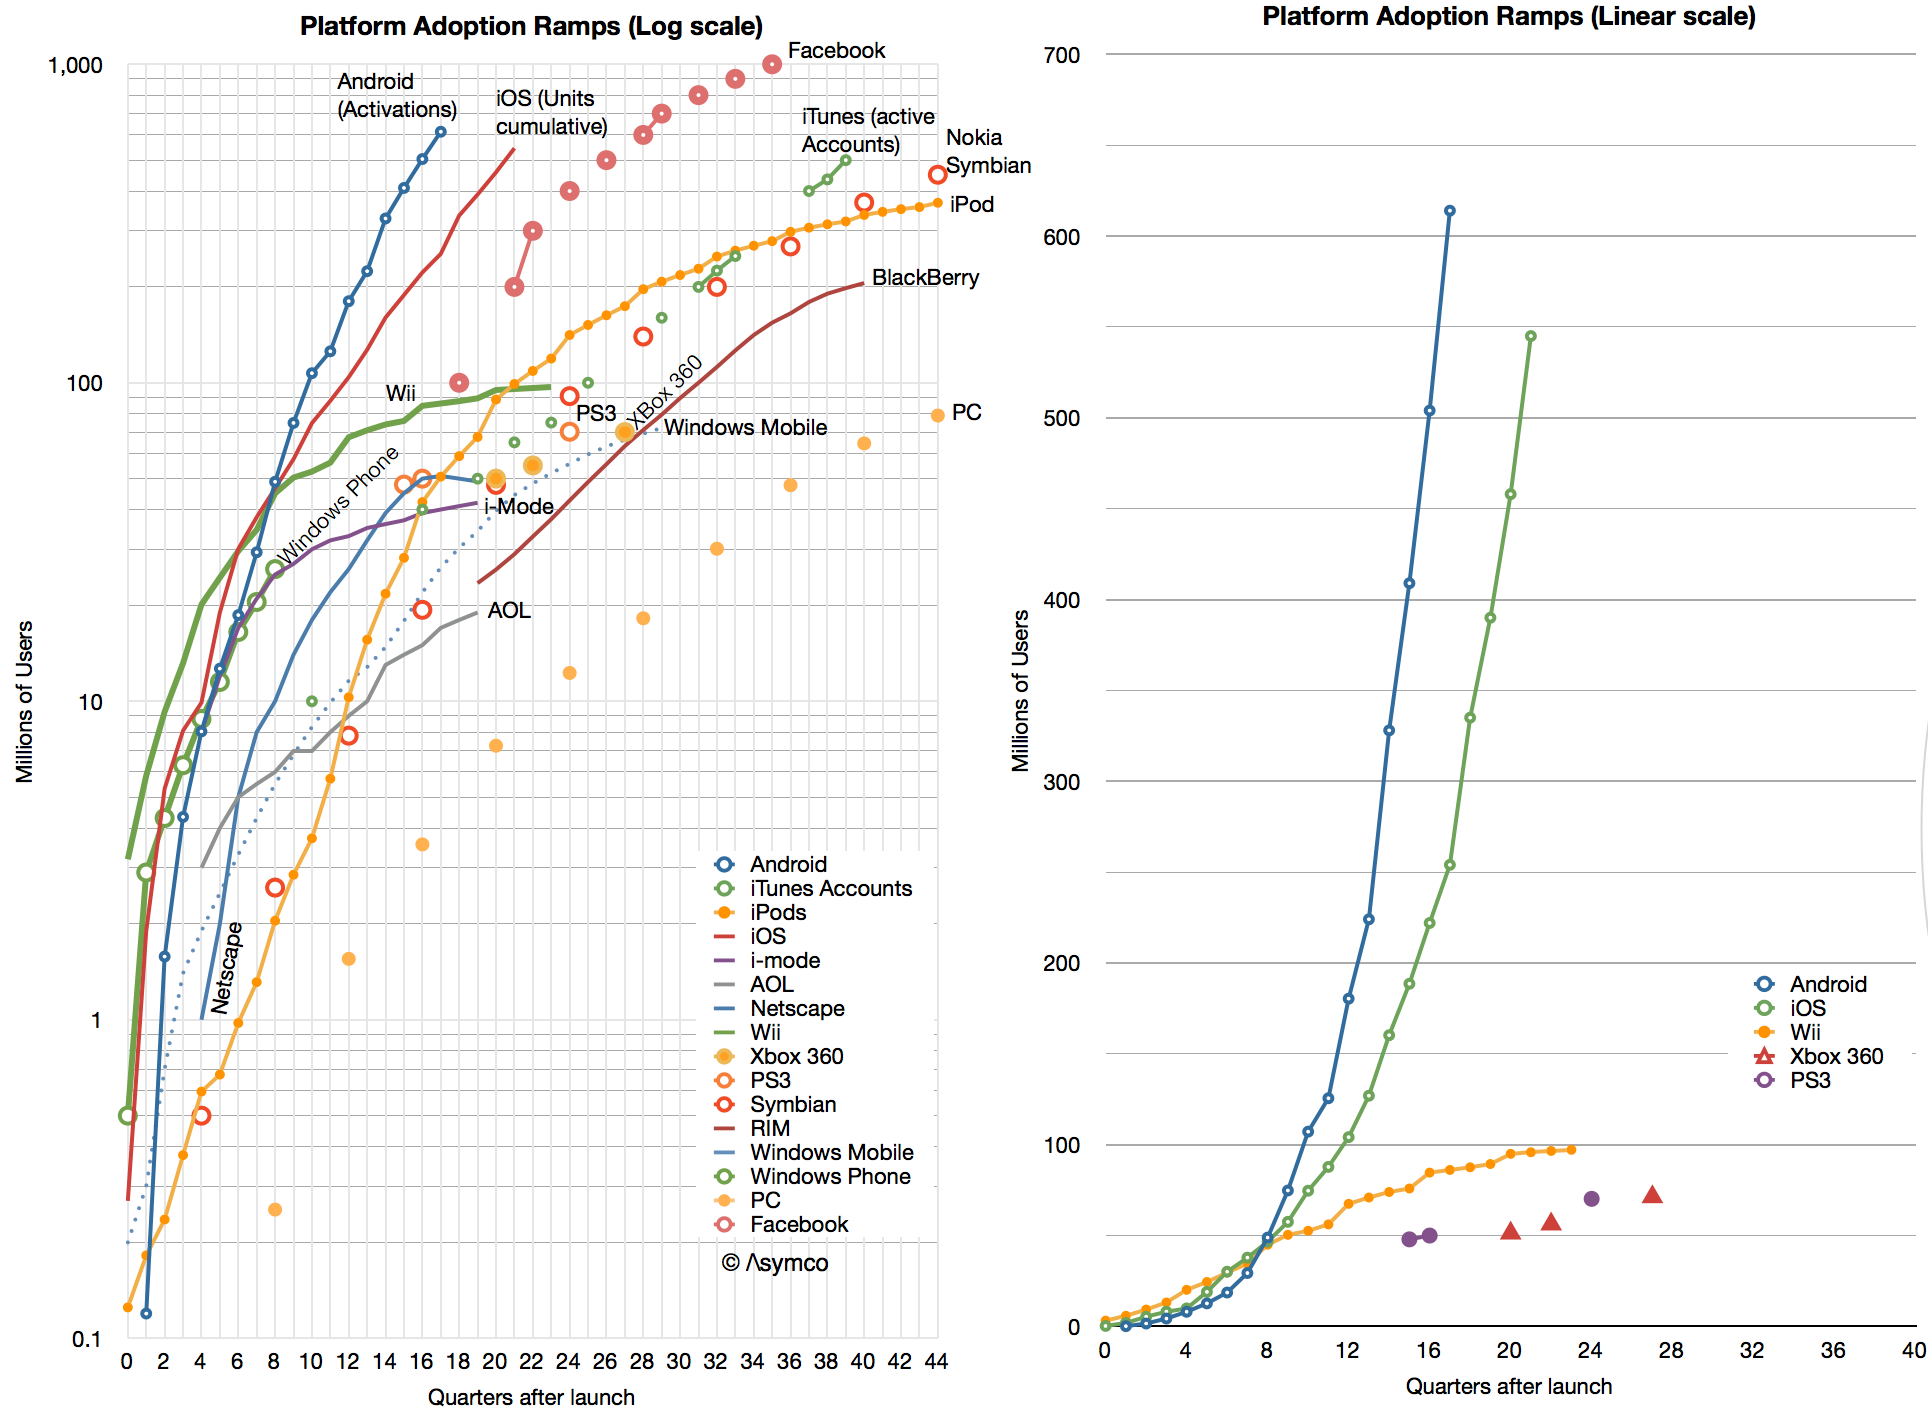
    The data is shown below.

    Screen Shot 2013-01-16 at 1-16-2.11.50 PM

    I kept the scale to about a decade so that individual lines can be resolved. As a result, you'll note that although Windows reached one billion first it did so slowly enough to be off the scale shown. Indeed, the "race to a billion" should be titled  "The race to one billion users in less than a decade".

    In such a competition, the winner would be Facebook which, in October 2012, 35 quarters after launch, reached the finish line. The second looks to be Android (probably this year) and the third iOS (sometime next year.)

    That may sound like the end of it, but what the graph also shows are the more subtle trends:

    • Game consoles seem to saturate at below 100 million total. One can see the difference in ramps between recent mobile platforms and consoles in the second chart. There might be implications for which platforms will end up dominating the entertainment industry. There should also be some explanations of why consoles are so limited.
    • iTunes accelerated with iOS and left the iPod behind. This is unsurprising but it shows that a content platform can be more flexible than one attached to any particular device or architecture. An important lesson perhaps for those in the content businesses.
    • Early mobile platforms like Nokia's Symbian, RIM BlackBerry and Windows Mobile have faded indicating that there was no early-mover advantage in platforms. The same can be said for early PC platforms.
    • Windows Phone began by tracking the Android/iOS ramps but seems not to be accelerating into its second year in a way that implies potential parity.
    • Although Facebook did reach 1 billion rather quickly the slopes of Android and iOS indicate that they may overtake it in overall ecosystem size.

    One billion is significant in several ways: First, because it is the "high-water mark" set by Windows and signifies what a global platform needs to become to be essentially "universal". Second, because it implies sustainability. A threshold perhaps from which network effects are sufficient to sustain (assuming some switching costs and an ability and willingness to adapt e.g. software, content or time investments from users.) Third, because it implies sufficient value to the ecosystem (assuming a monetization mechanism exists e.g. Windows software developers and IT managers.)

    Looking beyond this milestone however, there is no reason why it should be thought of as a barrier. Mobile connections number over 5 billion and computing is likely to reach most of them. Therefore one billion may turn out to be only 20% penetration. In fact, I expect this series of posts will need to be updated in 2013 as "The race to two billion."

  5. The Android engagement paradox

    Research · 180 comments

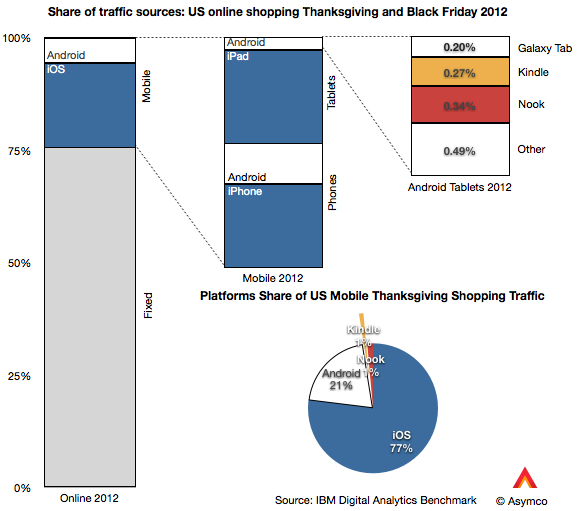
    IBM's Digital Analytics Benchmark reported US Black Friday sales and the news is reasonably good. Overall online sales grew by 17.4% while mobile grew to make up 24% of traffic.

    The data goes further to show the split between device types. I illustrate this split with the following graphs:

    Of the 24% of traffic made up by mobile devices, phones contributed 13% and tablets 11% (or 54% and 46% of mobile respectively). Of the phone traffic, iOS devices were about two thirds of traffic and Android one third. Of tablet traffic, iPad was 88%, Kindle and Nook were 5.5% Galaxy Tab was 1.8% and other tablets were 4.4%.

    Overall, iOS was 77% generated mobile traffic and Android (excl. Kindle, Nook) was 23%.

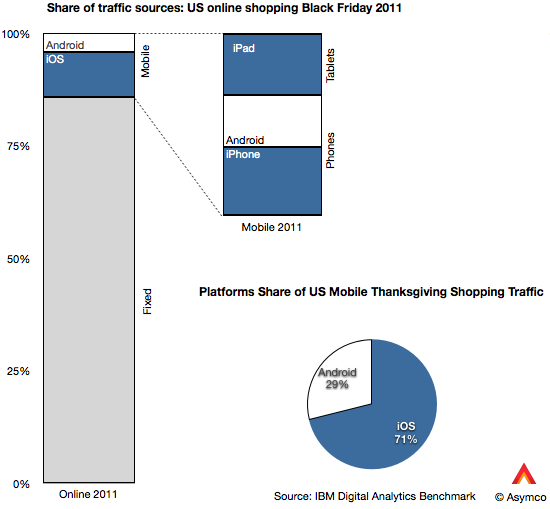
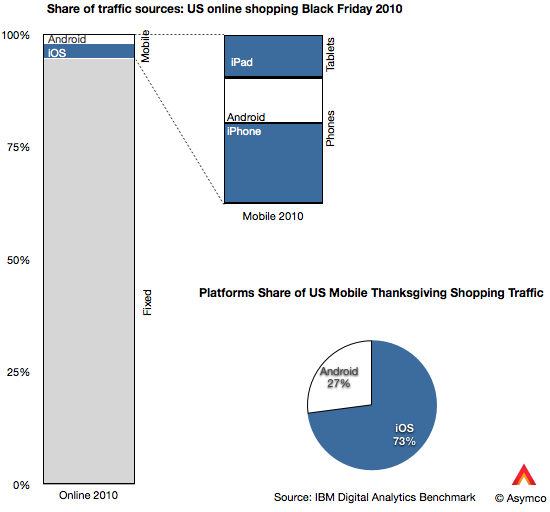
    That's an interesting snapshot of the consumption of mobile devices, but is there a pattern here? I also took a look at the same data from 2011 and 2010.

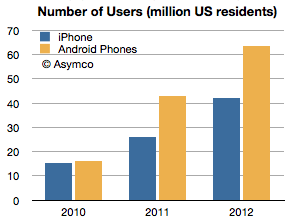
    Besides the pattern of significant mobile growth (from 5.2% to 24% of online in two years) there is the curious effect of iOS growth outpacing Android growth. Android went from 1.43% of Black Friday shopping traffic in 2010 to 4.92% in 2012. In same time iOS went from 3.85% to 18.46%. In other words, while Android is up by a factor of 3.4, iOS is up by a factor of 4.8.

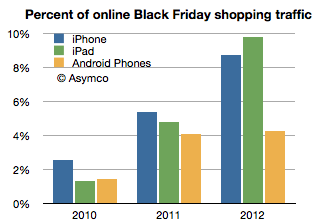
    The reason is evident in the graphs above: the iPad is now the predominant mobile shopping device. You can observe the pattern in the following graph:

    Two years ago the iPad was trailing Android usage but this year it was more than twice Android usage. Curiously, the iPhone seems to also be pulling ahead of Android.

    Curiously because the number of Android users in the US has gone the other way. That data is available from ComScore, though only for phones. (ComScore data for periods ending November each year, Nov 2012 is my estimate):

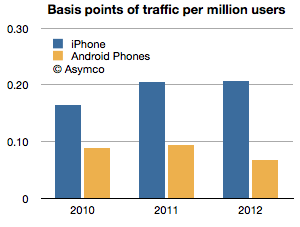
    Having the number of users and the traffic allows us to measure consumption per capita, so to speak. That is, the percent of traffic per device user:

    The ratio shown is basis points of usage (1/100 of 1% of shopping traffic) per million users of smartphones. iPhone users are about three times more engaged in shopping with their devices than Android users. Two years ago the ratio was two to one.

    Overall iPad is changing shopping habits, but it has a near monopoly in its form factor at this point. The bigger question is what is causing phone users to behave differently based on the devices they own. The phone market is more mature and has had several years of competition to be able to discern differences in platforms. The pattern is pretty clear with respect to Android: engagement is down as ownership is up. This pattern has not exhibited itself with iPhone, even though it has had a longer time in market.

    Of course, one would expect that later adopters would engage less, but I find it surprising that US Android users would behave so differently only two years after the platform began to be widely adopted. That pattern is not happening with iOS even after five years and certainly not with the iPad which is about as old as most Android brands.

    This I consider to be a paradox: Why is Android attracting late adopters (or at least late adopter behavior) when the market is still emergent? We've become accustomed to thinking that platforms that look similar are used in a similar fashion. But this is clearly not the case. The shopping data is only one proxy but there are others: developers and publishers have been reporting distinct differences in consumption on iOS vs. Android and, although anecdotal, the examples continue to pile up.

    And engagement is not a frivolous platform attribute. It is highly causal to success because it correlates with all cash flows associated with ecosystem value creation. Especially when a platform like Android depends more on engagement than "monetizing hardware."

    I'm not satisfied with the explanation that Android users are demographically different because the Android user pool is now so vast and because the most popular devices are not exactly cheap. There is something else at play. It might be explained by design considerations or by user experience flaws or integration but something is different.

    ---

    If you'd like to learn more about the Asymco method, come to Asymconf. The next Asymconf will be at the end of January near San Jose. Not only will you learn about how mobile is disrupting computing, you will also get to hobnob with the likes of Om Malik, Jean-Louis Gassée and Michael Lopp.

  6. The policymaker's dilemma

    Research · 33 comments

    Here is an exchange with Robert van Apeldoorn, Journalist with Trends Tendances Magazine in Belgium. (www.trends.be/fr). The exchange took place in early September via e-mail.

    Robert: -Information and Communications Technology (ICT) is considered in Europe as a way to push growth, and is a target of national and EU policies (digital growth,etc), but the result seems to be a failure: the European computer industry (hardware) is almost dead (ICL, Siemens computers bought by Fujitsu, Olivetti almost out of computer business, Nixdorf dead) since the 90’, and the telco industry seems to be in crisis. All European companies are out of the handset business (big and fading exception is Nokia, but with  American software), and Alcatel is suffering with telco equipement manufacturing. It seems that at best, Europe can be a good niche player, with companies like ARM (chips). Technology seems to be reduced to localized services (computer services), some software businesses. What do you thing about that point of view? Is it correct or exaggerated ?
    What will remain to the European companies ?

    The main problem is perphaps the creation of European platform/ecosystems. Almost all are American today: Apple IOS-iTunes, Android, Amazon,…

    Why Symbian didn’t succeed as a competitive platform ?

    Is it possible to create European platforms? After all, IOS succeed after a short period of time.

    What are the European tech companies that could play an important role in the near future ?

    My answer: You are correct in this observation. Europe has failed to generate growth on the basis of ICT. The reasons are that the rate of change in ICT is rapid and getting more so. If European businesses require intervention, support or other forms of assistance in terms of policy, the time for that coordination to take effect is longer than the cycle time of disruption.

    Almost all growth has come from companies that entered the space. Google, Amazon, Apple and Facebook and even Microsoft came into positions of power from outside the industries they entered. Policy tends to offer means of sustaining incumbents or finding "logical" or defensible entrants. I should mention that the problem of industrial policy failing is not unique to Europe. Japan and to a lesser degree Korea are also facing crises of innovation due to policies designed to sustain rather than disrupt.

    It's understandable given the need to justify spending other people's money. No policy maker wants to spend it recklessly. However, the process of unforeseen growth is, well, unforeseeable. It cannot be predicted and it's very likely to come from somewhere other than where you expect it.

    This quickly becomes a lengthy discussion, but fundamentally the innovation process is chaotic. It's very similar to the process of artistic creation. The crisis in innovation comes from not having sufficient chaos. If Europe wants to preserve, sustain, nurture, and maintain it will do so at the expense of creative destruction. Nobody likes chaos but everybody wants innovation. Unfortunately they are concurrent things.

    thank you very much for these interesting answer. Usually the answer is the lack of venture capital or the compartimented market.

    So Nokia was an exception ?

    If a lack of venture capital is the problem then what is the cause of a lack of venture capital? There is plenty of capital on the continent. Why should it not be allocated to ventures? Capital markets in Europe are quite free and liquid and capital will find the best opportunities. The problem is that there are few fundable opportunities.

    I think Nokia was not an exception in the sense that it was not a "managed" success. The company (and Finland) emerged from a crisis in the early 90s. The crisis forced a re-evaluation of priorities and the success of Nokia could be attributed to a lack of emphasis in what was considered sustaining at the time (consumer electronics, TVs, natural resources, etc.) Entry into mobile phones was not what policy would have suggested was the biggest opportunity at the time. The market for mobile phones was projected to be insignificant in comparison to what was seen as success of the time (Sony, et. al.)

    [Addendum: What are policy makers suggesting as the key investment themes? Which projects get funding today and which don't?]

  7. The late smartphone adopter paradox

    Research · 70 comments

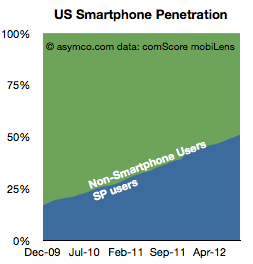
    comScore reports that US smartphone penetration has decisively crossed over 50% in August. This should not come as a surprise as the penetration rate has been very linear.

    Now that we've crossed this milestone, the thing to watch is the conversion rate from smartphone non-consumption to smartphone consumption.

    The reason is that we don't know what "saturation" means in smartphones. We can assume it's at least 80% as about 80% of new phones being purchased are smartphones. What we don't know is how much above 80% it can be. It could  be 100% if feature phones simply stop being made but we can't be sure if there will be latent demand and how long this will last (similar to the market for black-and-white TVs after Color became commonplace).

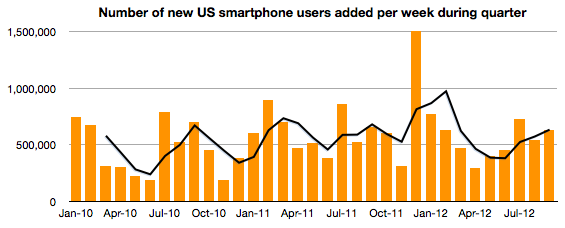
    To help keep an eye on this measure, the following graph shows the rate at which non-smart to smart conversion is happening.

    It measures the addition of new (to smart) subs each week in a particular measurement period (three months ending the month shown on the x-axis). There is also a 3 period moving average shown as a line. Keep in mind that this shows net new users and therefore excludes smartphone switchers. It's a good measure of how rapidly non-consumers are being converted to consumers.

    The data shows that there are as many first time smartphone adoptions in late 2012 as there were in late 2010. Or, the new-to-smart users are joining ecosystems just as quickly when penetration is 50% as when it was 20%. An encouraging situation when considering the opportunity space above 50%. The "S-curve" has not reached an inflection point.

    If you're thinking about growth, so far so good. There is however one surprise in the data.

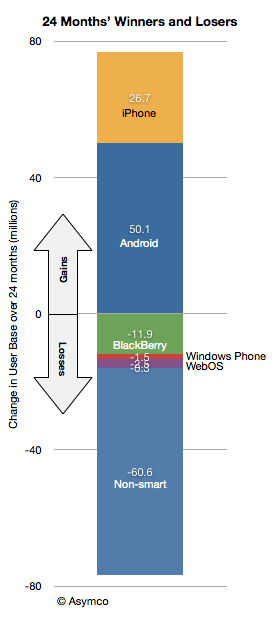
    All the growth in the last 24 months (between 2010 and present) was due to Android and iOS. Android added 50 million and iOS added 26 million in the last 24 months. The net smartphone user additions were about 60 million (RIM lost about 12 million, Windows lost 1.5 million and others lost 2.6 million). Android therefore has gained twice as many users as iOS has in this two-year period. Put another way, Android captured 70% of the growth and iOS captured 30% of the growth.

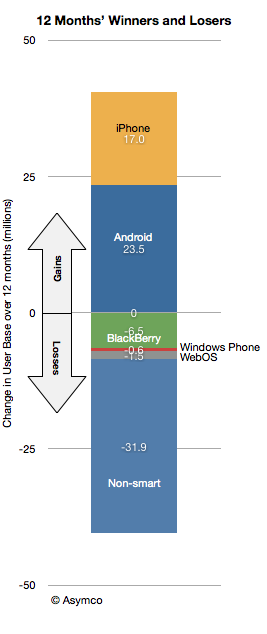
    However, if we look at the last 12 months, the split is 23.5 million for Android and 17.0 million for iOS. Android gained 58% of the growth and Apple captured 42%--a change in "spread" from 40 points to 16 in favor of Android.

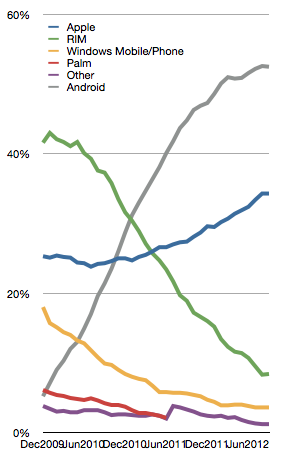
    The evidence also shows itself in the trajectory of platform market shares of installed base.

    In the last six months, Android share growth is slowing while iOS is still gaining.

    If this trend continues then the next 50% may not behave as one might expect (namely that late adopters would take the low-cost commodity offering accelerating Android adoption.) Late adopters may, in fact, be choosier than early adopters. And it's not at the cost of overall growth. Late adopters are still converting at the same rate of the early adopters.

    Therefore, paradoxically, the late market shows that the prospect for iOS growth seems strong. Furthermore, as we do reach saturation, perhaps in another three years, the secular growth may end in the US but the loyalty of iOS usage may give iOS another advantage in a market where growth is determined by "platform churn"

    The US is the crucible of the phone market in many ways so what happens in the US may be a harbinger for what happens world-wide.

  8. Hey Big Spender

    Research · 64 comments

    In previous posts I described the patterns of asset value growth for Property Plant and Equipment at Apple and how that change has been thus far correlated to the production of iOS devices.

    The analysis was based on looking at the declared value of the PP&E assets on Apple's balance sheet. These values include depreciation so they reflect not only the "spending" on new assets but also the value lost due to wear and tear. As such it's not a perfect measure of investment.

    The better approach is to use declarations on the cash flow statement. Apple reports a specific cash flow related to PP&E: Under Investing Activities, Payments for acquisition of property, plan and equipment.

    In the latest 8-K the amount for the 12 months ended September 29 the value was $8.295 billion.

    Compare this with the statement in the Annual Report from one year ago:

    The Company anticipates utilizing approximately $8.0 billion for capital expenditures during 2012, including approximately $900 million for retail store facilities and approximately $7.1 billion for product tooling and manufacturing process equipment, and corporate facilities and infrastructure, including information systems hardware, software and enhancements.

    Compare also with the PP&E net asset value on the Balance Sheet currently at $15.452 billion but valued at $7.777 billion a year ago (an increase of $7.7 billion).

    This means that Apple intended to spend $8 billion, actually spent $8.3 billion and realized a net asset gain (after depreciation) of $7.7 billion.

    So there are no major surprises. The spending was only about 4% above expectations a year earlier.

    The other pattern to observe is that the spending rose dramatically into the fourth quarter. The fiscal quarterly spending was:

    1. $1.32 billion
    2. $1.46 billion
    3. $2.06 billion
    4. $3.46 billion

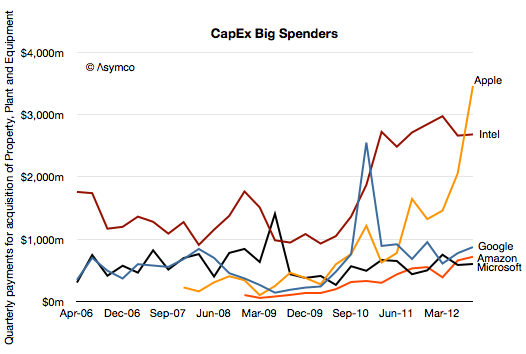
    I illustrate this pattern (and previous quarterly spending) in the following chart.

    The question remains what is this $8.3 billion being spent on?

    To help answer I also added the comparable spending (from cash flow statements) of a few other technology companies. Google, Amazon and Microsoft have been spending in the same range of $500 million per quarter. Over the past eight quarters the average spending of these companies has been:

    • Amazon $487 million
    • Microsoft $583 million
    • Google $800 million

    Intel is different. Its average spend level has been $2.6 billion/quarter.

    But Apple has just spent about 30% more than Intel. And it spent three times in Q3 than Google, 4.8x Microsoft and 3.8x Amazon.

    The level of spending and growth from a far lower level implies to me that Apple is spending primarily on process equipment (aka tooling) rather than servers. Data centers are expensive at $1 billion for a large one, but they are not being built fast enough to account for $3.5 billion in one quarter.

    Note that Apple's CapEx is above that of Intel whose fab-based semiconductor production method is known as particularly capital intensive. And Intel's Capital Expenditures have been increasing to all-time highs.

    If Apple spent at Google levels on server infrastructure it would only be spending a quarter of what it's actually spending. If Apple spent on production at Intel levels it would only be spending three quarters of what it's spending.

    In other words, Apple is spending at the equivalent of one Intel of fabrication and one Google of server infrastructure.

    In a few days we will learn what the plan for expenditure for fiscal 2013 is. Historically, the company has roughly doubled spending for each year of the iOS platform. If that continues then Apple will be spending the equivalent of several Intels and several Googles.

  9. iOS portfolio price distribution

    Research · 35 comments

    With the iPad mini launch imminent, it's time to think about the expanding iOS portfolio. We don't know how much the "mini" will cost or what variants will be available but I took some rumors as a basis to form a hypothesis.

    The idea is that there will be 24 variants which have three dimensions:

    • 2 colors
    • 4 capacities
    • 3 radio chipsets

    The starting point would be $250 for an 8 Gb WiFi only model and increases of $100 for each doubling of capacity and $130 for the addition of cellular chipsets.

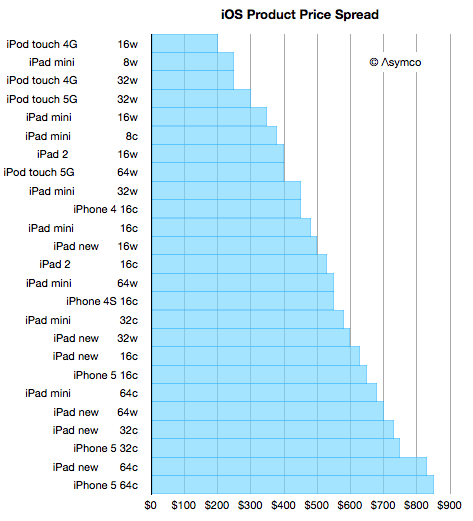
    The results would slot into an increasingly broad price spectrum. I included all the models of iPod touch, iPhone and iPad that we already have available and built the following graph.


    The number after each product name is capacity in Gb and the letter "w" signifies Wifi only and "c" signifies WiFi and Cellular.

    You can look through the list and see whether products of comparable prices are "competing for a purchase decision" or whether there is some marketing logic to the arrangement. I consider the purchase decision not to be determined by price but by many factors like the job being offered by the product.

    But in many cases buyers have a budget and are looking to fit a product into that price. This is more common when the product is a gift.

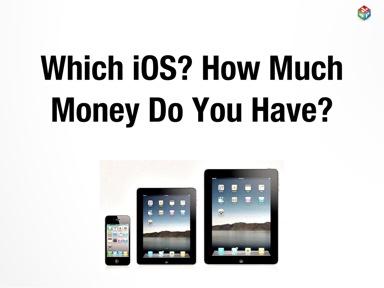
    So with that in mind I created a quick motion chart in Perspective to answer the question: Given a budget, how much iOS device can you buy? You can "dial in" various price points and see what products are available with graphical representation of capacity.

    If you are on an iPad and have Perspective, you can launch the story (with voice-over) through the following link:

    Which iOS? How Much Money Do You Have?.

    If you're not an iPad but have one click on the "Send e-mail" to get a link in your inbox and open it on the iPad.

    If you don't have an iPad but have an iPhone, stay tuned as an iPhone version of the app will be ready soon.

  10. Using Capital Expenditures to predict Apple's share price

    Research · 96 comments

    It takes money to make money. That's a cliché. But it's also true. The interesting question is how much can be gained from how little.

    In previous articles I explained how Apple's expenditures of capital for equipment used in manufacturing affects their output of products. The relationship between capital in and product out should stand to reason.

    The more surprising aspect of that analysis is that we get to know in advance how much Apple spends (since they tell us their budget a year before it's spent.) and therefore it becomes possible to get a rough idea of how much they will produce. And since demand has generally been higher than supply we can get an estimate of how much Apple will sell.

    The only missing piece to this logic chain is to estimate how much will shareholders benefit from the capital expenditure. I'll try to establish the relationship through a build-out of graphs.

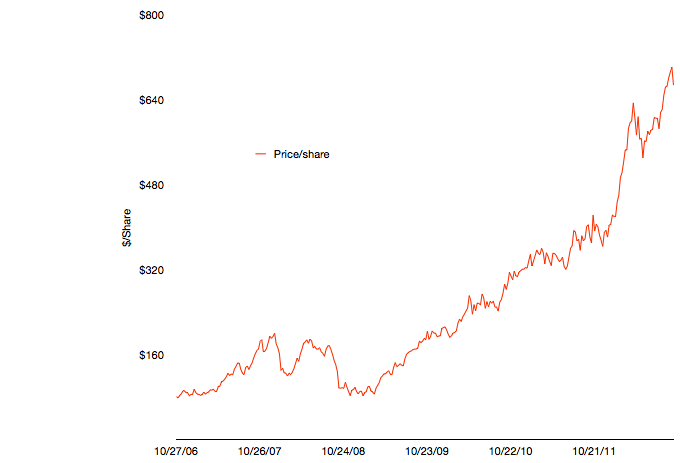
    The first graph shows Apple's share price at weekly resolution.

    The time frame stretches back six fiscal years. The time span includes some dramatic periods including the financial crisis and the launch of the iPhone and iPad.

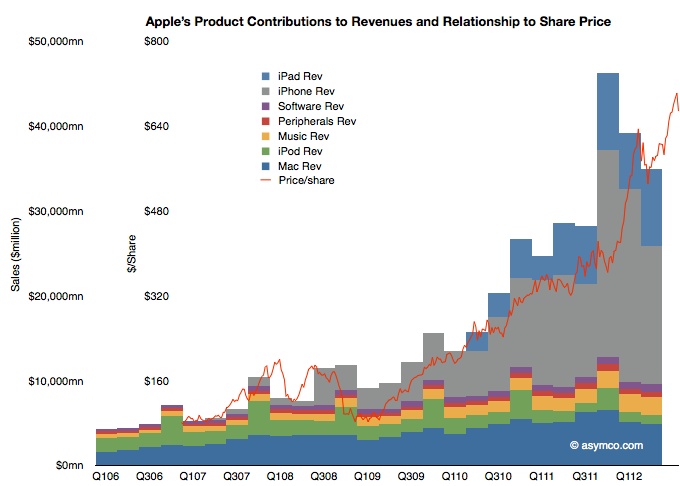
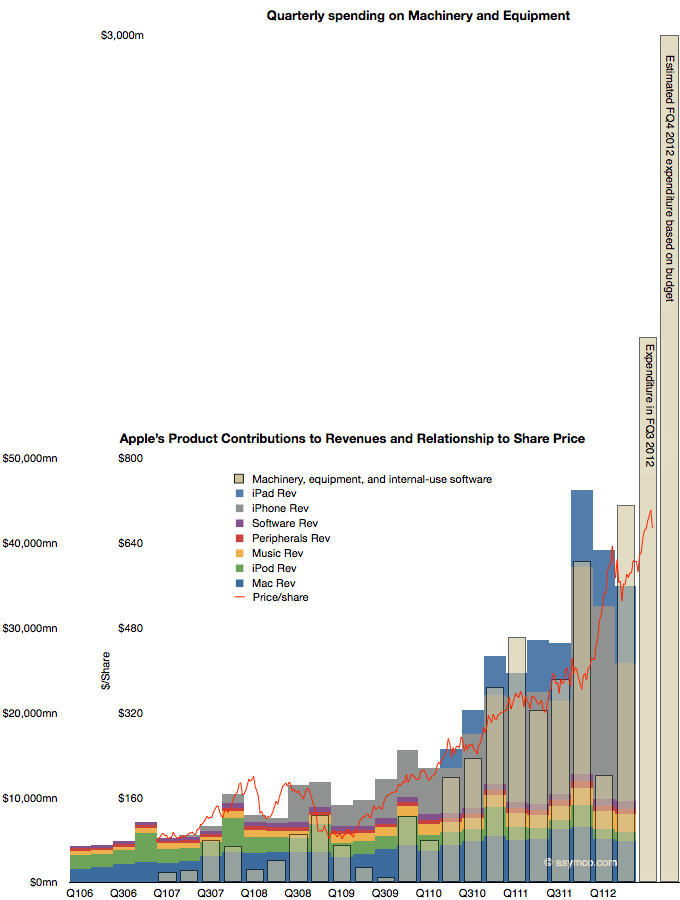
    To illustrate the effect of the iPhone and iPad on this share price appreciation, I've overlaid a quarterly resolution graph showing revenues over the same time period with each product line shown separately.


    Note that I've indexed the vertical scale to match approximately the highest peaks of both graphs. The two axes scales are shown separately on the left.

    The relationship between growing sales and growing share price is plain to see. Note that the iPhone and iPad account for the vast bulk of  sales growth and hence they are mostly responsible for the share price appreciation. Again, this should not be surprising. The scale gives an approximation of the relationship where $50 billion in quarterly revenue roughly yields a share price in the $700 to $800 range.

    As I've shown in the last post on forecasting production using CapEx (focus on the last chart) iOS device shipments (mostly iPhone and iPad) correlate with capital expenditures in the previous quarter. Using the historic relationship, the next two quarters could see a significant increase in iOS unit production. The sum of the low end of the range implies about 163 million units.

    If the relationship is therefore CapEx -> Production and Production -> Share price appreciation, then the transitive implication is that CapEx -> Share price appreciation.

    That relationship would be illustrated as follows:

    The CapEx data shows the offset to the right due to the relationship with production being time shifted by one quarter. Recall that expenditures are booked ahead of output and therefore we have this apparent view into the future.

    The fourth fiscal quarter's spending has just ended and the output will be produced during October-December period.

    The obvious question is whether production will increase in response to spending (as it has in the past), or, put another way, will the stacked bar areas follow the beige bars and, furthermore, will share prices follow production (as they have in the past) and thus the red line will follow the beige bar.

    It takes money to make money. The relationship seems to be that $1.5 billion of CapEx per quarter yields a share price of $800. With spending reaching $3 billion per quarter will the share price reflect a similar ratio?

  11. Projecting iOS devices sales through iTunes account growth

    Research · 16 comments

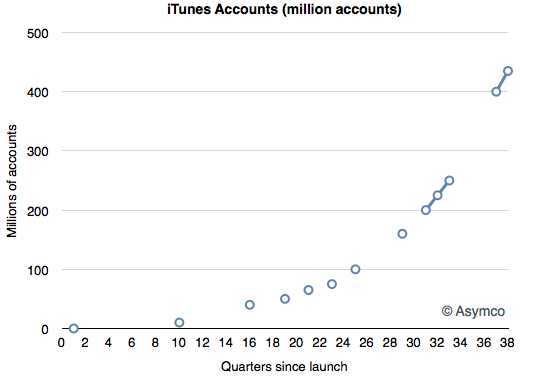
    During the iPhone 5 launch event, Apple announced 435 million iTunes accounts (with credit card numbers) with one click shopping.

    The account total is updated occasionally by Apple and the history of these updates is shown below:

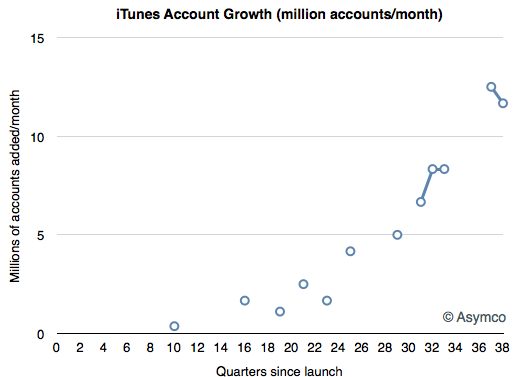
    Measuring the growth in accounts shows steady acceleration.

    The current rate is approximately 12 million new accounts per month.

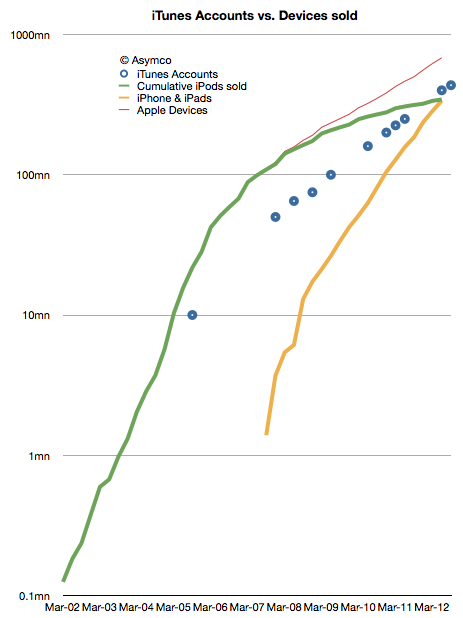
    The growth in iTunes accounts mirrors the growth in iOS usage as shown the following chart:

    The alignment between the circles and the red line should offer an alternative method of projecting the platform's growth.

    Projecting the growth forward would imply one billion accounts in another two years. As iPhone and iPads growth increasingly converges with iTunes (of which there are 400 million units sold), the same time frame could apply to iOS cumulative sales.

    This is not a very precise forecast, but late 2014 to early 2015 could see one iOS billion units sold.