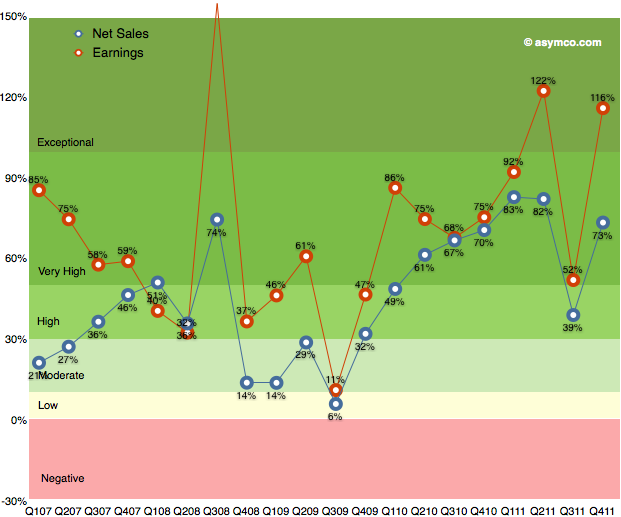
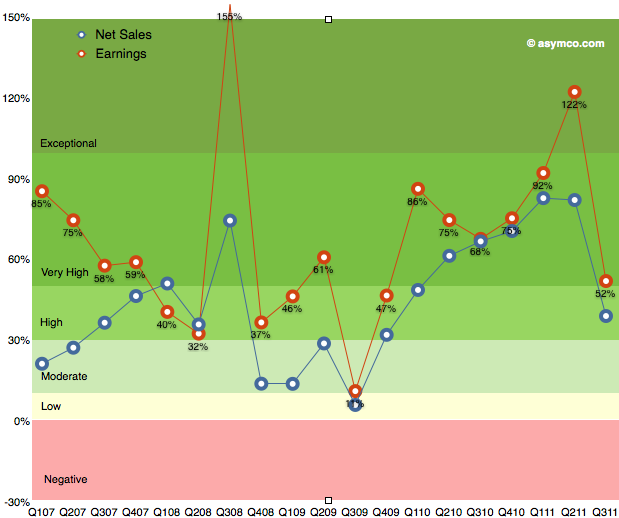
After the transitional third quarter, Apple's earnings growth returned to an exceptional level. As the following chart shows, earnings growth has maintained above 50% growth since 2009.
Q3 turned out to be a transitional quarter with 52% growth but Q4 proved to be "exceptional" with growth above 100%. This is the third highest rate of growth in the five year span shown. Sales growth was also very near the top of the range, coming in fourth historically.
When looking at the components making up sales, we can see each product line's revenue growth in the following table:
The growth leaders were also the largest product lines in terms of revenue. iPhone and iPad had triple digit growth rates and that translated into the bottom line growth.
Music related products and services which Includes revenue from sales from the iTunes Store, App Store, and iBookstore in addition to sales of iPod services and Apple-branded and third-party iPod accessories grew at 42%. This is the highest rate during the time frame shown.
Peripherals which Includes revenue from sales of displays, networking products, and Apple TV was next with 29% revenue growth.
The Mac line followed with 22% growth and Software which includes sales of Apple-branded and third-party Mac software, and services through the Mac App Store grew at 7%.
The iPod line continued to shrink with -26% decline.
I used color coding in the table to show the patterns of change and what I note is that the iPhone and iPad lines continue to be exceptionally fast growing businesses. The duration and amplitude of these streaks of growth should be a clear signal about the dynamics of these markets and Apple's role within. Too often, I find, these signals are ignored.
The iPad and Mac businesses both grew well in the last quarter. Tim Cook said they are observing some cannibalization of Mac from the iPad but much more switching to iPad is coming from the Windows PC market.
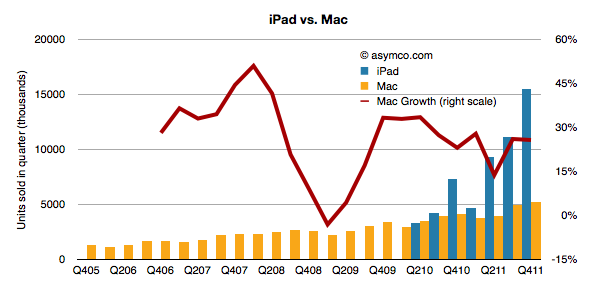
The evidence is still hard to pin down directly but the fact that PC sales (excluding the Mac) are down gives credence to the claim. Mac growth, in contrast, is largely unaffected. The following chart shows the the iPad volumes vis-a-vis Mac volumes and the Mac growth through recent history.
The iPad has out-sold the Mac since inception and is now about three times the volume. However, the growth rate in the Mac has not changed much.
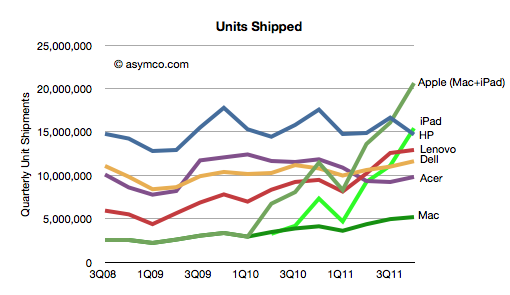
The impact on the PC market has been discussed recently and the data in the following chart is an update given more precision on the units from Apple:
The new data shows that the iPad alone would be the largest PC vendor and Apple with iPad and Mac combined is selling 5 million more units (or 30%) than the top PC vendor.
The impact of the iPad is not specific to any single vendor (Apple included). It competes for time and purchase decisions across all computing alternatives and though many times it's additive, it is also substitutive and will become increasingly so.
Tim Cook mentioned on the earnings conference call that Apple sees the iPad as addressing a market larger that the PC market:
I truly believe, and many others in the company believe, that there will come a day that the tablet market in units is larger than the PC market. In fact, it's interesting to note that in the U.S., it's clear from the IDC's recent data on desktop PCs in the U.S., that tablets exceeded desktop PC sales last quarter in the U.S.
Apple's products are often seen as being priced "at a premium". This is mostly a matter of perception, but in certain categories Apple's products are priced above the industry average (though probably still affordable to sufficiently large populations). As a result, when competitors launch lower-priced products there is a tendency to expect Apple to react and reduce its prices to compete.
This expectation was evident when AT&T had an exclusive on the iPhone. The assumption among many (expressed in comments here as well as elsewhere) was that a switch to multi-carrier distribution would result in a price reduction and consequently a reduction in margins.
It was evident in the iPod and the Mac businesses over the years as prices for competing products collapsed.
It is also evident with respect to the iPad where expectations are that the Kindle will cause a reduction in the iPad price (and presumably in the margin).
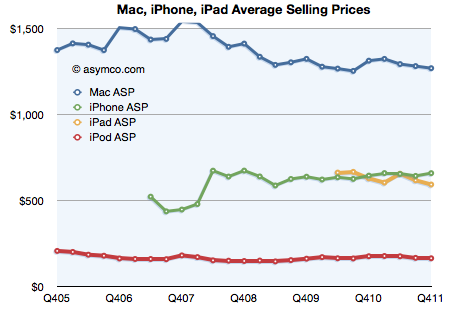
However, the data we have from Apple on their pricing shows no concessions to competitive price pressure. The following chart shows the historic prices that Apple was able to obtain for its main product lines:
Over the time span shown (six years) the Mac and iPod saw modest price erosion as would be expected from declines in component costs but there is little evidence that Apple altered fundamental price points (note that these values represent pricing to the channel not to consumers who pay for retail mark-up or discounting/subsidy/taxation).
Similarly, both the iPhone and iPad have held prices very consistently. There is some seasonality as products are launched and there were a few quarters where the original iPhone was priced differently, with operator service revenue sharing lowering the up-front price. But there is a consistency to these products that speaks of a strategy that avoids price-based competition.
In the latest quarter Apple launched a few new price points for the iPhone. With the 3GS and the iPhone 4 and 4S available, Apple had the closest it ever came to a phone portfolio. There was some anticipation that the 3GS price point ($375) would impact the average selling price. However Tim Cook stated that the 4S was the most popular product. Furthermore, the 4S introduced a higher capacity (64GB) which offered a new, higher price point.
As a result, the ASP for the iPhone actually increased to about $660 in Q4. During the launch quarter the iPhone ASP does tend to be higher but history shows that the variance is small. Gifting seasons also affect pricing where the mix shifts to lower priced variants as seen with the iPad and iPod, but again, these are not great changes and entirely due to mix shift. There is no discounting.
The evidence I see is that Apple does not change pricing but rather stakes out a specific price point as resonating with consumers given their positioning. They then doggedly stick to it. Competitors tend to exploit open price points or try to position with specs on the same spots Apple occupies. That's not a game I observe being played by Apple.
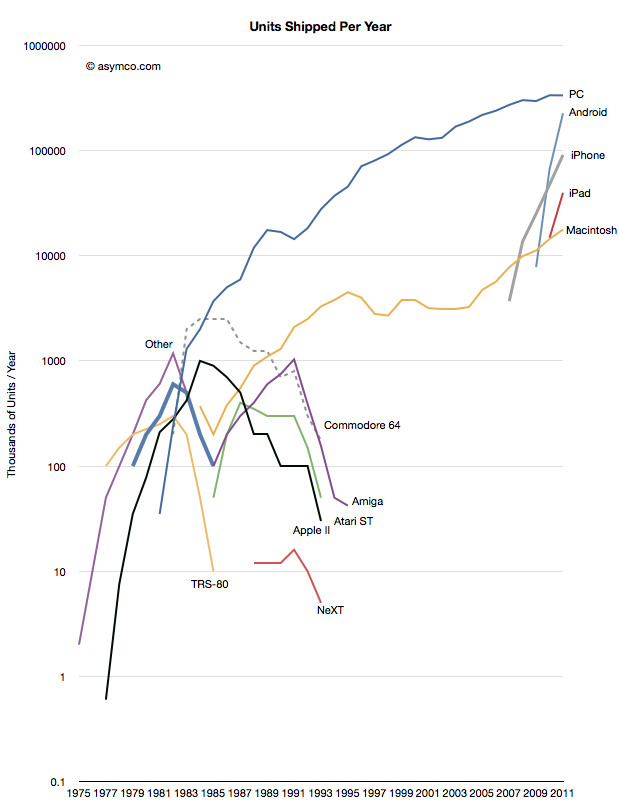
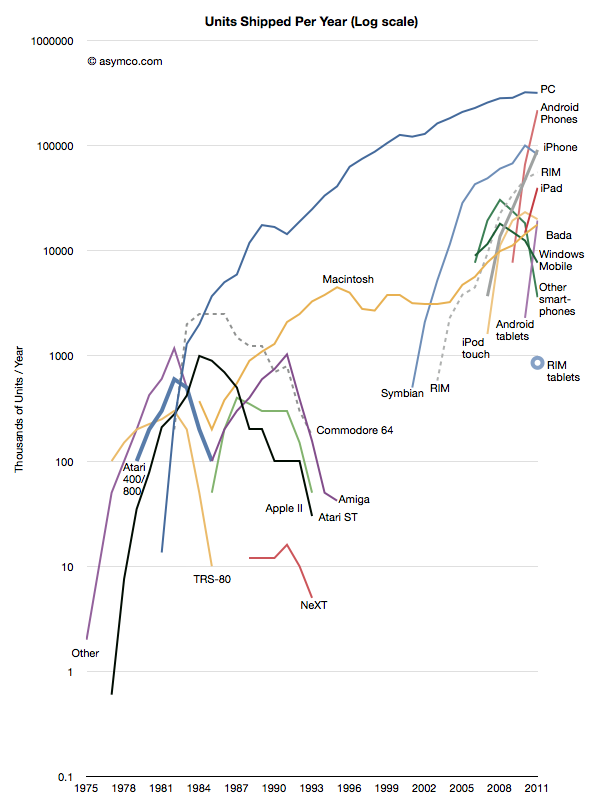
Thanks to Jeremy Reimer I was able to create the following view into the history of computer platforms.
I added data from the smartphone industry, Apple and updated the PC industry figures with those from Gartner. Note the log scale.
The same information is available as an animation in the following video (Music by Nora Tagle):
httpv://www.youtube.com/watch?v=8h-C6u4yLj4
This data combines several "categories" of products and is not complete in that not all mobile phone platforms are represented. However, the zooming out offers several possible observations into the state of the "personal computing" world as of today.
We cannot consider the iPad as a "niche". The absolute volume of units sold after less than two years is enough to place it within an order of magnitude of all PCs sold. We can also observe that it has a higher trajectory than the iPhone which became a disruptive force in itself. Compare these challengers to NeXT in 1991.
The "entrants" into personal computing, the iPad, iPhone and Android, have a combined volume that is higher than the PCs sold in the same period (358 million estimated iOS+Android vs. 336 million PCs excluding Macs in 2011.) The growth rate and the scale itself combine to make the entrants impossible to ignore.
There is a distinct grouping of platform options into three phases or eras. The first lasting from 1975 to 1991 was an era of rapid growth but also of multiple standards and experiments. It was typical of an industry in emergence. The personalization of computing brought about a new set of entrants. The second phase lasted between 1991 and 2007 and was characterized by a near monopoly of Microsoft, but, crucially one alternative platform did survive. The third phase can be seen as starting five years ago with the emergence of the iPhone and its derivatives. It has similarities to the first phase.
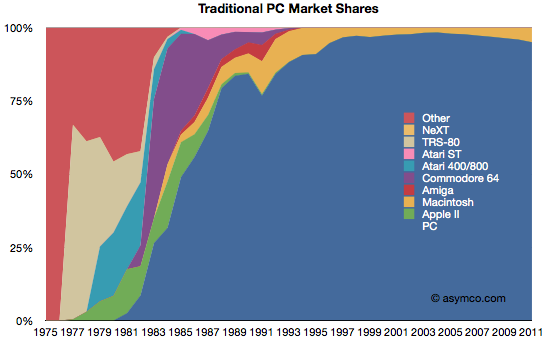
We can also look at the data through a slightly different view: market share. Share is a bit more subjective because we need to combine products in ways that are considered comparable (or competing).
First, this is a "traditionalist" view of the PC market as defined by Gartner and IDC, and excluding tablets and smartphones.
This view would imply that the PC market is not changing in any substantial way. Although the Mac platform is gaining share, there is no significant erosion in the power of the incumbent.
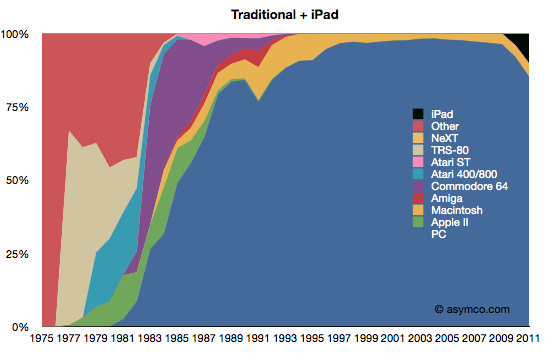
Second, is a view where the iPad is added to the traditionalist view.
This view is more alarming. Given the first chart, in order for the iPad to be significant, it would need to be "visible" for a market that already ships over 350 million units. And there it is. If counted, the iPad begins to show the first disruption in the status quo since 1991.
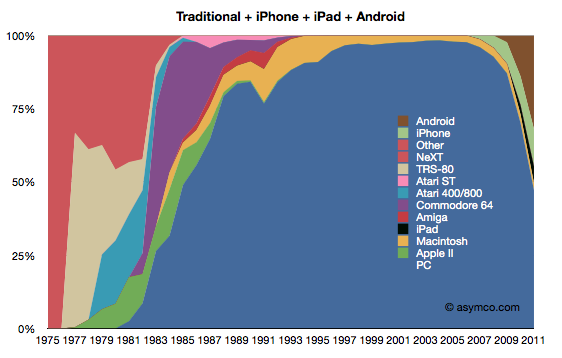
The third view is with the addition of iPhone and Android.
This last view corresponds to the data in the first graph (line chart). If iOS and Android are added as potential substitutions for personal computing, the share of PCs suddenly collapses to less than 50%. It also suggests much more collapse to come.
I will concede that this last view is extremist. It does not reflect a competition that exists in real life. However, I put this data together to show a historic pattern. Sometimes extremism is a better point of view than conservatism. Ignoring this view is very harmful as these not-good-enough computers will surely get better. A competitor that has no strategy to deal with this shift is likely to suffer the fate of those companies in the left side of the chart. Treating the first share chart as reality is surely much more dangerous than contemplating the third.
I've used anecdotes in the past to tell the story of the disruptive shift in the fortunes of computing incumbents and entrants. I've also shown how the entry of smart devices has disrupted the telecom world and caused a transfer of wealth away from the old guard.
The data shown here frames these anecdotes. The data is not the whole story but it solidifies what should be an intuition.
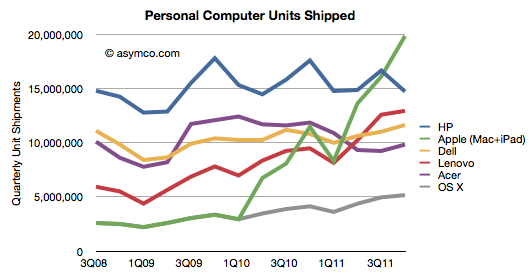
However, according to Gartner, HP shipped 14.7 million PCs in the last quarter. While we don't have the total global figure for Apple, my estimates are 5.2 million Macs and 14.7 million iPads, for a total of 19.9 million computers in the same period.
There might be an error in both Gartner's and my numbers, but the gap of over five million in Apple's favor is unlikely to disappear.
The history of shipments from these vendors is shown below.
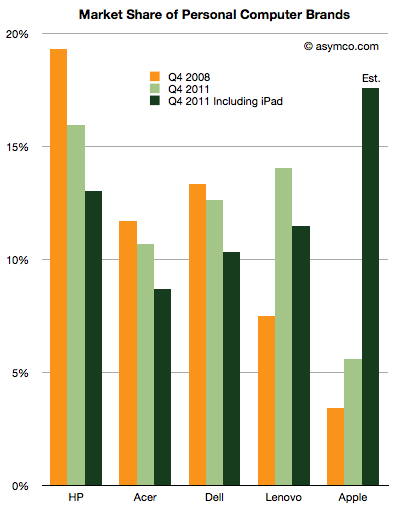
The market shares are also shown here:
I included the market shares thee years ago, and the rankings with the iPad excluded.[1] Apple went from 3.42% share at the end of 2008 to 5.6% share today excluding the iPad or 17.6% including the iPad. HP went from 19.3% in 2008 to 16% today or 13% if iPad is included.
Apple is ahead of schedule on their taking[2] the top spot in terms of units.
Notes:
Although vendors other than Apple also sell tablets, their totals are unpublished and I am not aware of any estimates so. If anyone has seen estimates I would be happy to amend the data.
Throughout the history of the industry, Apple never held the top spot. The Apple II peaked at 15.8% in 1984 and the Mac at 12% in 1992.
Gartner published its estimates for "PC" shipments during the fourth quarter. As I've done in the past, I combined their estimates with known shipments from Apple and separated Apple's performance from the Windows-based market.
I also take into consideration the iPad as a potential competitor for computing purchases. Apple will report fourth quarter results including Mac and iPad shipments in less than two weeks but I am using my own estimates until then.
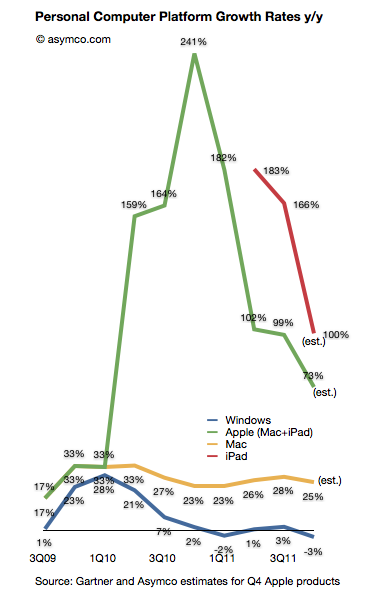
Here is how the platforms grew over the last few quarters (all figures are global):
The Gartner data implies a 3% decline in the size of the Windows PC market during the last quarter. This is the fourth quarter of disappointing Windows performance. If you observe the pattern for the Mac vis-a-vis Windows there is a similarity in the overall cycle but a divergence in terms of growth. The "spread" between Windows and Mac OS X is increasing and has reached an all-time high of 28 points.
But the more interesting story is that the decline in Windows seems to be coincident with the growth in the iPad. The green (Mac + iPad) shows the effect of the new category while the red line (iPad only) shows that growth in isolation (year-on-year).
Coincidence?
Ever since the iPad launched the hypothesis that it has an impact on PC has been hanging in the air. Most analysts (including Gartner) argued that there was no effect from iPad and that the problems with Windows were all due to one-time circumstances. We hear the same about the last quarter with floods in Thailand being blamed.
However, in the latest quarter Gartner began suggesting that "consumers' attention was diverted toward other product categories, especially smartphones and media tablets."
One wonders if these "media tablets" are not PCs and yet they negatively affect the purchase of PCs whether they are indeed competing with PCs.
Thanks to all those who contributed to the big Mac index there is a substantial amount of pricing data available in one location.
The analysis that I hoped to perform on the data was to see if Apple was pricing specific products differently in international markets. It was prompted by some apparently anomalous pricing of the iPhone 4S in Brazil.
To summarize, the idea is to calculate the "expected" price of an Apple product by taking the untaxed US price and adding duties and tariffs and taxes to determine what that product "should" cost in another country. Then taking the difference between this "expected" price and the actual price to determine if Apple is using pricing to signal in a particular market.
The analysis basically eliminates the effect of government on price and leaves currency and actual pricing signals from Apple as variables.
The analysis is not simple because there are many obscure tax rules. Some products are taxed differently in the same country. I have not completed the country-level analysis but have been able to see some averages over the countries reported (total of 45 reports.)
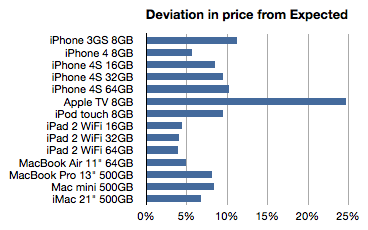
The following chart shows the average deviation from "Expected" as a percent:
Here are some potential interpretations of this data:
The more a product deviates from expectation (e.g. the Apple TV) the more it's likely to be targeted to the US or potentially has advantages of scale in the US
The less of a deviation (nearer to zero, e.g. iPads) the more the international market is interesting to Apple. They are essentially signaling that those products are targeted at wide distribution.
If we take this train of thought it takes us to these conclusions:
The Apple TV is being "subsidized" in the US. The price is so low there probably because it is benefiting from content sales. This is a compelling argument and it might suggest a strategy for Apple TV closer to that of Amazon's Kindle than to any of the telecom or computing products Apple sells. This may have significant implications in the pricing of any future "TV" product from Apple.
The iPhone 3GS seems to be a US-targeted product. Anecdotal evidence shows that the product is not particularly strong selling in international markets. Apple is seemingly not trying to stoke demand with discounting.
The iPhone as a brand is not tuned to compete on price globally. Indeed, the iPhone 4S is the most "overpriced" product and seems to be premium priced vs. iPhone 4. The iPod touch is also something of a prima donna when it comes to pricing.
In contrast to the iPhone, the iPad is being positioned through pricing for broad global distribution. This is undoubtedly due to their unlocked nature but there might be some other penetration tactics at play here.
Macs in general are not priced aggressively internationally. However the Air does seem to be positioned for volume growth (while the mini is not.)
Admittedly, these are quite aggressive conclusions given the limited data. What gives me some confidence in these conclusions is additional circumstantial data. The demand for some products is clearly higher outside the US than others. I believe and this data seems to support the notion that the overall strategy for the iPhone, iPad, Mac and iPod is being tuned for the international markets with some precision.
Apple's products are globally consistent. They sell the same exact[1] product in all countries. An unlocked iPhone is the same everywhere. It makes the products "liquid" in that they can be easily bought and sold across borders.
However, laws do not permit the import and friction-free trading of electronic products. In addition to regulations there are duties levied and there are sales or consumption taxes levied on the purchase.
However, knowing the retail price of an Apple product in a particular location, and knowing the tax and duties levied, can we work out if the price is consistent?
Here is an example:
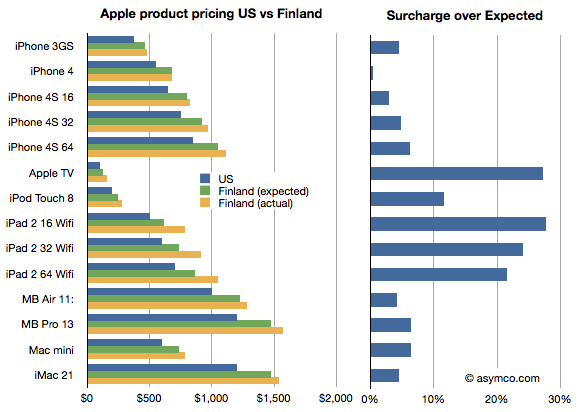
I illustrated the price of a basket of Apple products in the US online Apple store in blue and the same products in the Finnish online Apple store where the prices were converted to US dollars in yellow. I also calculated what the price in Finland "should" be if the products were sold with the known VAT of 23% added. I called this "Finland (expected)" price and it's shown in green.
I then took the difference between the "expected" and actual prices as a fraction of the expected and called that the "surcharge". The surcharge can be interpreted as "how much more does a buyer in a different country pay over the price in the US (excluding US sales tax) plus VAT and duties."
What the chart shows is that not all Apple products are treated equally by Apple. In this particular case Apple TV and the iPad are "overpriced" significantly. Interestingly, the iPhones are nearly what would be "expected" price.
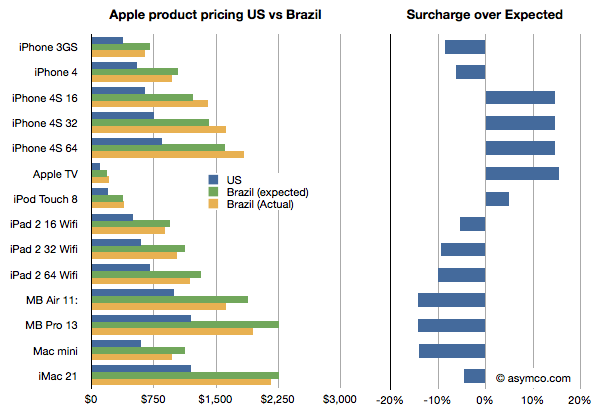
It gets curiouser when comparing with other countries. In this case I compare the same basket in Brazil.
Here the story is reversed. The iPads are cheaper than one would expect while the iPhones, especially the 4S, are more expensive, though not by as much as the iPads are in Finland.
Why is this?
I don't know. These prices are set by Apple though they may be influenced by operator deals they have locally or other terms. It would require local knowledge of the market to solve this.
What would also be instructive, I believe, is to collect data from many more countries. If you are living in another country, you can help by providing the following data: For each of the products in this list,
iPhone 3GS iPhone 4 iPhone 4S 16 iPhone 4S 32 iPhone 4S 64 Apple TV iPod Touch 8 iPad 2 16 Wifi iPad 2 32 Wifi iPad 2 64 Wifi MB Air 11: MB Pro 13 Mac mini iMac 21
provide the retail prices (preferably from an online store) and the local VAT or duty that is expected for electronic products (enter data here.) You can provide the prices in local currency. We can then try to put a global picture together and understand what affects price differences across borders[2][3].
Update: You can view and enter data in the spreadsheet here.
Notes:
There are minor differences like power adapters but they are not materially more expensive to produce.
Imagine it's late 2005. Apple's fiscal year just ended and they reported their performance. You're an analyst whose job includes forecasting the company's performance for next year. This is a weighty responsibility. Your forecast will be blended with those of your peers and used as a "consensus" average. That consensus for the next year will be used to measure the current value of the shares in a ratio called the forward PEG or Price/Earnings/annual earnings Growth. You are supplying the earnings and hence growth forecast while the market offers a price. As a stock is meant to measure future earnings, your forecast is a crucial and frequently cited figure about whether a stock is priced fairly.
There is some comfort in knowing that there will be many others who will offer such a forecast and your contribution is thus not the only way investors can calibrate the price. However, you should think hard about what you are predicting as it also will reflect your skill in predicting such a visible company.
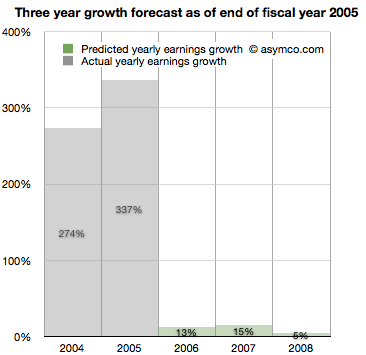
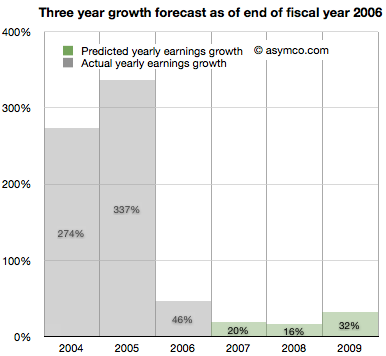
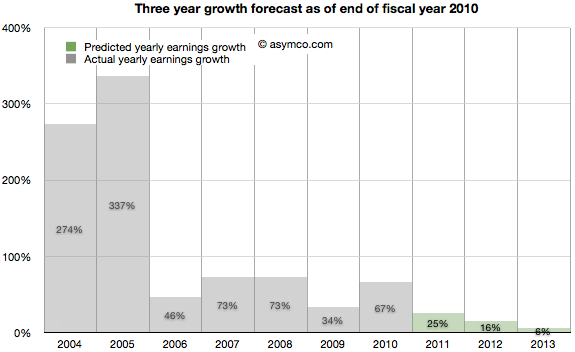
Apple just had a tremendous two years. 2004 and 2005 saw EPS grow at 274% and 337%. This is largely due to the runaway hit iPod. Given all that is known about the company, what will you put forward? While you're at it can you also forecast two years forward, namely provide a growth forecast for 2006, 2007 and 2008?
Here is what you and your cohorts publish as a consensus:
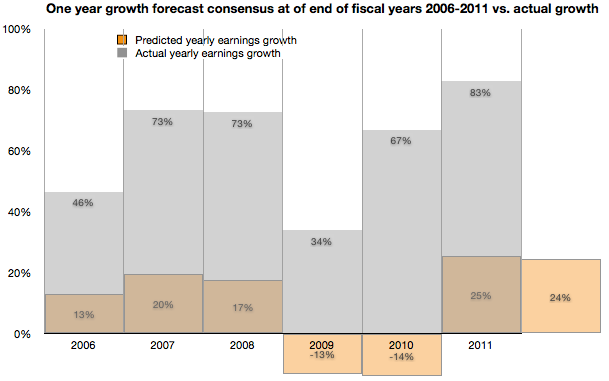
You go with a 13% growth for 2006, 15% for 2007 and 5% for 2008. The chances are, you reason, that the iPod will not carry the company's growth much longer. The competition is sprouting all over and Microsoft is rumored to be launching its own music player.
It makes sense to be conservative and offer a modest growth of 13%. At the same time you can rate the stock a buy as it is still growing. The stock just doubled in the last 12 months and the law of large numbers says that growth cannot last at the same rate as we've just seen.
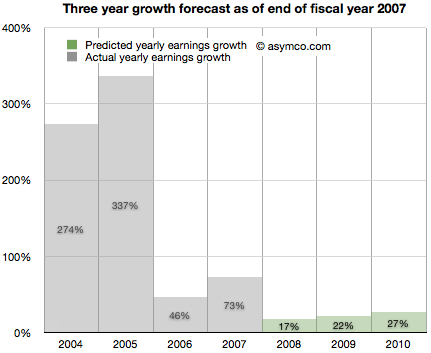
It's now late 2006. Apple just closed out another big year. Contrary to your forecast last year, the company grew at a rate of 46%, more than three times faster than you expected.
It turns out the iPod still has some legs and the company's Mac business seems to be growing. Looking forward you take your 15% growth for 2007 and increase it to 20% and suggest 16% for 2008 and 32% for 2009.
There are rumors of Apple getting into the phone business.
It's now late 2007. Apple just launched the iPhone and even though it was available in limited numbers on one carrier for one full quarter, the company still turned in an amazing 73%. Again more than three times faster growth than you forecast. What do you do about 2008?
It might make sense to increase the previous 16% estimate to 17% but since there is a real estate bubble brewing, the 32% growth for 2009 should come down to 22% and defer that growth out to 2010, dialing in 27%.
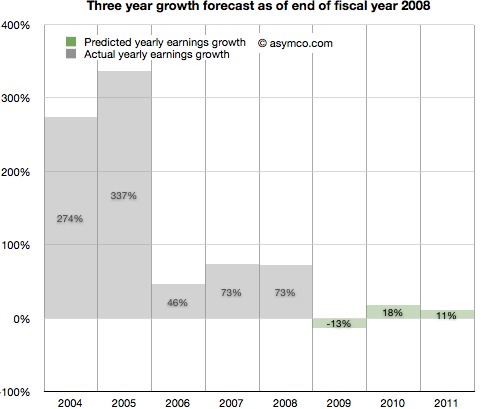
It's now late 2008. Apple closed out another huge year. 73% growth was once again more than triple your forecast of 17% growth. It's clear that the iPhone is a huge hit.
However, there is a credit crunch and talk of a huge recession, even depression looming. Apple is a luxury/premium brand and it is unlikely that those expensive products will sell well into these "macro headwinds". You predict a decline in the earnings of 13% in 2009, inline with many other tech stocks. You are optimistic however that 2010 will be a year of recovery and predict 18% increase from recession lows followed by a more reasonable 11% growth in 2011.
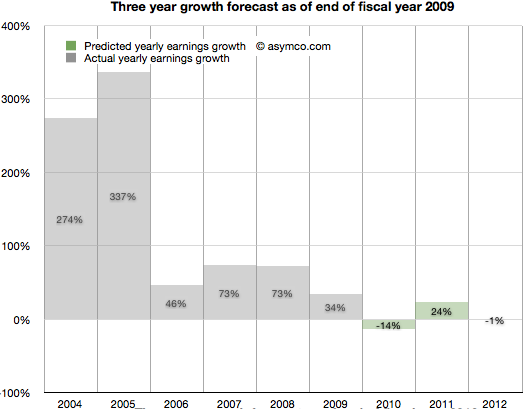
It's now late 2009. To everyone's surprise, Apple grew through the credit crisis. It turned in 34% growth (vs. your predicted 13% decline). The success is hard to believe but the iPhone had a lot to do with that. There are new competitors coming and the recession has proven resilient. With unemployment still high you predict 2010 will still be a tough year. You go with -14% growth for 2010 and postpone recovery out to 2011 with 24% "bounce". Longer term you see 2012 as a flat year, with Apple earnings shrinking slightly by 1%.
2010 ends with Apple achieving 67% growth. Shocking relative to a -14% growth forecast. But then again, Apple launched the iPad and who could have thought that was a hit? Apple achieved growth throughout the recession and it looks like it might keep going. Your 2011 forecast of 24% looks weak so you increase it to 25%. The 2012 decline thesis is abandoned in favor of 16% growth and, given the likely competition in smartphones, you tone down growth in 2013 to 6%.
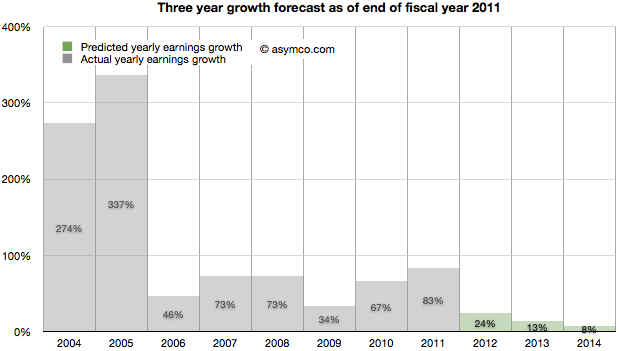
It's November 2011. The company turned in 83% growth. It's more than three times faster than your forecast. Some people are suggesting that Apple may have a lot of headroom with the iPhone and iPad but the law of large numbers is what it is. The company became the largest by market cap in the world and Android is gaining huge market share. However, in deference to their strong recent performance you increase the 2012 forecast from 16% growth to 24% growth. 2013 goes from 6% to more than double: 13% and 2014 is when growth begins to slacken, though still a healthy 8%.
As the following chart shows, look ahead one year accuracy has not been all that great, but you are at least consistent. In any case, everything you based your decisions on showed remarkable consistency with consensus. You're just reflecting common sense.
Note:
Though the numbers are all real, the narrative is fictitious. I suspect however that the truth is actually stranger than this fiction.
Guessing the next Apple product has become the parlor game of choice for a whole generation of technology journalists and analysts. The premise of the game is that given a track record of breakthrough products, there is always another one just around the corner. Being the one to predict this next breakthrough product creates credibility and demonstrates the domain knowledge of the predictor. If the prediction fails to materialize there is consolation in dismissing the actual announced product as disappointing, unsophisticated or, worst of all, uninteresting.
Most often, these guesses are as much a reflection of the analyst as they are an analysis of the company. Too many predictions are designed to impress or demonstrate the imagination or knowledge of the predictor. They typically anticipate a giant leap of functionality, power or market re-structuring. They envision revolution not evolution; a cutting of the Gordian knot not a polishing of ugly rocks.
Yet nearly all of Apple's launches have been sustaining improvements in existing products, technologies or platforms. To name just a few:
The iPad is an evolution of the iPod touch
The iPod touch is an evolution of the iPhone
The iPhone uses OS X and Objective C from the Mac
OS X came from NeXT
The app store market model came out of the iTunes store
The iTunes store came from iTunes which came first to the Mac as a media sync tool for the iPod
etc.
John Gruber explained the process last spring as it relates to many of Apple's launches. Although the iPhone did introduce a new user input method and experience that takes consumption in a new direction, its building blocks were there for all to see for many years. The iPhone is a natural evolution of the computer with a handy little "Phone" app.
Likewise, the iPod came seemingly out of nowhere but by watching the original launch you see it as part of a "media hub" strategy that envisions the Mac as a personal server. The very products which ended up disrupting the Mac/PC began as extensions of their victims.
You can trace the DNA of almost all of Apple's products to previous products. If Apple did not have these foundations, the slow-motion revolutions would not have happened. Rather than a deliberate big bang, Apple's disruptions are the result of a discovery process. A test, iterate and improve loop. This is why they seem obvious after the launch but also why they seem to be such an anti-climax.
Therefore, the challenge of predicting Apple's next product should be tackled not only through an act of imagination but by carefully projecting the current products and understanding where they can evolve.
So it is that I approach the question of Apple's TV disruption. My working assumption about the next Apple TV is that it already exists. It's none other than the existing Apple TV, improved.
Here are the clues or hints I noted:
It uses iOS and the hardware from the devices that run it. It originally ran a PC architecture and shared a kernel with Macs.
It has been integrated with iTunes media stores (with the notable exception of the iTunes app store)
It has begun to introduce channels other than downloads (ESPN, Wall Street Journal) thus establishing its own distribution for traditional content
It is a global product, depending only on the Internet protocols and independent of the balkanized cable standards
Through AirPlay it is integrated with Macs and Apple devices.
Through display mirroring, iOS devices can use the TV as an external monitor and can even change their own behavior when doing so
This last point is intriguing. I have not seen discussion of this feature, but if using an iPad 2 or iPhone 4S with iOS 5 and an Apple TV with the latest software updates it's possible to have an iOS device become a controller for TV-based game experiences. Developers are already using the API. When using a pinball game with screen mirroring, the device becomes a controller while the action takes place on the big screen. Switching display mirroring off bring the action and control back onto the small screen. There are still problems with lag and the processors are over-taxed on high frame rates, but the APIs are already there for developers. (I could also mention the potential of new a Bluetooth standard for better wireless response).
What these signals point to is Apple defining the TV as an iOS portfolio product. This means integration with iTunes, including an app store. This, in turn, means unleashing developer/creative talent through new monetization opportunities. This means new user experiences in discovery. This means FaceTime-like communication through the TV. This means many other things but mostly it means that the TV will be a platform product.
The only challenge is a (currently lacking) smooth interface. Perhaps that's where voice comes into the picture. But whether that is built-in at the next rev of the product or not is not the story. The story is going to be the sustaining improvement in the original Apple TV. A wonderfully asymmetric product begging to be ignored. A product that because of its apparent lack of success, effectively hides all its secrets in plain sight.
As the chart below shows, the last quarter (third calendar, fourth fiscal 2011) was slow with only 52% earnings growth. The discussion centered on the (surprisingly) disruptive effect of the iPhone transition. Surprising since most analysts, myself included, were lulled into thinking that the portfolio of iPhones and their wider distribution would create a smoother sales pattern vis-a-vis the more cyclical pattern seen in the first three years of production.
The second quarter was surprisingly strong and the third was surprisingly weak. So how do we estimate the fourth?
We have the pent-up demand for the new iPhone, we have the dynamics of holiday spending and we have a question mark on pattern of growth for the iPad. I'll discuss each assumption in turn:
The first assumption remains that iPhone growth is approximately 100% for the full year. Last calendar year there were 47.5 million iPhones sold. A 100% growth would imply about 95 million for this year. So far 56 million were sold. To reach a doubling then 39 million would need to ship in Q4.
Another approach is to look at quarterly growth rates. Thus far, we've had 113%, 142% and 21% for the first three quarters. To reach an average of 100% for the year then the fourth quarter would need about 120% or 36 million units.
36 to 39 million would be a good bounding range if there were no other mitigating factors. The information published so far shows no particular problems with either production or access to markets so I'm going to go with 35.7 million.
The second major assumption relates to the iPad. The iPad has been a challenge to predict since launch. Not only is it a new category but it comes with a different launch cycle than the iPhone and has significant constraints on production. There have been only two quarters where we could measure y/y growth: 182.8% in Q2 and 165.6% in Q3. I was initially tempted to dial in 150% for Q4 but the question of transition comes up. The first iPad model grew well into the holiday quarter but dropped dramatically into the first as it went through the transition to the iPad 2.
Are we going to see the transition effect earlier this year? I'm being cautious and suggesting only 100% iPad growth or 14.6 million units this quarter. This is still a very challenging product to forecast.
So here are my fourth calendar quarter forecasts (with y/y growth in parentheses):
iPhone units: 35.7 million (120%)
Macs: 5.2 million (27%)
iPads: 14.7 million (100%)
iPods: 13.6 million (-30%)
Music (incl. app) rev. growth: 22%
Peripherals rev. growth: 25%
Software rev. growth: 25%
Total revenues: $44.6 billion (growth: 67%)
GM: 42.0%
EPS: $12.3 (91%)
This earnings value would imply a trailing twelve months' EPS of about 33.5. At $390/share the P/E would be 11.6. Cash and equivalents may increase to $90 billion.