Asymco

Asymmetric Intelligence

iPad

  1. How we do all this will never be the same

    Research · 36 comments

    In a new ad for the iPad Apple once again makes the case that the tablet is a good substitute for a PC in a number of use cases (and permits some new ones.)

    We'll never stop sharing our memories. Or getting lost in a good book. We'll always cook dinner and cheer for our favorite team. We'll still go to meetings, make home movies, and learn new things. But how we do all this will never be the same.

    This belief that the iPad "cannibalizes" the PC is a powerful concept. The growth of the PC has certainly been affected. But has the Mac's growth also been affected?

    Tim Cook seems to think so. In the earnings call he said:

    In terms of cannibalization, we do believe that some customers chose to purchase an iPad instead of the new Mac during the quarter, but we also believe that even more customers chose to purchase an iPad over Windows PC. And as I've said before, there's a lot more of the Windows PC business to cannibalize than the Mac.

    If we look at the behavior of Mac vs. iPad, the following chart may be useful:
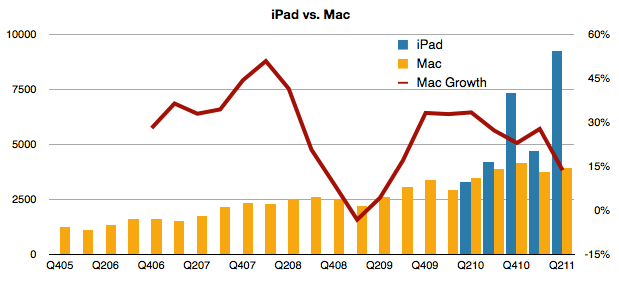
    First off, we can observe that since introduction, iPad has always sold more units than the Mac. Now it's selling more than twice as many units and the revenue from those units is higher than those of the Mac. The other line to look at is the growth (y/y). During the time that the iPad has been shipping, the Mac growth has been declining.

    Yes, it's still growing at five times the rate of the PC market (and 7.5 times the rate of Windows only PCs), but the iPad phenomenon is indeed affecting the Mac.

    With the launch of Lion, Apple is clearly showing that there is dramatic improvement potential in traditional personal computing. But increasingly the improvements are "borrowed" from touch interfaces. Clearly, as the ad implies, computing will never be the same again.
  2. How did I get the iPhone number so wrong?

    Research · 64 comments

    Here were my predictions for the third fiscal (second calendar) quarter from April 25th.

    Estimates for Apple’s third fiscal quarter (ending June) | asymco

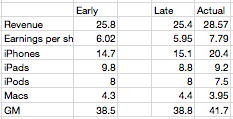
    Later in the quarter I updated them for submission to Philip Elmer-Dewitt's blog at Fortune. The original and updated figures are shown in the following table (with actuals).

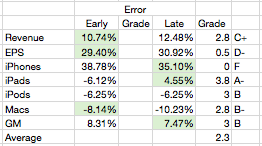
    The changes were not significant except in a reduction of iPads. Three items were better in the early call and three were better in the late with one item equal. Using a simple method for scoring the results I gave myself the following report card:


    As the Revenue and EPS figures are dependent on the other line items, the most significant error is clearly the iPhone where the error was over 30% (and hence deserves an F). The other figures were not very close either  so the overall grade point average is a very mediocre C (2.3).

    So, as in previous quarters, nailing the iPhone number is everything. Having failed to guess correctly, the whole performance fell apart.

    So how did I manage to get the iPhone number so wrong?

    My forecasts depend on a few theories:

    1. Overall production capacity is increasing at approximately 100%/yr.
    2. There is significant seasonality due to production ramps as the product is updated on a yearly cycle. These cycles are tuned to reach maximum throughput during the US holiday period. I discussed this theory here.
    3. Demand is practically unlimited and is throttled by both production schedule and distribution agreements

    I successfully applied these theories to the iPhone for over three years and it has always yielded very good (above average at least) results. However, when we reach a point of failure we need forensically consider where the theories failed.

    What I suspect happened is that the second theory no longer holds. What I expected was that as the iPhone 4 was reaching the end of its cycle, growth would moderate (as it did last year with the 3GS and we ended up with 61% growth into the last quarter). The reason growth would moderate was that Apple slowed production of the old model in order to switch out to the new model--we saw the same thing happen with the slowdown in iPad 1 and transition to iPad 2.

    Instead, what Apple did this year was open the taps on production of the iPhone 4 as it extended its lifetime beyond the traditional 12 months. In other words, the pipeline was not "drained" ahead of a new ramp. Distribution was also boosted with a burst of new operator deals which actually enlarged the pipeline.

    So we are witnessing a pivotal moment in the product's strategy. By slightly lifting off the gas in terms of product cycle, Apple actually set the iPhone loose. The imposition of a yearly cycle on the product coupled with unlimited demand caused it to be artificially constrained.

    So I can only reach a conclusion dripping with irony: by stepping off the gas the product actually accelerated.

    This phenomenon will allow the company to unleash a wave of unprecedented growth which might claim another theory as victim. Namely, is the limit of 100% growth about to be breached?

    ----

    Footnote:

    A theory approach to forecasting means that you have to stay true to the theory even if there is anecdotal evidence that may suggest you are wrong. If you bend to the anecdotes then you will not learn from failure. If you stick with the theory and ask where it went wrong, you will build a better theory.

  3. A new way to value Apple

    Research · 38 comments

    Almost all valuation models for Apple assume it's a hardware company. The modeling algorithm for hardware is simple:

    • For each year in near future
    • For each product line
    • Compute contribution
    • Determine company value by summing contributions and multiplying by a P/E ratio

    The major difficulty is in predicting the growth of each product line. This is difficult because buyers can be fickle. Companies employs all sorts of tools in order to secure repeat customers but if switching costs are low, the company can crash in value. For this reason, analysts pick various ways to predict device  sales. Some choose to index each product on production (channel checks), demand (customer surveys,)  or even on a top-down share of total (market research on growth of whole market and assumptions of share).

    Although simple and convenient, this model does not probably match the way Apple is managed. The company does not build hardware products to sell and forget. It builds platforms which are best seen as sources of recurring revenues. Users are incentivized to continue buying devices. iCloud, iTunes and other Apple properties are expressly designed to that goal--and they are not cheap to run. So, the company must see the world through a different set of lenses than the default model shown above.

    To think about the business like they do, we need to put the data through a similar set of lenses. I began with a modest proposal last month to value each user as a source of recurring revenue. Now it's time to expand on this method.

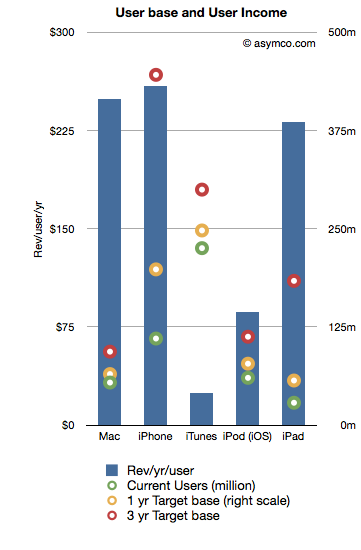
    The following chart shows the recurring revenues per user by product and the current and possible future size of user bases.[2]

    Revenues/yr/user are bars with the left axis and the User bases are various colored circles indexed with the right axis.

    The assumptions that went into the data are as follows:

    1. Device life span is as per previous article linked above
    2. User base growth for 1 year is: Mac 20%, iPhone 80%, iTunes 10%, iPod 30%, iPad 100%
    3. User base growth for 2nd and 3rd years (recurring): Mac 20%, iPhone 50%, iTunes 10%, iPod 20%, iPad 80%.
    4. The Revenue per user is assumed constant

    Note that the user base growth figures are lower than the product growth levels seen historically. Obviously, the model is highly sensitive to these growth assumptions so they need to be scrutinized and tested rigorously.

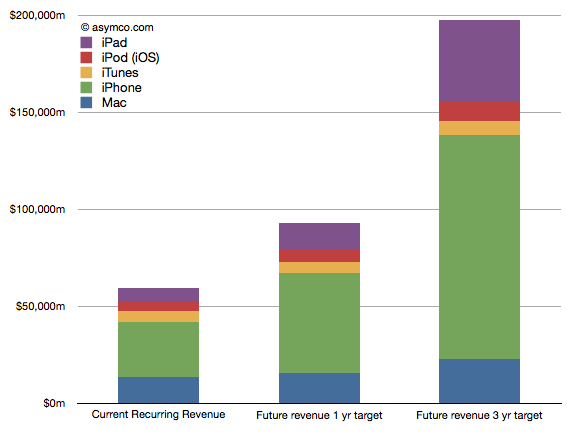
    Nevertheless, as a straw-man proposal,  the recurring revenues for all these products[1] is shown in the following chart:

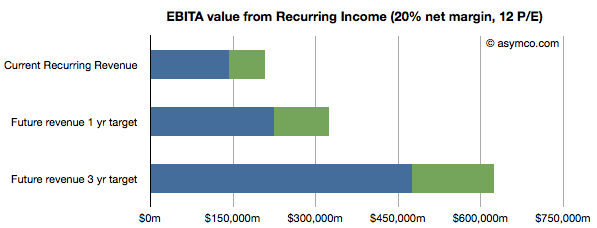
    Once the income is estimated, we can take that value and assume a profit margin (net) and then multiply the earnings by a multiple. Using a 20% net margin and 12x P/E yields the following chart.

    (I added an assumed level of cash in green.)

    This model would imply that the company today could be valued at $208 billion on the basis of its installed base alone. That value would be about $323 billion in one year and $620 billion in three years. Dividing by the number of shares outstanding (935m this year increasing at 2% a year) yields a share price of $222, $339 and $629 by mid 2014.

    These values can be considered "lower bounds" on valuation since they assume income from previously secured customers. The speculative part of investment would be based on what the future bases will look like (so, for example, if one believes these assumptions, the $629 figure could be considered a target to be discounted to today).

    ---

    Notes:

    1. Excludes Software, Peripherals, non-iOS devices, and any other service revenue.
    2. Compare this char to social media companies (MIT Technology Review)
  4. Is the tablet computer a new PC or post-PC?

    Research · 60 comments

    Steve Ballmer stated and Andy Lees confirmed that Microsoft views iPad and other tablets as "just PCs". From a market measurement point of view Canalys agrees. IDC and Gartner don't, calling the new devices "media tablets."

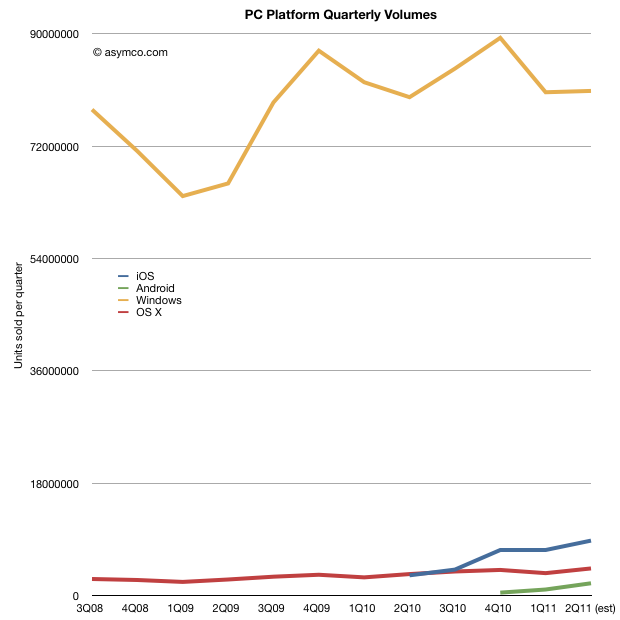
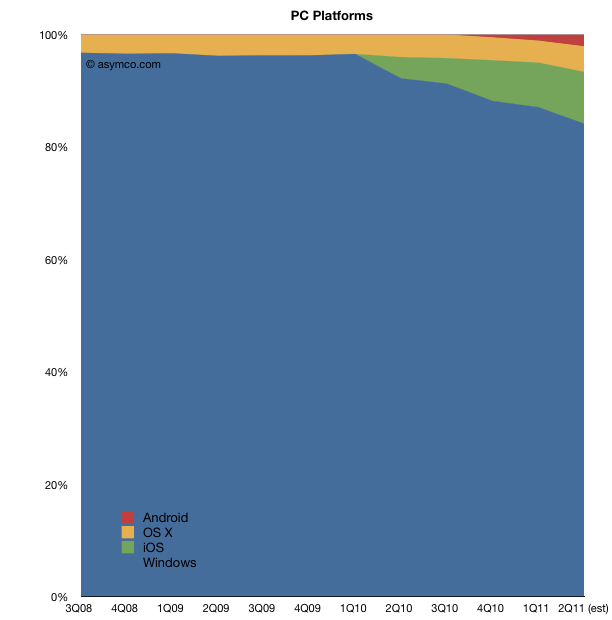
    Before deciding whether tablets belong with PCs in market metrics, it would be interesting to look at what the data shows. When seen as a combined market, the focus should be on platforms. The following chart shows the four main PC+tablet platform volumes since late 2008 [1].

    The second chart shows the same data as share of total market:

    This comparison allows for some fresh observations:

    1. Excluding iPads, Apple is very close to being 5th largest global PC vendor. Global share likely to be above 5%. Including iPads, Apple would be 2nd.
    2. Platform year-on-year growth was Windows: +1.3%, OS X: +26%, iOS: +170%. Android growth cannot yet be measured since Android tablets have not been on the market for more than 1 year.
    3. In Q2 2011 one million more Windows PCs were sold than in Q2 2010. In same time, 903k more OS X PCs and 5.5 million more iPads.
    4. Excluding tablets, nearly 50% of the global PC growth was due to the Mac. Including iPad, Apple was responsible for ~70% of the growth in the PC market in Q2.

    The picture that emerges is that while Windows continues to be dominant with 84% of units sold in the last quarter, the growth belongs to tablets which captured about 90% of it. If Windows remains marginal on tablets, the "PC market" will likely tip away from Microsoft in two years (depending on how quickly Apple can build iPads.)

    Microsoft is making the commitment to move Windows to a tablet form factor but they are doing it while retaining the user interaction model of a desktop. This may or may not work but they are also conceding that a separate experience is also necessary. By rejecting the notion that a mobile OS alone can do the job, they are essentially building a "hybrid" tablet/laptop/desktop product which may be challenging to use but preserve their presence in the form factor.

    Whether Microsoft succeeds or not will depend on whether the new form factor is disruptive in more than user experience. In other words whether this is just a "new PC" or a "post-PC". The argument comes down to business model changes. For example the new model comes with different cycle time of product development (deep, integrated, yearly changes), different ecosystem (apps), different cost structures (high R&D in hardware), vast scale (device economics, components, ramps), and potentially new distribution (operators in the channel mix.)

    Summed up, the real challenge for Microsoft is whether they can keep their business model (selling OS licenses to hardware vendors) as PCs become more device-like. Not only is iOS setting the benchmark for performance but Android is potentially ready to take share if the market turns slightly more modular. Microsoft's differentiation looks to be primarily its legacy of PC software.

    It may also seem that much remains to be discovered in this market but I think the main bets have already been made. The PC market as we know it is in the end game.

    ---

    Notes:

    1. I used Gartner data for overall world-wide PC market and merged it with Mac and iPad data from Apple. Android data is estimated.
  5. iPhone liquidity: Why an unlocked Phone in the US matters

    Research · 93 comments

    The iPhone is now available in the US unlocked. Judging by the lack of reaction to the news, one would assume that this is not a significant event. I would argue however that it's a very significant event.

    What is unappreciated is that the iPhone is a very restricted product. Unlike any of Apple's other products (iPod, Mac and iPad), the iPhone is designed to be hard to get. Apple did not make it easy in the one dimension of ease that matters most: its purchase.

    Consider that many people in the world cannot buy an iPhone because it's not available locally. In case it is, in most cases you need to sign a contract and commit to a long-term relationship with a company other than Apple. In those cases where you don't sign a contract, you cannot use it with a service provider other than the one (arbitrarily) chosen for you.

    A few have been able to buy iPhones unlocked if they lived in a few countries (UK, France, Australia, Belgium, Hong Kong[1]) but those phones could only be purchased online if sent to a local address or in an Apple retail store--of which there are not many.

    Consider that in Europe alone, the following countries do not have iPhone distribution: Albania, Armenia, Azerbaijan, Belarus, Bosnia, Georgia, Iceland, Kazakhstan, Serbia and Ukraine. The populations total over 100 million people. In Asia the number of countries without iPhone distribution outnumber those with distribution. Add in Africa, Latin America and the Middle East and the unaddressed market begins to look very large.

    If you contrast this with every other phone platform out there, Blackberry, Android or Symbian, the iPhone is extremely restricted and the number of people that are permitted to buy it much more limited. The number of operators supporting Blackberry outnumber the iPhone at least by a ratio of two to one.

    Then there is the matter of distributors. This is a channel that iPhone does not leverage. Distributors account for more than half of Nokia's volumes. They buy in bulk and resell (sometimes illegally or in violation of contracts) vast quantities of phones.

    By offering unlocked iPhones in the US, the restriction on distribution is lifted to a large degree. What's different is that these phones can be purchased in 200+ retail locations. Many of these locations are in tourist hubs where there are large diaspora communities rotating continuously back to home countries. iPhones can now be purchased with cash and become as good as cash.

    And this is not a new phenomenon. When the original iPhone was available, Apple had to restrict buyers to 5 per person and stopped accepting cash because of the huge grey market demand. The same thing happened with the original iPad and with iPad 2 lines are still forming for it because distribution is so restricted. Consider also that sales in Verizon stores pale in comparison with those for GSM products.

    The way to think about it is that the iPhone has just become more "liquid" and it can now flow to parts of the world where it has been difficult to acquire. The iPhone was already liquid to some degree with unlocking and sales through Hong Kong/UK, but the US market's retail footprint and the lower costs that result will boost liquidity dramatically and probably increase volumes substantially.

    ---

    Note:

    1. According to Apple, the following 27 countries offer phones which are not "locked to carrier" : Belgium, Czech Republic, Finland, Germany, Greece, Italy, Luxembourg, Russia, Slovakia, Turkey, Hong Kong, India, Indonesia, South Korea, Macau, Malaysia, New Zealand, Singapore, Taiwan, Thailand, Vietnam, Bahrain, Kuwait, Qatar, Saudi Arabia, United Arab Emirates, South Africa
  6. Feature Tablets

    Research · 48 comments

    Andrian Georgiev, a reporter from the Bulgarian business newspaper "Capital weekly" wrote an article for which he asked me some questions. My answers are below. The article is available here (Bulgarian).
    Q: How many tablets will be sold worldwide this year and in 2012?
    A: We can only guess the answer. The total will be constrained by parts shortages for 2011, but my estimate [through the end of 2012] is over 100 million. Perhaps even 120 million is possible.

    Q: Do you think Amazon is working on a tablet? Could it be a game-changer?
    A: If Amazon (or Facebook or Baidu) were to build a tablet the greatest innovation will be in their business models. In other words how they make money. I suspect Amazon's hardware will be free or nearly free but users will be incentivized to buy content or other goods from Amazon. Similarly for other businesses that will take a hardware product and make it an accessory to their core business. In that regard the "game will change" because hardware will conform to "the application" above it. In other words, that the device will be an accessory to the service, not the other way around.

    Q: Why is it so hard for manufacturers to create a tablet that rivals iPad?
    A: The iPad is a collection of components. Some are easy to duplicate or to source. This includes memory, microprocessors, communications components. Other components are harder to find and may be expensive once found. This includes the right kind of batteries and the screen. Yet other components are impossible to find or duplicate. That includes software.

    --

    Some additional thoughts:

    The changing of the game may not happen for some time. "Feature tablets" (analogous to feature phones) will however be viable as niche businesses quite soon. I believe "conforming" operating systems will be more popular with tablet makers than with phone makers.

  7. The iPad slowdown and impact from the Japanese disaster

    Research · 41 comments

    Tim Cook explains that there was no material impact from the Japanese disaster:

    "Regarding our global supply chain, as a result of outstanding teamwork and unprecedented resilience of our partners, we did not have any supply or cost impact in our fiscal Q2 as a result of the tragedy, and we currently do not anticipate any material supply or cost impact in our fiscal Q3. To provide a bit more color on this, we sourced hundreds, literally hundreds of items from Japan, and they range from components such as LCDs, optical drives, NAND Flash and DRAM to base materials such as resins, coatings and foil that are part of the production process at several layers back in the supply chain. The earthquake and subsequent tsunami and the associated nuclear crisis caused disruption for many of these suppliers, and many unaffected suppliers have been impacted by power interruptions.

    But since the disaster, Apple employees have literally been working around the clock with our supplier partners in Japan, and have been able to implement a number of contingency plans. Our preference from the beginning of this tragedy has been to remain with our long-term partners in Japan. And I have to say, they have displayed an incredible resilience that I personally never seen before in the aftermath of this disaster. So while we do not anticipate -- currently anticipate any material impact to our component supply or cost in our fiscal Q3, we do need to caution everyone that the situation remains unpredictable"

    via Apple Management Discusses Q2 2011 Results - Earnings Call Transcript - Seeking Alpha.

    Still, the message did not get through to everyone:

    However, the supply chain impact on Apple from Japan’s earthquake, tsunami and nuclear power crisis is the culprit behind the only product line that came in below expectations – iPad. Apple sold 4.7 million units of iPad, vs. analysts’ expectation of 6 million.

    The Rise and Rise of Apple: Time For A Split? - Seeking Alpha

    The shortfall in iPad units was explained by Tim Cook as ramp-up challenges:

    "Let me mention a few things for you to consider, Toni. First off, product transitions are never simple. And as you can probably appreciate, we are in a position that we have to call them for many, many weeks in advance in terms of how many of the current product we want to produce and the dates at which we will announce the new product. We drew the channel down on the current product or the original iPad, I should say, by 570,000 units during the quarter. And we added at the end of the quarter 170,000 of the new iPad 2s although most of that was in transit at the end of the quarter. And so the net reduction was 400,000. And so our sell-through was above 5 million for the quarter. And again, this has to be planned quite a ways in the future. I think the key point here is --

    [also the dates, just to remind you, we set out an invitation to the event toward the end of February. We had the event in early March. We placed the unit on sale in the United States on March 11 and our quarter ended about 2 weeks thereafter. And so there was some expectation of a new product, and we would have obviously factored that into our thinking about the product transition as we plan the number of the original unit to build.]

    And so I think the key point here is that I'm extremely pleased with the progress that we were making on the manufacturing ramp. We have gotten off to a materially better start and produced a lot more units than we did on the original ramp of the first iPad. And when we're so confident with our ability to supply that we've already put on 25 additional countries at the end of March, and we'll be placing on 13 more next week and we'll do even more as we stepped through the quarter."

  8. Estimates for Apple's third fiscal quarter (ending June)

    Research · 42 comments

    Apple's CFO guidance statement:

    We expect revenue to be about $23 billion compared to $15.7 billion in the June quarter last year. We expect gross margin to be about 38%, reflecting approximately $55 million related to stock-based compensation expense. We expect OpEx to be about $2.5 billion, including about $255 million related to stock-based compensation expense. We expect OI&E to be about $70 million and we expect the tax rate to be about 25%. We are targeting EPS of about $5.03.

    Apple Management Discusses Q2 2011 Results - Earnings Call Transcript - Seeking Alpha

    Last quarter Apple guided revenue growth at an aggressive 63% with an EPS growth of 47%. They delivered 83% and 93% respectively.

    They are now guiding about 47% revenue growth and 43% EPS growth and my current estimates are 65% and 72% respectively based on the following:

    • iPhone units: 14.7 million (75%)
    • Macs: 4.3 million (25%)
    • iPads: 9.8 million (200%)
    • iPods: 8.0 million (-15%)
    • Music (incl. app) rev. growth: 25%
    • Peripherals rev. growth: 25%
    • Software rev. growth: 25%
    • Total sales: $25.8 billion (65%)
    • GM: 38.5%
    • EPS: $6.02 (72%)

    The biggest uncertainty remains iPad growth. This will be the first quarter where we can dial in a y/y growth rate. I'm being bullish with 200% because I believe the ramp for the iPad 2 may get sorted out. There are also more countries being opened up this quarter (13 this week).

    Apple's stock price to earnings ratio has dropped to 16.72. Ex-cash it's 13.5. On a forward basis (my estimates) it's 8.3. Apple's valuation is now a case for business historians to discuss because I don't think there are modern precedents.


  9. Apple Earnings: Evaluating my performance

    Research · 24 comments

    As chronicled here, this quarter I went through three sets of estimates. This is a departure from my standard practice of sticking with one forecast made three months in advance. I felt last quarter was filled with materially important developments which deserved updating.

    So how did I do?

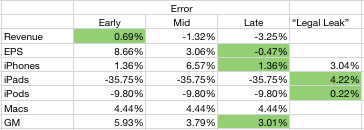
    I wanted to see if the additional information helped or hindered predictability so I put my three predictions side-by-side and measured the errors. I also added the "legal leak" from April 15th (published April 19th) to see whether it was an accurate predictor. The table below shows the error rates with the lowest error highlighted.

    It's clear that my error rate decreased as new information was used. It's also clear that the "legal leak" was very accurate. What follows is a discussion of each line item.

    The iPhone forecast was very accurate both early and late in the quarter. At 1.36% error it was even lower than what was leaked by Apple. I used the information about China and Verizon to boost sell-in and increased the growth rate to 110%. That proved to be the right call. I did not pay any attention to talk of component shortages as I did not consider them to affect Apple whose market share of devices is so low. I would score my "late" estimate as an "A".

    Even though I disclaimed it, my iPad forecast was very inaccurate. In contrast, the leak was very accurate. Although mitigated by the higher sell-through (5.1 million) shipments were constrained by the change in product. Details like the date of shipment, the date of announcement and the ramps made this a particularly difficult transition to predict. At 36% error, I score it as an "F".

    The iPod error was about 10%. That's mediocre. The product dropped in sales by 17% (vs. 10% expected). Again, the mitigating factors, like higher mix of iPod touch and thus increased prices helped to keep the financial performance decent. I score this as a B-.

    The Mac prediction was accurate. The error was less than 5%. I will discuss the Mac business in a separate posting but it suffices to say that the growth was excellent but predictable. I score my prediction as an "A-".

    Revenues were reasonably predictable however pricing seems to have been affected by exchange rate volatility. The iPhone turned out to have a huge average selling price ($660) which made up for the lower revenues from iPad. The error of 3.25% is acceptable. I score it as an "A".

    The Earnings number was very accurate. The error for the late estimate was less than one half of one percent. This bottom line number is a function of all the other numbers so it's the most encompassing. You have to account for factors like interest income, changes in the number of outstanding shares and tax rates. None of these are predictable. However, I was lucky. With an error below 1%, I rate this as an "A+".

    My overall performance as a grade point average would be 3.43 or B.

  10. Review of Apple's unit numbers released in legal filing prior to earnings

    Podcast · 48 comments

    Thanks to Nilay Patel at This is My Next for posting the complaint filed on April 15th against Samsung by Apple which revealed some potentially material data about its performance in the last quarter (which won't be public until the 20th).

    On page 4:

    "As of March 2011, more than 108 million iPhones had been sold worldwide"
    "By March 2011, Apple had sold over 60 million (iPod touch) units."

    On page 5:

    "By March 2011, Apple sold over 19 million iPads".

    These numbers are material because we know units sold prior to CQ1 and can derive the minimum units sold for these three product lines during Q1.

    Namely:

    • Total iPhones sold before Q1: 89,971,000 implying a minimum of 18.1 million sold during the quarter (my estimate is 18.4)
    • Total iPod touch sold before Q1 (estimated): 55.5 million implying a minimum of 4.5 million iPod touch sold during the quarter (my estimate 5 million)
    • Total iPads sold before Q1: 14,789,000 implying a minimum of 4.2 million iPads sold during the quarter (my estimate is 7.3 million).

    The only outlier in terms of delta to my estimates is the iPad units which has always been the wildcard.

    Apple published lower bound figures but it's a matter of speculation as to how far below actuals they are. Nevertheless, I would treat the iPad numbers with extreme caution.

  11. Revisiting Estimates for Apple’s second quarter earnings (ended March)

    Research · 29 comments

    Estimates for Apple’s second quarter earnings ending March | asymco.

    Since making the original estimates In January,

    • Revenue: $24.5 billion
    • EPS: 5.89
    • iPhone unit sales: 18.4m
    • iPod unit sales: 10m
    • Mac unit sales: 3.6m
    • iPad unit sales: 7.3m
    • Gross margin percentage: 38.8%

    I revised them at the end of March to the following:

    • Revenue: $25 billion
    • EPS: 6.21
    • iPhone unit sales: 17.5m
    • iPod unit sales: 10m
    • Mac unit sales: 3.6m
    • iPad unit sales: 7.3m
    • Gross margin percentage: 39.6%

    In the past I was comfortable keeping untouched estimates made three months in advance. This quarter however there have been several developments during the quarter which were unforeseen and cause me to revisit my estimates.

    1. The Verizon iPhone launch. Observations of the event focused on line lengths and buying activity. However, Apple reports shipments not sell-through. I believe the deal structure was such that Apple obtained a very large order as condition to the relationship. The January and March update analysis did not consider this order size. We have also more data on sales from HTC and RIM and there is no letup in the market's growth. As a result I am revising the growth for the iPhone back up to 110% y/y and 18.4 million units.
    2. Crucially, I'm increasing iPhone ASP to $625 on the basis of this new demand and the likely delay of iPhone 5 launch.
    3. The iPad 2 launch. This product is still too young to see production and sales patterns. However, demand for the second version seems higher than for the first. Distribution is broader too. The unknown is production. I am keeping the unit number at 7.3 million which is the same as the level of CQ4.
    4. China is booming. The Chinese New Year occurred in the quarter and since last year that has meant a sequential increase in device sales for Apple. But it's a double edged-sword. Almost all production activity is shut down during the holiday period. Apple depends on China exclusively for manufacturing so they will certainly be affected. So whereas it's likely that we'll see increased demand from China this year due to even better distribution, macroeconomics and brand value I'm unsure if supply rose to match. Overall, I'm not changing unit growth due to his increased demand but I'm cautioning that there could be downside bias in my estimates.
    5. The tsunami disaster in Japan will affect some demand in Japan and some of the supply chain will be disrupted. However, the effect will be felt more by weaker competitors. It's possible that the event will amplify the shortages that Apple's pre-purchase agreements already created. The consequences are bad news for Apple's competitors but I rate it as neutral for Apple.

    Given these new facts coming to light, I would update my estimates as follows:

    • Revenue: $25.5 billion
    • EPS: 6.43
    • iPhone unit sales: 18.4m
    • iPod unit sales: 10m
    • Mac unit sales: 3.6m
    • iPad unit sales: 7.3m
    • Gross margin percentage: 39.9%

    Resulting EPS growth would thus be 93%.

    For the record, I value my January estimates since they are based on long-term pattern recognition rather than transient events and thus are more useful in forming a market theory.

    However, these transient events cannot be ignored and analysis needs to be informed by both theory and events. I will be watching to see which set of predictions (early, mid or late) will be more accurate.