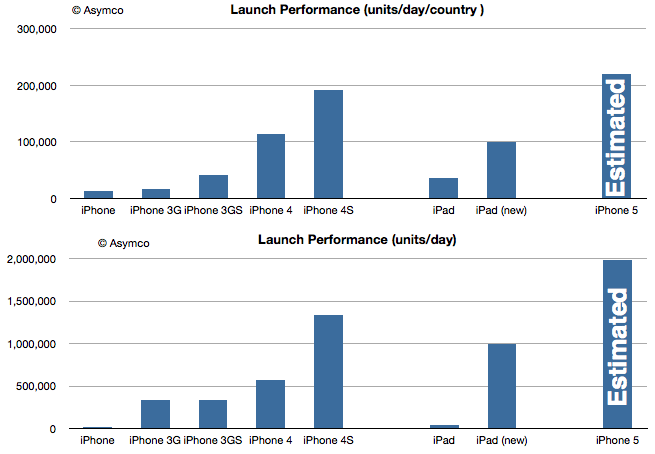
The iPhone 4S sold about 4 million units in the first three days of availability last year. The iPhone 4 sold about 1.7 million and iPhone 3GS about 1 million.
The main driver to growth for the initial weekend is usually upgrades for existing customers. There might be first time buyers, but the dedication required to ensure being first to have it usually means buyers are keen on the brand and are repeat customers.
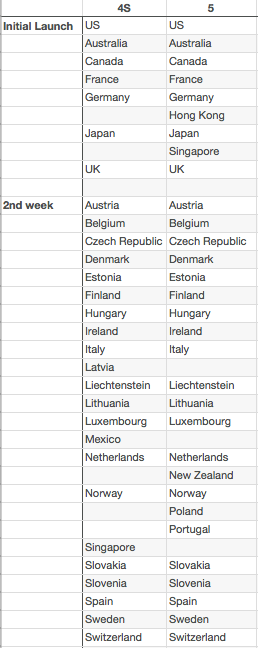
The other factor is the number of countries where the phone is available. The 4 was initially available in 5 countries. The 4S in seven and now the 5 will be in nine countries. I made a list of the differences in launch countries for the 4S and the 5 below:
I've also listed the second week launch countries for completeness and shown which countries have changed.[1]
The performance of the 5 in the first weekend should be better on a volume basis simply because there are more existing customers who wish to upgrade and because there are more initial and significant launch countries.
The 4S launched with an average of 1.3 million units per day but 191k units/day/country. The 4 launched with 113k units/day/country. If we assume that the 5 can capture 220k units/day/country we reach 2 million units/day for this launch footprint and a total of about 6 million units for the launch weekend.
These estimates are shown below relative the the other iPhone and the iPad launches.
The additional shipments to fulfill orders for the second week may see the iPhone 5 sell over 10 million units before the quarter is over.
---
Notes:
Hong Kong and Singapore are noteworthy initial launch additions, Poland a noteworthy second week addition and Mexico a noteworthy second week omission.
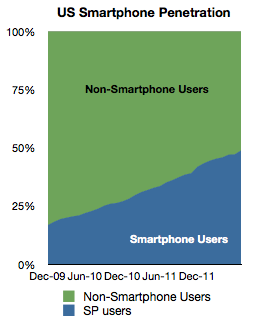
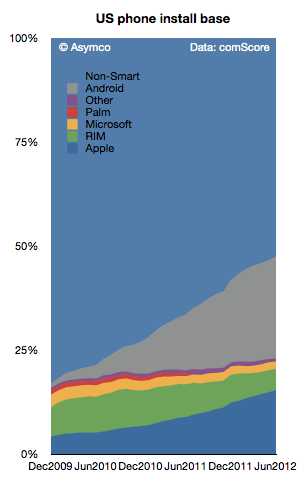
comScore data shows July penetration at 48.8% and a monthly growth in penetration of nearly 2 percentage points. Given the rate of growth, it's nearly certain that we've crossed 50% in August.
The historic growth is shown below:
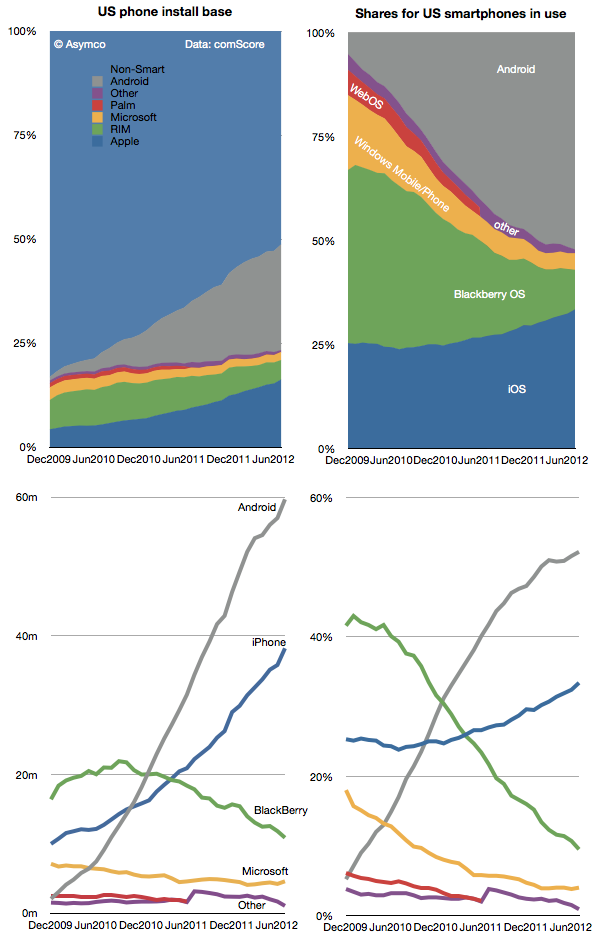
The platforms making up the smartphone market in the US have seen unequal shares of this new population of users. The following diagrams show how the install bases have changed in absolute and share terms.
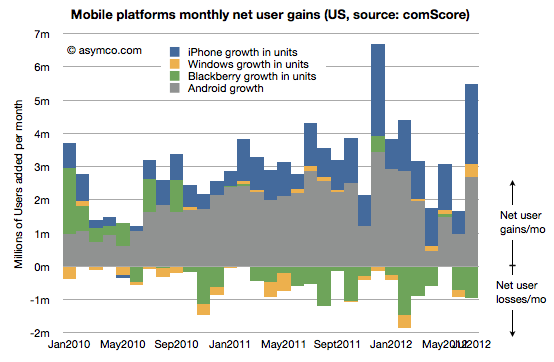
To round out the analysis, here is the net user gains for the platforms showing the net addition or loss of users since early 2010.
What I look for in this data are signs of slowing adoption (so far there aren't many), subtle shifts in platform performance (as seen in RIM's move from consistent net gains to consistent net losses) and signs of churn or the transfer of users from one platform to another (rather than from non-consumers to consumers.)
The story in the latest data seems to be that Windows Phone has turned in a first significant gain in users (378k new users). Its share seems to have stabilized at around 4%. This is in contrast to BlackBerry whose hemorrhage continues (a net of 7 million users defected from the platform in the last 12 months.)
On this occasion of reaching what I've called the tipping point, it's worth reflecting on just how far we've come. In December 2009 the total number of smartphone users in the US was 39 million whereas now it's about 115 million. That's a total of 75 million new users in a bit more than two and a half years, quite a story there.
And yet, half of the phone users still remain to be converted. It's possible that the growth in adoption will remain steady but it's also possible that it might slow down and follow the "S-curve" adoption rate that new consumer products typically follow, perhaps reaching saturation at some point below 100%.
If growth slows immediately then there will be more churn between platforms. If rapid growth can be maintained then there will be more competition with non-consumption rather than between rivals for some time still.
The changing character of competition will need to be reflected in product strategies. Non-consumption is typically an easier competitor to beat with features. Switching users from a comparable product is harder and may require pricing pressure. To solve this in a time of transition, new products will have to split into a set offered to new users and another set offered to switch users.
You can see the pressure of this on the Windows Phone platform most of all. As a late comer, does the Lumia range from Nokia fit the bill as targeting non-consumers or switchers?
In other words, has the brand been positioned as a "better" smartphone or as a "good enough" smartphone? It matters because the "good enough" position has been held by Android overall while the "better" position has been held by iPhone. However, not exclusively. We've seen "better" positioning from Samsung's Galaxy S and Verizon's Droid brand and "good enough" positioning from the older variants of iPhones.
So it's quite difficult to see where Lumia fits in the US. There is no obvious opening. The next 75 million first time US smartphone users may be attractive to Microsoft and Nokia but it's not clear why, having waited so long, those buyers will be persuaded by the new brand. Perhaps subsidies will help. As indicated with the first US Lumia launch, the product was priced at a discount to the prevailing price point for a premium smartphone. Perhaps that's the "good enough at a good price" strategy.
If so, it has not been a home run. Perhaps there is still time for this strategy to play out in 2013 but what if Lumia is not actually being marketed this way?
At launch Nokia has tried to promote the brand as something "better". Better camera, better charging, better maps, better screen, etc. They have promoted on Twitter with the #switchtolumia hashtag. Microsoft has had the "Smoked by Windows Phone" campaign targeting specifically existing smartphones.
I don't want to suggest that one positioning is more appropriate or more likely to succeed than another. That's a tough call. Either could be the right choice. What I would suggest however is that there needs to be clarity of thought and communication on the matter.
Perhaps the launch of the new Lumias (920, 820) is part of a clear positioning toward the high end. But the absence of pricing and distribution and how the operators will be engaged leaves the question open. The strongest criticism of the effort so far is this lack of clarity about how the product is intended to be perceived by the buyer.
A lack of clarity in positioning is symptomatic of a lack of clarity, or maturity in strategy.
It looks like the next iPhone will be called the iPhone 5. What's in a name? As it turns out, quite a lot.
Every hardware product that Apple has released has had a brand and a sub-brand. Macs for example use the Mac brand and a sub-brand as follows:
iMac
MacPro
Macmini
MacBook
Thus each sub-brand imparts certain meaning to the buyer. i, Pro, mini, book are all evocative. MacBook even has its own sub-brands:
MacBookPro
MacBookAir
These Mac sub-sub-brands of Pro and Air are specifically designed to also distinguish and convey meaning.
iPods as well use the iPod brand followed by a sub-brand.
iPodClassic
iPodtouch
iPodmini
iPodshuffle
iPodnano
Note how the mini sub-brand was retired from the iPod line to be used exclusively in the Mac product line. That may not be specifically necessary or desirable but it is an interesting coincidence. (The Pro sub-brand is shared between different Mac lines)
However, when we look at the iPhone and the iPad, the nomenclature has been distinctly different. Both products have been using generational naming conventions. This implies no sub-branding as the iPhone and iPad are the only identifiers of brand and hence the only meaning being imparted to the buyer. You either get an iPhone or and old iPhone.
That changed with the iPad however. The third generation iPad became just iPad. This was deliberate (why would they want to confuse buyers?) I think there is some logic to this.
Note the parallel to the convention of the original iPod. When the iPod launched it was just the iPod. Subsequent versions were identified by a generation, but not a specific sub-brand. After the third generation iPod (still called iPod), the mini version was launched, creating the sub-brand convention that remains in use to this day. The iPod therefore was born generational but switched to sub-branding in adolescence.
The possibility exists, therefore, that there will be a sub-brand for the iPad. Perhaps "mini" is being reserved for a new iPad, to distinguish it from the regular iPad (no sub-brand) that is likely to remain in production. The logic is to make room for sub-brands when the core brand begins to cover a wider array of form factors, themselves proxies for separate use cases or jobs to be done.
So what about the iPhone?
The iPhone has remained, stubbornly, after five years, stuck with a generational naming convention vis-à-vis the sub-brand convention used in every other mature product line from Apple. (Note that software from Apple adheres strictly to a generational naming convention because there is no "room" for a sub-brand under a software brand. There can be no "iWork Pro" or "Final Cut EZ". [Update: there once was Final Cut Express])
Prior to today I entertained the possibility that the new iPhone will follow the iPad in dropping generational naming in favor of sub-branding thus implying that the brand would develop into a portfolio of sub-brands (like the iPad seems about to.)
Alas, that possibility now seems moot. The launch announcement seems to clearly point to "5" being the name of the new iPhone. The brand remains iPhone and there will be no sub-branding.
This can only mean that Apple intends to preserve a single product strategy for the brand. There will be no "special" iPhone for different (e.g. low-end) markets. There will be no different form factor to accommodate different use cases. There will be no new jobs to be done for the iPhone.
What a bummer.
However, there may be something more curious happening. Note all the service brands being launched on the iOS platform. There's Siri, (as yet unnamed) Maps, GameCenter and PassBook. These are not Apps. These are services designed to be unique to iOS, perhaps even unique to the iPhone. The difference with the iPhone brand may not be that it spans a multitude of sub-brands in hardware but that it covers a multitude of new service brands. As brands imply meaning, the iPhone brand may imply that it's a platform in and of itself.
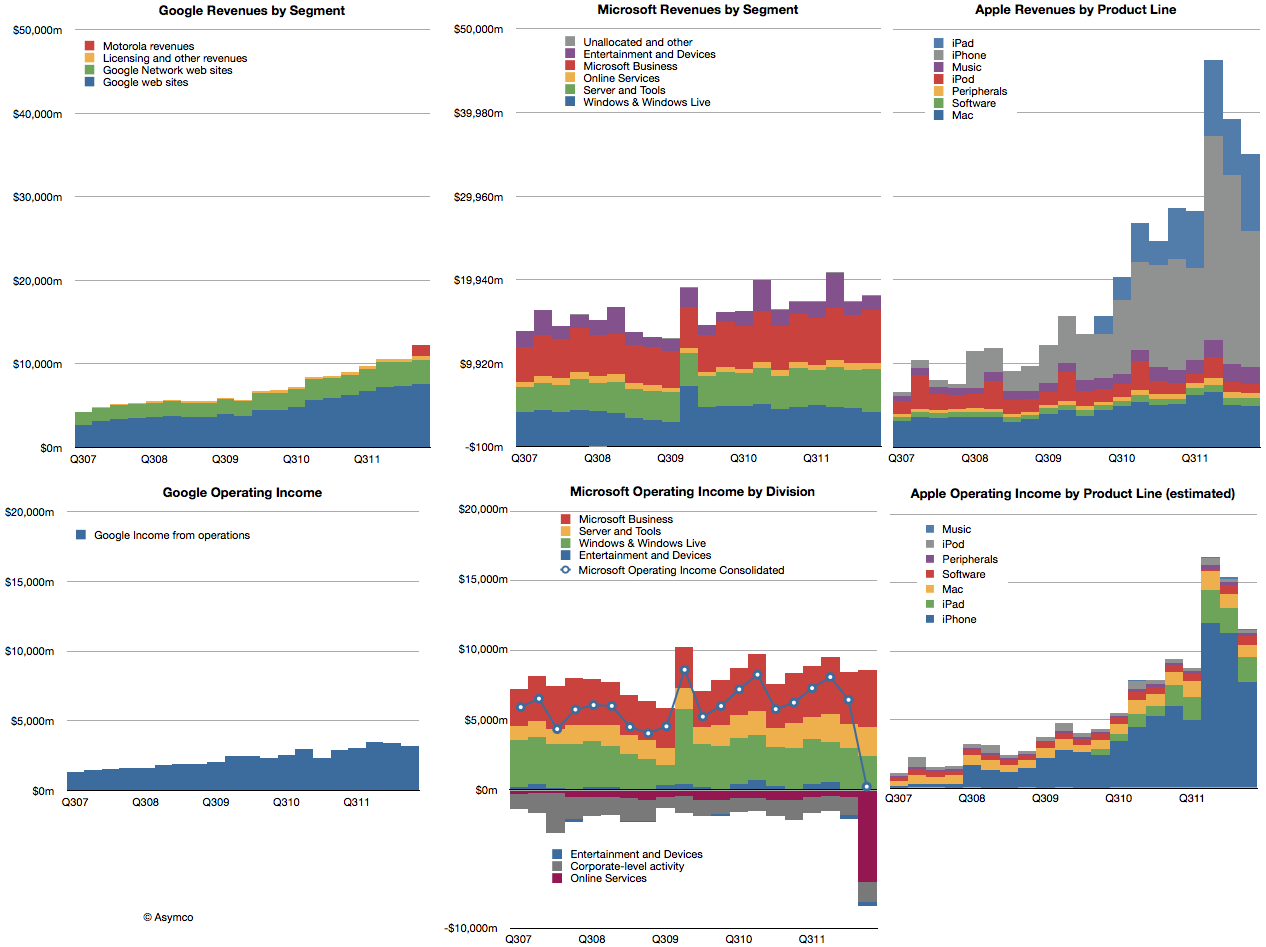
Google, Microsoft and Apple all had reasonably good second quarters. Microsoft's revenues grew by 4%, Google's by about 22% and Apple by 23%. Apple's growth was disappointing but the other companies weren't. The revenues for the three companies are shown in the following charts:
I also showed the performance of each company's operating income in the bottom three charts.
Microsoft did declare a one-time write-off of $6.2 billion which it spent on aQuantive a few years ago. That was booked as contributing to a loss of $6.67 billion for its Online Services division. Without that one-time charge consolidate operating income would have grown at about 3.6%. Google's operating income grew at a rate of 11% and Apple grew (again, disappointingly) at 23.4%.
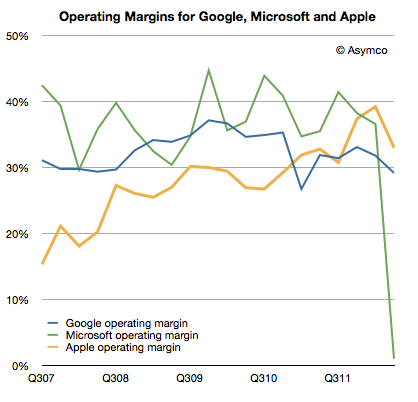
Apple's operating margin fell to 33.1% while Google's fell to 29.2%. Microsoft's margin evaporated due to the one-time charge. If we back that charge out, the margin would have slightly topped 35%.
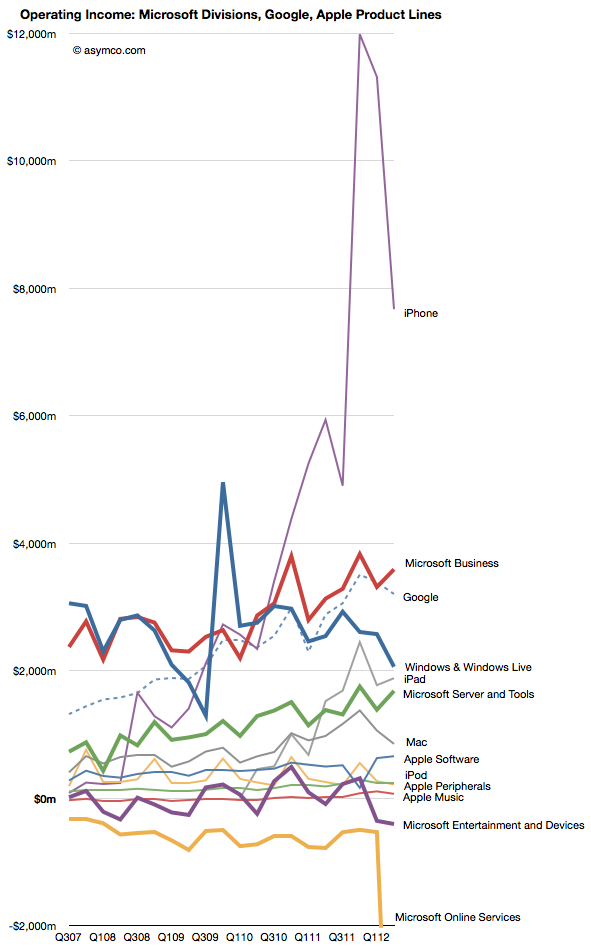
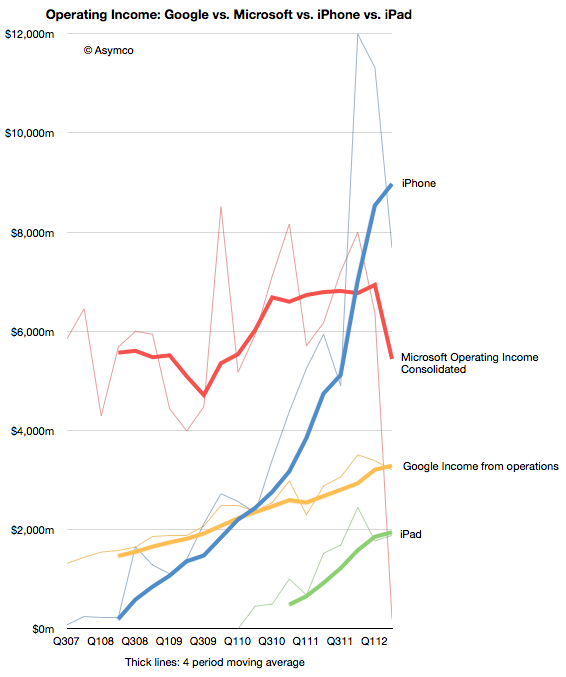
Comparing the contribution (in operating income) for each division or product line (where possible) gives the following view:
I tried to remove some noise by isolating the iPhone and iPad and consolidating Microsoft overall and Google.
By also smoothing out seasonality with a four-period moving average we can observe the pattern of growth for the iPhone and iPad relative to the other companies' overall performance.
The crucial question remains if and when the iPad will be a bigger business than Google and/or Microsoft. The iPhone climbed over both some time ago.
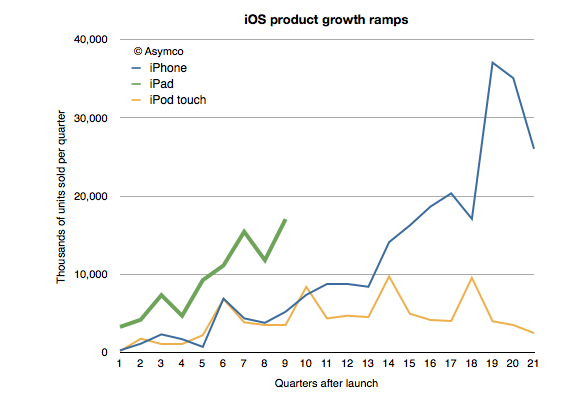
One of the remarkable patterns associated with the iPad has been its growth rate. Looking at the ramp of the product relative to the iPhone and iPod touch reflects this sense of raised expectations:
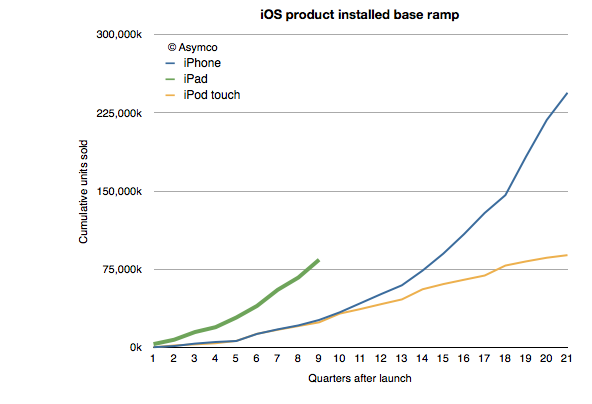
At the same point in time, and adjusting for seasonality the iPad is outselling the iPhone by a factor of 3 and the iPod touch by a factor of about 5. This is also reflected in the installed base of devices, where the 84 million iPads sold through its first nine quarters is more than three times the iPhone base at a similar point in time.
Of course, the world of 2012 is different than the one from 2009 when 25 million iPhone sold. iPhones are available in far more points of sale and to many more buyers world-wide. But the interesting contrast is between the iPad and the iPod touch.
I've always maintained that the dynamic difference between the iPad and the iPhone is that it's unrestrained (and unsupported) by the operator channel and all that it implies. The iPad is a pure computing product whose means of communication is unregulated. That means transparency in pricing and transparency in distribution.
But so is the iPod touch.
The iPod touch is a "nano iPad" (or as detractors put it, the converse of that.) So shouldn't the iPod touch behave as the iPad?
We don't know exactly how the iPod touch behaves. We don't have specific figures on its sales. What you see in the charts above are my estimates for the iPod touch based on company statements that "about/above 50%" of iPods are touch versions. That and the cumulative sales totals that are occasionally reported.
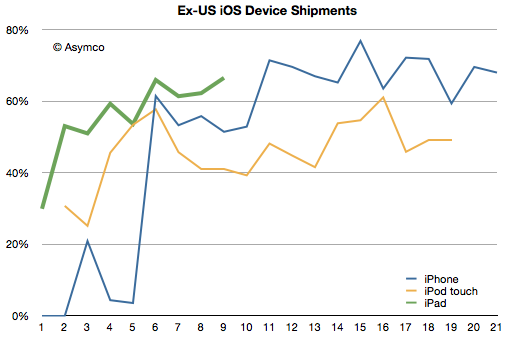
However, we have received an unexpected morsel of data from the Samsung v. Apple trial that may help characterize the two products: US sales data. Having the US data and knowing/estimating the global data gives us an estimate of the international (ex-US) sales for all three products.
I indexed the three products to measuring quarters since launch. The pattern here is that the iPad diverges from the iPod touch in its international appeal. Since the iPad expanded internationally even faster than the iPhone, the issue is not only one of rapidity in appeal but also a qualitative difference. The iPod touch seems to have stabilized at 50% non-US sales while the iPhone is between 60% and 80% outside the US.
The iPad reached 60% non-US sales in its first year. Its last quarter was 70% outside the US.
So what's going on?
The characteristic value of the iPad is in its appeal to "computing non-consumers". Computing has come to mean media consumption, education, communication and entertainment. These jobs to be done are casually done with much more ease on an iPad. The iPod touch can do these jobs as well, but not as comfortably. The iPod touch is "absorbable" by younger consumers and typically they have their hiring done by their parents. Those parents are less likely to indulge where incomes are lower.
But the universal appeal of the iPad is evident in its global visibility. Like the tasks it performs, the iPad itself is becoming less of a mystery.
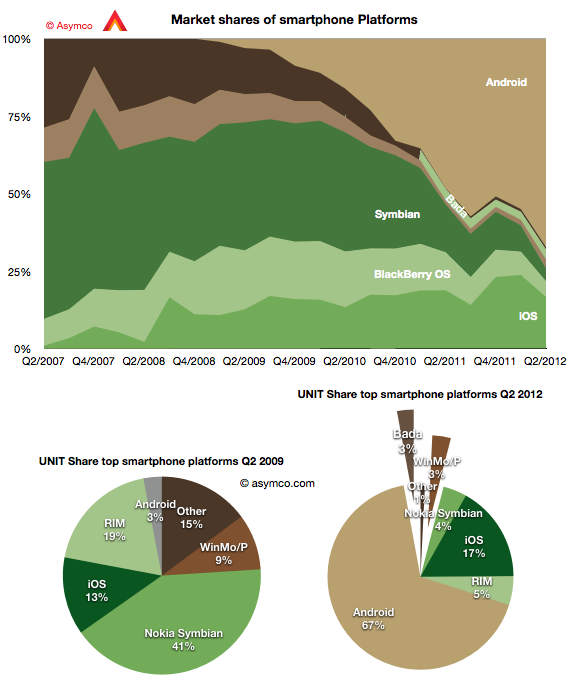
The second quarter showed continuing growth for Android with 19 points of share growth from a year ago. Only Windows Phone showed a gain y/y in share up 1.6 points to about 3%. In the same time, Bada lost half a point, iOS lost 2.1 points, RIM lost 7.2, Symbian 11.4.
The result is shown in the graph below:
I also show a "before-and-after" pair of pie charts which show the difference in smartphone platform market share from the same quarter three years ago. Android went from 3% share to 67% while Symbian went from 41% to 4% and RIM went from 19% to 5%. iOS increased its share from 13% to 17%.
If this trend continues Android could reach 50% of all phones sold in a few years. That's a run rate of 200 million per quarter. And it's likely that 100 million of those will be shipped by Chinese vendors.
However, looking at the global picture can also miss some important trends in local markets. Had one looked at the global smartphone business in 2005, the conclusion would have been that Symbian would be the dominant platform in perpetuity.
What affected the global market was a change in the US: the launch of iOS and thereafter of Android. The US, a smartphone backwater until then, became the most vibrant market and today it's the most penetrated and has the highest ratio of smart to non-smart of any of the major regions.
The curious thing about this vast market is that it's still not truly open. There are technology and political reasons why some platforms are permitted to sell in one region or not. The iPhone is not available on either the largest Chinese operator or on the largest Japanese one. It's largely absent from India because of distribution (i.e. subsidy) and much of South America. Even in the US, the iPhone is still, after five years, not available on one of the top four operators and has only reached another less than a year ago.
What intrigues me is what would the market look like if distribution were not an issue. What if there was equal choice to all buyers. We can't test this question directly but we can ask. But there is some pattern we can look at in the US data. Thanks to recent revelations at the Samsung vs. Apple trial we can see the effect of increasing distribution in the US.
The data on smartphone market share by carrier can be blended with data from carriers about iPhone activations (which are a proxy for sales, see note below) to give a more precise figure of market share in markets where iPhone participates.
For example, when the iPhone was only available on AT&T, one could measure iPhone market share vs. the global smartphone market, or the US smartphone market or within AT&T alone. Some assumed that the AT&T share would be reduced once the product would become available on Verizon or other US carriers. However there was no appreciable drop. Share in Q4 2010 was 63% at AT&T and it was 63% a year later after the iPhone was available for four quarters at Verizon.
So the share of iPhone within those operators which carry it tells a story independent of distribution.
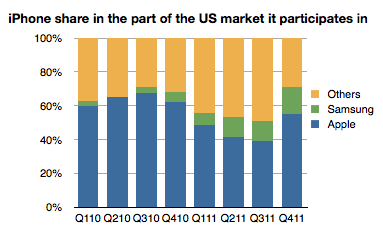
The following graph shows the share of the iPhone vs. Samsung in the market defined by its availability. (I.e. the volumes of smartphones sold by AT&T throughout the time period, Verizon Q1 2011 to end and Sprint in Q4 '11).
The share of iPhone thus defined shows a slight decline but it's an overall number that is remarkably resilient as distribution increases and is remarkably high overall. Note that globally, the iPhone gets only about 17% share of smartphones--a value that has not varied greatly since mid 2009.
So at least in the US, on carriers where it's available, the iPhone is holding on to a significant share. In a global market it's expanding distribution but not yet covering the world. As a consequence it's keeping up with overall market growth and staying between 17% and 20% share.
The big question is what will happen if and when its availability matches that of Android in terms of points of sale. Or even that of BlackBerry or Symbian. Is America a different market from the rest of the world? It was different in being isolated while Symbian roamed globally. It was different in being a launch platform for BlackBerry and then iOS and then Android. But now that iPhone is beginning to be widely available there, will it be exceptional in how it rewards Apple?
---
Note:
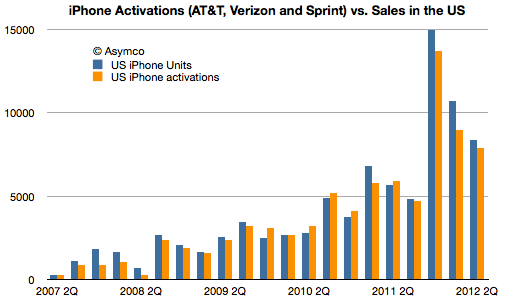
Activations data can be seen next to Apple's testimony of US sales in the following graph. Note that more phones were sold by Apple than were activated in total of the life of the product. 86 million sold and 80 million activated. This implies that an analysis based on activations undercounts the iPhone.
Because that is an estimate. Of the 104 million Android phones shipped in the quarter (itself an estimate from another, possibly different methodology), I could only account for 7 million actually reported. That figure comes from a close reading of an investor presentation from Sony. HTC does not report their shipment numbers. It stopped some time late last year. Neither does Motorola now that it's a part of Google. Huawei is silent except for setting targets and ZTE published a press release citing IDC's estimate of its own shipments.
But most glaring of all is the absence of any mention by Samsung of its performance. The company stopped reporting any data on either overall phone shipments or of smartphones within that total since Q3 2011. We may have been able to estimate Samsung if we had more competitor actuals, allowing us to back into a figure. But we don't.[1]
Which leaves us with IDC's estimate[2]. But the problem is that since the industry is growing so quickly it is very sensitive to assumptions. Consider how difficult it is for consensus estimates for Apple's iPhone shipments to come near the actuals--and that's for one quarter, and knowing all the previous quarters with precision. The absence of visibility into the assumptions made by market analysts (or their methods) should lower confidence in the results.
Consider that IDC specifies 50.2 million Samsung smartphones, implying an accuracy down to 100,000 units. Is this accuracy believable?
There is reason for doubt.
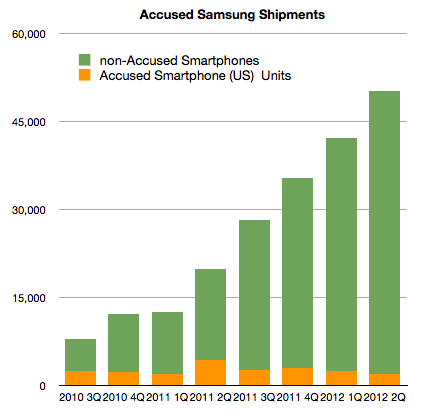
I start with the following graph:
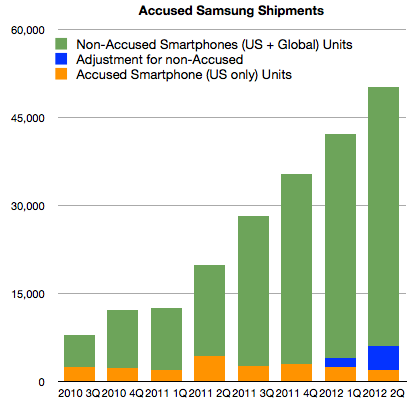
It shows the estimates for Samsung global shipments (latter four quarters are estimates without the benefit of company reports.) I separated the component of shipments that Samsung reported as part of its submission to the Samsung v. Apple trial in California. Note that this (orange) segment consists of most US smartphone shipments. It's not all US Samsung shipments. It notably excludes the Note, the latest Nexus and the Galaxy SIII.
Without these "non-accused" phones, it would appear that Samsung's US volumes dropped to 4% of global totals from a 10% average[3]. In order to return to 10%, the US totals would need to be adjusted as shown below:
I added 1.5 million units in Q1 and 4 million units in Q2 (to account for Galaxy SIII).
So far this seems consistent with the total estimated global shipments of 50.2 million from IDC. US units would result in 12% of global shipments.
However, there is more data we can test against. First, we are also given pricing for the US phone portfolio, or at least we have revenue per unit sold. This allows us to get an idea of what revenues can be obtained for the smartphones in the US, and possibly world-wide[4]. Knowing prices for smartphones and knowing global sales (which Samsung reports) and finally knowing global total phone shipments allows us to price the average non-smart phone.
Excluding the non-accused smartphones, the average revenue per smartphone in the US for Samsung in Q2 was $339. Adding in the estimated Galaxy SIII (4 million) at an average price of $470 gives a new "ASP" of $413.
This is where the analysis goes off the rails.
If we assume the global ASP is equal to the US ASP and knowing everything else about the mix of smartphones (54% of total) and revenues (as reported) yields a negative ASP for feature phones. Assuming the revenue figure is correct, either the number of smartphones is wrong (50.2 million) or the global ASP ($413) is wrong. The total phone number is also an analyst estimate which can be called into question.
There are many assumptions being multiplied here so I have very low confidence in the result, but we should ask "what do you need to believe" in order for the 50.2 million figure to be real. The following scenario for example has to be true:
Global Samsung phone shipments total 93 million units (which means 42.8 million feature phones sold as well as the 50.2 million smartphones).
6 million smartphones shipped into the US, equivalent to about 50% increase y/y, roughly in-line with market growth
4 million Galaxy SIII shipped (but not necessarily sold through) at an ASP of $450. This results in a US total smartphone ASP of $413
The global smartphone ASP is significantly lower (at 80% of the US or $330)
Global revenues of $18.14 billion is essentially all from phones
Global feature phones will have an average price of $36
If these conditions are met then it's possible that 50.2 million Samsung smartphones did ship.
The figure for feature phone ASP is difficult to accept as it would be lower than Nokia's. Also, the low global smartphone ASP is also difficult to accept but it might be possible to find a scenario with the above variables which makes the 50.2 million figure believable.
Unfortunately this is an unsatisfying analysis. I could propose another figure to answer the question in the title, based perhaps on more "believable" assumptions. But I have no means to defend my assumptions. The only option I have remaining is to caution that the total smartphones shipment estimate for Samsung remains precarious. The new evidence from the US trial places more doubt on it but it is not enough to disqualify it entirely.
---
Notes:
This cone of silence over 93% of the most popular mobile platform is somewhat puzzling in contrast to the perfect information we are used to having about iOS, BlackBerry and even Symbian. It seems that the more open a platform, the less is revealed about its market performance. This extends to the licensed Windows Phone whose shipments are only revealed through Nokia's reporting of Lumia shipments.
In the PC market, vendors also selectively publish their units. The norm is, however, not to. As a result IDC et. al. are the only sources for global market data. However, the PC market can be sampled more easily than the phone market. PC retail measurement methods are more reliable compared with all the points of sale for phones.
Note that Apple sells about 30% of iPhones in the US.
Apple's pricing world-wide is very consistent with pricing in the US which makes sense from a channel management point of view. One would not want to create incentives for cross-border arbitrage of phones.
Samsung has been selling smartphones for a relatively short time. Although the company sold Windows Mobile, Linux and PalmOS during the last decade, it did not gain significant volumes until it began selling Android phones in 2010 with strong operator support.
That support was substantial in the US. The company crashed the Android party in mid 2010 with its Galaxy brand. Trial evidence reveals that the sales level for Galaxy S1 series phones burst out of the gate taking Samsung from 90k units to 2.5 million units in one quarter.
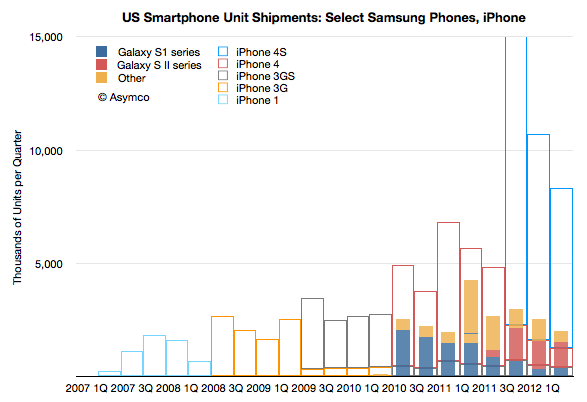
The following graph shows the unit shipments recorded by Samsung for a set of US smartphones.
Note that the profile of sales volume shows a cyclicality with respect to product launches. Each new generation overlaps with previous generations and "fills in" while the older generation product tails off in sales. This is standard portfolio strategy. It also shows the cycle time of launches is approximately four quarters. As the S1 was four quarters old, the SII launched and the SIII follows after four quarters of SII.
What is surprising is that the overall sales volume is not growing. At least for the products catalogued (which exclude the Note) growth for the last four quarters has been: 5%, 34%, 31%, -53%. These are in stark contrast to the iPhone pattern shown in the outline bars behind Samsung's.
The iPhone ramped slowly in 2007 and 2008 and has been showing remarkable generational growth.
Perhaps it's still early and Samsung SIII product will ramp up as the contemporary iPhones do, but if it doesn't we have entertain the possibility that the iPhone does not compete along the same basis.
What does it mean to compete on a different basis?
The basis of competition is the aspect of an offering for which a customer is willing to pay a premium price. It's hard to know (or to put your finger on) what the basis actually is, but we can test whether it's the same by measuring whether two products capture prices the same way. If one product that seems to resemble another can obtain price advantage consistently, then perhaps it's being bought for a different reason.
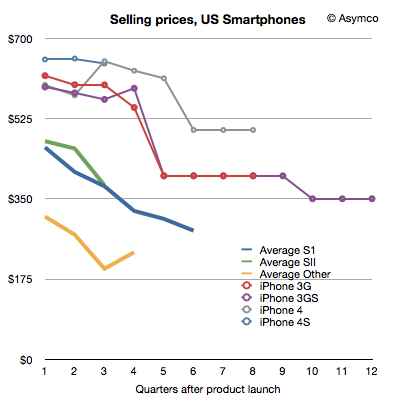
To test this, I produced the following chart showing the prices that Samsung's phones have been able to capture through their lifetimes; and the same for the iPhone.
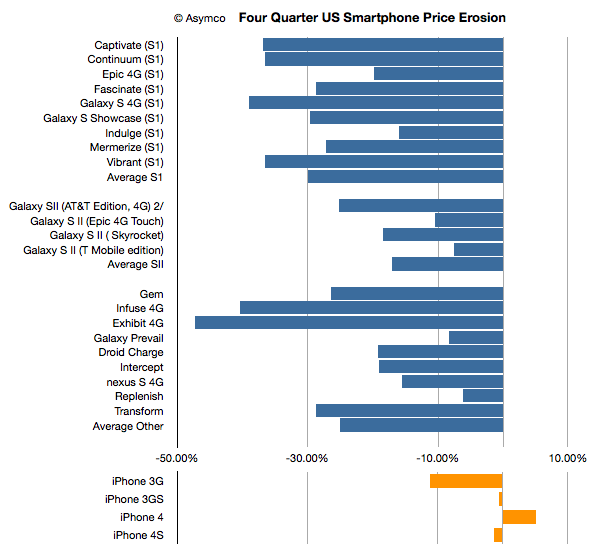
I've narrowed the analysis to the first four quarters and summarized the price erosion across all the products as well:
[Note: iPhone 4S, Skyrocket, T-Mobile Galaxy SII showing only three quarters]
As mentioned, it's still early perhaps, but the pattern for the iPhone has been different.
Samsung's pattern is not unusual. I've seen similar pattern for almost all Nokia products. Prices drop. It's a standard industry phenomenon.
Therefore the question is not perhaps what is Samsung's basis of competition: it's the same as the overall phone industry. The question is what is the basis of competition for the iPhone.
Phil Schiller stated (under oath) that when assessing sales for a new model of the iPhone, Apple used an easy shorthand:
Each new generation sold approximately equal to all previous generations combined.
That's a helpful gauge. Did it hold and will it continue to hold?
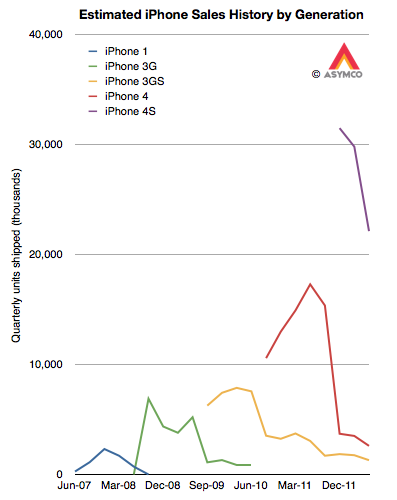
In order to test this rule of thumb we need to know generational sales. Although we know overall unit sales for a given quarter, since Apple has been selling several versions simultaneously, we need to make some guesses about the ratio of generations in the mix. My guess is about 10% for 3G vs. 90% 3GS and 5% 3GS vs. 10% 4 vs. 85% 4S. That results in the following pattern:
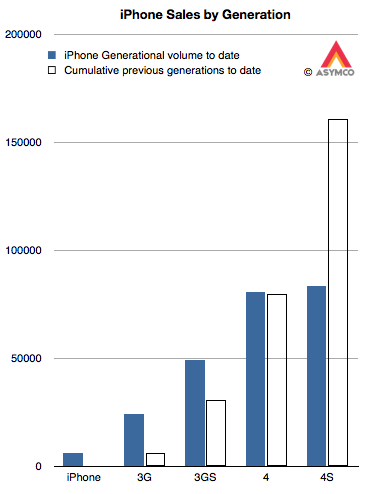
The cumulative totals for these generations can then be generated and they appear as follows:
The solid bars are the shipments for each generation (to date) and the outlined bars are the cumulative shipments of all prior generations. The assumptions show that:
The 3G easily outsold the original iPhone. In fact, it sold nearly four times as many.
The 3GS also handily beat the 3G+original total by a factor of 1.6
The 4 also beat the 3GS+3G+original. As the 4 may continue to sell into the future, the beat will only grow larger.
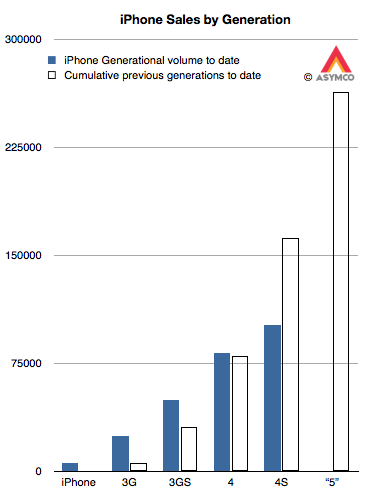
The 4S is only half way through beating the 4+3GS+3G+original. Assuming the current quarter's sales roughly equal the last quarter's, the total for 4S will reach two thirds of the sum of the previous generations (i.e. 100 million) by the end of September. Bearing in mind that the 4S is likely to remain in production at least one more year means it has a potential to come close to the target of 162 million.
This leaves us with the question of how many iPhone "5"s will sell. As it stands today, the cumulative total would have to be greater than 263 million units (including assumptions for the current quarter.) That target is shown below:
Is that a reasonable target?
Unfortunately, this is a moving target. As the 4S (and maybe 4) remain in production, the target continues to increase with time. However, we can still take a stab at this.
Recall the analysis of production based on budgeted CapEx spending. It resulted in a best guess of about 165 million iOS units sold in the following two quarters. I further forecast iPhones in isolation to be about 102 million over the same period. Taking that forecast forward and assuming a 60% growth rate, I currently have about 200 million iPhones over the next twelve months. If 85% of those are the next generation, that yields about 170 million iPhone "5"s through mid 2013.
This is well short of a target of 265 million. But that's only over the next four quarters. If the iPhone "5" remains in production for at least as long as the 3GS then it might cross 200 million. There is also the question of whether the "mix" will begin to favor the older generations more. If that's the case, we might see version "5" meet its target.
Underlying all this is the question of a change in strategy toward more penetration (vs. current skimming.) That might allow for sustaining the 100% historic growth rate. If so then Apple will easily sell 250 million iPhone "5"s.
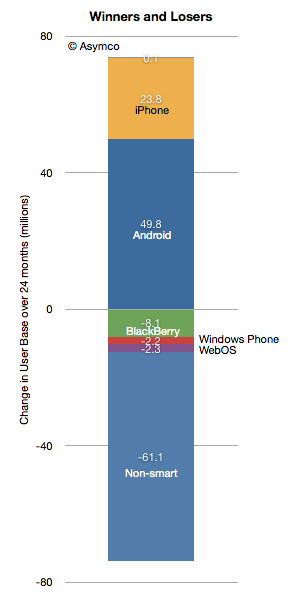
According to data from comScore, in the past 24 months 50 million Americans became Android phone users. In the same time frame Apple added 24 million iPhone users. As I mentioned in my Asymmetric Competition post, it would be unwise to consider this data in isolation. Consider the following graph showing the net change in users in the US.
Android and iPhone grew mostly at the expense of non-smart users. The BlackBerry lost 8.1 million users and all the others only lost about 4.5 million.
With penetration at 50% it's still impressive that there is so little "churn" between platforms. In fact, measuring churn as the net platform user loss as a percent of all smartphone users, we get something less than 1% per month.
The smartphone competition is still primarily with non-consumption.
That will change at some point when smartphone penetration (shown below) will begin to saturate. The basis of competition will have to shift from converting non-smart users to converting users of other platforms while maintaining one's own user base.
The market has not experienced this sort of rivalry on a wide scale. The defections of BlackBerry and Symbian users are relatively rare events.
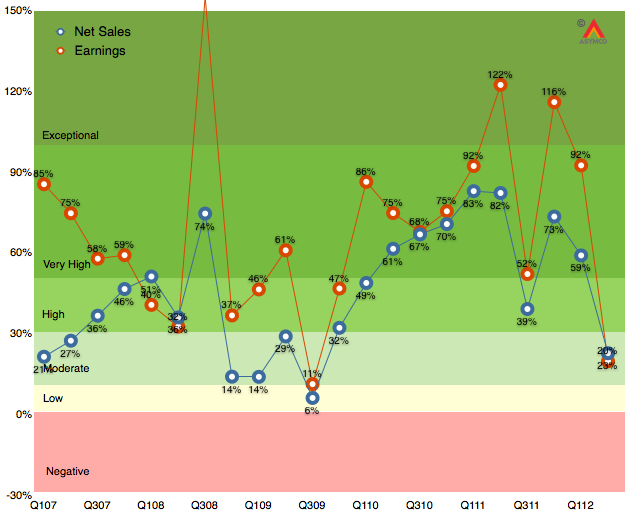
As the following revenue growth table shows, the second calendar quarter of 2012 was not like the recent past.
The bottom line growth (earnings) is the slowest since Q309 which had a difficult comparison with Q308 when the iPhone 3G launched and saw 800% iPhone growth. This past quarter also had a difficult comparison with 150% iPhone growth a year earlier and 122% earnings growth.
This is shown in a different way in the following graph:
Growth is sometimes victim to difficult comparisons and sometimes the launch of products comes late or early in a particular cycle. This quarter was a mix of multiple factors that went the wrong way:
iPhone did not get expanded distribution and was stale late in its cycle. Emerging market traction outside of China still elusive.
iPad is not getting volume purchasing from institutions and spring is not an ideal launch quarter for consumers
Mac portables missed a few weeks of sales due to lack of Intel components
Some signs of macroeconomic slowing especially in Europe and countries dependent on commodities exports.
The silver lining is the return of higher growth to iTunes store and peripherals. These are "hobbies" for Apple but they might form a foundation for significant new opportunities in the years to come.