Asymco

Asymmetric Intelligence

iTunes

  1. How big is iCloud?

    Research · 24 comments

    Apple has declared that what used to be "Other Music Related Products and Services" ((Includes revenue from sales from the iTunes Store, App Store and iBookstore in addition to sales of iPod services and Apple-branded and third-party iPod accessories.)) plus "Software, Service and Other Sales" ((Includes revenue from sales of Apple-branded and third-party Mac software, and services.)) which was formerly known as "iTunes/Software/Services" ((Includes revenue from sales on the iTunes Store, the App Store, the Mac App Store, and the iBooks Store, and revenue from sales of AppleCare, licensing and other services)) is about to become "Services".

    "We'll also have a category that we refer to as services and this will encompass everything we report under the heading of iTunes software and services today including content, apps, licensing and other services and beginning this month it will also include Apple Pay."

    "Services" will therefore encompass a massive amount of revenue. The reported revenues for the fiscal 2014 were $18 billion. Including all billings, the turnover in sales is over $28 billion. For next year, assuming that Apple Pay, which is just getting started, is unlikely to contribute greatly to revenues, Services turnover will top over $35 billion. That figure would make Apple Services alone one of the top 90 companies in the Fortune 500.
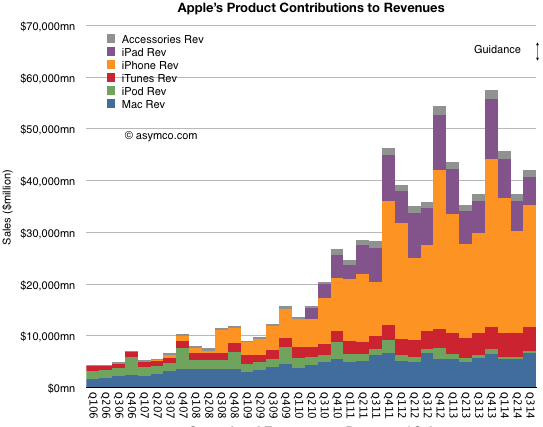
    Screen Shot 2014-11-14 at 5.11.47 PM

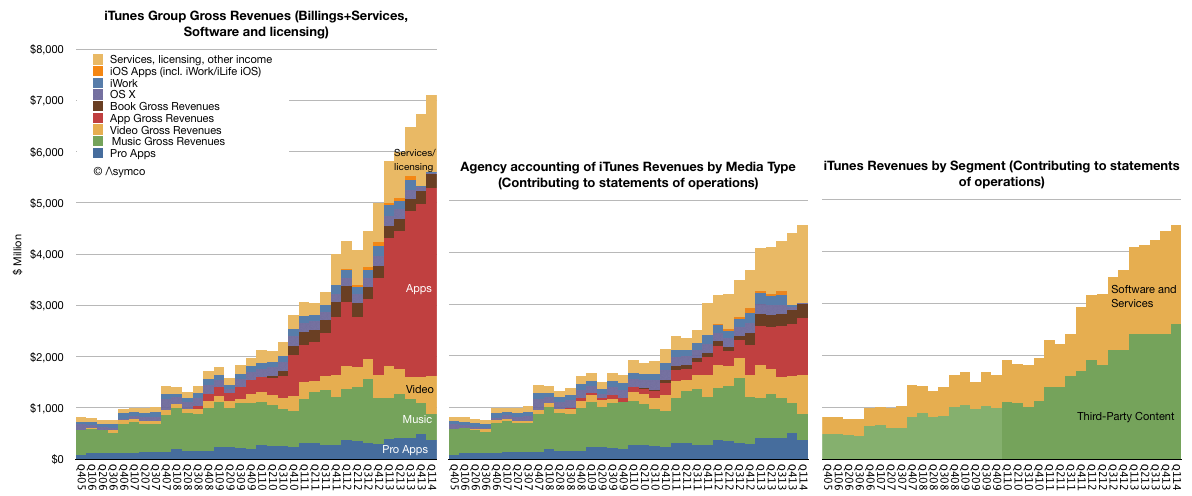
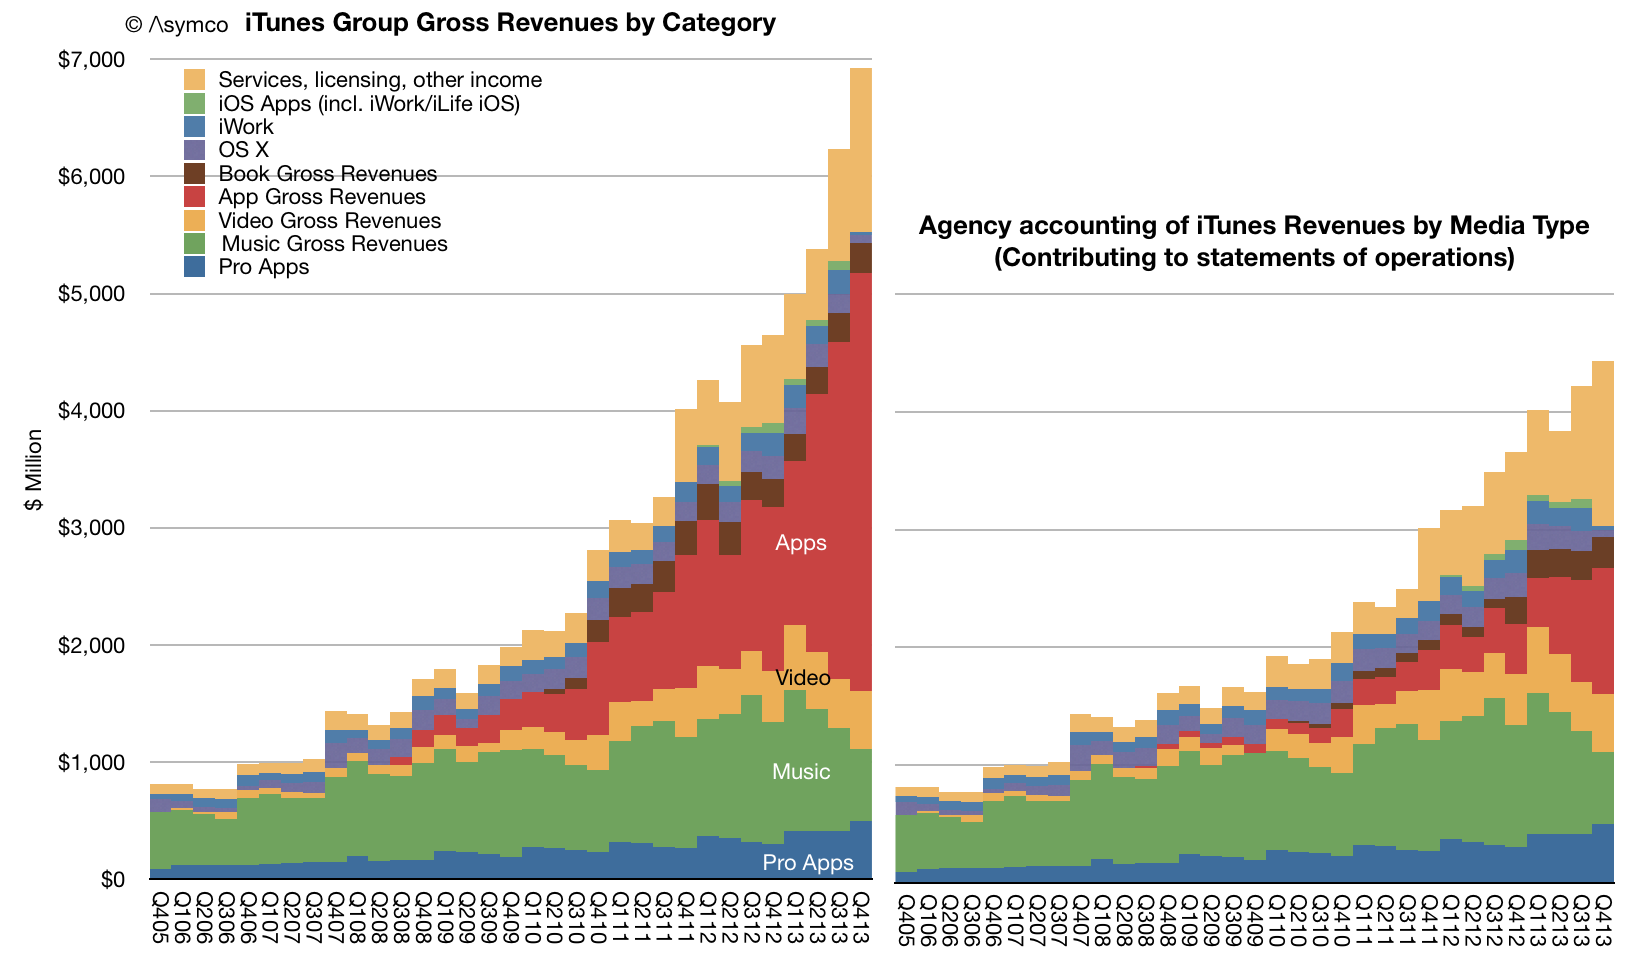
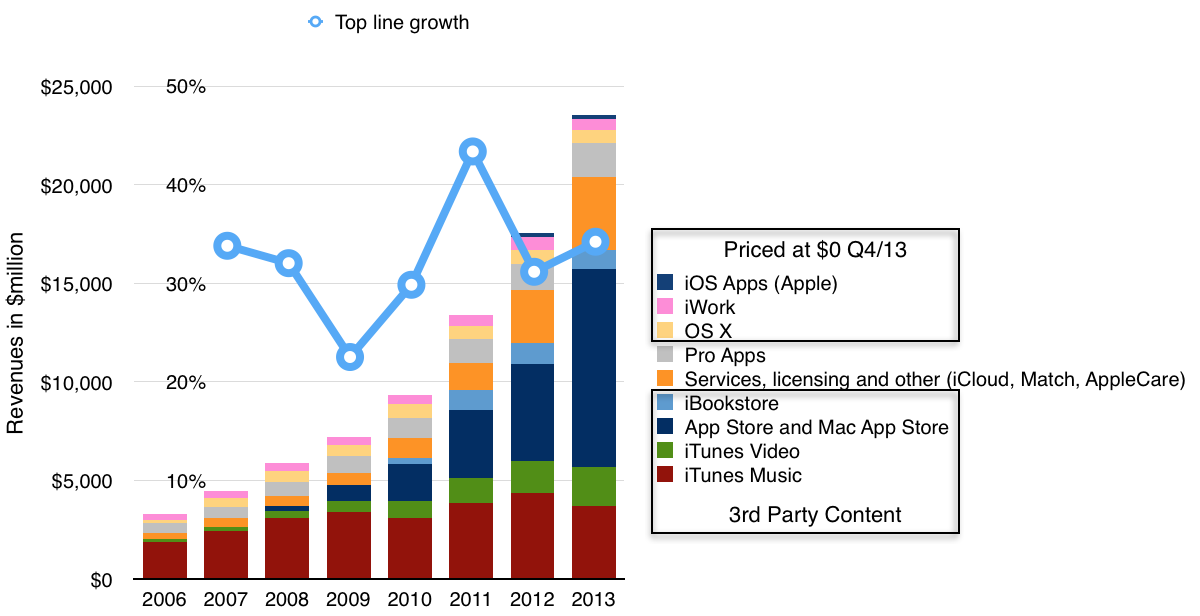
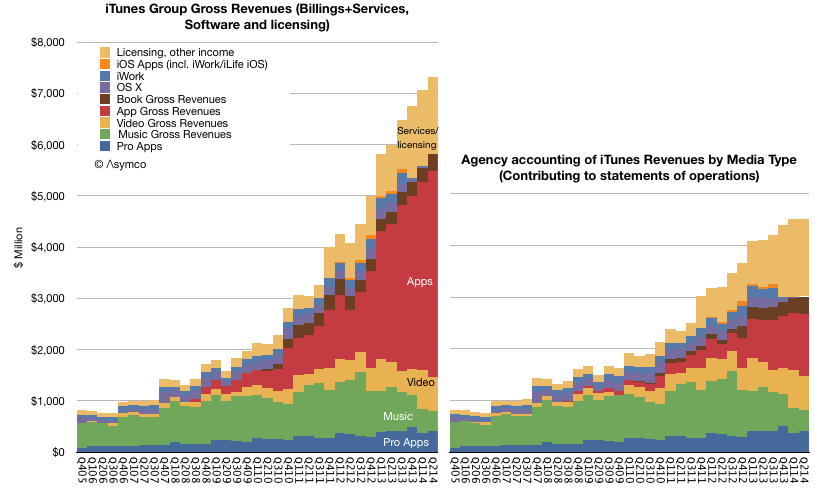
    Regardless, as a component of overall sales, the group formerly known as iTunes/Software/Services (shown in red above) was a modest 7% of total sales in the last quarter. Using all available information regarding downloads, payouts and reported financials, an estimate can be obtained on how this 7% is itself divisible into nine sub-segments:
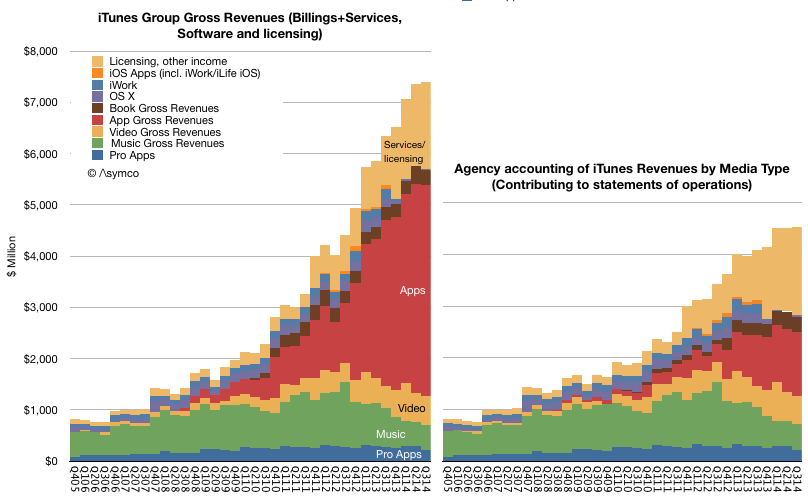
    Screen Shot 2014-11-14 at 5.15.08 PM
    • Pro Apps
    • Music
    • Video
    • Apps
    • Books
    • OS X
    • iWork
    • iOS Apps
    • Licensing and other income

    These are shown above as either contributing to statement of operations (i.e. as reported, on right) or using billings (or the actual "cash register takings", on left). ((The primary distinction is in Apps billings where the 70% paid to developers is not shown as revenue.))

    What would be ideal in understanding this Services segment would be to break the "Licensing and other income" into its component parts. Namely:

    • Licensing revenues including Google's payments for traffic acquisition (TAC)
    • AppleCare
    • iTunes Match
    • iTunes Radio
    • iAd
    • iCloud
    • (and soon, Apple Pay)

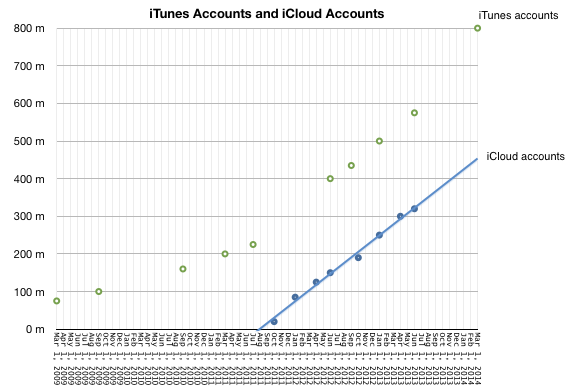
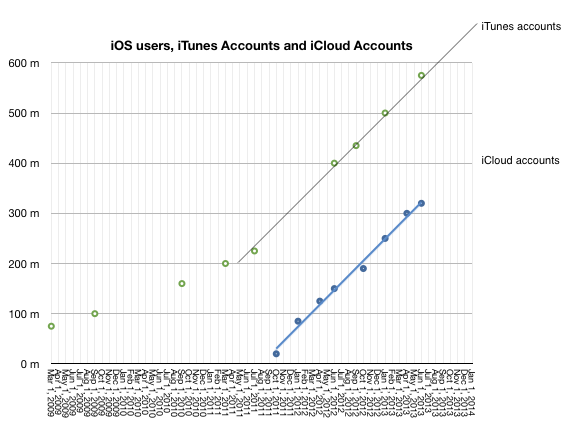
    In particular, it would be very interesting to know exactly how much revenue could be coming from iCloud. We have not heard from Apple on iCloud user numbers since mid-2013 and this was the data at the time:
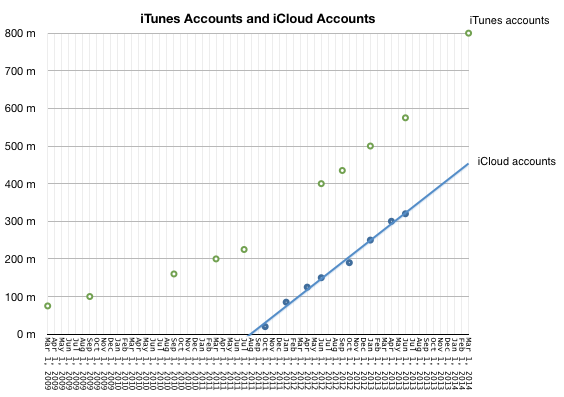
    Screen Shot 2014-11-14 at 5.30.27 PM

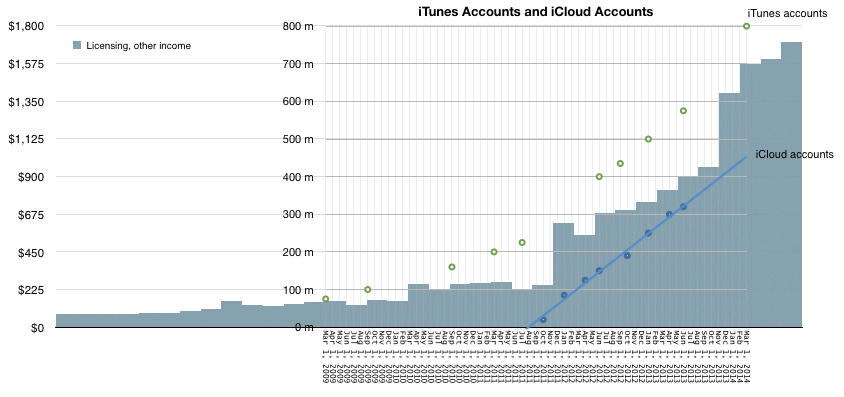
    Couple that to "Licensing and Other Income" as deduced from Services accounting yields the following picture:
    Screen Shot 2014-11-14 at 5.38.30 PM

    It would appear that iCloud accounts are growing in proportion to "Licensing and Other Income". Note that at the point that iCloud accounts were zero, revenues from Licensing were about $225 million/quarter and growing slowly. The real growth kicked in when iCloud accounts started ramping up. Since revenues from iCloud has to be in the "other income" and since no then it is, I believe, reasonable to assume that the iCloud user base growth is a principal driver of growth ((Of course, AppleCare could also be a driver but AppleCare should follow overall device sales patterns and this is not clearly evident in the Licensing/Other curve))

    Also, bursts in the Licensing and other income line occurred after several iCloud-specific marketing events:

    Mobile Me migration started in October 2011 and on September 30, 2013 the complimentary iCloud storage plans expired and were automatically adjusted to the free 5 GB plan (with an offer to upgrade to a paid plan). Correspondingly, Q1 2012 and Q1 2014 showed the largest increases in Licensing and Other Income.

    This is a multiplication of many assumptions, but there is some intuitive logic. The only place iCloud can be found seems to be growing in proportion to iCloud users and plan marketing.

    So how much does iCloud contribute to Apple's sales? My guess would be about $1 billion per quarter. That would be spread over 500 million iCloud accounts and therefore an average revenue per account of $2/user/quarter or $8/user/yr.

    The lowest non-free iCloud pricing is about $12/yr (5GB plan is free). This would imply that two thirds of iCloud users are paying users (and one third are opting for the 5G plan).

    I realize that this attach rate to a paid service is astronomical. Anything over 10% is unheard of. I would say the error in my estimates could be 20% but that still leaves a huge gap to what seems reasonable.

    [Put another way, if the attach rate were only 10% then iCloud revenues would have to be in the $600 million range and thus only about 10% of what Licensing and Other income seems to be. This would force the question of what could be generating the remaining $5.6 billion/yr.]

  2. How big is Apple's Ecosystem?

    Research · 38 comments

    iTunes/Software/Services revenues grew at 12%. This was the second fastest segment growth last quarter, with the Mac growing at a slightly faster 13% rate. Apple mentioned in the quarterly earnings conference call the for the first nine months of its fiscal year (i.e. since September) the line item iTunes/Software/Services has been the fastest growing part of the business. The following graph shows the growth scorecard for Apple's line items and it shows how the iTunes store is the only line that has been consistently green (growing above 10% for at least seven years.

    Screen Shot 2014-07-29 at 8.58.53 PM

    In addition to its revenues, iTunes can also be measured in terms of billings (or gross revenues). The billings growth rate is even higher at more than 25%. This is mostly to the more rapid growth of apps relative to a decline in music. As Apple only records the 30% it keeps as "revenue" for apps the overall growth in apps is less visible in its accounts.

    The relative performance of billings vs. reported revenues is shown in the following graphs:

    Screen Shot 2014-07-29 at 9.02.13 PM

    Note the estimated split between media types and software and services. The software and services portion of the business had sales of $1.9 billion while the revenues from third party content/apps sales reached $2.6 billion.

    The value of this data is that it encompasses an almost complete view of the Apple ecosystem. As almost all content and transactions are tracked and reported and one can get a very precise view of the economic value of the ecosystem. ((In addition to iTunes/Software/Services Accessories could also be considered as part of the ecosystem. The value of Accessories and licensing as Apple reports it adds another $6 billion to iTunes/S/S)) (( What is missing are ad revenues through apps which don't use iAd )) (( What is also worth asking is what is the size of alternate ecosystems such as those of Microsoft, Google etc. ))

    From the launch of the iPhone the value of Apple's ecosystem has grown more than 600% which is faster than overall sales growth (approximately 400%). If ecosystem value grows more rapidly than underlying hardware sales the question that emerges is when would the ecosystem transaction value exceed that of the business is supposedly supports.

    Today the iTunes/S/S ecosystem is about $20 billion/yr. iPod, iPhone, iPad and Mac sales are about $150 billion/yr. It does not seem likely that the former will overtake the latter. If that were the case then one wonders why build a business entirely predicated on retailing and services without the support of hardware revenues. Something along the lines of Amazon.

  3. A Dollar a Day

    Research · 137 comments

    There are 80 million Mac users. The last 12 months saw sales of 18 million Macs.

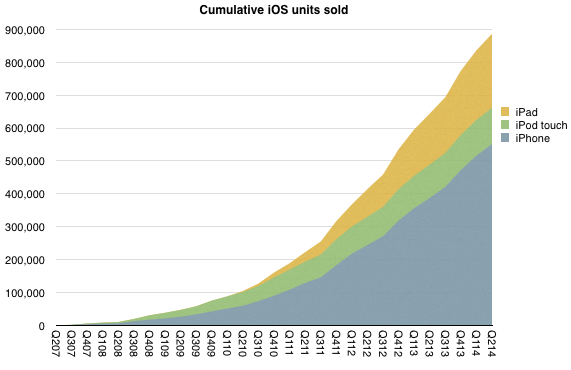
    As of the end of June there were 886,580,000 iOS devices sold. As of today the total is well over 900 million. One billion sold will happen well before this year is out. Estimates of current iOS users vary but they are probably at least 500 million and could be 600 million.

    Screen Shot 2014-07-25 at 7-25-2.44.06 PM

    Apple claims 800 million iTunes accounts.

    Therefore, in terms of revenues:

    • Mac User = $289/yr
    • iOS User = $262/yr
    • iTunes User = $25/yr (( Measured from billings ))

    Adding iTunes usage to either Mac or iOS yields

    • One Mac owner = $323/yr or 89c/day
    • One iOS device owner = $287/yr or 79c/day (( This conforms well to the rule of thumb that, after taxes and accessories/services, one Apple device is worth about $1/day ))

    This should make valuing Apple easy.

    80 million Mac Users and 500 million iOS users add up to about $169.3 billion in sales per year. If we assume that the number of Mac users grows to 90 million  and 600 million for iOS then next year Apple should get another $200 billion from its population of users.

    So over the next 30 months Apple sales should easily be higher than its current enterprise value. (( Enterprise Value = Market Capitalization - Cash + Debt = $585 billion - $164.5 billion + $29 billion = $449.5 billion ))

    This would be the forward price to sales ratio of about 2.5. Each sale yields a certain net profit, which for Apple is on average 21%. Multiplying 2.5 by (1/.21) gives 12 which is about the P/E ex cash.

    This exercise summarizes Apple's valuation nicely: Apple is expected to keep its current customers for about a decade and then disappear.

  4. Measuring Not Getting the Cloud

    Research · 140 comments

    This is what "Not getting the Cloud" looks like:

    Screen Shot 2014-05-09 at 5-9-3.30.03 PM
    Screen Shot 2014-05-09 at 5-9-4.04.33 PM


    "Not getting the cloud" means that in the last 12 months Apple obtained:

    • 800 million iTunes users and
    • an estimated 450 million iCloud users spending
    • $3 billion/yr for end-user services plus
    • $4.7 billion/yr for licensing and other income which includes
    • more than $1 billion/yr paid by Google for traffic through Apple devices and
    • $13 billion/yr in app transactions of which
    • $9 billion/yr was paid to developers and
    • $3.9 billion/yr was retained as operating budget and profit for the App Store. In addition,
    • $2.7 billion/yr in music download sales and
    • more than $1 billion/yr in Apple TV (aka Apple's Kindle) and video sales and
    • $1 billion/yr in eBooks sold

    In summary, iTunes, Software and Services has been growing between 30% and 40% for four years and is on its way to $30 billion/yr in transactions and sales for 2014.

    This is what can be deduced from a reading of Apple's financial statements of operations. If there are comparable details for companies which do get the cloud, I'll be happy to tally the comparison so we can calibrate this failure.

  5. Monthly Apple Users

    Research · 70 comments

    In the postmodern computing world that we live in, the measure of success isn't revenue or profit or units sold but the number of users that an ecosystem can attract. Therefore the monthly active user (MAU) unit of performance seems to be in vogue right now. E.g.:

    • Facebook claims Messenger has more than 200 million MAUs
    • WhatsApp has 500 million MAUs, 48 million of whom are in India
    • Line last month announced that it had 400 million users (active or not)
    • WeChat claimed 355 million MAUs
    • Viber claims 105 million MAUs

    Startups are aggregating these millions of MAUs in order to obtain valuations for raising capital ((It's been said that it's difficult to get funded with only 10 million MAUs)) and the faster the growth in MAUs the more "successful" the company is considered.

    When companies are acquired it's common to take the transaction value and divide it by MAUs to get an idea of "what an user is worth". This is because there are no revenues to measure and MAUs are taken as a proxy. However, the process by which a MAU becomes a dollar of profit is, to put it kindly, circuitous.

    For most (all?) it's not yet clear how it happens especially since not all MAUs are created equal and MAU loyalties can change rapidly and if we added all the projected revenues each MAU will contribute to each app on her device we might reach some absurdity. In actuality, today, for the companies listed above, there are no revenues at all directly from their services.

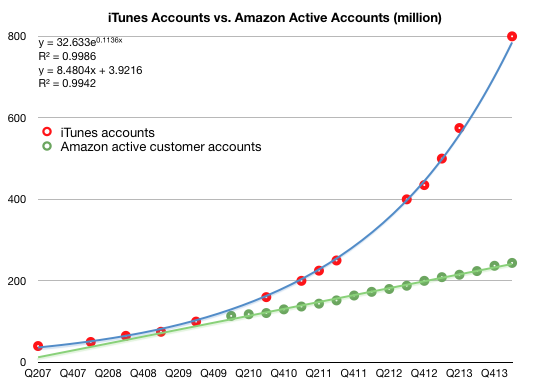
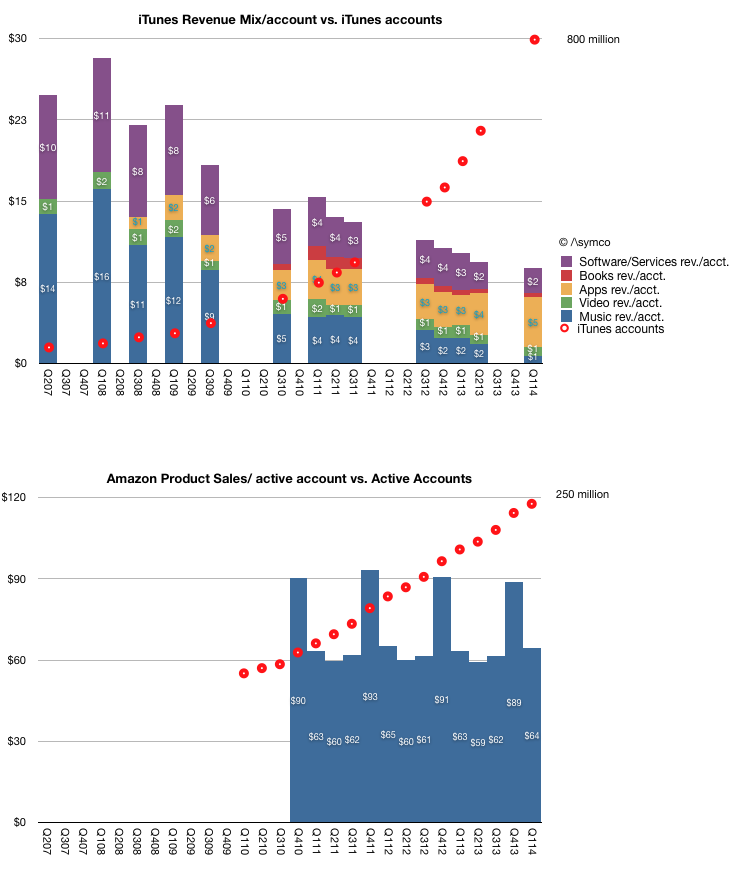
    In violation of this convention, there are some companies which manage to obtain revenues from their users. Two such are Apple and Amazon.  In the last quarter Apple reported having 800 million iTunes accounts. ((adding, for some unknown reason, that most of them have credit cards.))  These aren't MAUs since the activity level is not noted, but we do know how much is spent on iTunes and services. In addition, Amazon cites 244 million active customer accounts  representing accounts which generated purchases within the last 12 months.

    This allows us to compare Apple and Amazon in terms of accounts, revenue per account, and, via some analysis, even profitability per account.

    The following graphs tell this story. First, the total number of accounts:

    Screen Shot 2014-04-29 at 4-29-11.25.29 AM

    Note that I added trend lines to both graphs and their formulas.

    The following are the revenue per account for iTunes (further broken into estimated iTunes segment revenues per account.) and for Amazon. Note that the vertical scales are different.

    Screen Shot 2014-04-29 at 4-29-12.05.06 PM

    This view shows just how different the economic value of users can be. In the case of Apple, it's growing its user base at (literally) exponential rates. The revenues per user does, understandably, decline. This is because new/later users don't spend as much as early users. There might be some stability toward the later stages of adoption in revenue per user. The other point about iTunes data is how the mix of revenues has shifted from music to Apps and Services pointing out how users can be migrated across revenue sources over time.

    In the case of Amazon it's growing its user base at a linear rate (note equation). The revenue per account remains very steady however.

    Broadly speaking, it would seem logical that the speed of user growth has an effect on the quality of those users. This relationship should guide further thinking about the quality of hundreds of millions of users acquired within a few months.

    Apple's user growth is a function of expanding its device portfolio and distribution. Apple has shown that there are limits this type of growth. Achieving 830 million or so iOS device sales within 7 years is an amazing feat and one can forgive not having achieved billions more since they managed to obtain significant hardware and service/content revenues from most of them and that those who reached higher figures more quickly didn't manage the same revenue per user.

    Amazon's user growth is a function of expanding its logistics and merchandise mix. This is also not easy to do globally. Arguably, Amazon cannot scale in the exponential rates seen by Apple or the other MAU aggregators because it has to depend on trucks and roads and regulators to complete most of its sales.

    I suppose, in conclusion, that there is no "right" or "wrong" business model for a user base. Both Apple and Amazon are doing well in building their customer bases and creating loyalties which will serve them well in the future. However whereas there is no right or wrong revenue structure per user, it seems to me that there ought to be some such structure. In most cases this remains a matter of faith rather than reason.

  6. The billion dollar hobby

    Research · 67 comments

    During the latest shareholder meeting Tim Cook revealed that Apple TV sales were above $1 billion in the last fiscal year (ending September 2013). The company later clarified that this figure includes device and content sales.

    This poses a problem. In previous statements the company cited device (unit) shipments rather than value. The statements made to date suggested that cumulative volume of 3rd (current) generation Apple TV totaled 6 million units as of January 1, 2013.

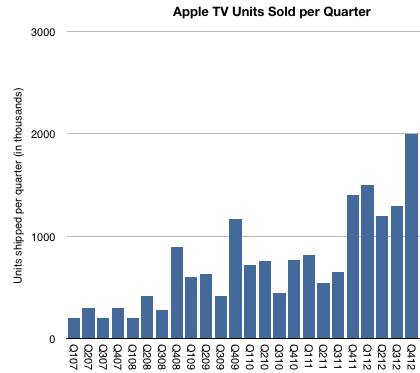
    The following graph includes an estimate of quarterly Apple TV sales based on comments made to date.

    Screen Shot 2014-03-02 at 3-2-8.07.43 PM

    As there were no additional comments during 2013, the "Billion Dollar" quote is all we have to go with for the year.  The problem with trying to separate content from hardware is complicated by several factors:

    • How are we to attach content revenues to Apple TV? For example, what if I purchase a series of shows on iTunes or an iPhone and decide to watch them on my Apple TV. Do these purchases count as being "attached" to Apple TV? Do we attach the full transaction value or do we attach the portion that Apple keeps (as in agency accounting)?
    • How does Apple account for channel placement on Apple TV? Do the channels prominently displayed on its user interface pay for this access (even though the user needs a cable subscription?) Is this the primary source of content revenue that is attributed to Apple TV?
    • What about Netflix, YouTube, etc? What is the content licensing deal with these channels? Does the Netflix channel actually cause an Apple TV purchase or does the Apple TV purchase cause a Netflix subscription?
    • Without content, one might think that the $1 billion revenue would yield total device shipments approximately 10 million units in fiscal 2013 (assuming $99 unit pricing). This is not quite right however as Apple's revenue per unit is unlikely to be $99 unless all units are sold through its own retail stores (including online). Sales through other retailers probably allow for some retailer margin so Apple's average selling price will be below $99.
    • Another question is the fiscal year accounting. We have visibility into the fourth quarter of 2012 (about 2 million units est.) so we only need to fill in the first three calendar quarters of 2013 to understand the Billion Dollar volume.
    • Finally, I already estimate separately the overall video market (in my iTunes Business Report) which, based on historic data and other inferences suggests a total video content gross (contributing to iTunes revenues) of $1.8 billion for the fiscal quarter. If a significant portion (50%) of this were allocated to Apple TV it would imply that the hardware business contracted sharply in 2013. Put another way, if I add what we know about C2012 units (6 million and an ASP of $89) to what I estimate video content revenues to have been in 2012 ($1.6 billion) I get a $2.1 billion business. This would be a "two billion dollar" business in 2012.

    All this makes the Billion Dollar Hobby a puzzle. The way I can make it square with existing assumptions is by saying that "Apple TV content revenues" are mostly, if not entirely, distribution revenues from channel placement rather than iTunes purchases. ((This revenue will end up in licensing/other revenues in iTunes/Software/Services segment and separate from Apple TV (which is a part of Accessories).))  As a result, my best guess now is that there were about 7.6 million Apple TVs sold in fiscal 2013, with a bit over 8 million for calendar 2013.

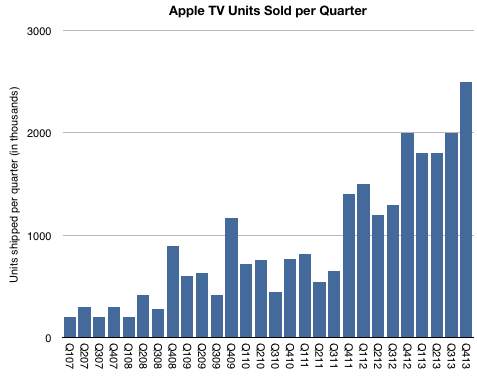
    If I'm right, the complete history of the shipments would be similar to this graph:

    Screen Shot 2014-03-02 at 3-2-9.08.24 PM

    By Apple standards this is indeed a modest story. The total units sold would add up to more than 25 million units with healthy growth. But it would not be in the same magnitude as other iOS devices which have so far sold 800 million units.

    More important than this picture however, or the Billion Dollar Business threshold, would be a better understanding of how Apple sees Apple TV as a business. We already knew that it was a low value hardware business. I even suggested that it's "Apple's equivalent of the Kindle": Hardware sold at low margins as a gateway for a high volume content business (iTunes). The problem with that model is that selling other people's content is never a good margin business. If it were to be sustained, Kindle may ultimately have to become an Amazon Prime salesman.

    So that leaves the Apple TV as a product without a satisfactory business model. Unsatisfactory, at least, to Apple's standards; hence the hobby label. But what if the model is turning out to be a platform for discovery of content and therefore the equivalent of (dare I say it?) a portal! ((Exclamation point.)) The TV UI certainly limits search or traditional browsing interaction but it enables eye candy for a few choice placed offers. It is a low interaction model. Think of how the prevailing UI for TV for decades has been that of pressing one button repeatedly, also known as channel surfing.

    If so , the business of Apple TV may be the auctioning of the real estate on the landing page. In some ways this is how iTunes is already behaving by "featuring" exclusive music content.

    There are all sorts of implications, which I will leave as an exercise to the reader.

  7. Fortune 130

    Research · 74 comments

    The increase in net sales of iTunes, Software and Services in the first quarter of 2014 compared to the first quarter of 2013 was due to growth in net sales from the iTunes Store, AppleCare and licensing. The iTunes Store generated a total of $2.4 billion in net sales during the first quarter of 2014 versus $2.1 billion during the first quarter of 2013. Growth in the iTunes Store, which includes the App Store, the Mac App Store and the iBooks Store, was driven by increases in revenue from App sales reflecting continued growth in the installed base of iOS devices and the expansion in the number of third-party iOS Apps available. Net sales of digital content, including music, movies, TV shows and books, from the iTunes Store was relatively flat in the first quarter of 2014 compared to the first quarter of 2013.

    Apple Inc. Form 10-Q.

    During the last quarter Apple changed the pricing for iWork and OS X to zero ((OS X server is still priced at $20 and iWork for previously unlicensed devices and computers is still priced above $0)).

    I estimate the net effect to have been a reduction in revenues from those software titles of about $350 million for the quarter. Nevertheless, increases in services and app revenues means that the iTunes total reported revenues increased to a new record.

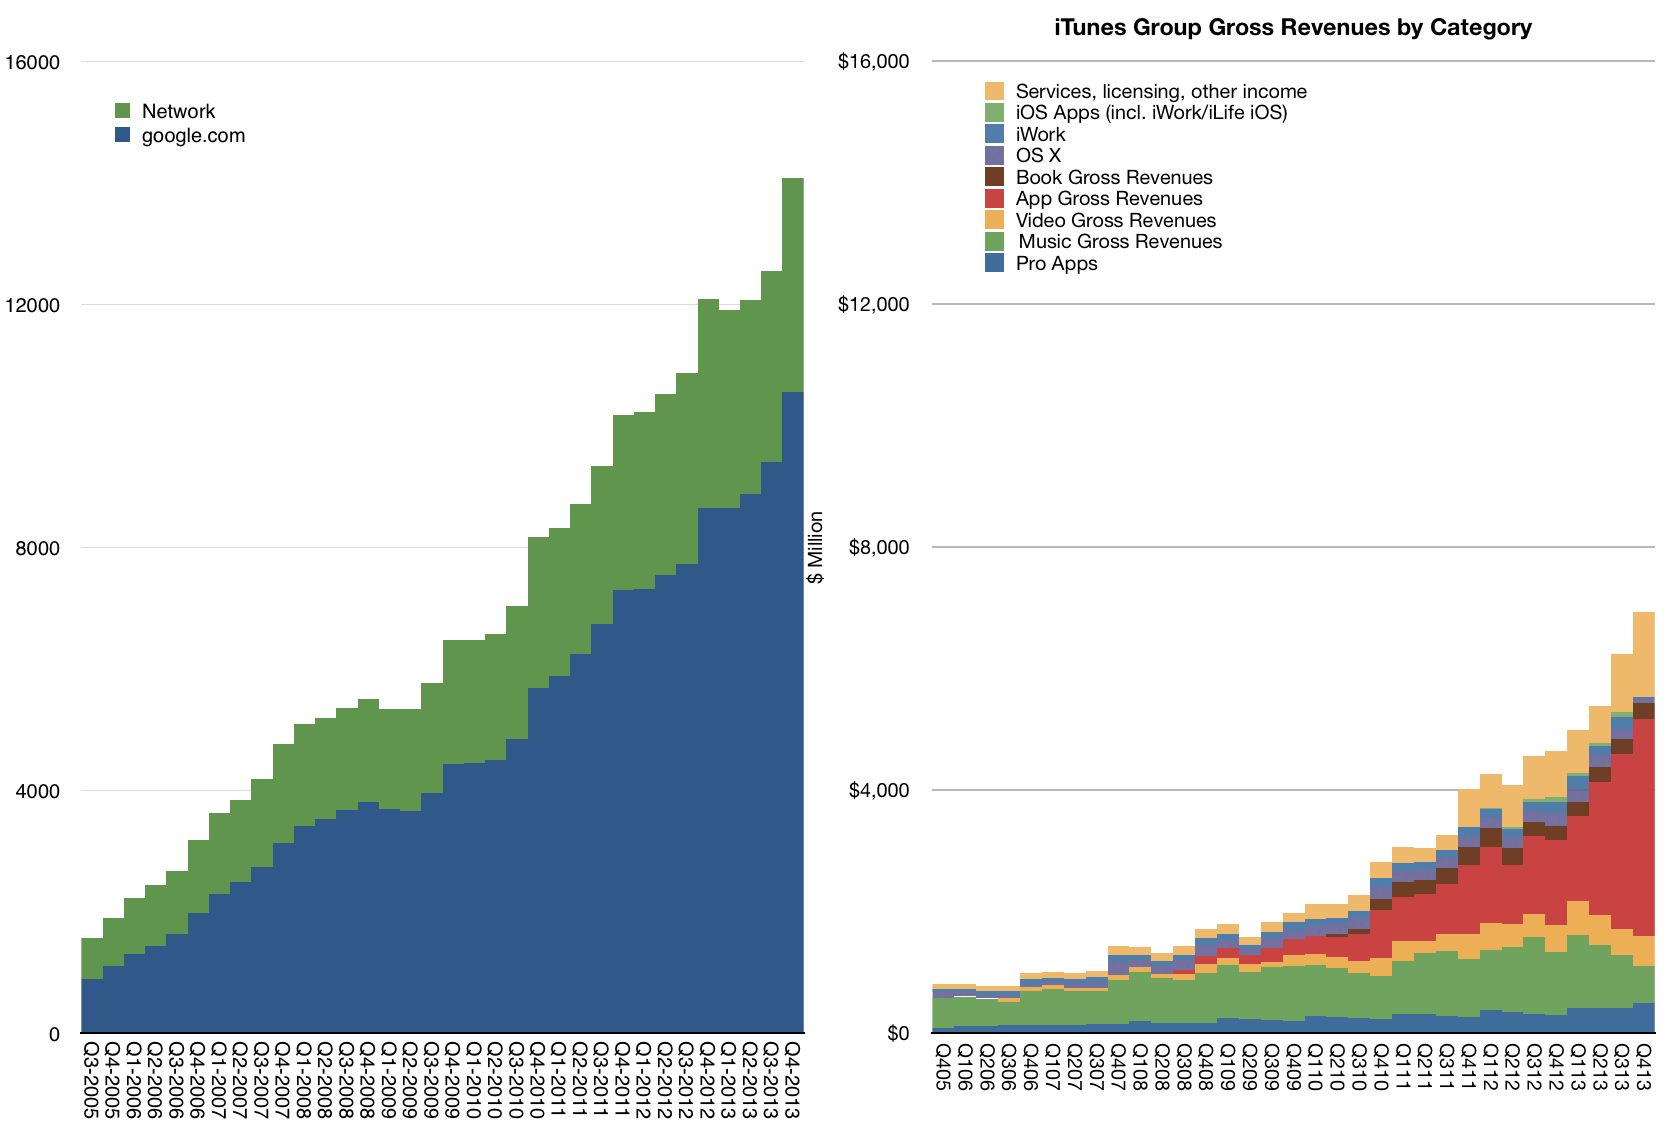
    The total with estimated contributions by media and service components is shown below right.

    Screen Shot 2014-02-10 at 10.05.11 AM

    Note that revenues do not reflect total billings. As Apple reports only the 30% of App transaction values, the full iTunes/Software/Services transaction values are shown in the above graph on the left.

    The "gross" revenues are now nearly $7 billion per quarter. On a yearly basis the iTunes/Software/Services group had gross revenues of $23.5 billion with growth of 34% y/y.

    Screen Shot 2014-02-10 at 10.03.28 AM

    Other estimates for full year 2013 growth are:

    • Third party content +46.6%.
    • Music downloads -14%
    • Video +19%
    • Apps +105%
    • Books -9%
    • Services +37%
    • Pro apps +29%
    • OS X -8%
    • iWork and iLife -8%

    Although iTunes/Software/Services are not usually included in a "sum-of-the-parts" total contributing to Apple's overall enterprise value, the scale of volume and value of transactions is becoming harder to ignore.

    To illustrate this, I plotted the history of gross iTunes revenues vs. Google's search business ((Excludes Motorola and "Other" segments as reported by Google))

    Screen Shot 2014-02-10 at 10.03.55 AM

    On a yearly basis iTunes/Software/Services is nearly half of Google's core business and growing slightly faster.

    The iTunes "empire" of content and services would be ranked as number 130 in the Fortune 500 ranking of companies (slightly below Alcoa and above Eli Lilly).

  8. Apple Fourth Quarter Estimates

    Research · 56 comments

    As Philip Elmer-DeWitt is still interested in my estimates I provided the following:

    Revenues ($B) 57.8
    EPS ($) 14 (908m shares)
    iPhone (units) 56.4 million
    iPod (units) 7.6 million
    Mac (units) 4.14 million
    iPad (units) 26.5 million
    iTunes/Software/Services ($) 4.2B
    Accessories ($) 2.2B
    GM% (percentage) 37.1%

    I arrived at these estimates without looking at anyone else's (except for Apple's own published guidance). Soon after sending them I noticed that Daniel Tello published his own.

    In the same format as above, I quote them for comparison. Please visit his post for additional detail.

    Revenues ($B) 59.0
    EPS ($) 14.92 (895m shares)
    iPhone (units) 56 million
    iPod (units) 9 million
    Mac (units) 4.65 million
    iPad (units) 25.5 million
    iTunes/Software/Services ($) 4.3B
    Accessories ($) 1.8B
    GM% (percentage) 37.8%

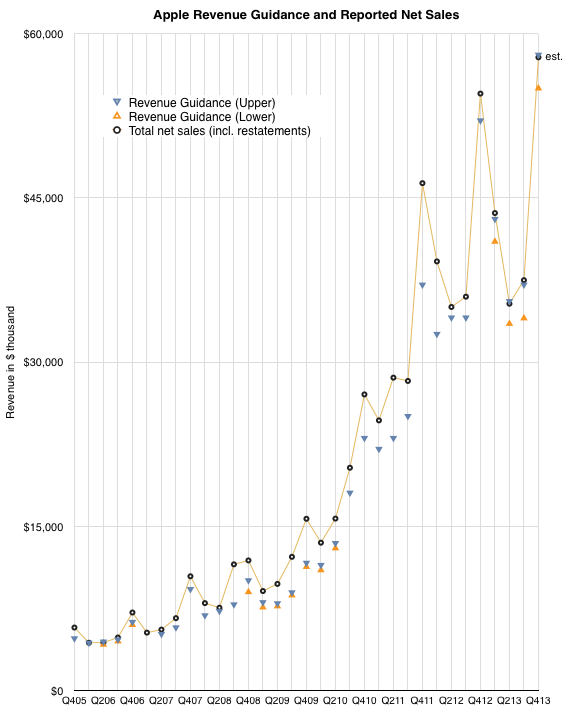
    The graph below shows the history of revenue guidance vs. revenue reported. The last quarter shows my estimate for net sales.

    Screen Shot 2014-01-15 at 1-15-4.06.58 PM

    Note that the company achieved at or slightly above its upper guidance ever since they started offering a range for guidance (i.e. since Q1 2013). My estimate for sales is therefore very near the top of guidance. The figures for units earnings and margins all result from this assumption.

  9. Of bits and big bucks

    Research · 90 comments

    Exactly one year ago, on January 7th, 2013, Apple announced that the App Store reached 40 billion downloads ((Unique downloads excluding re-downloads and updated)). Here are additional data points from that release:

    • 20 billion downloads in 2012
    • 2 billion downloads in December 2012
    • 500 million active iTunes accounts
    • 775,000 apps
    • sold in 155 countries
    • 300,000 native iPad apps
    • over $7 billion in developer payments

    This year, on January 7th, 2014, Apple announced a new set of data points:

    • $10 billion spent on the App Store in 2013
    • $1 billion in December 2013
    • 3 billion app downloads in December 2013
    • 1,000,000 apps
    • sold in 155 countries
    • 500,000 native iPad apps
    • $15 billion in developer payments

    The obvious:

    1. 225,000 apps were added in 2013
    2. 200,000 native iPad apps added in 2013
    3. App download rate for December increased by 50%
    4. No new countries were added in 2013
    5. $8 billion was paid to developers in 2013 (more than in all previous years put together)

    The less obvious:

    1.  No update on iTunes accounts this time but there was a mid-year update (June 10th) which put iTunes accounts at 575 million. iTunes accounts have grown linearly since mid 2011 so it's quite probable that the current total is above 650 million. 
    Screen Shot 2014-01-08 at 1-8-9.28.41 AM
    1. Given mid-year updates to earnings/revenue and the October 22nd update that 60 billion total apps were downloaded and the May 15th update that 50 billion total apps were downloaded it's possible to estimate with confidence that there are now 68 billion total apps downloaded and that were about 27 billion app downloads in 2013. This is an increase of 35% in the yearly download rate. As noted above, the December growth alone was 50%.
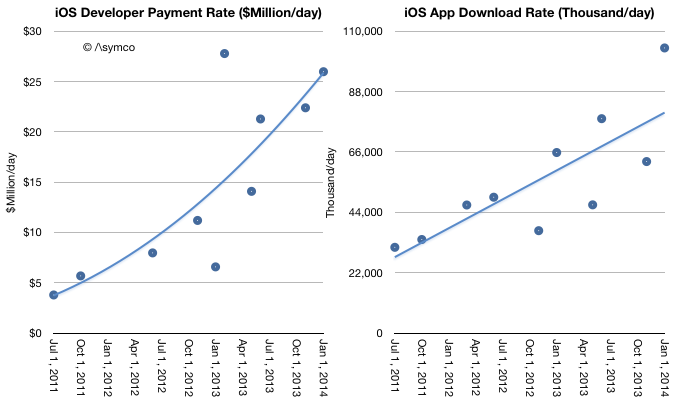
    2. Given mid-year updates on developer payments, and download rates we can estimate revenues per app have increased. As in-app purchasing has taken off it's no longer meaningful to assign a "purchase value" to each download. The rate of payments to developers is increasing faster than the download rate. Currently $26 million is paid out every day while about 100 million apps are downloaded daily. Note that the trend lines below are arbitrary: 
    Screen Shot 2014-01-08 at 1-8-9.41.18 AM
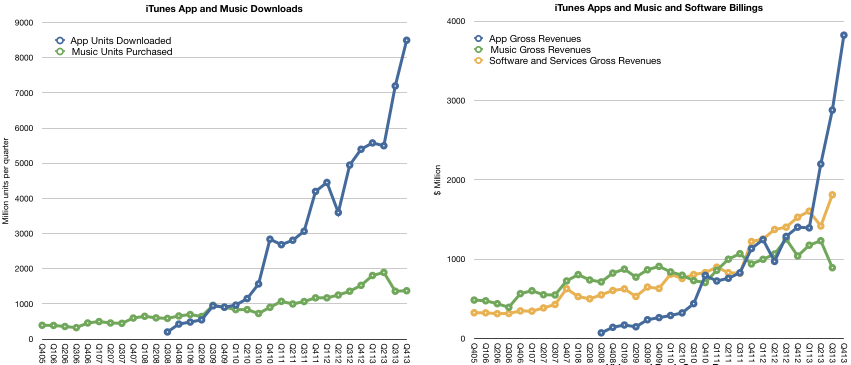
    1. As other reports have noted, there was a decrease in music downloads in 2013. This is also evident when backing into a download total for music given the earnings data and the above evidence of app growth. My estimates below may be overly generous for music unit downloads as they also assume lower pricing. Overall gross music revenues through the iTunes music store ((Excluding new iTunes radio and revenues from services such as Match)) are flat for the year and may even have begun declining precipitously. App revenues are more than compensating for this. 
    Screen Shot 2014-01-08 at 1-8-9.50.37 AM
    1. The iTunes content economy is grossing about $17.5 billion/yr. Apple's own software and services (reported as part of the iTunes segment) add another $6.2 billion/yr. The combined total of $23.7 billion/yr. is slightly lower than what Apple net sales were during its fiscal 2007 year or what Amazon sold in 2009.
    2. A complete report on the iTunes economy and pro-forma iTunes income statement is available for purchase at store.asymco.com.

    So much for the data. What is really happening?

    First, it's tempting to look at music and suggest that music downloads are suffering from streaming, just as it was tempting to suggest that CD buying was suffering from piracy (and later, downloads.) But this is falling into the trap of defining a product's use by the metrics used to measure transactions. These metrics are but a proxy for what consumers are actually doing with their time.

    Consumers have a fixed time budget, a more rigid constraint than their spending budget. Competition for a slice of a consumer's time budget is far tougher than competition for a slice of a consumer's wallet. So what's amazing is that apps have successfully grabbed a share of this time budget. I believe that the reason they succeeded is that they initially fit into niche time slices that were previously unoccupied. ((Interestingly, this was how music, especially digital music as enabled by the iPod, gained traction))

    Downtime or "boredom" was filled with app interaction. This includes some social media consumption. These are not immersive experiences. They are "casual",  inconsequential and trivial. At first anyway. And that's the rub. As apps enter a consumer's world they initially take on non-consumption, which is easy to beat. But as the experiences become increasingly compelling they "move upmarket" and compete more aggressively with existing media consumption patterns.

    For instance, one might allow casual gaming to take root in non-consuming contexts such as commuting, waiting, and escaping time niches. But if the experience becomes addictive, the gaming takes over time previously spent watching TV or using console games. The same can be observed for app-based experiences of social media, shopping and chatting.

    This is the insidious march of a disruptor. It gains a foothold in a context where it has no competition and then relentlessly gets better, eventually displacing the far better suited alternatives. This is what I believe is happening with apps. They are asymmetric in their competition with established media and as a result they are easily ignored and brushed off as irrelevant competition. That is until the incumbent media sees a sudden drop in consumption. Even then, the culprit blamed is not the upstart but some structural issue.

    Music would appear less vulnerable to this app-based substitution because it's an eyes-free experience and can be easily consumed concurrent with another activity. There is however, a subtle de-emphasis and hence devaluation of the experience as it fades into the background. The "job it's hired to do" changes.

    Second, and relatedly, the other meta-observation is that apps are media. They are produced, marketed and priced in ways analogous to other media types. This has implications for the artist/producer/creator. For them movement into apps is natural and effortless. It's how developers moved into them without thinking twice. Trouble is that this transition is not at all simple for those who distribute media.

    I tweeted that the media industry deplored the shift of "digital pennies for analog dollars" ((Original quote was made by Jeff Zucker, president of NBC Universal, in 2008 in reference to the future of TV)) as the packaging of their product changed. The angst and trauma suffered by the media industry when dealing with what could be seen as a trivial change in the encoding of content are the stuff of lore and legend. Moving to apps could be even more troubling. Mainly because there is already a distribution channel in place. And it's owned by a set of companies whose motives and business models are completely different.

    The app economy shows that there are big opportunities in "digital pennies" and that the figures are beginning to match even the "analog dollars". In fact, I suspect eventually digital pennies will dwarf analog dollars. The trouble is that these pennies will not be earned at the same control points. Bits are already big bucks. They're just not the bits we are used to.


  10. What's an Active User worth?

    Research · 86 comments

    Apple has sold 700 million iOS devices. Google claims one billion Android device activations. Microsoft has about 1.5 billion Windows users and Facebook about 1.19 billion. LinkedIn has 259 million users and Twitter has 232 million. Amazon has 215 active account holders and PayPal 137 million.

    Markets place a value on these users implicitly when company shares are priced. For example, Twitter whose users are worth about $110 or FaceBook's $98 and LinkedIn at $93.

    This consistency suggests a universally accepted value per social media user but what is the value of an ecosystem user? Apple, Google, Microsoft and even Amazon aspire to enable ecosystems which should be seen are more valuable than mere communities. Ecosystems enable a higher level of economic activity because they are unbounded by the medium itself. Any number of media can be created. Or so the theory goes.

    If we could determine a value for an ecosystem user we could test it against the going value of a social media user. Fortunately we have enough data to do so.

    The total number of iOS devices sold per quarter allows us to measure the install base of device users. With some assumptions regarding the retirement and attrition rate we can get the following history:

    Screen Shot 2013-11-11 at 11-11-11.52.34 AM

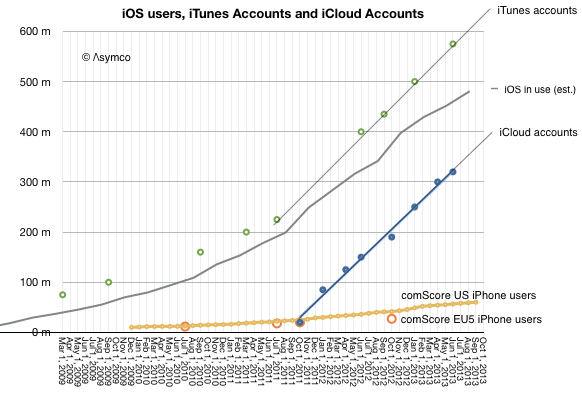
    Since the total number of iTunes accounts is updated with some regularity I've added it to the graph. I've also shown on the same graph the total number of iCloud accounts. For calibration, I included survey data showing the number of iPhone users in two regions (US and EU5).

    These combined graphs give us an upper bound of active users (iTunes accounts) and a lower bound (iCloud) calibrating our device-based estimate. The regional iPhone data offers some additional test on growth.

    The result is "about 500 million" ((482 million by my count but with quite a bit of margin of error)) with a growth of about 11 million per month.

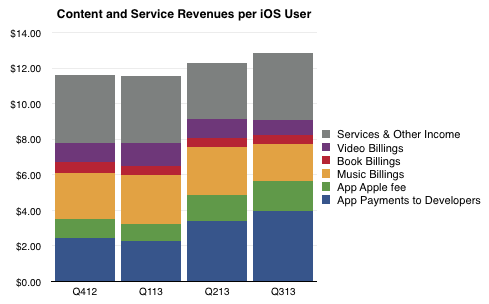
    So if we know with some confidence that there are about 500 million active users as part of the iOS ecosystem, how do we know how much value they generate? The answer is in the consolidated iTunes revenues as reported by Apple: $4.26 billion/quarter. With some attention to the reported media retail and purchases, the following picture of the average iOS user's quarterly spending emerges:

    Screen Shot 2013-11-11 at 11-11-11.50.23 AM

    The bottom line is that in the last 12 months the average iOS user contributed  about $48/yr to the ecosystem via Apple's own properties. They also bought the device and paid for cellular service in most cases. They may also have engaged in quite a bit of browsing and online purchases which fed other ecosystems. But as far as Apple is concerned, it transacted about $48 per user.

    As Twitter revenues last year were $317 million, the Twitter user today generates about $1.36 of revenue per year or one thirty-fifth of what an iOS user generates through iTunes and iCloud alone. And note that the number of iOS users is about twice that of Twitter.

    Of course one could argue that the iOS user's participation is not profitable for Apple. It does obtain massive cash flow from iTunes which finances its fashionable data centers and bandwidth but it does not presume to value itself primarily through this revenue.

    Or at least the market doesn't think so. We don't hear much about how Apple is worth so many dollars per user. ((I suppose the corollary to this is that Apple users are disloyal or fickle or fleeting, and quite contrary to observed behavior.))

    The paradox is that while the device which enables this commerce is where Apple guides the consumer's perception of value, markets discount devices and bid up services. In other words, users continue to pay for the devices which delight them enough to participate in services (especially the monthly billable kind) but markets walk right by these shiny baubles and and shower money on services which have negligible sales and even fewer profits. There must be some serious misdirection going on here. The question is who's being fooled.

  11. The Revenue Table (imperial units edition)

    Research · 40 comments

    Tim Cook famously said:

    We can put all of our products on the table you’re sitting at. Those products together sell $40 billion per year. No other company can make that claim except perhaps an oil company.

    For those of you laughing, that was three years ago. The revenues quadrupled since to a total of $170 for the last four quarters. But the more interesting thought is that the table has not gotten bigger. When Tim spoke the iPad had just been announced but was not yet for sale. So we can't be sure if he thought it should be on the table or not, but it does not take up that much space.

    It would be fun to actually lay out all the Apple products on a table to see how big it would be. The trouble is that there are many things Apple sells which take up no space at all. Things like iTunes content or services and AppleCare.

    So rather than trying to imagine a table full of Apple products (some of which are non-phyisical) I thought a more fitting analogy would be to allocate the revenues from these products to a table and thinking about how much space relative to each other the products would take.

    To make conversion easier, I picked a rather large table; 10 feet long, big enough to fit a small conference room. What would this table covered in product revenue look like?

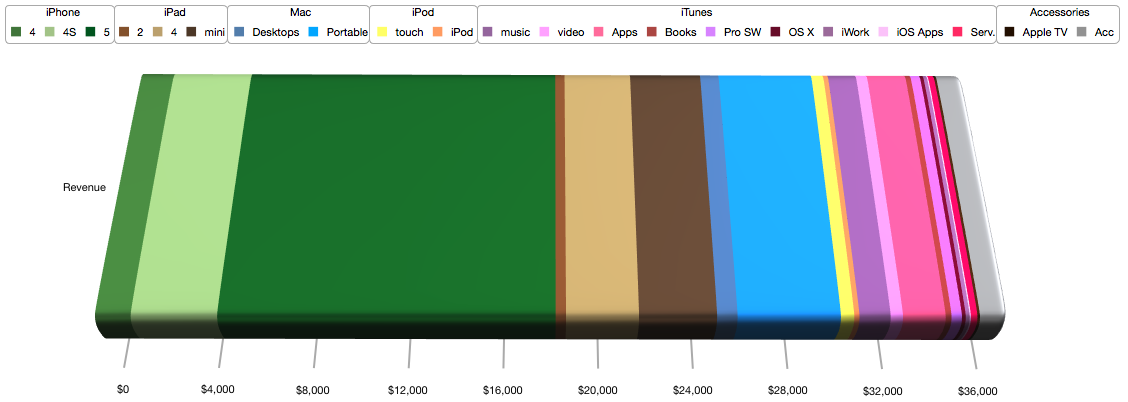
    My estimate is that it would look like this:

    Screen Shot 2013-08-22 at 8-22-11.50.54 AM

    I color coded the product lines as shown in the legend: Greens for iPhone, Browns for iPad, Blues for Mac, Yellow for iPod, Red/Purples for iTunes and Grey for Accessories.

    At this categorization the table would allocate the following space to each category:

    • iPhone (Greens): 60 inches or about half the table.


      Product
      Inches
      iPhone 4
      4.7
      iPhone 4S
      11.4
      iPhone 5
      44.5
    • iPad (Browns): 21 inches


      iPad 2
      1.4
      iPad 4
      9.6
      iPad mini
      10.3
    • Macs (Blues): 5 inches


      Desktops
      2.7
      Portable
      13.6
    • iPod (yellows): 2.5 inches


      touch
      1.8
      iPod
      0.7
    • iTunes (reds), software and services: 15.5 inches


      music
      4.1
      video
      1.6
      Apps
      5.6
      Books
      0.8
      Pro SW
      1.4
      OS X
      0.5
      iWork
      0.5
      iOS Apps
      0.2
      Serv.
      0.9
    • Accessories (Greys): 4 inches.


      Apple TV
      0.3
      Acc
      3.6

    If this colorful table were used to support the actual products, where each product would have to fit within its color band, then the truth of one saying would become apparent: good things come in small packages.