Asymco

Asymmetric Intelligence

iTunes

  1. The Anti-Apple

    Research · 272 comments

    Building a successful business is hard. Many try, few succeed and those that do tend not to thrive for long. So success in business it should be respected. Especially in highly competitive industries like technology. The fragility of success however should also give one pause to think about how delicate a business model is.

    The presumption that companies can shift business models at will is usually false. Businesses are balanced on a knife's edge of dependency on multiple variables. Almost all resources are expended on preserving this balance.

    This being my observation, I take issue with assumptions that large companies can "pivot" on a dime or that they can change their business models "when conditions are right". Consider Microsoft's dilemma. They have all the resources in the world and yet they could not pivot to take advantage of a change so mundane as a low power microprocessor (which enabled a mobile computer and hence a new ecosystem and profit model for software.)

    Or consider the dilemma of Apple which after building a successful computer business which included system software, could not pivot to license that system software so others could build computers with it.

    Or consider the dilemma of Nokia which had an early and large leadership in smartphones including having its own OS and platform and large volumes and users bases. It could not pivot to allow into an ecosystem and had all its advantages disappear.

    Each company thought they could manage change but none of them actually did.

    It's with this thinking about inertial navigation that came to consider the idea that Amazon has a flexible business model which, though unprofitable today, will be profitable some day.

    The premise that Amazon can, on a whim, change its business model from selling other people's products at a razor thin margin while investing in capital-intensive distribution to selling other people's products at a large margin while not investing in capital-intesive distribution is not credible.

    I would argue that Amazon's existing business model is a direct consequence of the market it's in: that it could not be anything else given the circumstances it finds itself in. Enlightenment may be an illusion.[*]

    That's not to say that there is no wisdom in the management of Amazon. Quite the contrary; recall the respect that's called for in creating a great business. Managing the business to this point was a work of decades of vision and creativity.

    What I take issue with is the premise that Amazon is the "anti-Apple" in its hunger for growth and patience for profits. Apple has its own "Amazon-like-business": iTunes has been growing at a steady 25% or more and it also has its ancillary zero-profit hardware analogue to the Kindle called Apple TV.  iTunes is a great business in the Amazon vein, harvesting hundreds of millions of users (and their credit cards.) Presumably iTunes could also some day "flip the switch" and become profitable, but something magical needs to happen. Something like becoming a payments processor or retailer of other things. Analyst beware however. There might be conditions that make such switch flipping extremely difficult.

    At an even deeper level, Apple and Amazon are much more alike than they are different. They are both hired for similar jobs (convenience, ease of use and a controlled, predictable environment for average users interacting with technology). They both focus on delighting customers and controlling all the variables which come into contact with that delight. They both have long-term views and are driven by vision rather than competition.

    Where they differ is in others' perception of sustainability. Whereas Apple is perpetually given an expected lifespan of less than a decade, Amazon is expected to have an indefinite lifespan. This is because Amazon is seen as having no competition and Apple is seen as having infinite competition. In other words, Amazon is perceived as a monopoly and Apple is perceived as the  innovator that is in a permanent state of being disrupted by the low end.

    I disagree with both assumptions. I've always thought Apple fragile but dedicated to moving into new markets as older markets are disrupted. It's a tough strategy and one which (literally) nobody believes possible. But I've also thought Amazon's monopoly status fragile. This too is not a popular idea but the company depends on many variables.

    Retail is hard and it is being disrupted by technology wielded well by Amazon. But it's also subject to further disruption. Amazon's job to be done can be done by alternatives. Buyers are typically hiring Amazon for convenience, not just price and ease of use is where the value is. But again, new information technology which makes shopping, discovery and delivery of products directly from the vendor, bypassing the aggregator (i.e. retailer) could shift value along the value chain yet again.

    By the time Amazon reaches some point of monopoly in distribution it could be too late to make the switch to profit generation.

    I don't want to suggest that failure is inevitable, but I want to point out that success is not certain by any means. Disruption happens.

    --

    * It's possible that Enlightenment is also an illusion at Apple. Even if they once had it, there are forces which act on companies that make them lose their wisdom.
  2. iTunes Update

    Research · 29 comments

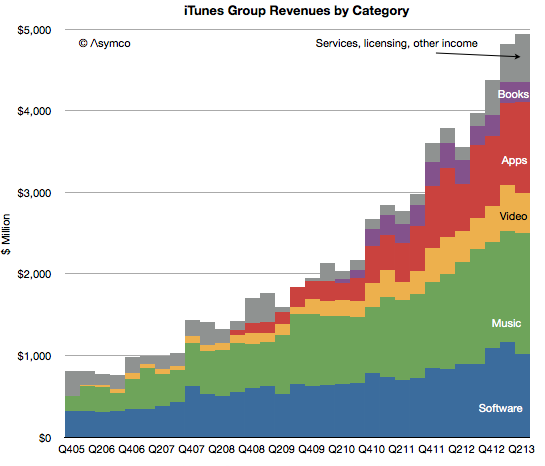
    In the latest quarter the iTunes group top line grew by 25%.

    Additional newly reported items:

    • Quarterly revenues dipped slightly to $4 billion (second highest after $4.1 billion last quarter).
    • iTunes Stores billings (i.e. gross content revenues) were $4.3 billion
    • Reached the best month and best week ever for App Store billings at the end of the quarter.
    • iTunes billings translated to quarterly revenue of $2.4 billion, up 29% from the year ago but flat q/q. Company reports “strong growth in revenue in both content and apps.”
    • New content added includes HBO GO and WatchESPN available on Apple TV. Apple TV catalog now includes over 60,000 movies and over 230,000 TV episodes.
    • Users have downloaded more than 1 billion TV episodes and 390 million movies from iTunes to-date. They are purchasing over 800,000 TV episodes and over 350,000 movies per day.
    • iOS developers have now created more than 900,000 iOS apps including 375,000 apps made for iPad. Apps created grew by 50,000 overall and 25,000 iPad apps.
    • Cumulative app downloads have surpassed 50 billion.
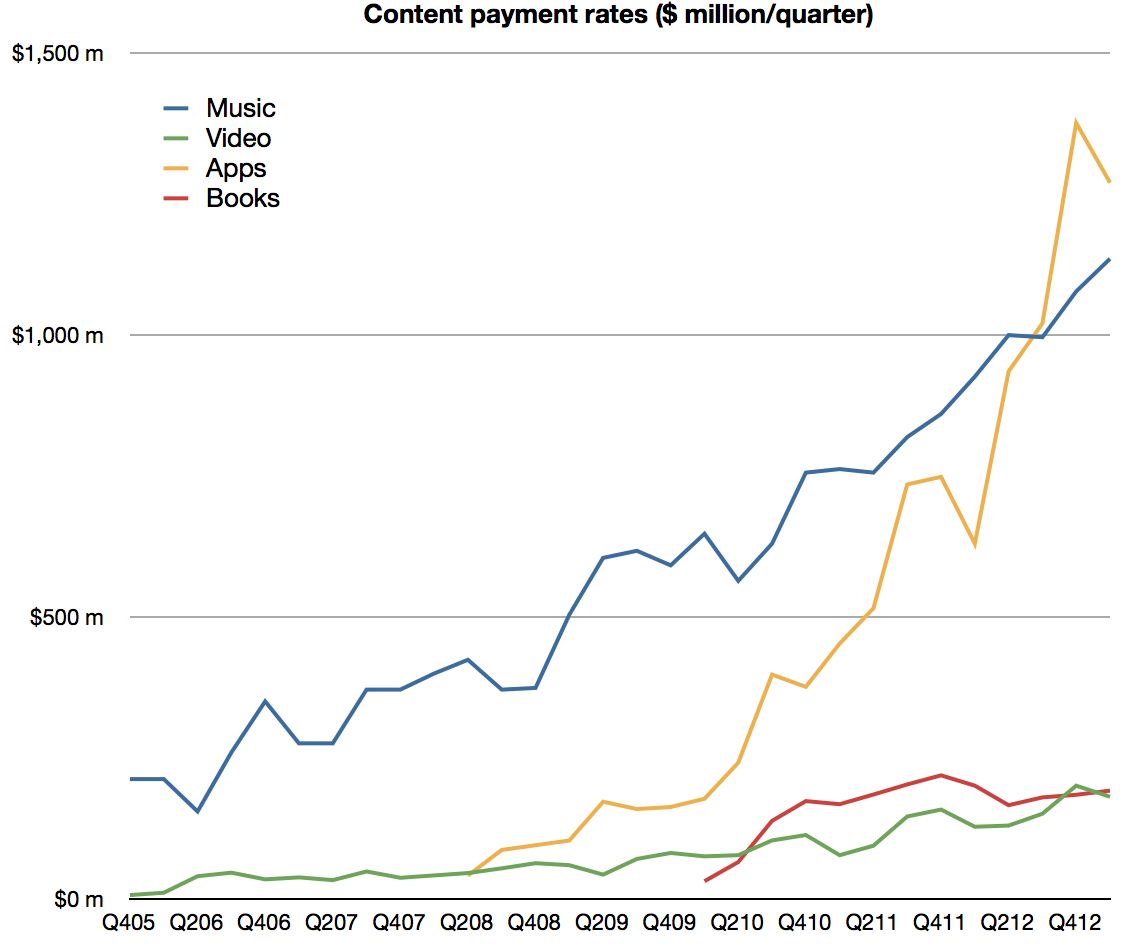
    • App developers are being paid at the rate of $1 billion per quarter.
    • App developers have been paid over $11 billion for their sales through the App Store (half of which was earned in the last four quarters.)
    • There are now over 320 million iCloud accounts
    • There are 240 million Game Center accounts
    • Almost 900 billion iMessages have been sent
    • Over a 125 billion photos have been uploaded and over 8 trillion notifications were sent.

    Some observations and estimates:

    • Music revenue growth remains at around 15% while video revenue growth remains around 25%
    • Apps continue to accelerate with a near doubling of revenues
    • Book revenues are contracting as pricing pressure is being felt
    • The software group grew moderately at 15% as Apple’s apps are reaching saturation within the iOS user base and as Mac sales stagnate.

    As a reminder, you can order the iTunes Business Review from the Asymco Store.


    Screen Shot 2013-08-05 at 8-5-4.21.54 PM
  3. That Competition Thing

    Research · 62 comments

    Bill, I think the smartphone market has always been competitive. [Only] the names have been changed.

    Tim Cook responding to Bill Shope's question on the competitive landscape, April, 2013.

    Indeed, over the years, the companies considered Apple's primary competitor have been many.

    In years gone by in the phone market there were RIM and Nokia and Palm and HTC. In the iPod era there was Creative and Sony and innumerable others long forgotten (not to mention the tyranny of DRM).

    Even today we struggle to decide whether Apple competes with Google first or Samsung. Or perhaps with the iPad it's with Amazon or  Microsoft. Or maybe iTunes is threatened by Netflix or Spotify. The Mac surely competes with HP and Dell and Toshiba. What about iCloud? Clearly it's Dropbox or Google Drive. iWork? Both Office and Google Docs.

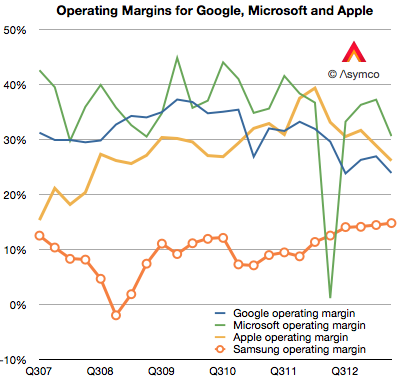
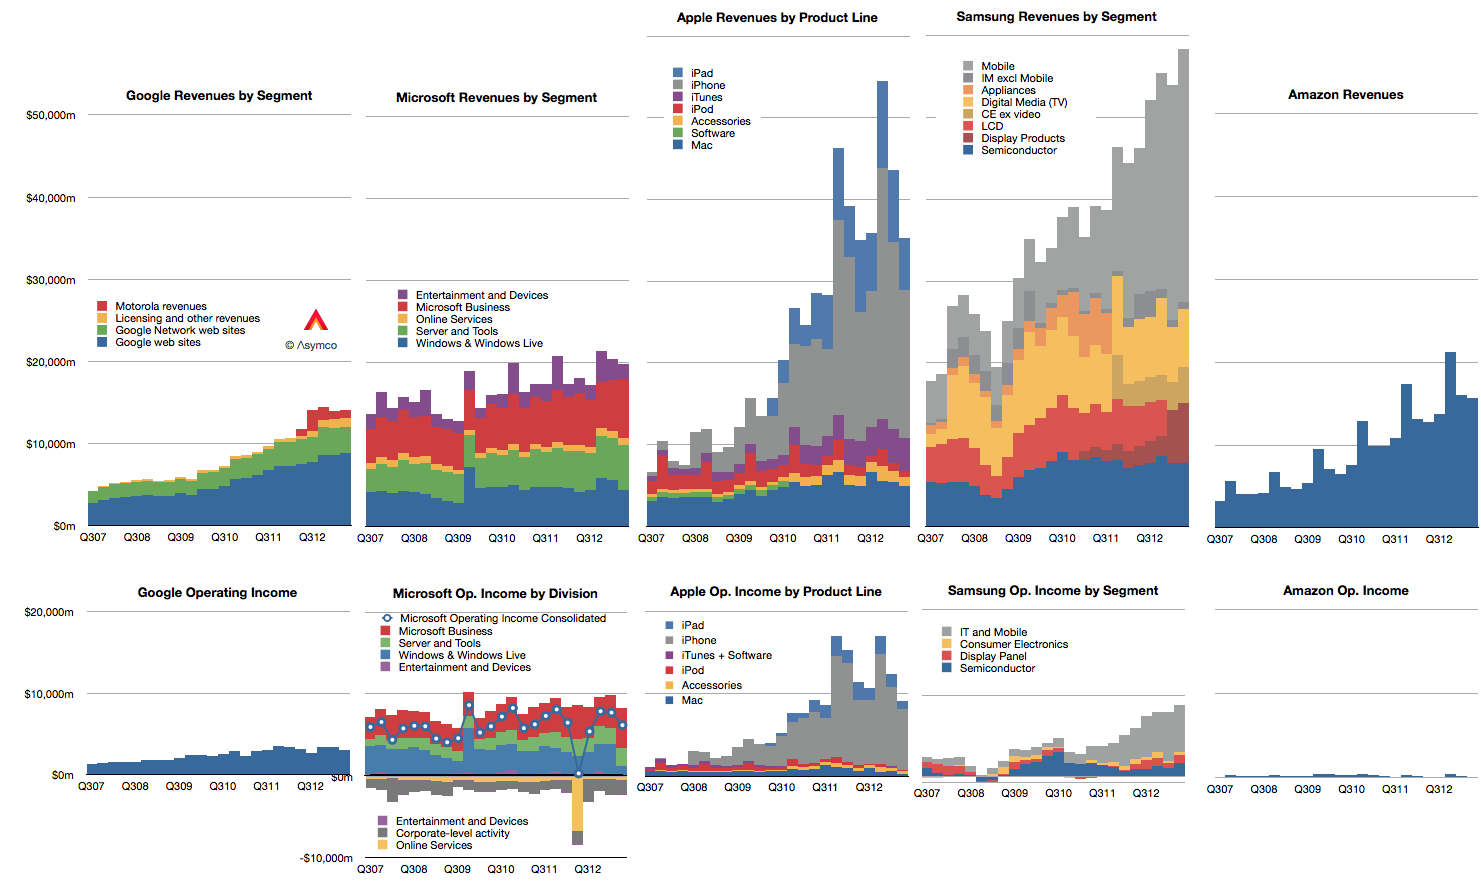
    Doing a competitive analysis for Apple is then mostly a struggle of whom to compare it to. So forgive me that I only track the few challengers shown below.

    Screen Shot 2013-08-13 at 8-13-2.14.59 PM

    Note also that these companies all may compete with Apple to some degree but they may not compete with each other. Competition, it seems, is not transitive.

    There isn't much that I can observe in the data that hasn't already been observed. Google shows steady but not spectacular growth in revenues with decreasing margins. Microsoft shows even more modest growth in revenues with flat earnings. Apple growth is moderating from near vertical while earnings pause. Samsung has great growth but there is a similar set of doubts about its sustainability and finally, Amazon continues to grow the top line by 20% and  has nothing to show for it.

    Operating margins have mostly fallen with the exception of Samsung whose increasing reliance on smartphones has led to a modest increase, though not nearly to the level of the others. (Amazon, lacking in profits, cannot be compared.)

    Screen Shot 2013-07-30 at 7-30-10.54.44 PM


    In summary there is little change to report.

    Except that it's been reported that in the last quarter Samsung managed to "dethrone" Apple from the phone operating profit crown. This is a matter of estimates and for that we need to understand clearly the assumptions.

    I estimate that this is not the case. That indeed Apple remains most profitable phone maker by a wide margin.

    To estimate operating margins you need to estimate gross margin and the allocation of operating expenses (SG&A and R&D) to a particular "division" or product line. The problem is that Apple does not operate as a divisional organization so its marketing and R&D budgets (i.e. people) are not assigned permanently. You have to move them around based on whatever is being worked on at any given time.

    What's more, we need to account for the huge SG&A costs associated with iTunes and Retail. They both consume vast resources which cannot be allocated directly to any product. There are 41,000 people working in retail.  Also, some of the expenses for iTunes are overhead and cannot be considered cost of sales. That's also SG&A. Then there's corp research and design (Mansfield and Ive), which are not allocated to any particular product. When you slice out these costs, there is very little to apply to iPhone, etc.

    So if (and it's a big, sanctimonious if) you want to cast iPhone out as a separate business unit, it would be wildly profitable. There is a huge gross margin of 46% (this assumes a cost per unit of $316) and only another 5% of sales spent on engineering and marketing leaves a 41% operating margin or $7.4 billion. (Why only 5%? Because there's only 10.8% to allocate and after taking out iTunes, Retail you're really only left with 4.49% for SG&A and 3.3% for R&D or 7.79% so 5% is about two thirds of the operating budget).

    If you take all of Samsung's IM division which is PCs, Tablets and phones their operating profit was only $5.6 billion.

    You can see the difference in the grey areas of operating profit in the first graph above.

    Bear in mind that this is still an artificial comparison. The split of profit between product groups is not only an estimate by the analyst, it would be an estimate for Apple itself since it has only one P/L.

  4. Measuring the iTunes video store

    Research · 41 comments

    It's been five years since we had an update on TV show downloads and six years since we've had an update on movie downloads from Apple. In Q3 2008 Apple announced 200 million TV show downloads and in Q2 2007 2 million movies. That's a long period with no information making a tough extrapolation to the present.

    Nevertheless, I tried. My estimates for these two quantities were 963 million TV Shows and 108.2 million movies to date.

    So I was quite surprised to see that figures for both TV show downloads and Movie downloads were published today. The figures were 1 billion and 380 million respectively.

    My TV show forecast has proven to be very accurate but I severely underestimated movie download rates. Apple states that the movie download rate is 350k/day. My estimate  was only about 126k/day.

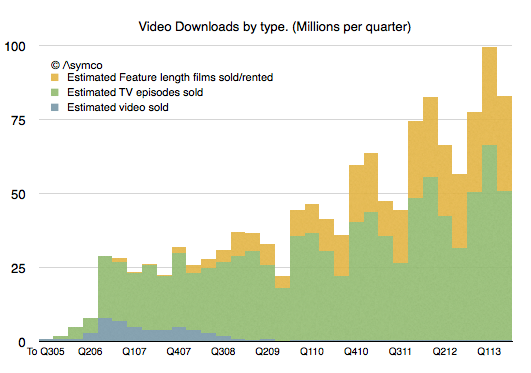
    After adjusting for the new data, the picture of downloads that emerges looks like this:

    Screen Shot 2013-06-19 at 6-19-6.20.31 PM

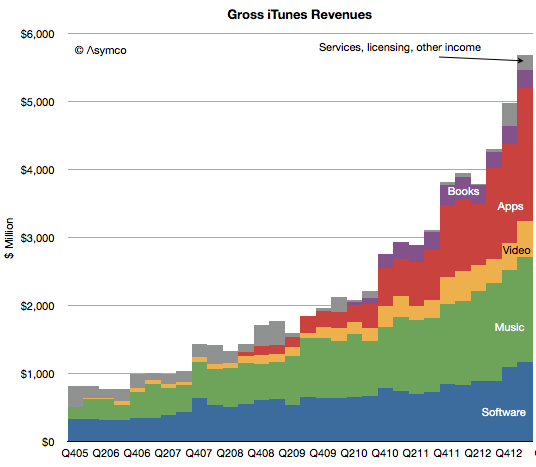
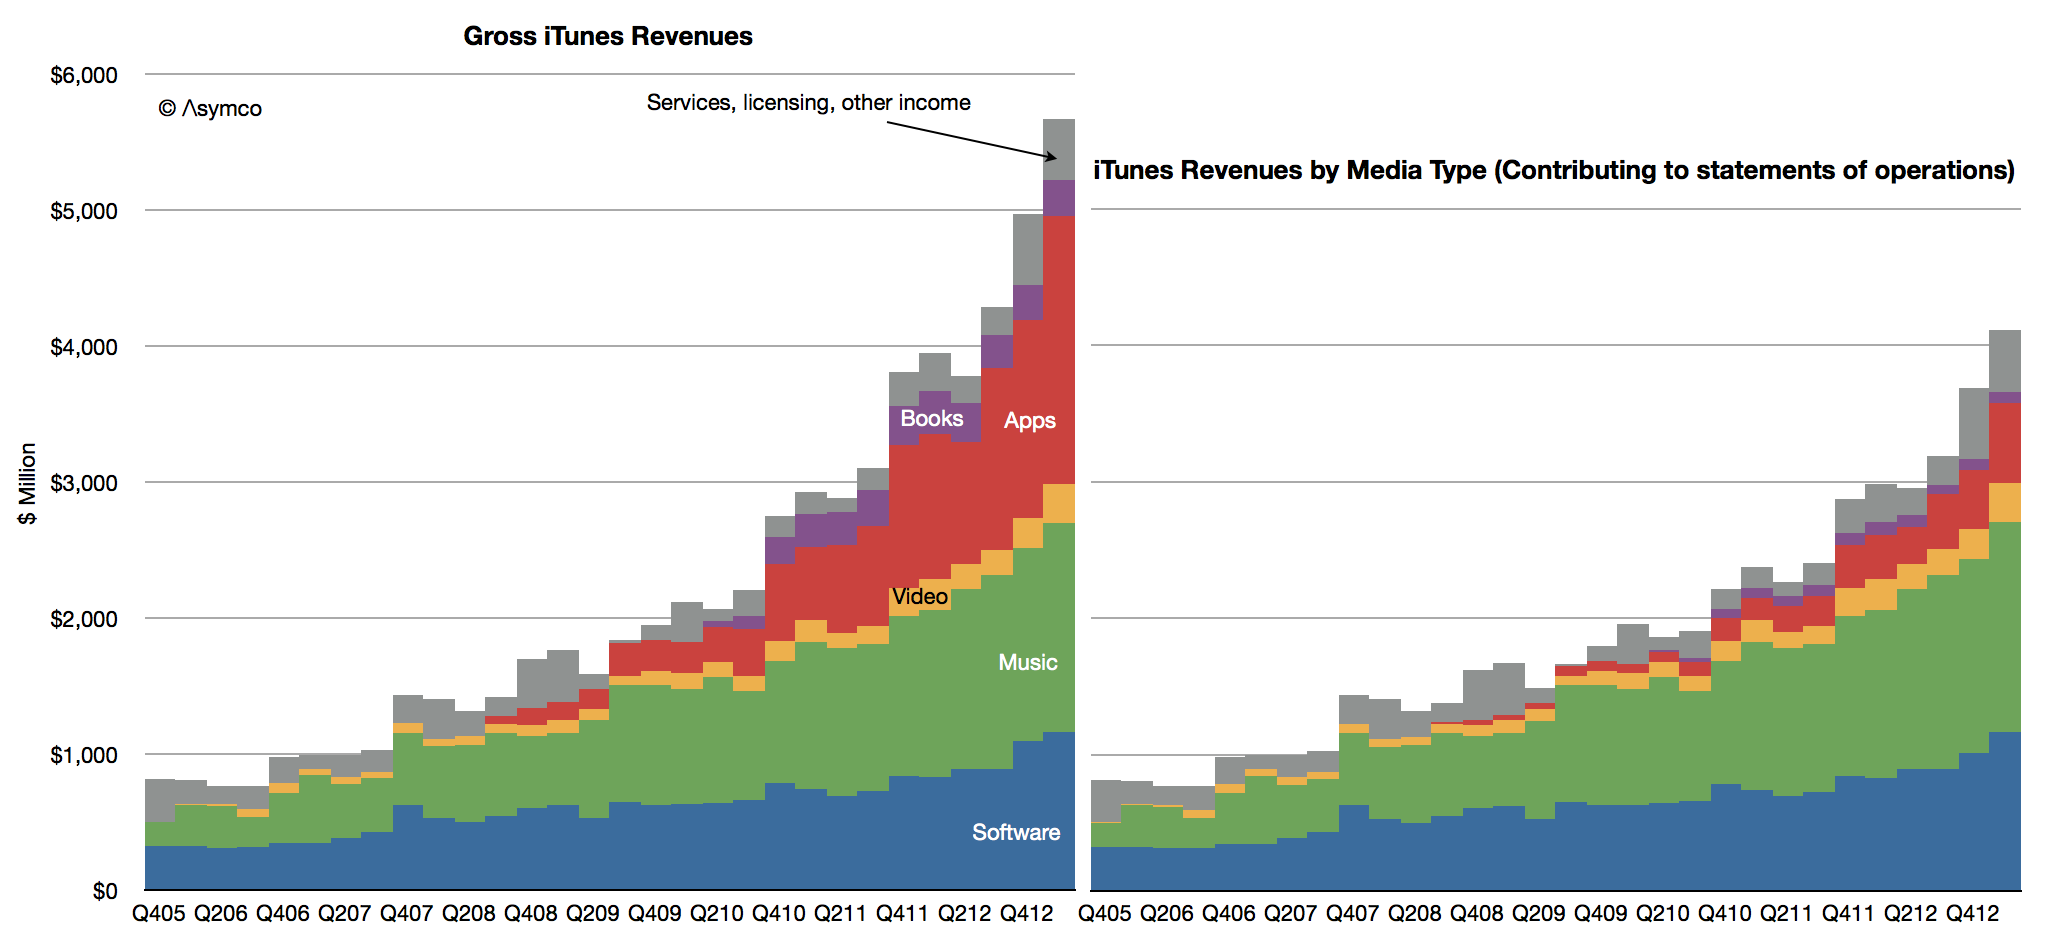
    The overall iTunes gross revenues by sub-component becomes:

    Screen Shot 2013-06-19 at 6-19-6.22.04 PM

    As a result, my new estimate for the rate of spending on iTunes video is about $1.75 billion/yr. This is much more substantial than prior estimates mainly because movies are much more valuable. A tripling of the download rate shows up as a significant rise in the profile of video vis-à-vis the other media types.

    Apps and software are firmly defined and music was somewhat clear. The upward adjustment in Video means that I have to reduce either Music or services. I presently am reducing service revenues but might adjust music as well.

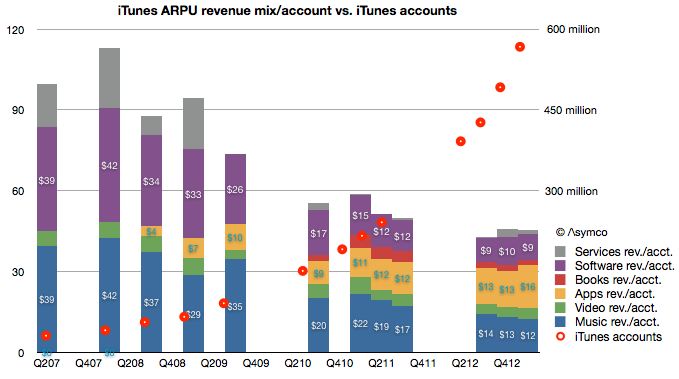
    The overall picture of iTunes is becoming clearer every day. We have more information about number of users (575 million), what they spend on media and software and services ($20 billion/yr.) and, increasingly what they spend on each media type (about $9/yr on Software, $2/yr on books, $16/yr on apps $12/yr on music and $4/yr on video.)

    Screen Shot 2013-06-19 at 6-19-6.34.18 PM
  5. What's an Apple user worth?

    Research · 85 comments

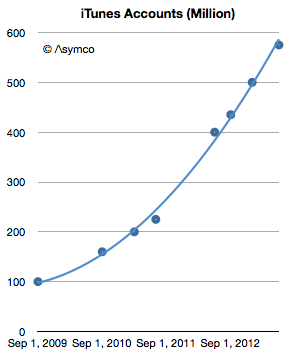
    This week Apple announced that iTunes has 575 million accounts. This is the 8th update (that I know of) over the last four years. The history of this data is shown in the following graph.

    Screen Shot 2013-06-14 at 6-14-1.13.02 PM

    The number of accounts has increased by almost a factor of six since late 2009. It amounts to an account growth rate of about 500,000/day or 44% compounded annually. Not bad, but along with this increase what happened to revenues per user?

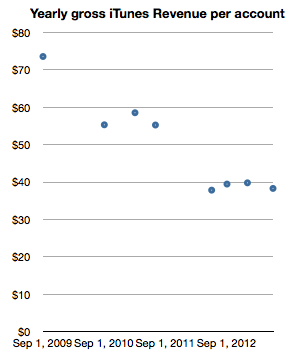
    Looking at iTunes revenue (gross) reveals a picture of revenues/account, shown below:

    Screen Shot 2013-06-14 at 6-14-1.13.11 PM

    This can be read as: "Each of the current 575 million accounts generates about half the revenue of the 100 million accounts of 2009." One would expect such a decline as an user base expands and this approximate 50% decline in revenues per account seems reasonable for a six-fold base increase. In absolute terms the graph shows that an iTunes account generates about $3.2/month in transactions.[1]  Put another way, during the last year, an average of $40/yr of economic value is generated by every iTunes account.

    Stretching further, one could also use the 575 million iTunes accounts as a proxy for "the Apple customer base". The assumption would be that iTunes accounts are attached to some Apple product, be it an iPhone, iPod or Mac. As a bounds check, a total of 865 million Apple devices (which interact with iTunes) have been sold since 2007. Assuming 575 million users does not seem to be a contradiction.

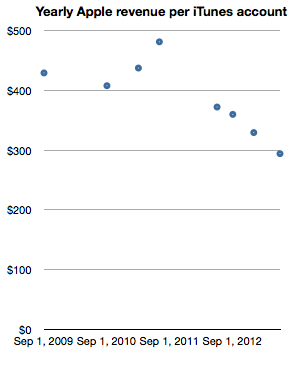
    The logic deployed would be that it's unlikely for a consumer to have an iTunes account without owning or using an Apple product. If we take this leap in logic then it would make sense to measure Apple (not just iTunes) revenues per iTunes account. In order to smooth out seasonality I took trailing twelve months' average quarterly revenues and measured the following company revenues per iTunes account.

    Screen Shot 2013-06-14 at 6-14-1.13.19 PM

    Note again the reduction in revenue per "customer" as the base grows. The reduction is less pronounced however, with about one third lower spending for a sextupling of the base. One can read this graph as "Three years ago an Apple customer used to spend $400/yr on Apple products but as the number of users increased six-fold the spending decreased to about $300/yr per customer."

    The practice of valuing a company by the rate of spending of its customer base is not uncommon, especially when the customer base is relatively loyal. Apple emphasized the importance of customer satisfaction (and, implicitly, loyalty) during its WWDC presentation. It was singled out as the most important metric they track. So perhaps valuing Apple itself on the basis of repeat purchase behavior should be considered.

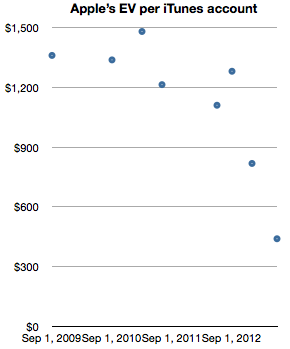
    When framing the value of of the company itself as a function of users (in the form of iTunes accounts) we get the following graph.

    Screen Shot 2013-06-14 at 6-14-1.13.26 PM

    The graph measures the Enterprise Value (i.e. Market cap minus cash) on a per-customer (i.e. iTunes account) basis.

    It shows that for a number of years—from 2009 until late 2012—Apple's users were valued (implicitly by the stock market) as likely to create a net present value of about $1200 in earnings. The current value is about a third of that, or $440 in earnings. Today's expectation is therefore that each current customer will buy the equivalent of 1.8 iPhones. And nothing more, ever. A few months ago it was expected that each customer would buy three times as much.

    Although the rate of spending of each customer is decreasing, the number of new customers is increasing more rapidly. As this is happening the company's equity is being priced such that an Apple user is considered less than half as valuable as she used to be—from 3.2x revenues to 1.5x revenues. This change in user value has been quite abrupt, happening only within the last nine months. What could justify a drop in user value would be a drop in customer satisfaction or loyalty. So far, I have seen no evidence of this happening.

    --

    Notes:

    1. Note that these revenues include App Store, Music Store, TV Shows, Movies, iBookstore, Mac App store, and Services (including iCloud). Some of this revenue is not reported as part of Apple's statement of operations since some content is treated with an agency model.
  6. The allure of iTunes

    Research · 132 comments

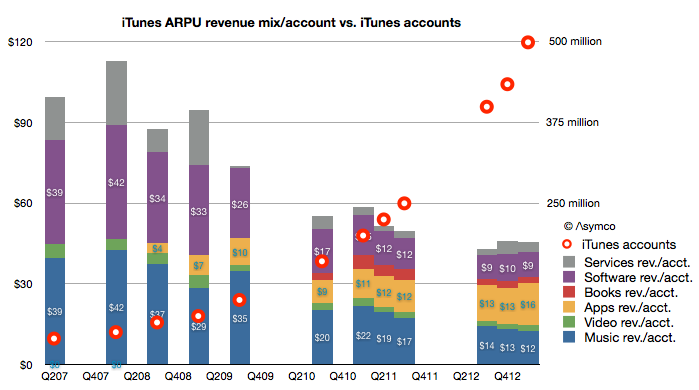
    My estimate of last quarter's iTunes gross revenues suggested a spending rate of $40 per iTunes account. It would make sense to consider how that figure changed over time. The following graph shows the pattern:

    Screen Shot 2013-05-14 at 5-14-9.49.40 AM

    You can read each bar in the graph as the total "ARPU" or average revenue per iTunes user[1].

    I overlaid a graph showing the total number of accounts as reported by Apple to the (retroactively) estimated revenue structure. Account totals are measured with the right axis and ARPU with the left.  Note that I also broke down each component of iTunes as currently defined (Music, Video, Apps, Books, Software and Services.)[2]

    The time frame covered is from Q2 2007, or the quarter prior to the iPhone launch. A few patterns emerge:

    • When there were no iOS devices (and hence no iOS apps) the revenues of iTunes consisted mostly of music sales. Those revenues were, on a per account basis, roughly comparable with Apple's Software revenues.
    • As iOS devices proliferated, the number of accounts (and users) grew. They doubled in the first two years (2007 to 2009) and doubled again in the following year (2010) and doubled again the following year (2011) and doubled again in the following 18 months. This rate of growth was accompanied by a reduction in the iTunes ARPU of about 50% (from $99 to about $45).
    • The reduction in ARPU has moderated in the last few quarters. ARPU fell 10% from $50 to $45 during the last doubling of accounts (from 225 million iTunes accounts to  500 million accounts.) In contrast ARPU fell 20% from $74 to $58 during the penultimate doubling (from 100 million to 200 million)
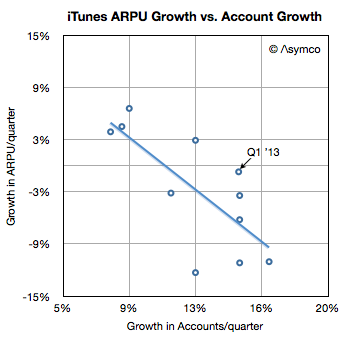
    • However, growth in accounts is broadly inversely proportional to growth in ARPU. In other words, the faster the growth in users the faster the decline in ARPU. The recent moderation in ARPU erosion is also coupled to a moderation in user growth (most recent doubling took 18 months vs. 12 months for previous doubling.) This is as would be expected as a broader, later user base tends to consume less than a narrow, early base. This can be seen in the following scatter plot:
    Screen Shot 2013-05-14 at 5-14-10.35.02 AM
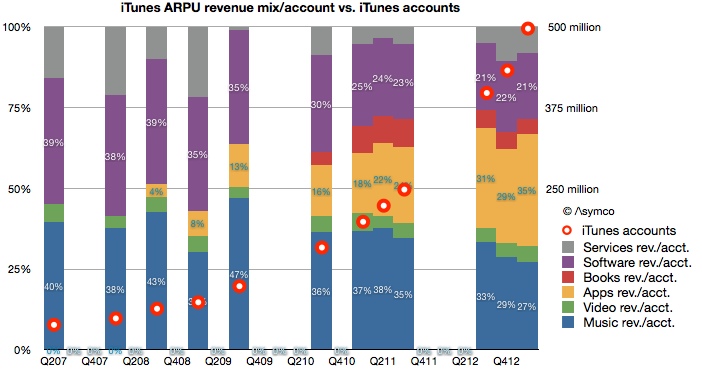
    • When seen as a percent of mix, Apps have grown to be the largest component of iTunes spending. Apps have 35% "share of wallet" while music has dropped steadily from 40% to 27% (or $39 to $12/yr.) This is shown in the following graph.
    Screen Shot 2013-05-14 at 5-14-10.34.45 AM

    As apps have grown to consume more and more of users' time it stands to reason that they should consume more and more of users' wallets.

    And as accounts reach one billion, we can begin to think about the disruptive impact on other media types. Whereas video, books and music are targeted to smaller user bases, apps are broadly consumed. Developers like Rovio or Supercell can offer their products to billions while TV producers can only hope for millions. Apps are becoming the universal medium for entertainment and iTunes the universal distributor.

    Talent is catching on to this faster than those who manage and distribute their work. The inevitable result will be a mass migration of talent away from the established content industries. Old media won't fade due to a loss of users. It will fade due to a loss of talent.

    --

    Notes:

    1. An account is not necessarily a user so perhaps more appropriately the acronym should be ARPA (average revenue per account). Unfortunately that acronym is taken.
    2. The complete model is available for purchase through Asymco Store.
  7. iTunes users spending at the rate of $40/yr.

    Research · 77 comments

    In the latest quarter the iTunes top line grew by 32%. Additional newly reported items:

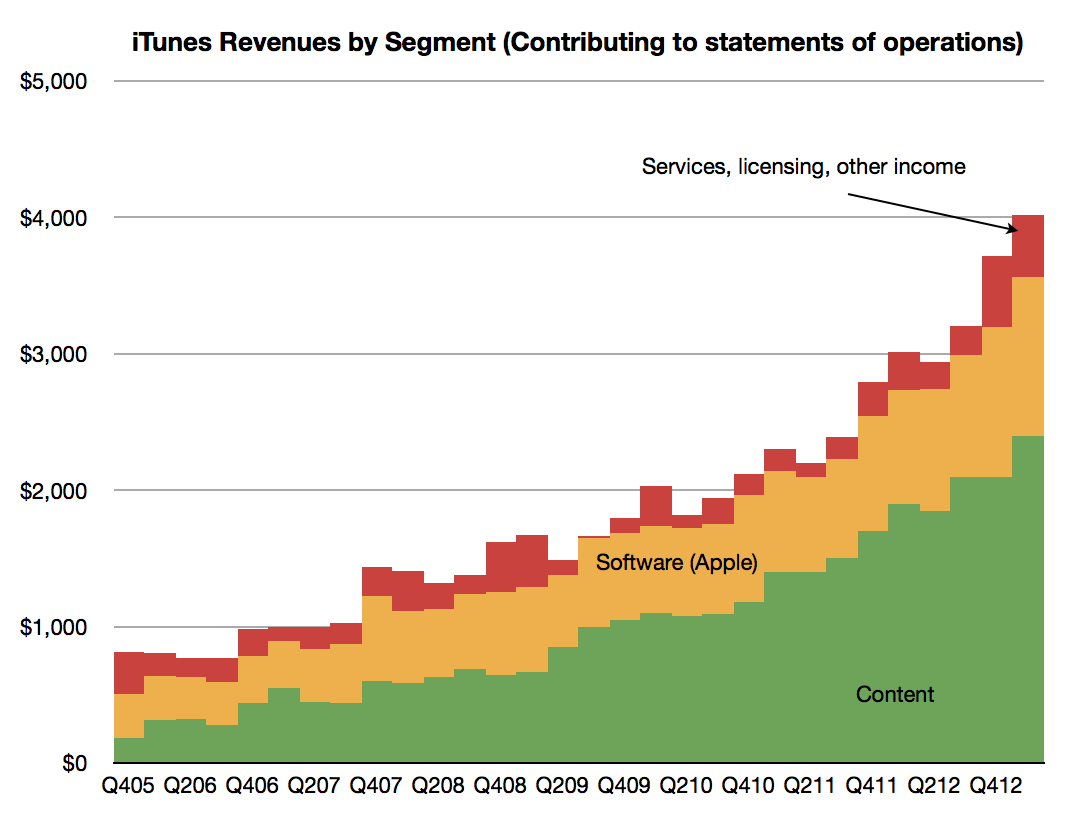
    • Quarterly revenues topped $4 billion (a new high) and the company suggests that this rate is maintainable by stating it has a “$16 billion annual run rate”. The pattern of revenues is shown below.
    Screen Shot 2013-05-12 at 5-12-8.12.30 AM
    • The content portion of iTunes revenues was $2.4 billion, up from $2.1 billion sequentially. Growth into Q1 is not unusual as many holiday iTunes gift cards are redeemed during January.
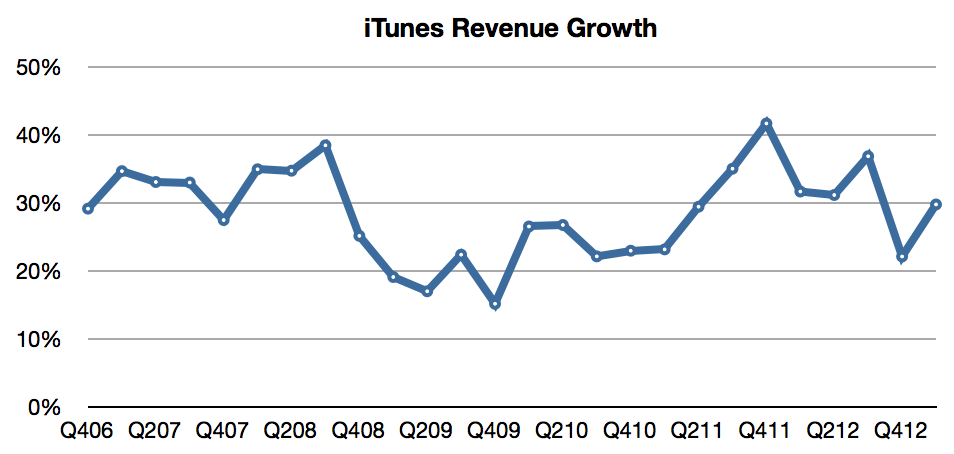
    • Revenue growth has been surprisingly steady, averaging 29%/quarter for more than six years.
    Screen Shot 2013-05-12 at 5-12-8.20.06 AM
    • Music is now available in 119 countries.
    • The Music catalog now consists of 35 million songs.
    • Movies are available in 109 countries. 60,000 titles are offered.
    • iBookstores are present in 155 countries offering 1.75 million iBooks.
    • There are iTunes App Stores in 155 countries whose residents make up about 90% of the world’s population.
    • iOS developers have created more than 850,000 iOS apps, including 350,000 made for the iPad.
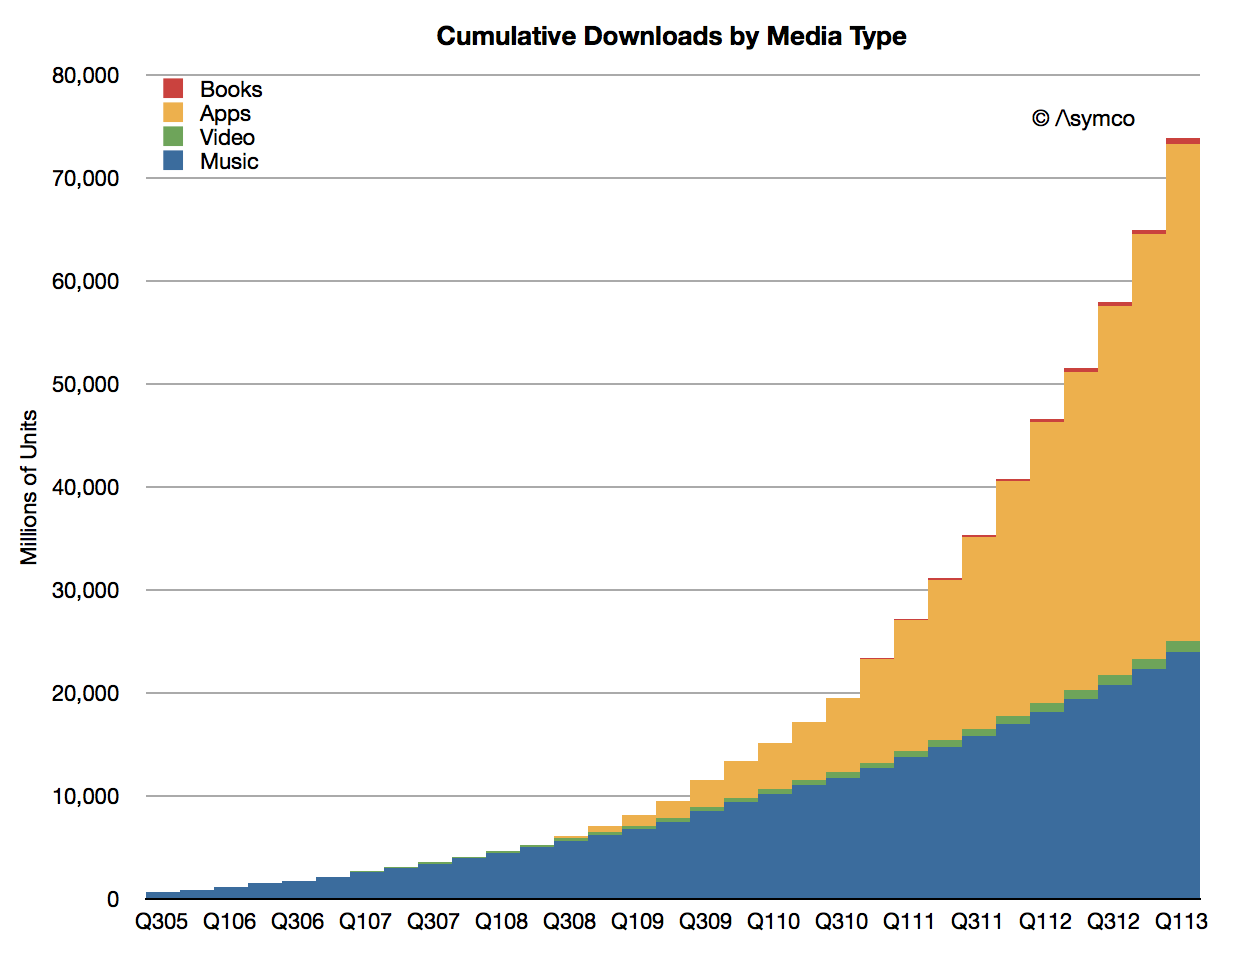
    • Cumulative app downloads have surpassed 45 billion and are on track to reach 50 billion at time of writing (estimated to be reached mid May).
    Screen Shot 2013-05-12 at 5-12-8.21.31 AM
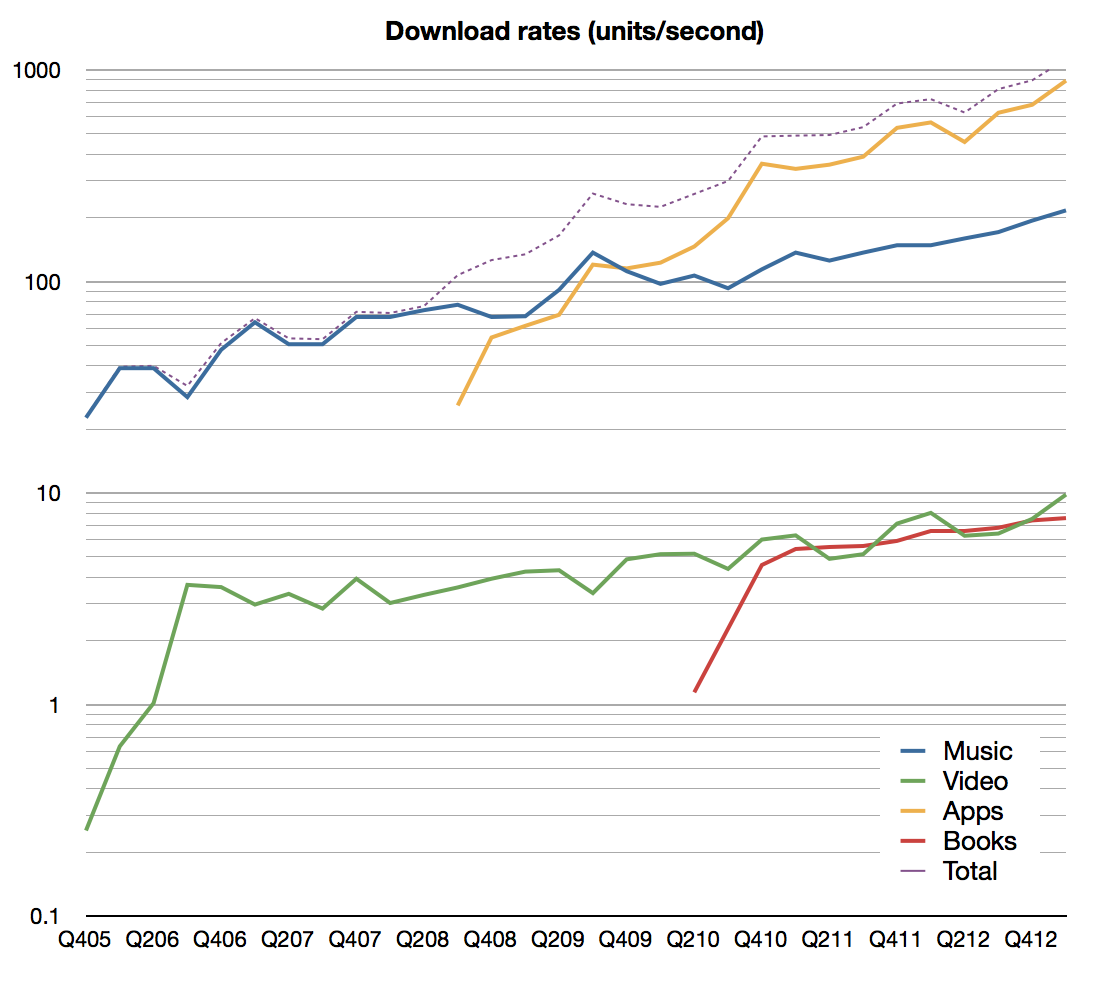
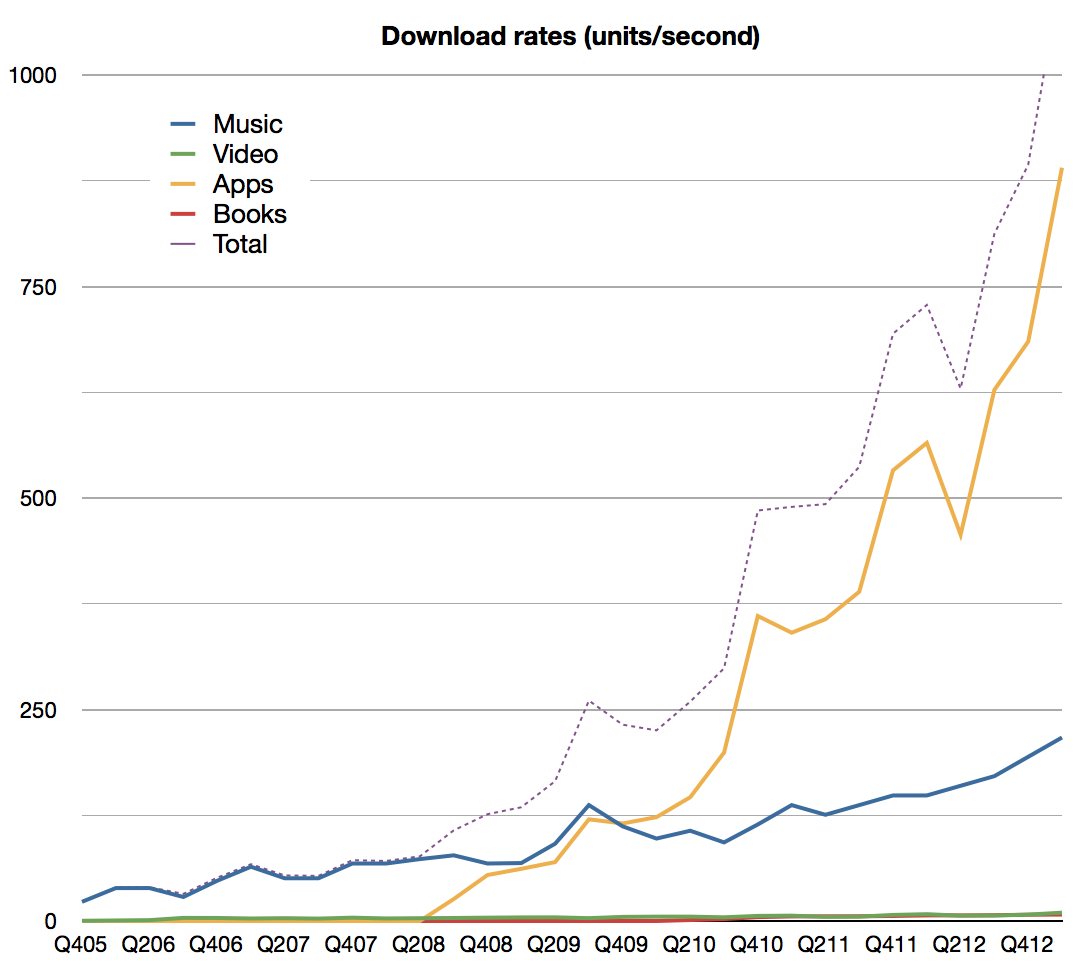
    • The company reports that over 800 apps are downloaded per second. Including all media, the download rate is now above 1000 items per second. Estimated download rates by media types are shown below (note: first graph is plotted on a log scale):
    Screen Shot 2013-05-12 at 5-12-8.34.37 AM


    Screen Shot 2013-05-12 at 5-12-9.07.49 AM


    • App developers have been paid over $9 billion for their sales through the App Store including $4.5 billion in the most recent four quarters. I estimate the split between media types as follows:
    Screen Shot 2013-05-12 at 5-12-9.13.48 AM
    • Canalys estimates that sales from iTunes App Store accounted for 74% of all app sales worldwide in the March quarter.
    • iOS app revenues more than doubled year-over-year.

    Including all (gross[1]) content revenues, the sales rate is now nearly $5 billion per quarter ($4.94 billion). Including services, the iTunes consolidated business cleared over $5.5 billion.

    Screen Shot 2013-05-12 at 5-12-9.18.30 AM

    In March Apple reported that they have 500 million iTunes so one way to think about the iTunes business is to say that  iTunes users purchase content and services at the rate of about $40 per year.[2]

    Bless them.

    ---

    Notes:

    1. "For third-party applications sold through the App Store and Mac App Store and certain digital content sold through the iTunes Store, the Company does not determine the selling price of the products and is not the primary obligor to the customer. Therefore, the Company accounts for such sales on a net basis by recognizing in net sales only the commission it retains from each sale. The portion of the gross amount billed to customers that is remitted by the Company to third-party app developers and certain digital content owners is not reflected in the Company’s Consolidated Statements of Operations." From Apple SEC filing 10-K, October 2012.
    2. Apple users spend about $1/day for each Apple device in use making the iTunes franchise an incremental 11% marginal revenue source (assuming one device/user.)
  8. Happy Birthday iTunes Store

    Research · 16 comments

    iTunes (including software and services) revenues in Q1 topped $4 billion and were 30% higher than (re-stated) 2012 Q1 revenues. Accompanying this revenue figure were additional data points from the company:

    • Cumulative app downloads have surpassed 45 billion
    • Payments to developers reached a cumulative total of $9 billion
    • Payments to developers were $4.5 billion in most recent four quarters
    • Now paying $1 billion to developers every quarter
    • 800 apps are downloaded every second
    • iOS app revenues doubled since year-ago quarter
    • App Store accounted for 74% of all app sales in the quarter (citing Canalys)
    • App stores reach customers in 155 countries (850k Apps, 350k iPad apps)
    • iTunes music downloads are available in 119 countries (35 million songs)
    • Movies are sold in 109 countries (60k titles)
    • iBookstore is available in 155 countries (1.75 million titles)

    This data allows for a few inferences:

    • Nearly 70 million apps are downloaded every day
    • The average revenue per game is about 23 cents
    • Gross app revenues are about $16 million per day (of which 11 million is paid to developers.)
    • Gross iTunes revenues were $5.4 billion last quarter of which I estimate:
    •  …App revenues were $1.6 billion
    •  …Music revenues were $2.2 billion
    •  …Video revenues were $287 million
    •  …Book revenues were $312 million
    •  …Apple's software generated $1 billion
    • In addition, I estimate that Services generated $100 million

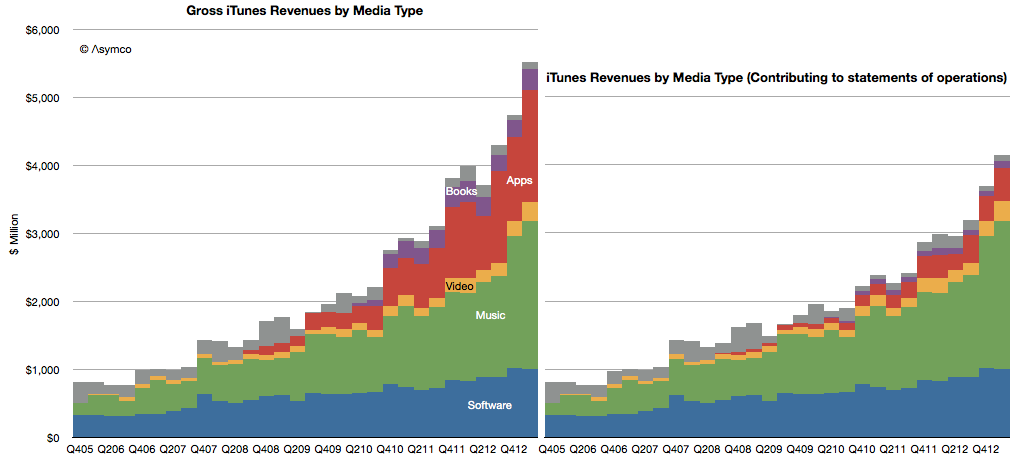
    Note that there is a difference between the amounts transacted through the store and what the company reports. The difference is shown in the following graph

    Screen Shot 2013-04-29 at 4-29-1.02.50 PM

    To mark it's 10th year, I wrote a segment for Billboard Magazine describing what iTunes has become. I suppose it's easy to become numb to these numbers, but there is perhaps one way to look at iTunes that is still compelling:

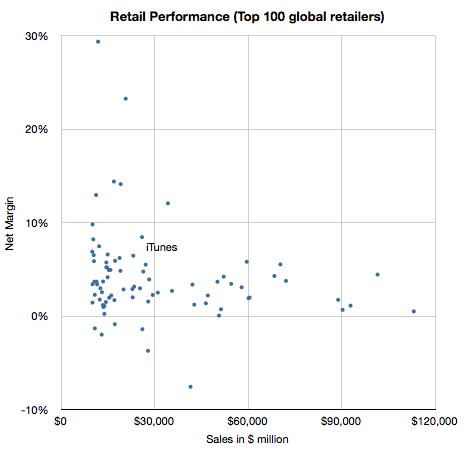
    Selling $20 billion a year would put iTunes in the top 20 US retailers and top 50 Global retailers.

    Screen Shot 2013-04-29 at 4-29-1.36.41 PM

    Not bad for a 10 year old.

  9. Apple retail vs. Amazon retail

    Research · 55 comments

    As part of a continuing series on the iTunes economy I described how iTunes fits within Apple's overall revenue and cost structure. The operation is a modest contributor accounting for single-digits percent of revenue and operating margins.

    One additional question is how does iTunes compare with other non-Apple retail businesses. The obvious comparable businesses are Google Play and Amazon's digital content businesses. Unfortunately we can't compare iTunes with Google Play because Google does not reveal any details about Play revenues (or units sold/downloaded or payments to developers or any other data.)

    Also unfortunately, we can't compare iTunes with Amazon digital sales because Amazon does not provide that detail either.

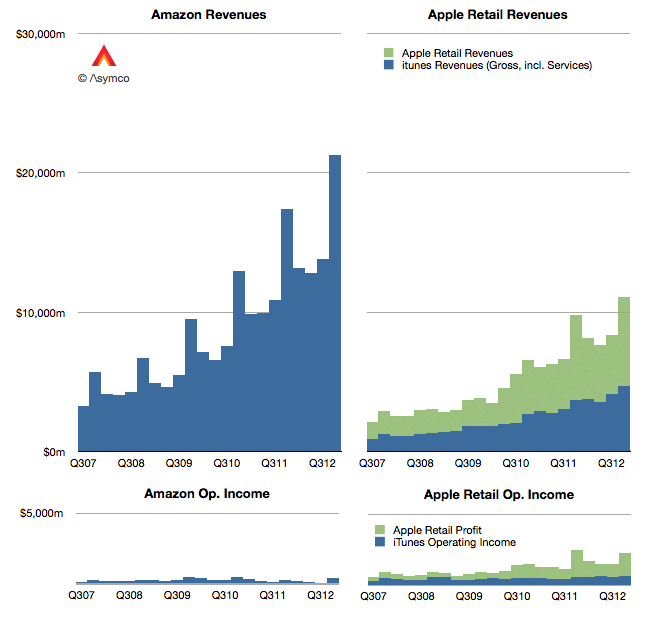
    What we do have is Amazon's overall revenues (and operating margin.) So that's what I have compared:

    Screen Shot 2013-03-27 at 3-27-2.09.30 PM

    Since we have Amazon's overall retail revenues it seemed fitting to also add Apple's physical store retail data on top of iTunes for additional perspective.

    Here are some observations:

    1. Since 2008, Amazon's sales grew by a factor of 2.18. Apple's combined iTunes+Retail grew by 2.14x.
    2. Apple's gross retail revenue was $11.1 billion in Q4, 52% of Amazon's overall revenues.
    3. Apple's operating income from retail in 2012 was $6.8 billion, over ten times Amazon's $676 million.

    Although Apple's overall retail operations are only about half of Amazon's they are far more profitable on an operating level. They are also growing at a similar pace. Amazon as an equity is priced at approximately twice sales. By that ratio, Apple's retail business would be worth $70 billion. Of course, that valuation presumes that, as with Amazon, operating profits are disposable.

  10. iTunes Segment Revenues in Context

    Research · 23 comments

    In the last few posts I estimated the iTunes economy in some detail. In absolute figures, the revenues and cost structures of iTunes are substantial:

    • 6.3 billion transactions in the last quarter
    • $4.6 billion consolidated revenues (including software & services)
    • $3.3 billion in content payments
    • $650 million in operating income

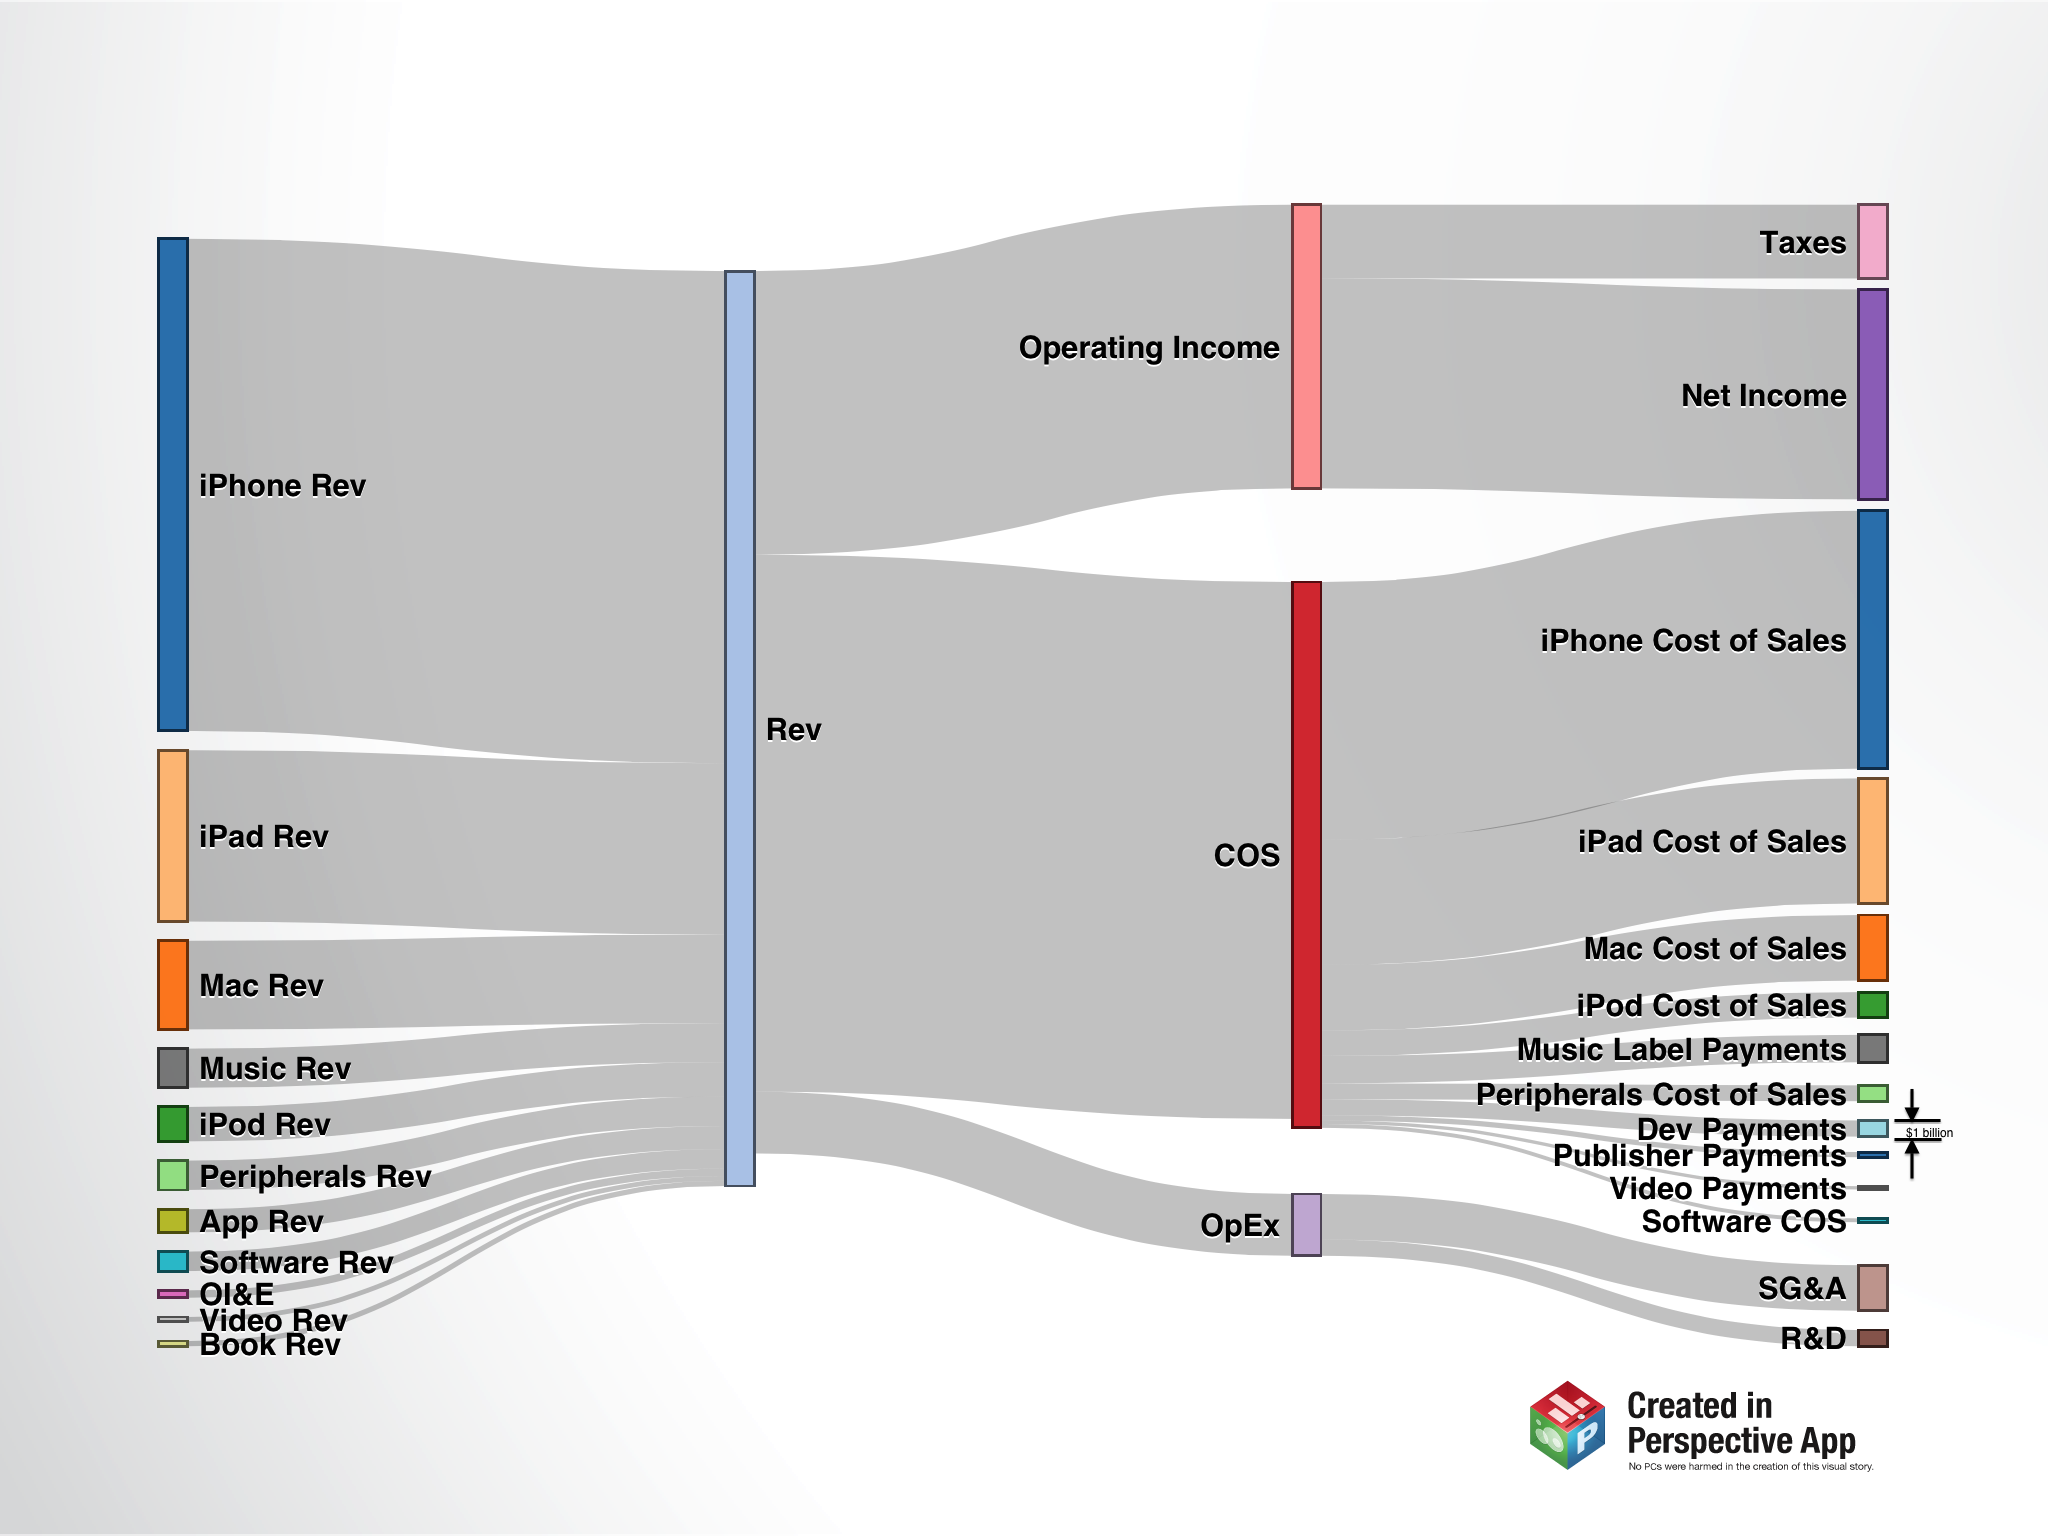
    However, as a part of the entire Apple revenue model, iTunes appears to be a small contributor. The following diagrams shows where revenues came from and where they were spent during the last quarter

    Sankey-Income1

    A few notes:

    1. Click on image to enlarge. The graph was produced using an iPad and it is rendered at iPad retina resolution.
    2. The data covers only the Fourth Calendar Quarter of 2012.
    3. For scale reference, "Dev Payments" equals $1 billion (as marked.)
    4. When zoomed in, each pixel represents about $50 million (vertical dimension).
    5. Revenues shown are "gross" and therefore greater than reported. See post on iTunes Revenue Recognition. �The same reason affects the total Cost of Sales (COS).
    6. Sources of revenue are ranked according to size. Note that Music is higher than iPod or Peripherals and Apps are higher than Software.
    7. Different Cost of Sales components are also ranked by value.
    8. iTunes which is the sum of Music, App, Software, Video and books makes up about 7% of overall revenues but 10% of costs of sales and hence contribute about 4% (est.) of total operating margin.

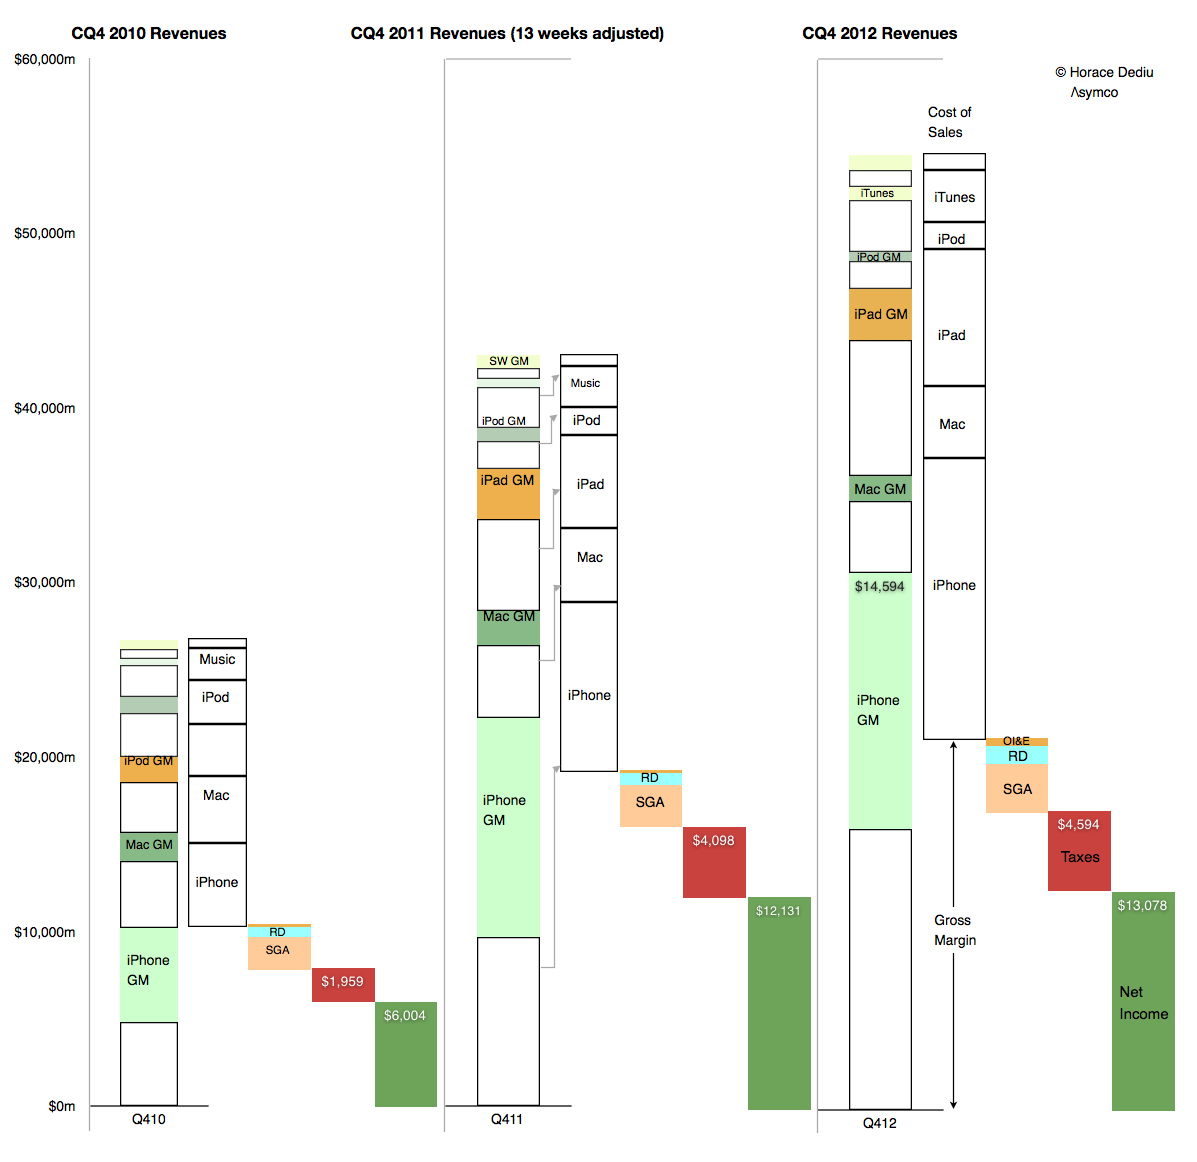
    A three year view of the same data is shown below:

    Screen Shot 2013-03-26 at 3-26-2.07.06 PM
  11. So long, break-even

    Research · 113 comments

    The following is another excerpt from a report titled "iTunes Business Review" which will soon be available for purchase through the Asymco Store. If you are interested in the product please get in touch.

    ---

    iTunes store will be 10 years old next month. From its inception Apple has stated that it aims to run the store "at break-even".  The business has grown so rapidly however that its profit-free nature has come under severe pressure.

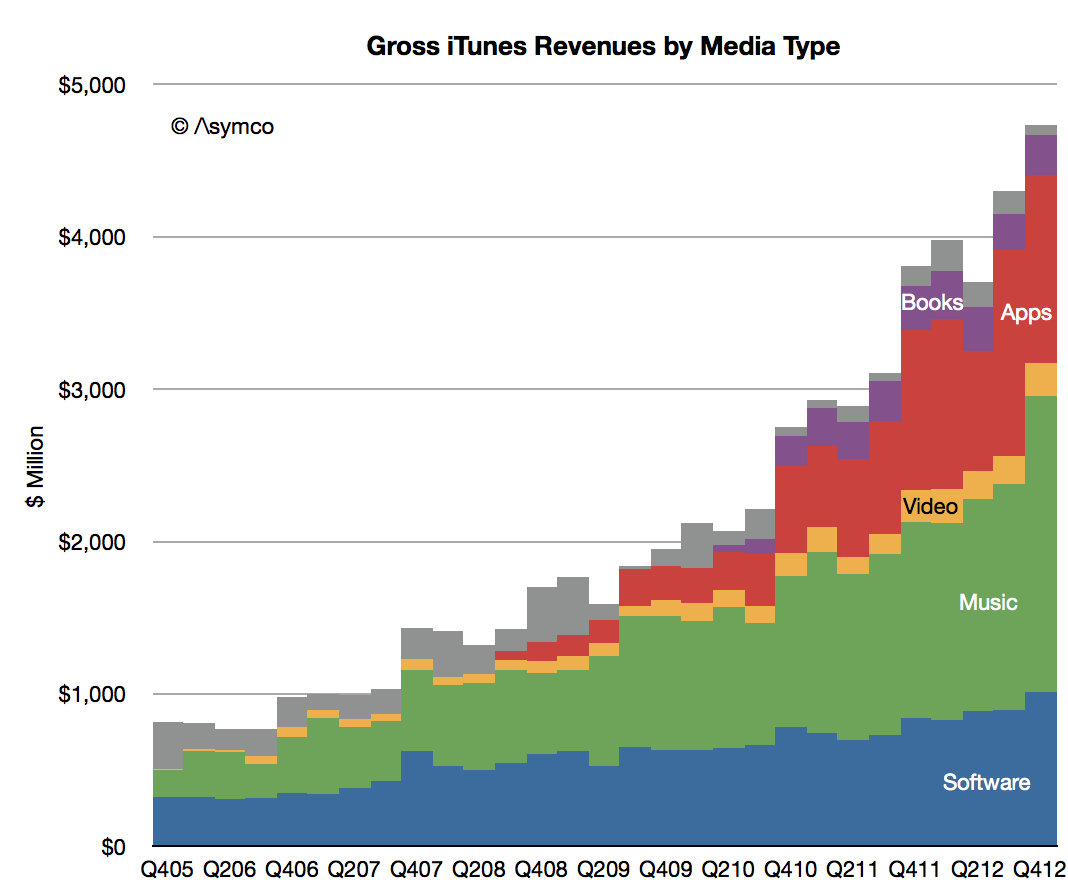
    The reasoning goes that as more media types have been added costs have increased but revenues have increased even faster. Consider the estimated gross revenue base as shown below:

    Screen Shot 2013-03-22 at 3-22-2.39.55 PM

    What is known as iTunes today has quintupled in seven years. Although cost of content sales are likely to have been preserved as a ratio (about 30%) the vastness of transaction volume (estimated at 23 billion item transactions in 2012 alone) implies that there are some significant economies of scale.

    This implies that the operating costs are spread more evenly and that therefore the possibility exists for some operating margin.

    Put another way, at break-even the cost of operating iTunes stores would be about $3.75 billion. It's hard to imagine this level of operational expense for digital content.

    For this reason, management has begun since 2010 to suggest that at least the App Store is run "a little over break-even". How little is a good question. A one percent operating margin (from gross revenues) would imply as much as $45 million margin. I estimate 2% is possible on Apps and 1% on Music.

    That's $150 million in margin content. Heady stuff.

    However, since folding its Software group into iTunes (the blue area in the graph above) the margin picture changes dramatically.

    The Software group is one of the forgotten heroes of Apple.

    Apple’s software division “Apple Software” is responsible for the following products:

    • iWork which includes Pages, Numbers and Keynote. These are available through the Mac App store at about $20 per product and the iOS App Store for $10.
    • iLife which includes iMovie, iTunes, iPhoto, GarageBand. The OS X versions are available free with new computers but they are also available as paid downloads for OS X through the Mac App Store at $15 each and for iOS devices through the App store at $4.99 per app.
    • OS products including downloads of iOS and OS X. These are mostly free but some OS X updates are not free (typically $19.99 for new version including the server version of OS X.)
    • Professional tools which include the following products: Final Cut Pro (Video editor $299.99), Logic Pro (Music editor $199.99), Aperture (Professional Photo workflow $79.99), Compressor (additional features for Final Cut Pro $49.99), Motion (video transition editing for Final Cut Pro $49.99)
    • Administration and development tools which include:  Xcode integrated development environment which is free Apple Remote Desktop which is priced at $79.99.

    All these products are now sold through either iTunes App Store or Mac App Store. They used to be sold as traditional boxed software for many years but Apple has transitioned them all to be download-only and folded them into the catalog of third party apps while lowering prices.

    My estimate is that Apple’s own software generated $3.6 billion in Revenues in 2012. As you can imagine, this is a high margin business  which grows at nearly 20%/yr. Although I estimate that the software business has been overtaken by the Apps and Music businesses in gross revenues, it keeps an operating margin similar to that of Microsoft or about 50%.

    This means that iTunes inclusive of Apple's own Software generates as much as 15% operating margin on gross revenues. That's over $2 billion a year.

    So much for breaking even.