Asymco

Asymmetric Intelligence

loss

  1. The Disruption FAQ

    Research · 28 comments

    Q1. What is disruption?

    Disruption happens when the strong are defeated by the weak. More precisely it’s when those with unconstrained access to resources have them taken away by those with minimal or no resources. It's a phenomenon that is in contrast to sustaining competition where the strong get stronger.

    Q2. How can disruption happen? Don’t the strong always have an advantage over the weak?

    The strong can be defeated when the fight is unfair. More precisely, "strength" is only a perception based on convention or historic precedent. The entrant may be weak in resources but may be strong in a way that is not seen as conventionally useful or valuable such as agility or a willingness to learn.

    Q3. What makes a fight unfair?

    A fight is unfair if the opponents fight according to different rules. This is also called asymmetric competition. Asymmetry is an important concept in game theory, economics and military science.

    Q4: Is there a way to know disruption is about to happen?

    Disruption theory is an attempt to reliably identify winning challenges. It includes a method of analysis of "the setting" of the fight and "the weighing” of the fighters. In other words, it measures whether the challenger is sufficiently asymmetric and whether the incumbent is flexible enough in their likely response. If there is insufficient asymmetry the theory would suggest the challenger will lose, and vice versa.

    Q5: How often does it happen?

    In some industries it happens quickly and in some industries slowly and in some never at all. Determining the cause of the rate of disruption is an important research topic. We can hypothesize that industries which show frequent disruption also show a high degree of wealth creation. The inverse is also true: industries that don't get disrupted don't create much wealth.

    Q6. How do incumbents react to asymmetric challenges?

    This quote (mistakenly attributed to Gandhi) describes it best: "First they ignore you, then they laugh at you, then they fight you, then you win." The main test of asymmetry is to ask whether a challenger’s entry is ignored (or welcomed) by the incumbents. Most asymmetric challenges are not taken seriously because they initially benefit the incumbent. The side-effect is that it lulls them into a sense of security resulting in a lack of response. Challengers have the child-like advantage of rapid growth and learning while incumbents are encumbered by their size and lack of flexibility.

    Q7: Why don’t challengers respond in kind?

    Mainly because they don’t feel that they need to. The newcomer is either not seen as a threat or welcomed because the customers they obtain that are not seen as valuable. In some cases the business model of the entrant is contrary to that of the incumbent. In other words, the challenger makes money in a way that would cause the incumbent to lose money. Often the challenger is actually invisible because she misdirects attention. They may be seen as competing in one market with a certain set of competitors but their effect is in another market which never had to deal with a challenger.

    Q8: If there are different ways disruption can be observed, doesn’t that mean there are different types of disruptions?

    Yes. When a competitor challenges with a cheaper product that seems to perform poorly and has low margins and the incumbent accepts the entry because it allows them to concentrate on more profitable customers then this is called a “low-end disruption”. Here the asymmetry is in cost structure. The entrant has lower costs and accepts lower profit margins and may “make money” in new or different ways.

    When a competitor misdirects attention by selling a product that draws usage from existing customers and adds non-consuming new customers because it enables new uses, then the incumbent feels no pain from the entry because they don’t sense a reduction in customers. We call this a "new market disruption". The challenger gains a foothold and grows/evolves, eventually capturing customers exclusively. Here the asymmetry is in the basis of competition and measurement of "performance". The new product does not actually do the same thing as the incumbent product or does a subset of valuable tasks poorly while excelling at menial tasks. The entrant may be highly profitable but they are not taking profits away from incumbents because they "grow the pie", capturing value by fulfilling unmet needs.

    Disruption can also happen to professions and institutions when less skilled individuals are enabled to perform complex jobs or when professionals can establish good enough services that used to take institutional support. This is called professional services disruption.

    Technological change is often (but not always) the core enabler in creating disruptions. The analogy is that technology is a weapon that allows asymmetric combat but the combatant is the disruptor, not the weapon ((See David vs. Goliath: using a projectile allowed David to overcome Goliath but only when wielded skillfully)).

    Q9: It sounds like the trick to spotting disruption is in perceiving when the fight becomes “unfair” and an outsider advantage is gained. Does the theory make this easy?

    It makes it possible but not easy. Understanding when a basis of competition changes and where competition is shifting is still very difficult. It is notoriously difficult to sense when it’s happening to you because you are working toward a strategy with assumptions that have been tested and proven to be correct. In other words, you, your colleagues, your competitors and everyone you’ve ever met knows the rules of the fight. Insider status makes you an expert, your knowledge is far beyond a lay person’s and you have a track record of winning. Hubris and pride makes it difficult to accept a challenge from an ignorant outsider.

    Furthermore, an outside analyst who is not suffering from these psychological weaknesses may not have the means to measure change because they don’t have access to market metrics. So you can’t typically hire a consultant to help you spot it. This is where the theory helps. If you are a practitioner then you can use the theory as a lens to see the patterns in the operating data.

    The proper application of the theory requires domain knowledge or deep reading of weak signals. It’s best employed by incumbent operating managers analyzing their own industry. It’s a tool that can be used to overcome the perception of incumbent invulnerability. It is not a tool that can be used by armchair generals. They can pick up the lens but, not having any data to look at, they have have no patterns to recognize. (This last point is disputed. See comment.)

    By the way, entrants don’t benefit much from it either because they act disruptively by instinct. They enjoy the freedom of having nothing to lose.

    Q10: How long does this take? Isn’t a shift in competition natural over a few decades?

    The speed of disruption is changing rapidly. It used to take decades but now it takes years and in some software industries it could be happening in less than one year. When it used to take decades it did not matter much because the “victims” of a disruption usually could spend a career in the firm being disrupted and would not have to adjust their behavior or assumptions. The consequences would have been felt by future generations. The rate of disruption today is so rapid that many careers and lives and families are having to deal with the consequences, sometimes more than once. Estimating the acceleration and scope of disruptive change is a great research topic.

    Q11: Is the theory complete? Can't we just write an app for it?

    It’s not complete. It cannot be encoded as a deterministic algorithm. It’s not even likely that expert systems or neural networks or machine learning can help. This is because perception of change in competition is a skill informed as much by intuition as by data and rules. If the theory is developed further, through a process of theory building, then it might become an app.

    Q12: If the theory is not complete, then isn't it useless?

    A theory is not useless if it's imprecise or difficult to use. Data that would make conclusions precise is often missing or unavailable. The theory relies on weak signals and explains what used to be unexplainable. Many sciences developed from empirical analysis similar to where we are with disruption theory. Theories benefit from development.

    Q13: Is the theory being developed further?

    Yes. There is a process for theory building which has been ongoing for over a decade where many researchers, students of disruption and practitioners are contributing.

    Q14: Can the theory be applied outside of business competition?

    Yes, institutions can be disrupted as can individuals. Possibly even economies and states. This is because a growing technological base and communications enable asymmetries of ever-greater scope and speed. The research needed to establish how this happens is under way. However it's important to know the limits of the phenomenon. Incumbents are getting wiser as they wield the theory and some "settings" show resistance to change and thus prohibit technological cores to be utilized disruptively. The study of these anomalies is essential to the process of theory building.

    Q15: Is disruption a force of nature? Has it always existed? Will it never end?

    Oral traditions suggest that people have been aware of disruptive forces for all of history. We feel it in the school playground and in many personal relationships. It's in the Bible and the classics that predate it. It's visible in all cultures. Disruption theory as applied to business and government is only an extension of this causal individual behavior into complex systems. It’s possible that awareness of it might cause the behavior to change, or, put another way, that if you observe and understand the phenomenon, that knowledge could cause it to stop happening. But the systems involved are vast and learning curves are long. Enlightenment may take a few lifespans.

    Update:

    Here are questions which have been added based on reader feedback. Please feel free to suggest others in the comments.

    Q16: Isn't Disruption just evolution of business models?

    Business models evolve, but if the evolution sustains an existing incumbent then it's not a disruption. If an evolution is  adopted by an entrant who then proceeds to strip the assets and profits from an incumbent then it's a disruptive change. The key question is why do some changes get adopted and not others.

    Q18: What have been the major improvements in the theory since its introduction in 1997's The Innovator's Dilemma?

    From Clay Christensen's work alone: New Market Disruptions, Professional Disruption, Value Chain Evolution Theory, Jobs to be Done Theory. The Innovator's Solution including how to respond with autonomous self-disruption, the role of acquisitions, the study of Healthcare and Education as targets of (and anomalies to) disruptive change. The process of theory building. The Capitalist's Dilemma and how economies create incentives and disincentives to disruptive innovations.  Many other contributions from researchers too numerous to cite here.

    Q19: What industries cannot be disrupted

    Industries which experience no disruptions are "anomalous" in that the theory suggests that technological progress forces change and technologies have proliferated in almost all industries..  Industries or institutions which have remained largely undisrupted include Energy, Education, Government, Healthcare, Airlines and Hotels. The study of these anomalies continues and explanations identify conditions that prevent growth. Dependencies on regulation, infrastructure, and absence of technological core enablers caused some of the atrophy to date. However signals of change are appearing in all these industries and paths to disruption are clearly possible.

    Q20: How is it possible that companies which were claimed to be disrupted are still around and some which are claimed to be disruptors have vanished?

    Being disrupted does not mean ceasing to exist. Being disrupted is a loss of a specific encounter, but not necessarily a terminal loss. Being a disruptor is a win in a specific encounter and not a guarantee of immortality. Indeed many disruptors come to be disrupted and the theory suggests sustainable growth requires self-disruption. Also a disrupted company can be re-configured post-disruption into another entity or can muddle along with limited value indefinitely. Sometimes they can rise up and become disruptors again.
  2. Estimating HTC's post-traumatic life expectancy

    Research · 82 comments

    In May 2012 I wrote:

    The pattern may be that companies either have short post-trauma lives of about two to three years or relatively long post-trauma lives lasting 4 to 5 years. What determines this life expectancy and how long do RIM, Nokia and LG have?

    via Post-traumatic life expectancy of phone vendors | asymco.

    These comments came right after BlackBerry (then RIM) announced a loss and thus entered what I called the "post-traumatic" phase of its existence. ((The analysis began earlier, in June 2011)) The observation I have been making is that once a company begins to generate negative operating margins from phone sales, that phone business never recovers.

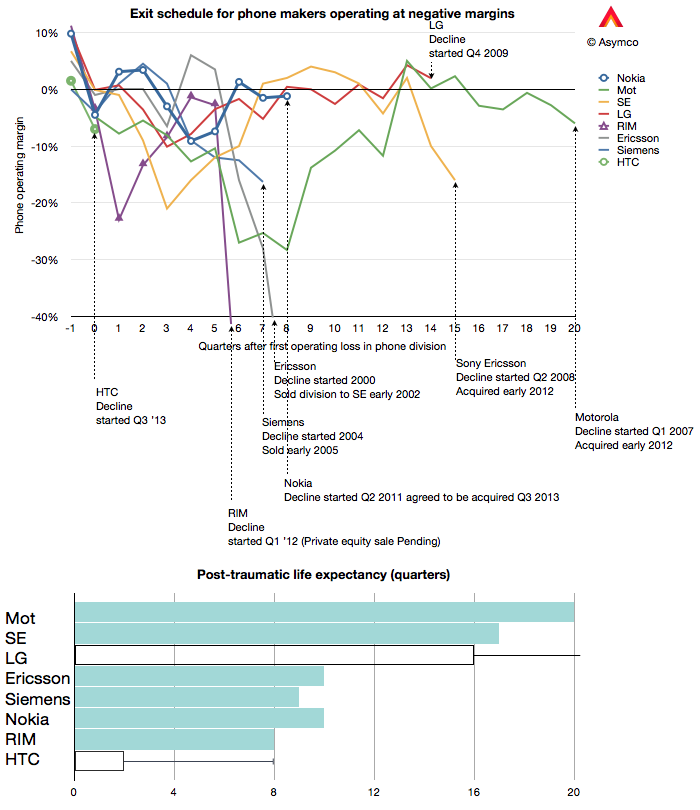
    The question then becomes one of gauging how long they have before the business is sold, dissolved or merged. Since that update, both Nokia and RIM have tentatively agreed to be sold. If the sales go through then we can update the graphs as follows:

    Screen Shot 2013-10-04 at 10-4-11.01.11 AM

    [Graph note: solid bars in the second graph indicate companies which exited and thus the duration of life post-trauma. Hollow bars indicate the companies have entered post-tramuatic period but have not yet exited. Lines extending from the hollow bars indicate life expectancy henceforth.]

    It turns out that Nokia and RIM did indeed have "two to three years" of life left under the same ownership. Two years to be precise. But as Nokia and RIM change hands (and are thus re-classified in the graph above) HTC enters the schedule. ((Note that there are many companies not listed which also exited. I simply did not have data for Palm, Panasonic, NEC, BenQ, Alcatel, Hitachi, Casio, Fujitsu, Handspring or Danger or many other asian brands which are no longer in this business.))

    HTC has just confirmed that they have lost profitability for the first time since going public in 2002. As the clock begins running the alarm is now set to a much tighter 2 years. The implication being that HTC will change ownership or control no later than mid 2015.

    But there is a post-script to this story. LG, you may note, has not exited phones. In fact, it seems to be recovering nicely. Doesn't that give hope to HTC?

    I don't believe it should. The caveat to this short post-tramuatic life expectancy hypothesis is that it applies mostly to companies which derive the bulk of their sales from phones. Companies which are conglomerates or which can offset losses from phones with cash flows from other businesses tend to live longer.

    This does not mean however that LG's survival is assured. The factors at work in the phone business place continuing stress on the weakened while favoring the strong only temporarily. The dynamics are nothing like those in consumer electronics or in the computer industries. Reversals of fortunes are breathtaking.

    Sic transit gloria mundi.

  3. The allure of iTunes

    Research · 132 comments

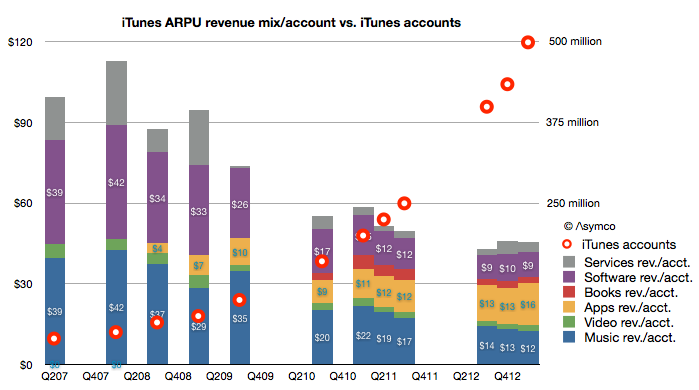
    My estimate of last quarter's iTunes gross revenues suggested a spending rate of $40 per iTunes account. It would make sense to consider how that figure changed over time. The following graph shows the pattern:

    Screen Shot 2013-05-14 at 5-14-9.49.40 AM

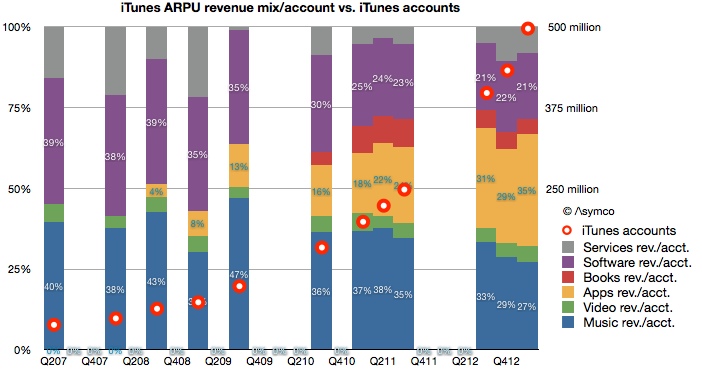
    You can read each bar in the graph as the total "ARPU" or average revenue per iTunes user[1].

    I overlaid a graph showing the total number of accounts as reported by Apple to the (retroactively) estimated revenue structure. Account totals are measured with the right axis and ARPU with the left.  Note that I also broke down each component of iTunes as currently defined (Music, Video, Apps, Books, Software and Services.)[2]

    The time frame covered is from Q2 2007, or the quarter prior to the iPhone launch. A few patterns emerge:

    • When there were no iOS devices (and hence no iOS apps) the revenues of iTunes consisted mostly of music sales. Those revenues were, on a per account basis, roughly comparable with Apple's Software revenues.
    • As iOS devices proliferated, the number of accounts (and users) grew. They doubled in the first two years (2007 to 2009) and doubled again in the following year (2010) and doubled again the following year (2011) and doubled again in the following 18 months. This rate of growth was accompanied by a reduction in the iTunes ARPU of about 50% (from $99 to about $45).
    • The reduction in ARPU has moderated in the last few quarters. ARPU fell 10% from $50 to $45 during the last doubling of accounts (from 225 million iTunes accounts to  500 million accounts.) In contrast ARPU fell 20% from $74 to $58 during the penultimate doubling (from 100 million to 200 million)
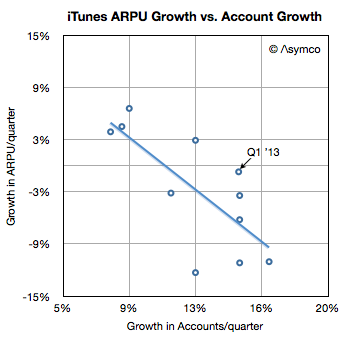
    • However, growth in accounts is broadly inversely proportional to growth in ARPU. In other words, the faster the growth in users the faster the decline in ARPU. The recent moderation in ARPU erosion is also coupled to a moderation in user growth (most recent doubling took 18 months vs. 12 months for previous doubling.) This is as would be expected as a broader, later user base tends to consume less than a narrow, early base. This can be seen in the following scatter plot:
    Screen Shot 2013-05-14 at 5-14-10.35.02 AM
    • When seen as a percent of mix, Apps have grown to be the largest component of iTunes spending. Apps have 35% "share of wallet" while music has dropped steadily from 40% to 27% (or $39 to $12/yr.) This is shown in the following graph.
    Screen Shot 2013-05-14 at 5-14-10.34.45 AM

    As apps have grown to consume more and more of users' time it stands to reason that they should consume more and more of users' wallets.

    And as accounts reach one billion, we can begin to think about the disruptive impact on other media types. Whereas video, books and music are targeted to smaller user bases, apps are broadly consumed. Developers like Rovio or Supercell can offer their products to billions while TV producers can only hope for millions. Apps are becoming the universal medium for entertainment and iTunes the universal distributor.

    Talent is catching on to this faster than those who manage and distribute their work. The inevitable result will be a mass migration of talent away from the established content industries. Old media won't fade due to a loss of users. It will fade due to a loss of talent.

    --

    Notes:

    1. An account is not necessarily a user so perhaps more appropriately the acronym should be ARPA (average revenue per account). Unfortunately that acronym is taken.
    2. The complete model is available for purchase through Asymco Store.
  4. Margin Call

    Research · 97 comments

    During the fourth quarter 2012 Apple's margin fell to about 38%, a level not seen since two years earlier and down from a peak of 47% in Q1 2012. Does this lower margin foretell lower prices or a loss of competitiveness?

    Obviously not.

    Gross margin is a function of Sales (aka revenues) and Cost of Sales. Gross margin as a percent is calculated with the following formula: (Sales-Cost of Sales)/Sales. If dealing with a single product, Sales itself is the product of shipments and price/unit but since cost of sales is also a product of shipments and cost per unit, the shipments numbers cancel each other out and the gross margin reduces to the ratio of (Price-Cost)/Price.

    So a margin drop can only be caused if one of three things happened:

    1. Prices dropped
    2. Costs increased
    3. Both prices dropped and costs increased.

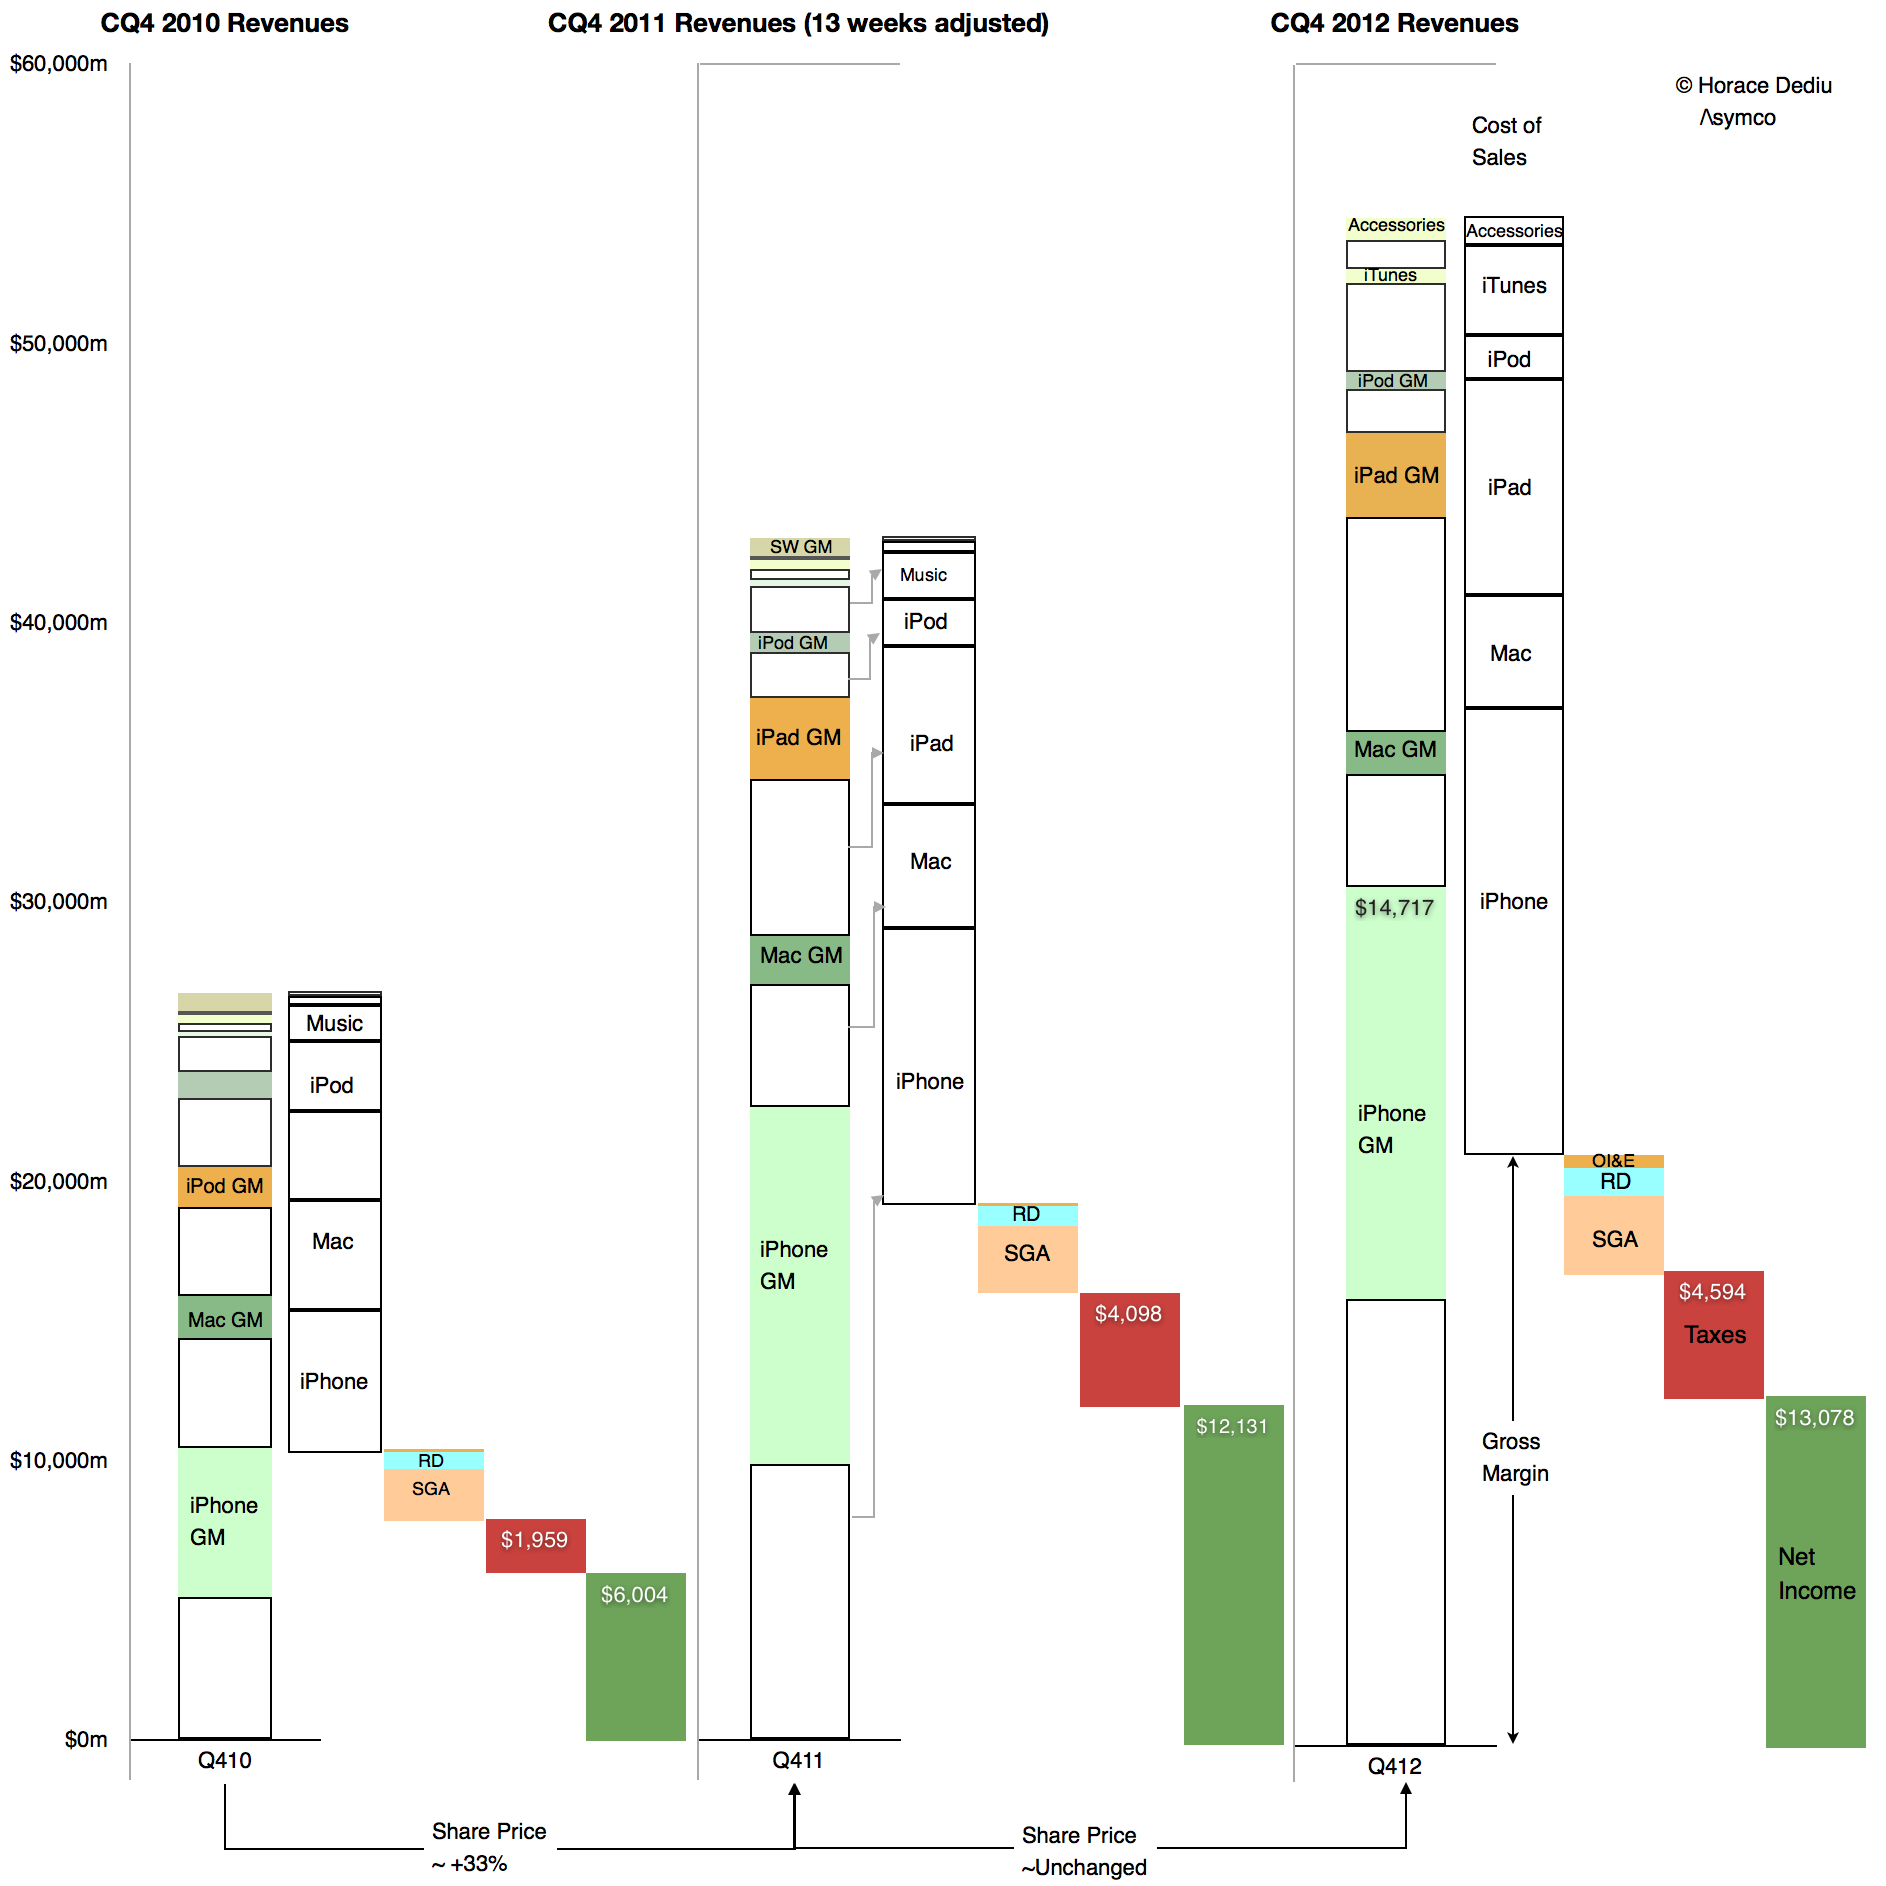
    We can easily find out which of these was the cause in the fourth quarter because we have volumes and prices for all of Apple's products. We can also derive total costs based a total gross margin. These are illustrated in the following retina-friendly diagram.

    Screen Shot 2013-02-05 at 2-5-11.25.16 AM

    The diagram shows Revenues, cost of Sales, Operating expenses, Taxes and Net Income relative to each other for the fourth quarters of 2010, 2011 and 2012. Of interest is the difference between 2011 and 2012. Note how the 2012 Gross Margin (absolute, not as a percent, identified with the arrow) did not change much from the year before. As Taxes and Operating Expenses did not change much either, the earnings were quite flat y/y.

    However note also that total sales increased quite a bit. As the gross margin (absolute) remained steady and sales increased the margin as a percent fell. But the cause is that cost of sales also increased. They increased faster than sales increased.

    Relative to adjusted 4th quarter 2011 Sales increased by 27% while Cost of Sales increased by 30.5%. Margins shrank in late 2012 because the products were more expensive to make.

    It's simple arithmetic.

    We can at a glance see that the cost of sales increased as a proportion of sales. Therefore the margin decreased as a percent of sales. The cause is higher costs, not lower pricing.

    In fact, pricing analysis was already performed and showed that they largely held steady (iPad being the only decline). If pricing is unchanged then competitive issues are not to blame. The supposed link between lower margins and some mythical loss of competitiveness can be easily disproved.

    But there's more.

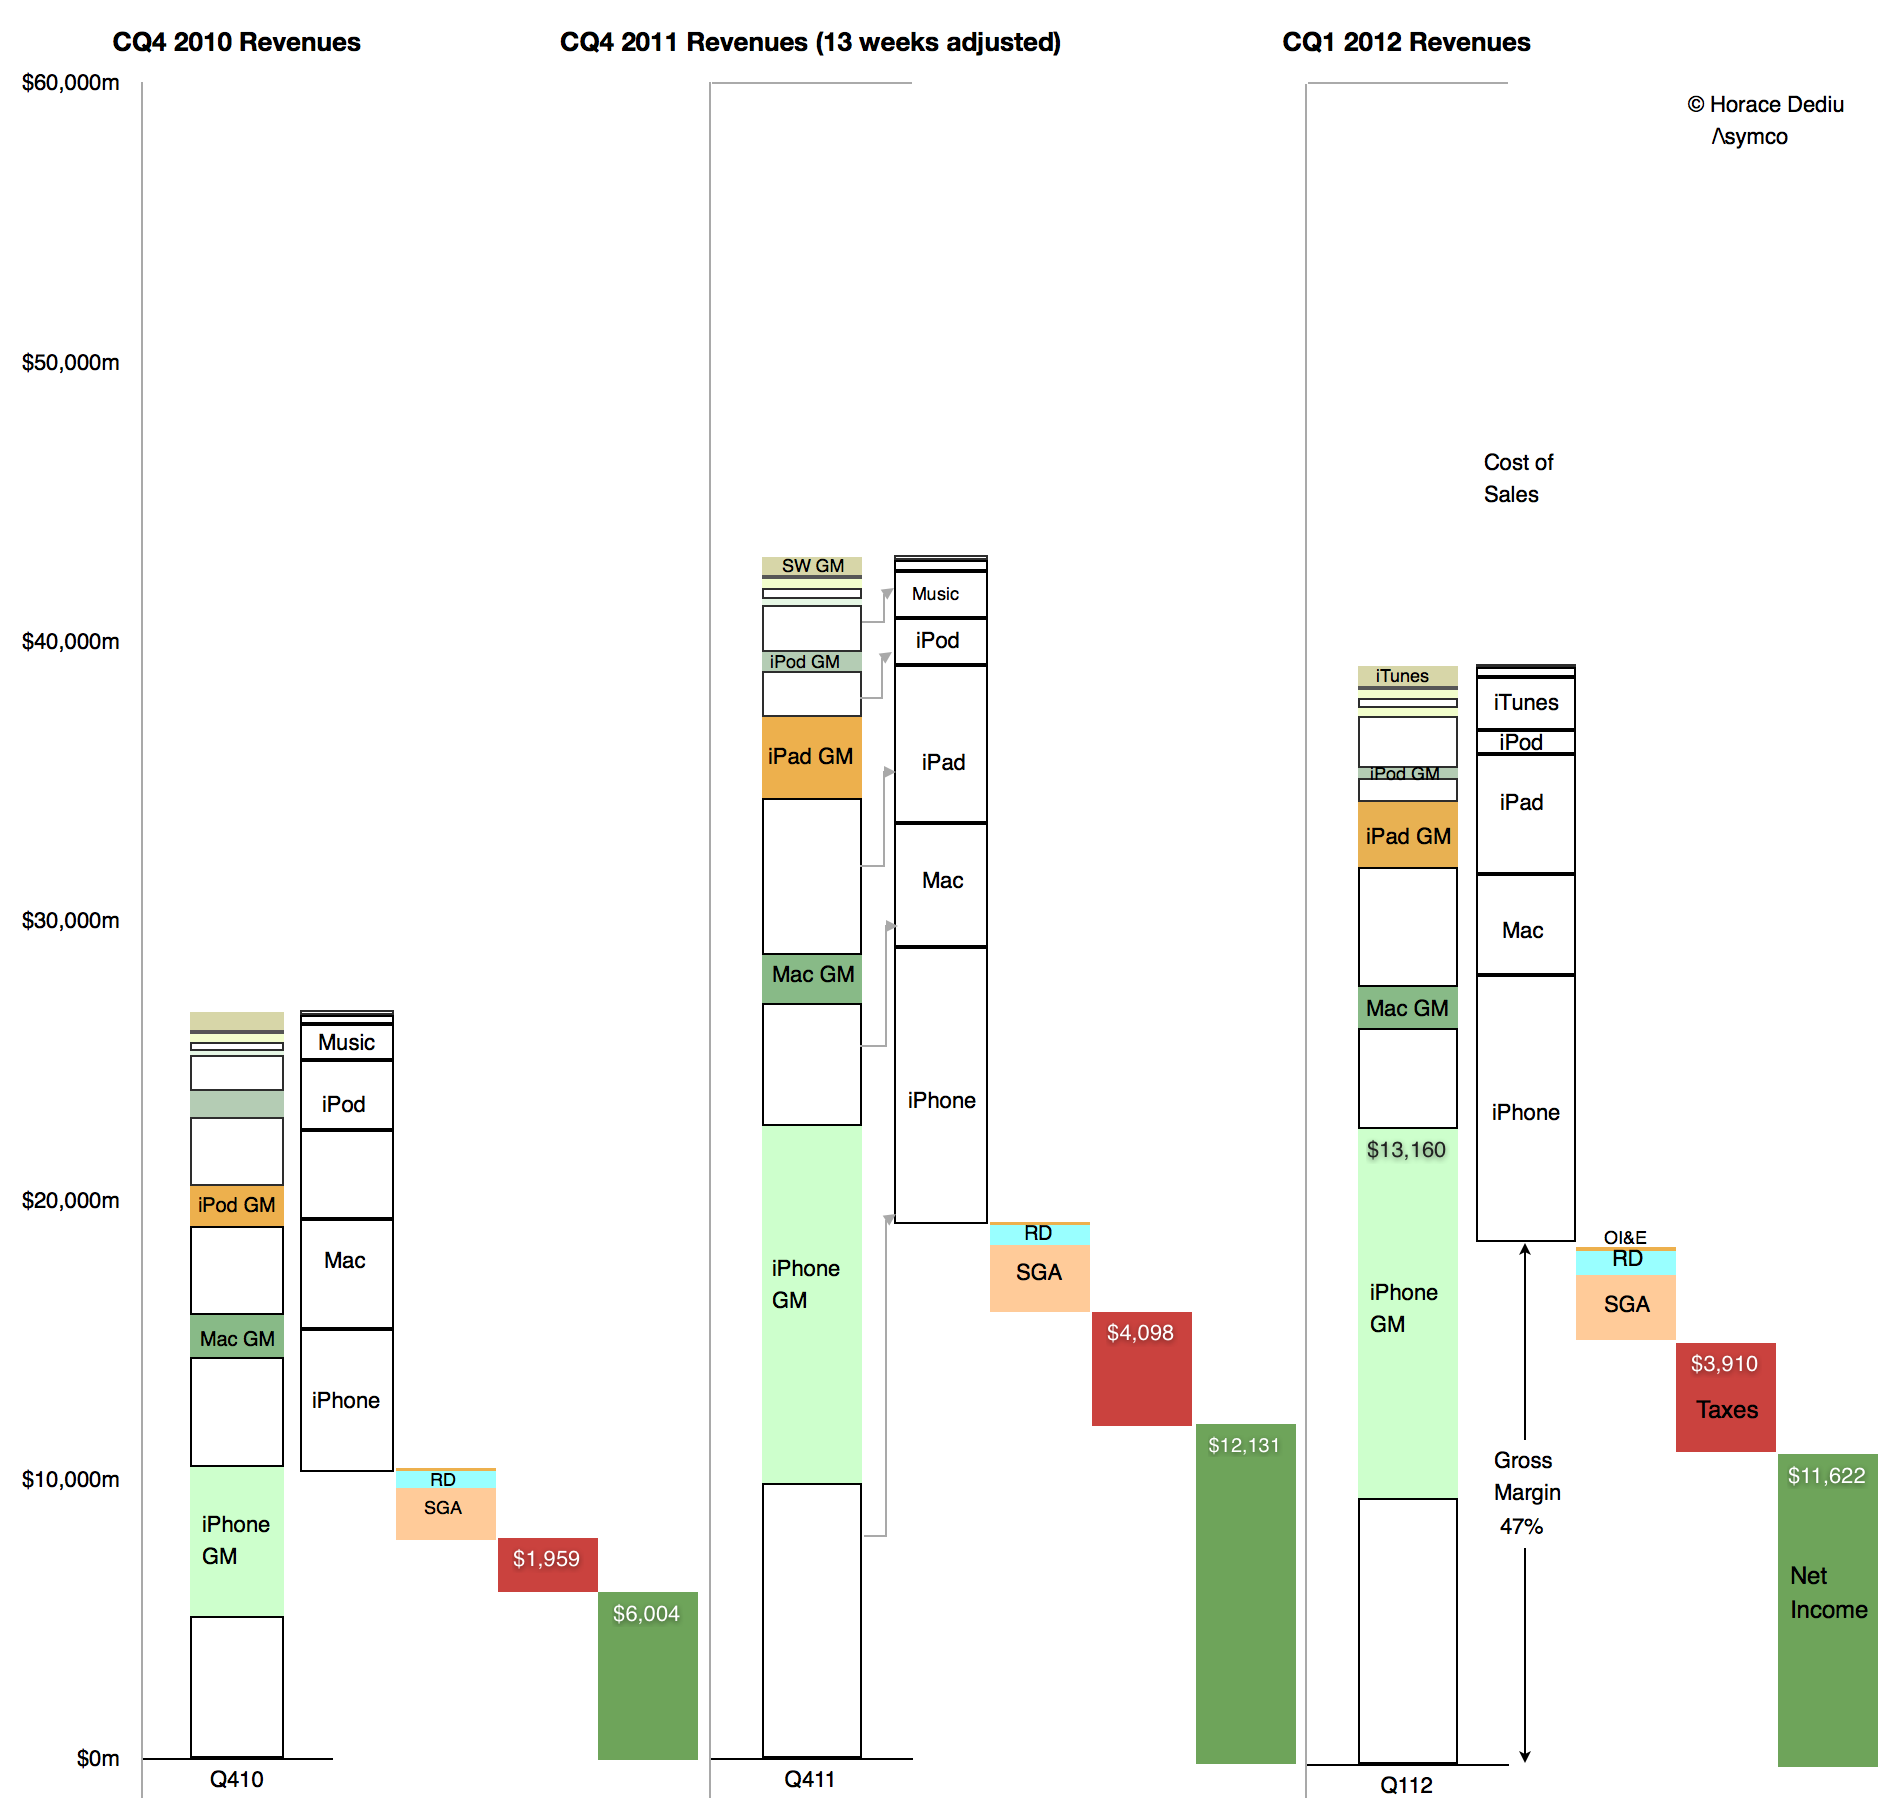
    There is an easily observed cause to changes in production costs. Consider  the opposite effect in the sequential change from the fourth quarter of 2011 to the first quarter of 2012:

    Screen Shot 2013-02-05 at 2-5-11.36.46 AM

    Here we can see how sequentially sales fell but gross margins rose. Again, the change in absolute Gross Margin was slight but the reduction in cost of sales was out of proportion of the reduction in sales. Cost of sales fell by 13% while sales fell by 9%. The result was an increase in gross margin from 45% to 47%. The cause was that the cost of production fell.

    Obviously. Because, as everyone knows, costs of production fall as output increases. It's due to something called the learning curve. It's something that has happened for all of Apple's (or anyone else's) product launches forever.

    What is not obvious is the effect this has on the share price whose changes are shown at the bottom of the first diagram. It's a case where one margin's fall has caused quite a few margin calls.

  5. The next 100 million iPads

    Research · 56 comments

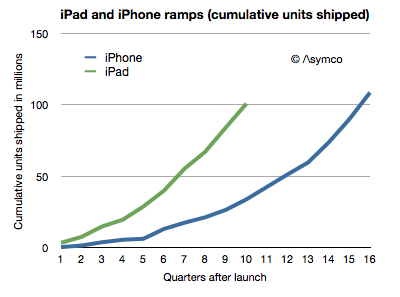
    Having reached 100 million iPads shipped in 2.5 years the natural question is how long will it take for the next 100 million iPads?

    The ramp of cumulative units shipped is shown below.


    I also added the equivalent ramp for the iPhone. [The last data point for the iPad is based on an estimate of 16.5 million units in Q3 which may need revision depending on company reporting.]

    The next 100 million will depend to a large degree on the success of the new iPad mini. To make an estimate we have to realize that there are several aspects of the tablet market which differ from the phone market and that therefore the predictive power for previous data is weak.

    First, the channels are different. Tablets are sold as media consumption or "computing" products. They are not sold as communication devices. Therefore operators have few incentives to promote and subsidize them. They do participate in the distribution but not with the same level of commitment. That means less "push" and opportunity for discovery. Apple has an advantage in this case with their stores and brand value. The lack of operator engagement and lack of points of sale might be one reason why Android tablets have not ramped as quickly.

    Second, for some competitors, the tablet itself is a loss leader and acts more as a terminal into an ecosystem rather than a product in itself. In cases where tablets are given away it's possible that consumers might own one for each platform or ecosystem. This is similar to the game console model where the cost of the console is not a barrier to many avid gamers. This means that penetration of tablets can reach above 100% of users in some markets. Although network connections (i.e. SIM cards) can and do reach well above 100%, the number of phones in use by one person simultaneously is bounded.

    Third, the lifetime of the product is as yet undetermined. Phones tend to last 2 years. This is due to evolving standards as well as high wear and tear and breakage or losses. Tablets are not as "mobile" and are less likely to be used and the basic functionality does not evolve as rapidly. It's possible that replacement rates for tablets will follow more that of notebook computers than phones. Perhaps between 2 and 4 years. I suspect most iPads purchased are still in use today, including the first version. There will be some obsolescence from system upgrades, but the older systems will keep going.

    Some of these aspects of the product could lead to slower growth and some to faster growth. That and the fact that it's a completely new category with business and consumer and educational and vertical applications makes it a difficult product to forecast.

    Having said that, the product is extremely resonant with buyers. The growth to 100 million is testament to that. The liquidity of the product, with no carrier locking and no pricing illusions means that it reaches all parts of the world quickly. So there is no obvious upper bound on the size of population who might buy it. The new price points and form factor may lead to a wave of new adoption, similar to the impact the iPod mini had on the iPod line.

    There are still many factors that can slow growth, especially production capacity, but I believe that the iPad could growth between 50% and 80% which would mean 100 million more iPads could be sold by the end of 2013.

  6. Positioning Lumia

    Research · 17 comments

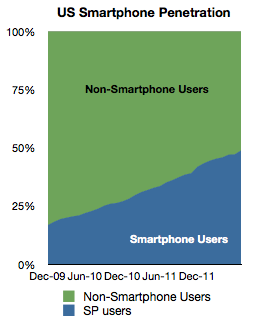
    The US has reached 50% smartphone penetration.

    comScore data shows July penetration at 48.8% and a monthly growth in penetration of nearly 2 percentage points. Given the rate of growth, it's nearly certain that we've crossed 50% in August.

    The historic growth is shown below:

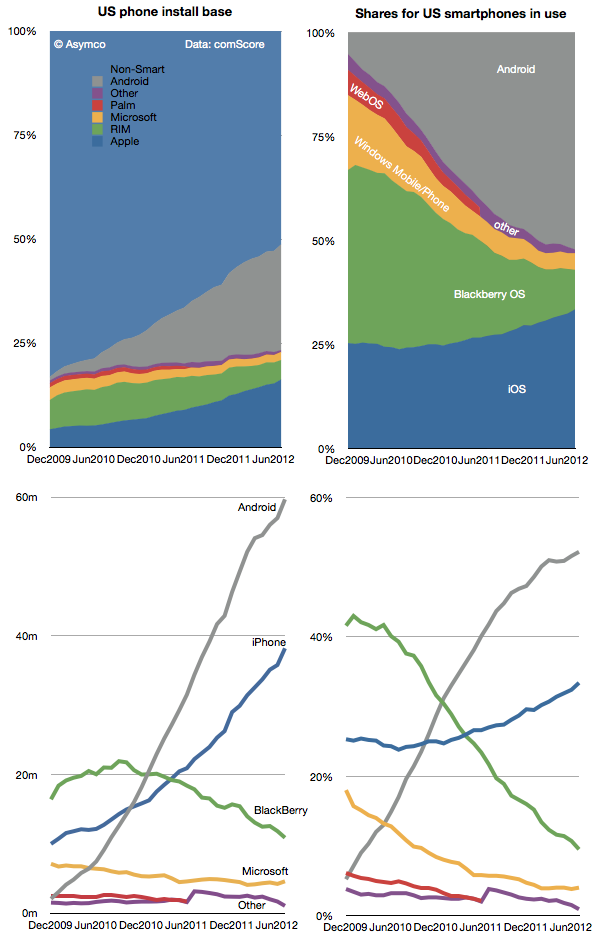
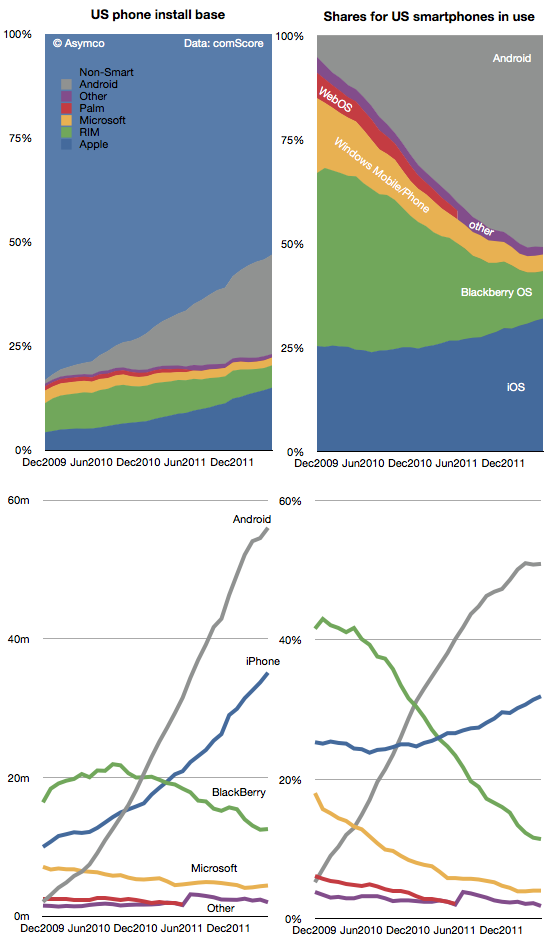
    The platforms making up the smartphone market in the US have seen unequal shares of this new population of users. The following diagrams show how the install bases have changed in absolute and share terms.


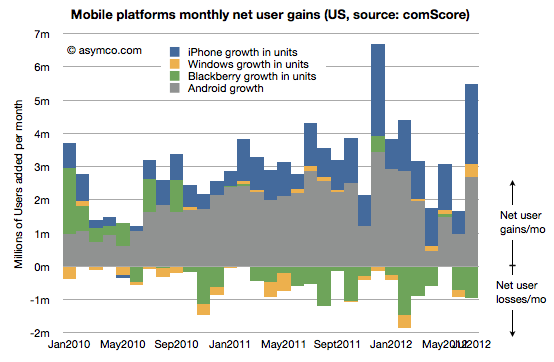
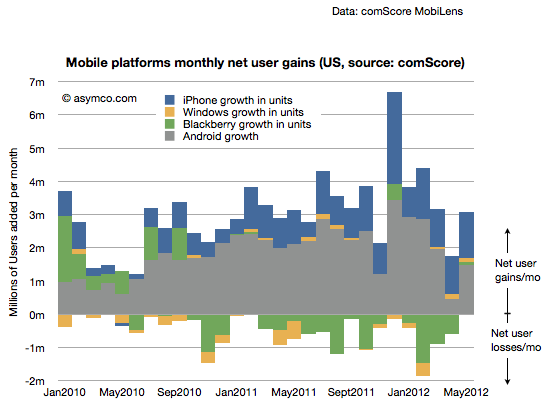
    To round out the analysis, here is the net user gains for the platforms showing the net addition or loss of users since early 2010.

    What I look for in this data are signs of slowing adoption (so far there aren't many), subtle shifts in platform performance (as seen in RIM's move from consistent net gains to consistent net losses) and signs of churn or the transfer of users from one platform to another (rather than from non-consumers to consumers.)

    The story in the latest data seems to be that Windows Phone has turned in a first significant gain in users (378k new users). Its share seems to have stabilized at around 4%. This is in contrast to BlackBerry whose hemorrhage continues (a net of 7 million users defected from the platform in the last 12 months.)

    On this occasion of reaching what I've called the tipping point, it's worth reflecting on just how far we've come. In December 2009 the total number of smartphone users in the US was 39 million whereas now it's about 115 million. That's a total of 75 million new users in a bit more than two and a half years, quite a story there.

    And yet, half of the phone users still remain to be converted. It's possible that the growth in adoption will remain steady but it's also possible that it might slow down and follow the "S-curve" adoption rate that new consumer products typically follow, perhaps reaching saturation at some point below 100%.

    If growth slows immediately then there will be more churn between platforms. If rapid growth can be maintained then there will be more competition with non-consumption rather than between rivals for some time still.

    The changing character of competition will need to be reflected in product strategies. Non-consumption is typically an easier competitor to beat with features. Switching users from a comparable product is harder and may require pricing pressure. To solve this in a time of transition, new products will have to split into a set offered to new users and another set offered to switch users.

    You can see the pressure of this on the Windows Phone platform most of all. As a late comer, does the Lumia range from Nokia fit the bill as targeting non-consumers or switchers?

    In other words, has the brand been positioned as a "better" smartphone or as a "good enough" smartphone? It matters because the "good enough" position has been held by Android overall while the "better" position has been held by iPhone. However, not exclusively. We've seen "better" positioning from Samsung's Galaxy S and Verizon's Droid brand and "good enough" positioning from the older variants of iPhones.

    So it's quite difficult to see where Lumia fits in the US. There is no obvious opening. The next 75 million first time US smartphone users may be attractive to Microsoft and Nokia but it's not clear why, having waited so long, those buyers will be persuaded by the new brand. Perhaps subsidies will help. As indicated with the first US Lumia launch, the product was priced at a discount to the prevailing price point for a premium smartphone. Perhaps that's the "good enough at a good price" strategy.

    If so, it has not been a home run. Perhaps there is still time for this strategy to play out in 2013 but what if Lumia is not actually being marketed this way?

    At launch Nokia has tried to promote the brand as something "better". Better camera, better charging, better maps, better screen, etc. They have promoted on Twitter with the #switchtolumia hashtag. Microsoft has had the "Smoked by Windows Phone" campaign targeting specifically existing smartphones.

    I don't want to suggest that one positioning is more appropriate or more likely to succeed than another. That's a tough call. Either could be the right choice. What I would suggest however is that there needs to be clarity of thought and communication on the matter.

    Perhaps the launch of the new Lumias (920, 820) is part of a clear positioning toward the high end. But the absence of pricing and distribution and how the operators will be engaged leaves the question open. The strongest criticism of the effort so far is this lack of clarity about how the product is intended to be perceived by the buyer.

    A lack of clarity in positioning is symptomatic of a lack of clarity, or maturity in strategy.

  7. At 50% penetration the US smartphone market is not showing signs of saturation

    Research · 61 comments

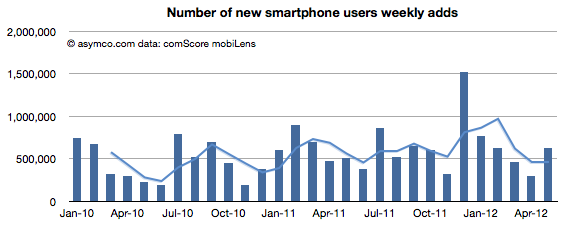
    According to comScore, as of end of May,  the ratio of consumer phone users in the US (aged more than 13) who use smartphones as their primary phone has reached 47%.

    The question is whether this is reaching saturation. My guess has been that saturation will be at levels well above 80%. The data shows that during May the rate of smartphone adoption (first time users) was 630k/week. This number is a good recovery to above the historic mean indicative that saturation is not yet in effect.

    50% penetration will happen this summer. A year ago the predicted "tipping point" date was also the same: August 2012.

    The platform shares data is also returning to a historic consistency. A month ago I asked if there was "trouble with the robot"  because Android net adds dropped to a level unseen for two years and the decline in net adds had been going on for four months.

    This last report shows a recovery in Android net adds to about 1.5 million new users.

    [Note here too that there is no sign of saturation: The net user gains are far above net user losses. Even BlackBerry showed a gain. In a market where there is saturation, net gains and losses among platforms would balance each other out.]

    In terms of share, Android shows two months of no growth. The following charts show the history of platforms in terms of share and actual units in area and line charts.

    I'd say the jury is still out on whether Android has "peaked" in the US. Globally, the rate of additions seems to still be increasing but in the US we might be seeing the effect of upgrades as many first time Android buyers are reaching the end of their contracts. iPhone and Android "purchase rates" are already at parity but the install base might take some time to converge.

    With half the population still not using smartphones, there is still headroom for the platforms, but the inter-platform dynamics are becoming very interesting.

  8. An interview with Kenney Ho of The Chosun Daily of Korea

    Research · 21 comments

    Kenney Ho, a staff reporter from Korean newspaper The Chosunilbo (The Chosun Daily) sent me a set of delightful questions.

    According to Kenney, The Chosunilbo "has a history of 90 years, has been the most dominant, and influential paper of all time in Korea. It is the No.1 newspaper company in Korea with more than 1.8 million circulation, firmly holding the largest market possession. The paper is recognized Asianwide, where there are many readers in Japan and China."

    -You said "All mobile device vendors experiencing losses are not likely to really recover". Even though, it wouldn't mean that the employees, executives of Nokia has completely nothing in hands for recovery. If you are the CEO of Nokia right now, What are your steps to make Nokia recover its deficits?

    My statement was based on the historic data which shows that 14 phone vendors have either exited the business or lost their independence during the last decade. No vendor that has reached a period of prolonged loss making has recovered. These are just observations and it's possible that Nokia may be the first to recover. However, going by the patterns of the past, it would be very unlikely. When I thought about the reasons why companies have not been able to recover I came to the second observation about the way phones are sold. Once a brand reaches a point where it's considered "risky" for distributors and operators to range they tend to defer purchases which leads to a spiral of continuing losses and more damage to the brand. The market amplifies "distress" and recovery becomes impossible.

    If I were the CEO of Nokia I would set course for turning the company into a new business. I would approach the market asymmetrically and not try to compete directly with the other vendors. I would look toward services, platforms and software solutions and de-emphasize hardware.

    -Many experts say that because Nokia dominated phone making industry in the 2000s, they maintained a corporate culture of complacency, which led them to decline. Do you agree with this? If you agree, Can you point out the examples of Nokia's complacency?

    Complacency would mean that Nokia would not invest or try new things. This is not quite right. The company invested in software, services and platforms. It tried many new things and had a large R&D budget. It was the leader in mobile software for many years. There was, however, a culture of arrogance about their position. This meant that they did not think the basis of competition would change. They thought they were too big to fail. They did not challenge the core business model of hardware-first and try to find an internal disruptive business.

    -Experts note that Nokia should have reacted directly to Apple's iPhone appearance at 2007. What should have Nokia have done at that time?

    The iPhone showed that software and experiences matter more than operator relationships. Nokia did a lot of research on user experiences and software but when the decision came to implement the ideas, the constraints of hardware and logistics and operator preferences took precedence and the software was compromised. What Nokia needed to do is build product around software not software around the hardware and the market.

    -Since Apple's iPhone appeared in 2007, Samsung took a Fast-follower tactics which made them successful, which Nokia could not. Do you think Fast-follower have advantage over first-mover?

    I don't consider first-mover or fast-follower to be accurate descriptions of strategy. Success follows from innovation and only from innovation. There are various forms of innovation: there is new market creation, new business models, low cost or distribution innovation. Nokia tended to create low cost innovations which opened new, low-end markets. Apple created a new market for browser-based devices and for app-based experiences. These were enabled by an ecosystem that benefited from integration.

    Samsung implemented a portfolio strategy with a large number of devices and price points which allowed them to find market niches that could be exploited. This was a distribution innovation. Each strategy has advantages and disadvantages and each strategy is usually linked to company core priorities and processes. There are times during a technology cycle when one strategy is better and another is worse. This is why companies find themselves successful and then fail. Their processes don't match the technology adoption cycle.

    For example, in the PC market there is little potential for new experiences tied to an integrated device (except for tablets) and hence there is little growth opportunity for an Apple-like approach. The innovation that matters in the PC market is mostly cost reduction. Nokia was doing cost reduction at a time when voice products were commoditizing. Cost reduction does not work when the basis of competition is new experiences and new business models. As smartphone hardware commoditizes, it's unlikely that Samsung will have an advantage unless is goes to a low-cost approach and enters into direct competition with low-end devices.

    -Can you predict the 'Big 5' in handset industry 10years from now? Many people think the list will include Apple, Samsung. Who else might be on the lists?

    There is no guarantee that Apple or Samsung will be the top vendors 10 years from now. I expect Chinese brands to become dominant in market volumes. I expect online service companies like Amazon, Baidu, Facebook to create new platforms which and have their own devices, perhaps in large volumes. I expect new input methods (like voice) to create new opportunities and perhaps new platforms and ecosystems. I expect Google may make a lot of money. One thing is for sure, being a hardware-oriented company without software and services and platforms and ecosystems is a sure path to becoming disrupted.

    -Nokia was the leading company in Finland. What are the reactions of Finland towards Nokia's downfall?

    People tend to blame each other for failures and this is the main discussion topic in Finland: who's to blame. The failure of a company is rooted in complex decision processes which usually take years to run their course. It's quite futile to lay blame on persons, especially since the same persons were celebrated for their wisdom at another point of time. At the same time as Nokia is failing however, another Finnish startup is celebrated world-wide and about to go public: Rovio, the maker of Angry Birds. It will be bigger than Nokia. Finland should make sure there are more Rovios to come.

  9. Unforgiven: The consequences of profit failure in mobile phones

    Research · 34 comments

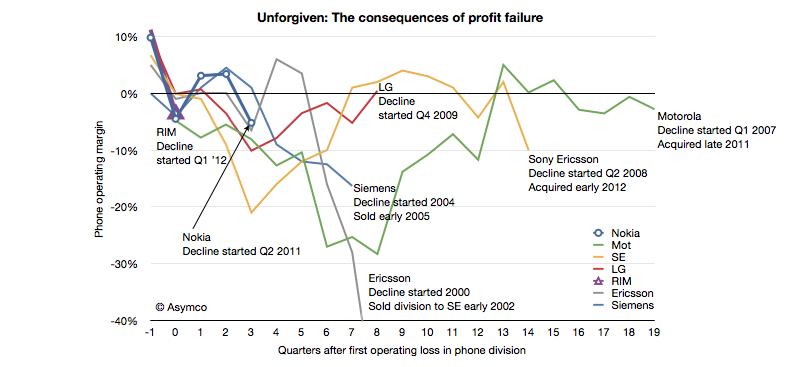
    In June of last year I wrote a post titled "Does the phone market forgive failure?" It was written on the eve of Nokia's Q2 2011 report highlighting the historic consequences of a dip into negative operating margins for a phone vendor.

    I listed 13 phone vendors who were either merged, liquidated or acquired. There are no examples of vendors who recovered from a position of loss making.

    I was prompted to follow-up by a note Charter Equity Research analyst Edward Snyder wrote illustrating the effect of negative operating margins on phone vendors. I took his illustration and expanded it with additional data.

    Since my post in June last year Sony Ericsson and Motorola were acquired making the victims list total 14 companies, with Nokia, LG and RIM having joined the "endangered species list". If the pattern repeats, then RIM and Nokia are in early phases of what promises to be an extended period of pain followed by an exit.

    What the analysis does not answer is when a vendor loses its independence after beginning loss making. Motorola took 20 quarters; Sony Ericsson 14, Ericsson 8 and Siemens only 7. We cannot tell if or when LG, which is still operating after 8 and Nokia, which is now in its fourth and RIM, now in its second quarter post-loss, will lose independence.

    The rumors swirling around RIM and LG are centered around exits and some suggest Nokia will follow. Many also argue that these companies will recover. The conditions they each face are different in details but broadly they are the same. Earlier last decade the exits were prompted by loss of brand value and subsequent loss of distribution. This decade disruption brought upon by mobile computing brings with it new business models centered on ecosystems and value captured through software and services.

    Until and unless these endangered companies solve the dilemma of having the wrong business model at the wrong time, the chances are that they will not be forgiven for market failure.

  10. 5by5 | The Critical Path #33: The Futility of Machinations

    Podcast

    Dan and Horace are back to discuss the latest news from Nokia, RIM, HTC and Sony and what they have to do with each other. We touch on the distinction between market and product orientation and meander into the question of what is the value of the enterprise vis-a-vis the product it sells and what management has meant and what it should mean. We even tackle the history (and future) of history.

    via 5by5 | The Critical Path #33: The Futility of Machinations.

    This show covered a lot of topics, broad as well as deep.

    Show notes and links:

    1. Investors hang up on Nokia after yet another profit warning - Apr. 11, 2012
    2. Sony posts its worst loss ever – USATODAY.com
    3. Sony doubles red ink forecast to worst loss ever - Yahoo! Finance
    4. Sony and Sharp warn of record annual losses - Telegraph
    5. 5by5 | The Critical Path #2: Synchronized failure
  11. The opportunity cost of Windows Phone

    Research · 69 comments

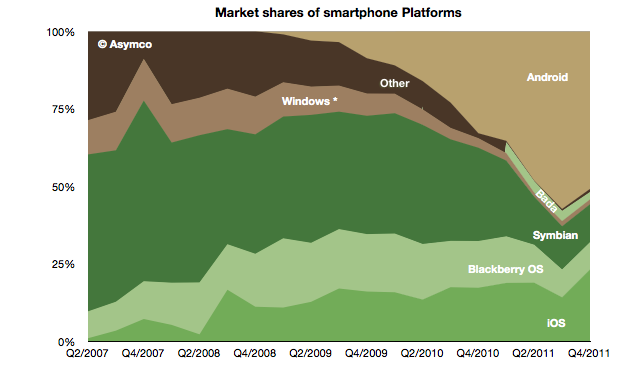
    The global mobile OS market shares for Q4 shows a continuing (but diminished) leading share.

    At the end of last year Android's unit share reached 51% which is down from about 57% during the third quarter. iOS reached 23%, followed by Symbian at 12%, RIM at 9%, Bada at 2.4%, Windows Phone at 1.6% and Other at 1%.

    When seen on a year/year basis Android gained 18 points of share in Q4 while Symbian lost 18 points. iOS gained 6 points of share and RIM lost 6 points. Bada gained 2.5 points and Windows lost 1.5 points.

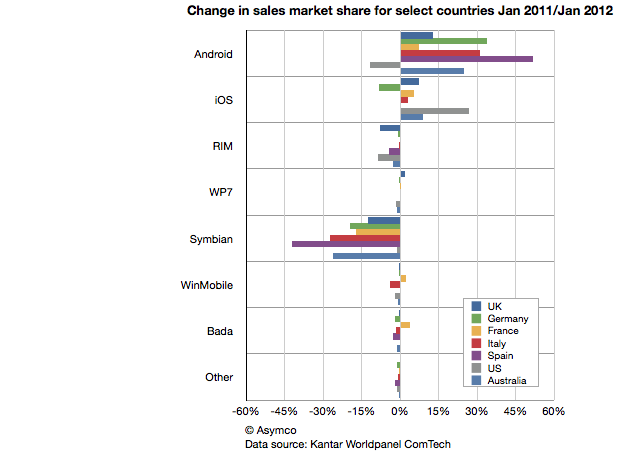
    This symmetry can also be observed in another set of data. Published in The Guardian Kantar Worldpanel ComTech data shows the OS share changes for January on a year/year basis for a select set of countries.

    Android share gains do seem to be mirrored by Symbian share losses on a country-level.

    This should be most interesting to Nokia and Microsoft as both have a lot riding on Windows Phone replacing Symbian sales. If there should be a recovery in the fortunes of these companies, it would seem that their strategies should focus primarily on stemming and then reversing the losses to Android.

    Microsoft's strategy of increasing the cost structure for Android through IP licensing is certainly part of this picture but it's a slow process to turn that disincentive for Android into a large incentive for Windows Phone.

    Indeed, the speed with which Android handsets can be developed seems to be a key value of that operating system and one for which Microsoft does not have a good answer.  Nokia is now one year into its commitment to the Microsoft platform and it has a very limited portfolio to show for it (and limited sales as well.) As a result, Nokia's Symbian business evaporated very rapidly. More rapidly than the company anticipated.

    The dilemma for other vendors may well be how long will it take for them to develop a replacement for their Android portfolio in Windows Phone.

    The opportunity cost of this switch is subtle and insidious but may be the root of why we don't see a stampede toward Microsoft. Conversely, Android contract-free, implement-at-will availability may be its greatest selling point.