Asymco

Asymmetric Intelligence

Mac

  1. The tell-tale signs suggesting a platform's demise

    Research · 74 comments

    In the post on OS turning circles, I used the concept of a radius of turning as an analogy for agility. One problem with the analogy is that turning in circles implies a return to a starting point or at least a closing of the loop. The idea is that there is lifecycle repetition. However, in reality, this does not apply to the world of operating systems.

    An OS, as a platform, usually has a finite life. It is born, grows and usually reaches a point where it is no longer supported. Sometimes, a new platform is born to take its place from the original owner but more often a replacement comes from a new challenger company.

    So rather than circles, the analogy of OS lifetimes may be more accurate.

    If we do think of platforms as finite, then the natural question is what causes an end? We need to look for patterns which may indicate when a platform is reaching end of life.

    The difference in this analysis is that the measure of "age" of a platform I use is not time per se but versioning. The logic is that each major version is a meaningful and significant improvement in a platform which needs to be delineated, marketed and celebrated. It embodies the business logic as well as the engineering logic of the platform custodian.

    Taking the data from the last post I added a few more platforms: Symbian[1], PalmOS and Blackberry OS[2] to seek out patterns. I also separated the desktop/portable OS's from Mobile OS's and plotted these version-demarcated lifespans.
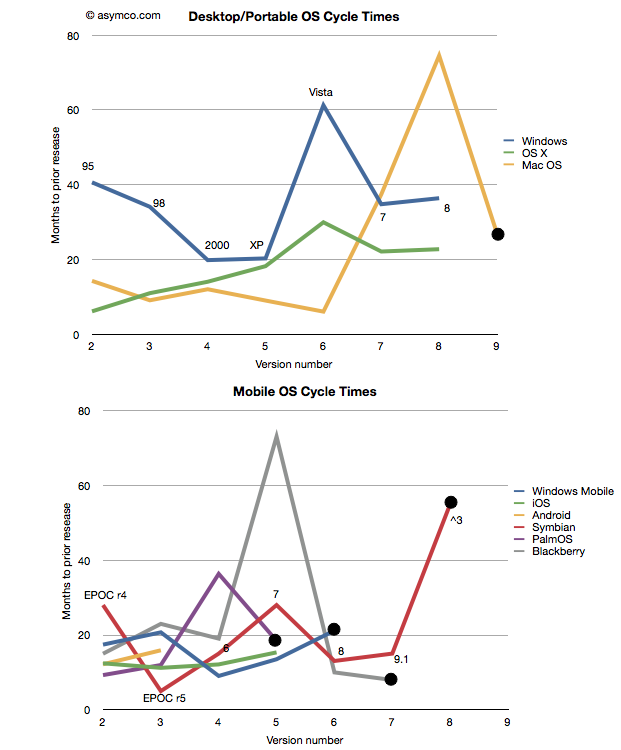
    One thing to observe is that the scales of the two charts are comparable. There are examples of short- and long-term version updates and the number of iterations (lifespan) can be similar. I noted also that there were several platforms which have reached end-of-life[3][4]. Those platforms have a big black dot at the end of the line.

    That leads to another observation. The end of a platform seems to be indicated not by simple age (the shortest lived was six years and the longest lived was 16) nor by the number of versions (PalmOS lived for five while MacOS lived for nine). Instead the end of life is most clearly visible as a lengthening of the development cycle.

    Note that each platform that ended was preceded by a spike into the vertical--a significant delay in the release of a version. The data is one thing, but it's anecdotally supported by observation. Industry observers note that delays in improving the product are symptoms of some fundamental architectural or marketing roadblock. In the case of Mac OS, Apple struggled to bring modernity to its "Classic" OS. It need memory management, more reliability and a better file system to support the move to networking and media hub use that defined the consumer expectations of a PC.

    There was a change in the basis of competition, away from pure productivity and more toward entertainment that turned out to be more demanding in new ways. Apple had to move away from Mac OS and lost time with its internal Copland effort before punting with NextSTEP. Similar transitions are visible with Palm (from PalmOS to WebOS), Microsoft (from Windows Mobile to Windows Phone) and Nokia (from Symbian to MeeGo) and RIM (from Blackberry OS to QNX). In fact, survival of a transition is relatively rare and never without significant pain and loss of value or share.

    This is also understandable through the lens of disruption theory. As a product reached the point of being good enough, "breakthroughs" are harder to come by. Engineers and marketers struggle to push the product into increasingly rarefied strata of performance. The old architecture does not fit the new demands but it's crammed into them anyway. This last big push is then followed by a stall and ultimate demise. Meanwhile, an entrant gains lift in the rich atmosphere of new bases of competition with an architecture that's built specifically for it. The process then repeats.

    And so the charts relate the same story of sustaining improvements followed by inevitable last gasps that Clayton Christensen first illustrated[5] in The Innovator's Dilemma. A book that came out just as the first mobile platforms cataloged in these charts began their ascent.

    ---

    Notes:

    1. Versions of Symbian do not match easily to integer values. I used the versions as recorded by pdadb.net. The sequence is as follows: EPOC Release 3: "1", Release 4: "2", Release 5: "3", Symbian OS 6.0: "4", OS 7.0: "5",  OS 8.0: "6", OS 9.1: "7" (9.0 was deproductized), Symbian ^3: "8". Symbian ^4 has been cancelled. These original version numbers are noted on the chart.
    2. The times recorded are for "general availability of product" which in the case of mobile OS's means the time when a device using that OS was released.


      Symbian
      PalmOS
      Blackberry
      Jun-97
      Jun-96
      Jan-99
      Oct-99
      Mar-97
      Apr-00
      Mar-00
      Mar-98
      Mar-02
      Jun-01
      Mar-01
      Oct-03
      Oct-03
      Oct-02
      Nov-09
      Nov-04
      Sep-10
      Feb-06
      May-11
      Sep-10
    3. End of life is defined as the last version generally available. In some cases (e.g. PalmOS 6) newer versions are built but they may not be released into a working complete product.
    4. Windows Mobile is treated differently here than in the previous post. I chose to declare it EOL after version 6 and consider Windows Phone as a separate OS. This is because the name change is indicative of a break with the past. As before, I defer decisions about continuity to the developers and/or marketers who choose the naming conventions.
    5. See slides 3 and 5 here
  2. OS turning circles: Questioning Windows' maneuverability

    Podcast · 137 comments

    [Updated with Mac OS versions. See footnote 3.]

    I'm glad Windows 8 is named the way it is. With Windows 7 Microsoft went to a numbering system which is much more rational than the mixed naming of the past. The number 8 actually corresponds to the actual sequential number of major versions of Windows released to date.

    Windows proper actually did not start with what was called "Windows 1.0". Windows actually started in April 1992 when Windows 3.1 was released. It was the first Windows which was an operating environment onto itself, apart from DOS. It was followed by Windows 95 (which we can call "2"), Windows 98 ("3"), Windows 2000 ("4"), Windows XP ("5"), Windows Vista ("6"), Windows 7 and now Windows 8.

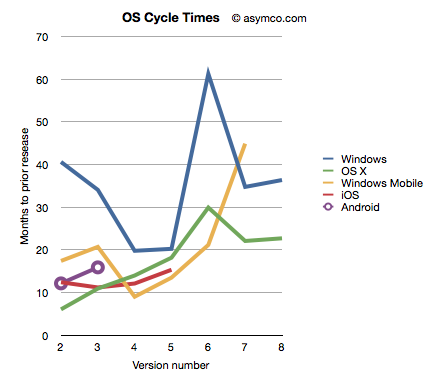
    Given this nomenclature and the dates of general availability of said versions, we can derive a measure of the frequency of upgrades. For example Windows "2" followed about 41 months after "1" and "3" took 34 months after "2". If we continue this for all the versions, and assume "8" will launch by October next year, we can plot the cycle times of new Windows versions.

    To make the story more interesting I added the same data for other OS platforms. OS X, iOS and Android have version numbers which correspond to the sequential order in which they were released. I am assuming that the numbering system (1.0, 2.0, 3.0 etc.) are meaningful and that major releases are given a new integer value.[1]

    I also added Windows Mobile which suffered from the same confused numbering that Windows suffered until the current Windows Phone 7. To create a map to integer values I used the following: Pocket PC 2000 is "1", Pocket PC 2002 is "2", WinMo 2003 is "3", WinMo 2003 SE is "4", WinMo 5 is "5", WinMo 6 is "6" and Windows Phone 7 is "7". There is no clarity when and what Windows Phone 8 will be so that is left off the chart.

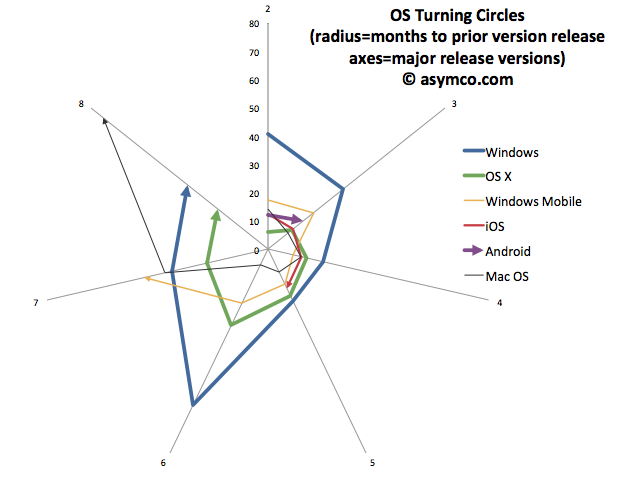
    The chart above does give a clue that Windows is a bit slower (more months between releases) than alternatives. However, the point I want to convey is that this cycle time can be a strategic advantage. A faster upgrade cycle means more rapid adoption of improvements, not to mention more revenues. Rather than a line chart, the better way to visualize it is as a turning circle.

    The analogy is from aerial combat where a plane that can "turn inside" an opponent can get into a firing position. The tightness of turning circles also means that a competitor can iterate more quickly and thus move up the trajectory of improvements necessary to remain competitive more rapidly. To that end, I re-plotted the data above with radial axes.

    The chart clearly shows how among desktops, OS X has been tighter than Windows[3]. Furthermore, mobile OS's have been, typically, more agile than desktop OS's. The exception being Windows Mobile which had significant architectural and business model challenges. It will be interesting to watch the radius of Android. So far it seems to be tight, but as tablet functionality has been added, the speed of change has slowed slightly.

    However, the big contrast is between mobile and desktop. Microsoft tries with Windows 8 to merge the two. But these are different ecosystems. Buyers, OEMs, users, all have different behavioral patterns (jobs-to-be-done) for mobile OS vs. desktop/portables. Will the cycle time for Windows 9 and Windows 10 tighten up? Can Microsoft operate its OS division at this new cycle time?

    What is even more bad news is that the most important customers for Microsoft, enterprises, actually upgrade every other version. The Windows "radius" is nominally averaging about 35 months but large account adoption is closer to 60 months.

    The contrast is then striking: Consumerized devices with over-the-air updates on a 12 month cycle are five times more agile than a traditional corporate Windows desktop. Another way to look at this is that for every change in a corporate desktop environment, the average user will change their device experience five times. Although Microsoft might find comfort in Enterprises' leisurely pace of change[2], those are the wrong customers to keep happy going forward.

    The implications are left as an exercise to the reader, but I would argue that along with the asymmetry in business model around pricing that I highlighted in the last Critical Path podcast, Microsoft has a significant operational asymmetry with devices as a new class of computers.

    ---

    Notes:

    1. The dates of general availability of various versions of operating systems.


      Version
      Windows
      OS X
      Windows Mobile
      iOS
      Android
      1
      4/6/92
      3/24/01
      4/19/00
      6/29/07
      10/21/08
      2
      8/24/95
      9/25/01
      10/1/01
      7/11/08
      10/26/09
      3
      6/25/98
      8/24/02
      6/23/03
      6/17/09
      2/22/11
      4
      2/17/00
      10/24/03
      3/24/04
      6/21/10
      5
      10/25/01
      4/29/05
      5/9/05
      10/1/11
      6
      11/30/06
      10/26/07
      2/12/07
      7
      10/22/09
      8/28/09
      11/8/10
      8
      11/1/12
      7/20/11
       
    2. While at Nokia's Enterprise Solutions I was witness to this difference between the cycle time of devices and the pace of adoption of Enterprises. The fundamental disconnect was that the sales cycle for a "solution" was longer than the shelf life of a device upon which that solution was predicated. Needless to say, Nokia Enterprise Solutions did not last long. Nor do we see today any significant Enterprise-focused mobile device businesses (RIM itself moved to consumerize its products years ago.)
    3. I added Mac OS data to the second chart to also illustrate that no company is immune from spinning out of control. Mac OS clearly went spun out after version 6 with increasing delays leading to its demise and replacement. You can also note that its replacement (OS X) was able to straighten-up and fly right. The lesson may be perhaps that ditching and starting over is a viable option.
  3. HP's decade-long departure

    Research · 221 comments

    HP's sudden departure from a business model that has sustained the company since inception is symptomatic of the passing of an era. Yesterday HP announced that it would exit the PC and tablet computer business, focusing on higher-margin "strategic priorities of cloud, solutions and software with an emphasis on enterprise, commercial and government markets." In other words, HP is fleeing upmarket, away from a core that it will abandon to device makers.

    HP management conceded that the disruptive impact of the iPad forced their hand but that hand was already quite weak from a decade of over-serving the market. The last decade offered plenty of opportunities for incumbent PC companies to adjust to the realities of mobility. However only one computer maker made the transition.

    Why is that?

    Consider how HP and Apple faced the changes in the PC market almost exactly a decade ago.

    • On September 3, 2001, HP announced that they would acquire Compaq.
    • On October 23, 2001, Apple announced the iPod.

    The rest, as they say, is history.

    But what would any reasonable person have done? The PC industry was no longer young but still thriving, why not consolidate? Consolidation is a natural and well-reasoned practice for maturing industries. You get rid of over-capacity, you consolidate overhead, "leverage synergies" and boost margins.

    And it's not like they were ignoring innovation. Compaq had a growing line of PDAs, so there were plenty of diversification opportunities. Microsoft was offering Pocket PC and the Phone edition was on the roadmap. HP was clearly watching mobility carefully.

    Contrast that with Apple's predicament. Which aspiring manager would want to deal with the disaster that was Apple at the time? Apple was struggling with a declining Mac business and had just re-booted it with OS X but it seemed a quixotic effort. Moving to music players seemed desperate (and late). Margins were low, commodity vendors were lining up, record labels offered resistance, they did not have any IP or any DRM and nothing but Mac users as target audience.

    As it turns out, the path of sustaining and the path of disruption diverged that moment in time a decade ago. Companies like HTC, Apple and RIM were embryonic in their device businesses vs. Goliaths like Microsoft, HP and Dell. But they grew, at first slowly, but at all times profitably.

    By the time their success was worth noticing, in 2004, HP and Dell decided to dabble in devices. But all their efforts were half-hearted. They did not crave profits but growth and share. HP's PDAs and phones never received management attention. How do I know? Because they relied on off-the-shelf components for everything including software. It indicated that the value to be offered was in "leveraging" (there's that word again) their brand and distribution. The value of HP was not to build something great--something that required blood, sweat and tears.

    The result was a set of mediocre experiences while the (now incumbent) Apple was iterating rapidly into new directions. By the time the future was self-evident, it was too late to build foundations. HP did the right thing to acquire Palm, but they did it far too late. In 2010 the game was over.

    How cruel.

    But that's the nature of unforeseeable growth: you cannot foresee what will happen and plans never work out. Data and planning don't help. The lesson is that you need to plan for that which cannot be planned. When you are at your peak you must assume failure is imminent and when you are at the trough you must assume success is inevitable.

    All failures of strategy are rooted in the assumption that outcomes are predictable.

    This is why I expect Apple is now working on shaping the post-iPhone world.

    --

    Update: This article has also been published in the Harvard Business Review blog: HP's Decade-Long Departure - Horace Dediu - Harvard Business Review

  4. Apple has moved on

    Research · 36 comments

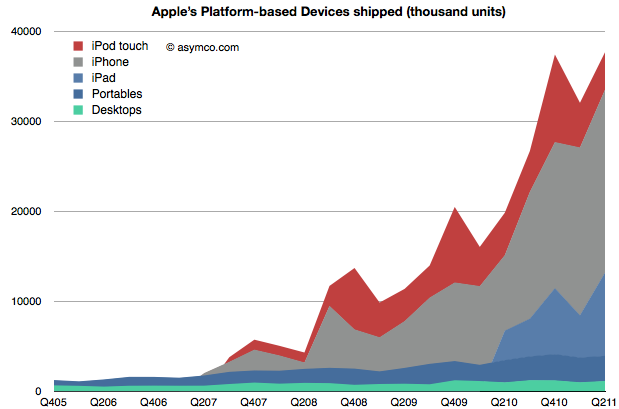
    When Apple changed its name from Apple Computer to Apple Inc. they signaled that their business has moved on. We can say it's to devices or to mobile computing or to the Post-PC era. To understand that this is not a shift driven only by wishful thinking we can plot the change in volumes for the platform-based devices Apple sells.

    The stack of products is shown in an increasing level of mobility. At the bottom is the non-portable desktop Mac, above are Mac portables (laptops) followed by the iPad, iPhone and iPod touch. The mobile computers Apple sells are explosively more popular (and important).

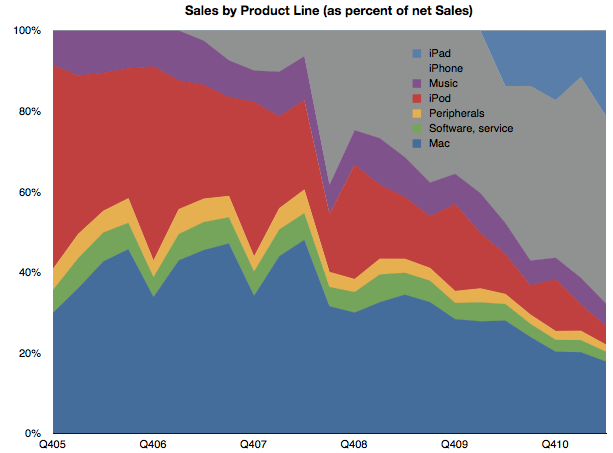
    To gauge importance consider the following chart which shows the unit values above multiplied by the average price they are able to obtain for a picture of the sales mix.

    (I also added Peripherals, Music and Software sales as well as iPod (non-touch) for a complete split of revenues).

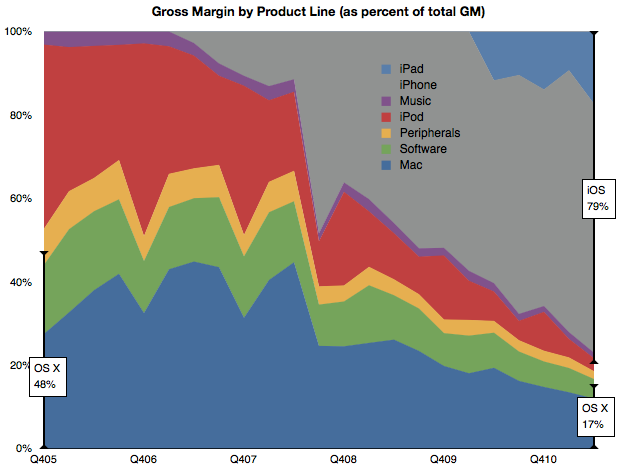
    Mobile computers are now well above half the revenue base for Apple. Finally, if we consider the contribution to profitability of each product line, we can see how iOS-enabled products (as a proxy for mobile computing) have become the vast bulk of profit creation for Apple.

    By this metric, we can see that mobile computing (as opposed to portable or immobile computing) is driving 80% of Apple's profitability. This 80/20 mix of mobile/non-mobile should put aside any doubts that Apple has moved on to be a business oriented around mobility rather than traditional computing.

    This cannot be said for many of Apple's contemporaries. Microsoft derives negligible revenues from mobility. Neither does Intel, nor Dell or HP and even Google's revenue lines don't make mention of mobile income.

    In fact, the only companies which do have mobile revenues as 80% of their income are those dedicated to telecom markets. Namely, Nokia, Motorola, Sony Ericsson, RIM et. al. But, as we shall see in the quarterly mobile market overview, few of Apple's mobile-focused competitors are doing well.

    So Apple is a unique company that has made the transition from one industry to another and, in so doing, captured the bulk of the profits. In passing, I should also mention that the traditional Mac business is still doing well and, by some measures, is capturing the bulk of the PC hardware profits.

    So the key to much of assessing Apple's value and opportunity should be based on this new market (mobile computing) rather than the traditional competitive landscape of PCs and operating systems. The company has moved on, now we wait to see how long before analysis of the company follows.

  5. How we do all this will never be the same

    Research · 36 comments

    In a new ad for the iPad Apple once again makes the case that the tablet is a good substitute for a PC in a number of use cases (and permits some new ones.)

    We'll never stop sharing our memories. Or getting lost in a good book. We'll always cook dinner and cheer for our favorite team. We'll still go to meetings, make home movies, and learn new things. But how we do all this will never be the same.

    This belief that the iPad "cannibalizes" the PC is a powerful concept. The growth of the PC has certainly been affected. But has the Mac's growth also been affected?

    Tim Cook seems to think so. In the earnings call he said:

    In terms of cannibalization, we do believe that some customers chose to purchase an iPad instead of the new Mac during the quarter, but we also believe that even more customers chose to purchase an iPad over Windows PC. And as I've said before, there's a lot more of the Windows PC business to cannibalize than the Mac.

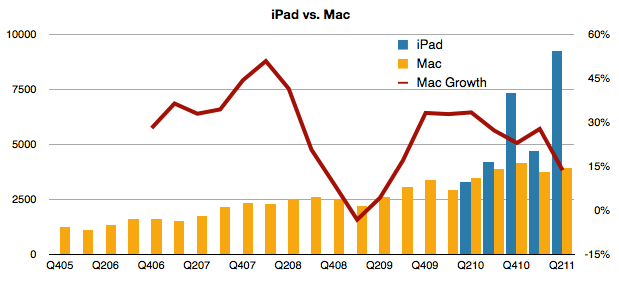
    If we look at the behavior of Mac vs. iPad, the following chart may be useful:

    First off, we can observe that since introduction, iPad has always sold more units than the Mac. Now it's selling more than twice as many units and the revenue from those units is higher than those of the Mac. The other line to look at is the growth (y/y). During the time that the iPad has been shipping, the Mac growth has been declining.

    Yes, it's still growing at five times the rate of the PC market (and 7.5 times the rate of Windows only PCs), but the iPad phenomenon is indeed affecting the Mac.

    With the launch of Lion, Apple is clearly showing that there is dramatic improvement potential in traditional personal computing. But increasingly the improvements are "borrowed" from touch interfaces. Clearly, as the ad implies, computing will never be the same again.

  6. A new way to value Apple

    Research · 38 comments

    Almost all valuation models for Apple assume it's a hardware company. The modeling algorithm for hardware is simple:

    • For each year in near future
    • For each product line
    • Compute contribution
    • Determine company value by summing contributions and multiplying by a P/E ratio

    The major difficulty is in predicting the growth of each product line. This is difficult because buyers can be fickle. Companies employs all sorts of tools in order to secure repeat customers but if switching costs are low, the company can crash in value. For this reason, analysts pick various ways to predict device  sales. Some choose to index each product on production (channel checks), demand (customer surveys,)  or even on a top-down share of total (market research on growth of whole market and assumptions of share).

    Although simple and convenient, this model does not probably match the way Apple is managed. The company does not build hardware products to sell and forget. It builds platforms which are best seen as sources of recurring revenues. Users are incentivized to continue buying devices. iCloud, iTunes and other Apple properties are expressly designed to that goal--and they are not cheap to run. So, the company must see the world through a different set of lenses than the default model shown above.

    To think about the business like they do, we need to put the data through a similar set of lenses. I began with a modest proposal last month to value each user as a source of recurring revenue. Now it's time to expand on this method.

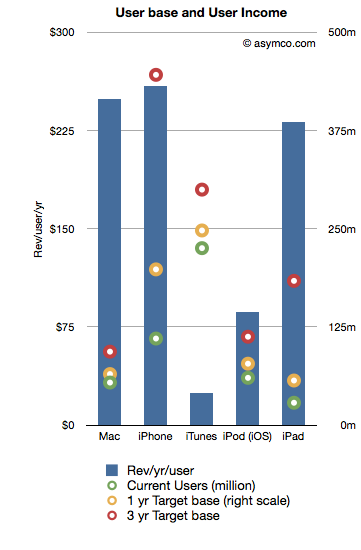
    The following chart shows the recurring revenues per user by product and the current and possible future size of user bases.[2]

    Revenues/yr/user are bars with the left axis and the User bases are various colored circles indexed with the right axis.

    The assumptions that went into the data are as follows:

    1. Device life span is as per previous article linked above
    2. User base growth for 1 year is: Mac 20%, iPhone 80%, iTunes 10%, iPod 30%, iPad 100%
    3. User base growth for 2nd and 3rd years (recurring): Mac 20%, iPhone 50%, iTunes 10%, iPod 20%, iPad 80%.
    4. The Revenue per user is assumed constant

    Note that the user base growth figures are lower than the product growth levels seen historically. Obviously, the model is highly sensitive to these growth assumptions so they need to be scrutinized and tested rigorously.

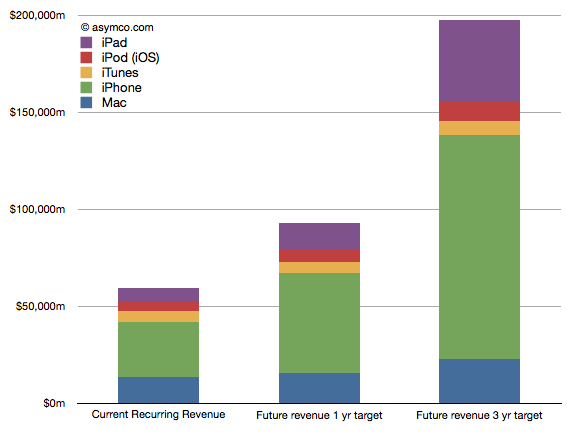
    Nevertheless, as a straw-man proposal,  the recurring revenues for all these products[1] is shown in the following chart:

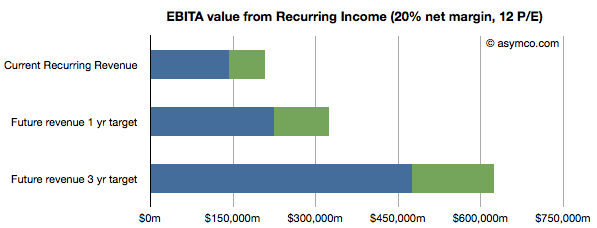
    Once the income is estimated, we can take that value and assume a profit margin (net) and then multiply the earnings by a multiple. Using a 20% net margin and 12x P/E yields the following chart.

    (I added an assumed level of cash in green.)

    This model would imply that the company today could be valued at $208 billion on the basis of its installed base alone. That value would be about $323 billion in one year and $620 billion in three years. Dividing by the number of shares outstanding (935m this year increasing at 2% a year) yields a share price of $222, $339 and $629 by mid 2014.

    These values can be considered "lower bounds" on valuation since they assume income from previously secured customers. The speculative part of investment would be based on what the future bases will look like (so, for example, if one believes these assumptions, the $629 figure could be considered a target to be discounted to today).

    ---

    Notes:

    1. Excludes Software, Peripherals, non-iOS devices, and any other service revenue.
    2. Compare this char to social media companies (MIT Technology Review)
  7. Is the tablet computer a new PC or post-PC?

    Research · 60 comments

    Steve Ballmer stated and Andy Lees confirmed that Microsoft views iPad and other tablets as "just PCs". From a market measurement point of view Canalys agrees. IDC and Gartner don't, calling the new devices "media tablets."

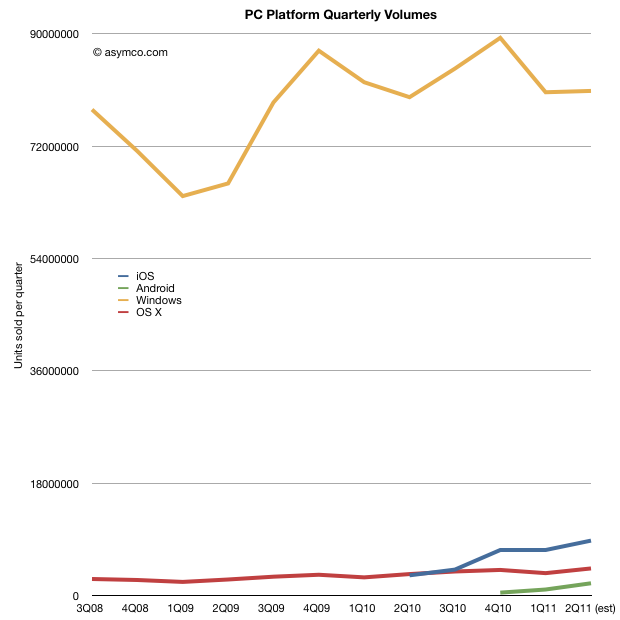
    Before deciding whether tablets belong with PCs in market metrics, it would be interesting to look at what the data shows. When seen as a combined market, the focus should be on platforms. The following chart shows the four main PC+tablet platform volumes since late 2008 [1].

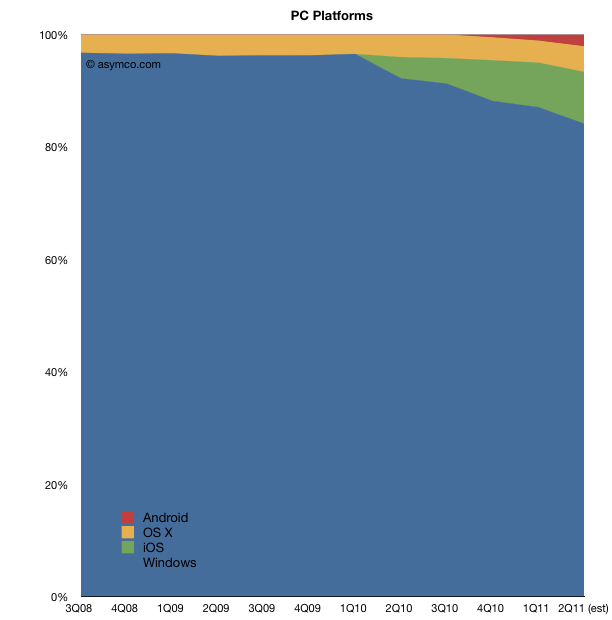
    The second chart shows the same data as share of total market:

    This comparison allows for some fresh observations:

    1. Excluding iPads, Apple is very close to being 5th largest global PC vendor. Global share likely to be above 5%. Including iPads, Apple would be 2nd.
    2. Platform year-on-year growth was Windows: +1.3%, OS X: +26%, iOS: +170%. Android growth cannot yet be measured since Android tablets have not been on the market for more than 1 year.
    3. In Q2 2011 one million more Windows PCs were sold than in Q2 2010. In same time, 903k more OS X PCs and 5.5 million more iPads.
    4. Excluding tablets, nearly 50% of the global PC growth was due to the Mac. Including iPad, Apple was responsible for ~70% of the growth in the PC market in Q2.

    The picture that emerges is that while Windows continues to be dominant with 84% of units sold in the last quarter, the growth belongs to tablets which captured about 90% of it. If Windows remains marginal on tablets, the "PC market" will likely tip away from Microsoft in two years (depending on how quickly Apple can build iPads.)

    Microsoft is making the commitment to move Windows to a tablet form factor but they are doing it while retaining the user interaction model of a desktop. This may or may not work but they are also conceding that a separate experience is also necessary. By rejecting the notion that a mobile OS alone can do the job, they are essentially building a "hybrid" tablet/laptop/desktop product which may be challenging to use but preserve their presence in the form factor.

    Whether Microsoft succeeds or not will depend on whether the new form factor is disruptive in more than user experience. In other words whether this is just a "new PC" or a "post-PC". The argument comes down to business model changes. For example the new model comes with different cycle time of product development (deep, integrated, yearly changes), different ecosystem (apps), different cost structures (high R&D in hardware), vast scale (device economics, components, ramps), and potentially new distribution (operators in the channel mix.)

    Summed up, the real challenge for Microsoft is whether they can keep their business model (selling OS licenses to hardware vendors) as PCs become more device-like. Not only is iOS setting the benchmark for performance but Android is potentially ready to take share if the market turns slightly more modular. Microsoft's differentiation looks to be primarily its legacy of PC software.

    It may also seem that much remains to be discovered in this market but I think the main bets have already been made. The PC market as we know it is in the end game.

    ---

    Notes:

    1. I used Gartner data for overall world-wide PC market and merged it with Mac and iPad data from Apple. Android data is estimated.
  8. How much is an iOS user worth to Apple? About $150. Every year.

    Research · 48 comments

    During the last WWDC Apple revealed that there were 54 million active Mac users. If we look at the history of the product we can see that it took about 5.5 years to sell 54 million Macs. If we assume therefore that the average lifetime of a Mac is 5.5 years and knowing that Mac sales generated revenues of about $73.8 billion then we can estimate the average revenues/year/mac user: $250.

    Repeating the exercise with 180 million current iOS users who purchased about 200 million iOS devices and assuming a life span of 3.5 years gives the average revenue/year/iOS user of about $150.

    These are recurring figures. If we assume these users are loyal then they will likely spend this amount indefinitely and each additional user will be worth a similar amount.

    So, for example, if we assume that the number of Mac users reaches 100 million then we can also assume that they will generate about $25 billion/yr in recurring revenues.

    Likewise, if we extrapolate growth of iOS to 500 million users then we can assume they will generate $74 billion/yr in recurring revenues.

    Adding these together gives a potential recurring income level of $95 billion/yr for installed base alone (excluding iPods, Peripherals, iTunes apps/songs, and Software sales.) Today that figure is about $40 billion/yr. [1]

    Interesting valuation exercises can follow. [2] It would also be interesting to perform a similar analysis for other vendors/platforms.

    ---

    Notes:

    1. Note that actual sales are considerably higher than this figure as new customers are added. These figures should be considered "baseline" sales.
    2. Thanks to a kind reader for suggesting this line of analysis.
  9. The trouble with halos

    Research · 45 comments

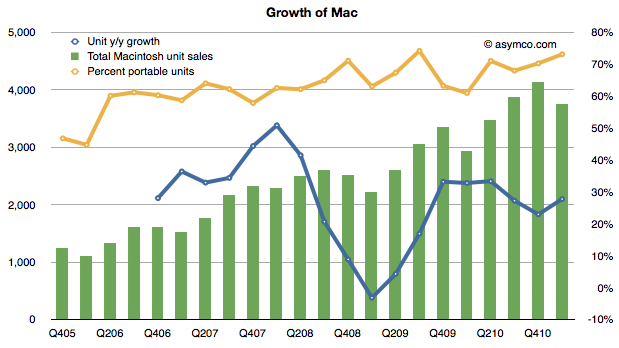
    The Mac grew at 28% while the overall PC market contracted at 3%. The Mac has outperformed the PC market overall for 20 consecutive quarters.

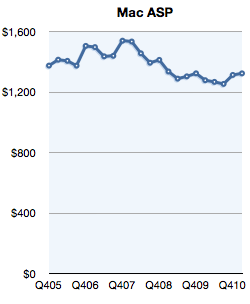
    Prices increased sequentially and year-to-year.

    I've mentioned the increasing shift of Mac mix to portables as a possible reason for the growth of the business. The Mac was one of the first to move to a portable form factor and has been pushing portability over performance for many years.

    The following chart shows the relationship between growth and portable mix:

    The trouble is that mix is not enough to explain the increasing gap with the rest of the PC industry. Windows PCs have also embraced portability and have even run down the path of over-serving portability with the netbook.

    Clearly something else must also be at work. This was even noted by Apple's COO Tim Cook in the last conference call in response to question on the effect of iPhone growth on the Mac:

    [iPhone] clearly seems to be creating a halo effect for the Mac. And I think that's one reason we see the growth that we are seeing on the Mac. It's amazing when you see the 28% year-over-year versus the worldwide market in PCs contracting by 3 points. It's an astonishing delta.

    The delta has been there for a while but it's widening and it's persistent.

    I've never been comfortable with the halo effect. Not because it's not happening but because we don't have a way to measure it. I've never seen reliable data that establishes a causal link. Lots of anecdote but little proof.

    The other problem with halo is that it implies illusion and hence impermanence. The halo effect is a cognitive bias which can mislead. An example would be judging a good-looking person as more intelligent.

    This effect is often exploited in marketing. It's quite common in the automotive industry where halo vehicles (e.g. Ford GT 40 or Dodge Viper) are created which promote sales for the entire brand even though they may lose money. These efforts often fail or have temporary benefits at best.

    When it's deliberate and an attempt to prop up something unworthy it seems deceptive, dangerous and temporary (buyers may be disappointed when they buy a Ford or Dodge and realize that they are not supercars and a reverse halo effect can emerge.)

    A halo effect should be used to boost a product that is under-rated not badly rated. This is when the effect creates benefit over a long period of time like the five years over which the Mac has over-performed.

  10. Windows generates less than a third the profit of iOS + OS X

    Research · 35 comments

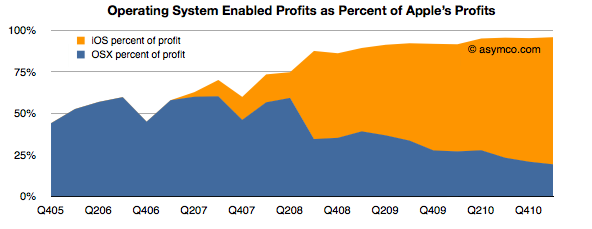
    While a lot of the credit for Apple's success is rightfully assigned to the iOS franchises, the OS X business has more than quadrupled in five years. This has happened without drastic price fluctuations. Neither holds for the overall PC industry which has seen both volume and sales decline while prices have eroded along with profitability. On top of that, growth has nearly evaporated.

    Even with this success, as a percent of total value created, the Mac accounts for a mere 13% of Apple's profit. Including software as part of the OS X franchise implies that OS X is enabling about 20% of Apple's profits.

    iOS, on the other hand, is accounting for more than 75%. These two platforms combined amount to 96% of Apple's profits (up from 50% four years ago).

    That's $9.8 billion from integrated platform-based devices. One can be very confident that this profit would be negligible without the software differentiation only Apple can offer.

    So $10 billion is a lot of profit to obtain from a business enabled by operating system platform software. How can we get a handle on this size? How big is this? We could compare this with another operating system business: Microsoft Windows.

    Microsoft's Windows and Windows Live Division obtained sales of $4.445 billion in the last quarter with an operating income of $2.764 billion.

    So although Windows earned about twice what the Mac earned[1], iOS and OS X together enable 3.5 times the profits of Windows.

    The end of an era is the end of growth in one dominant business model. The PC era was epitomized by the concentration of profits in a dominant operating system vendor. That growth has slowed if not ended. The post-PC era is being kicked off by a new business model where profits are being concentrated in a hardware+software+service integrator.

    --

    1. Or you could read this as: The Mac generates half the profits of Windows while iOS devices generate 2.3x Windows profits.
  11. Apple Earnings: Evaluating my performance

    Research · 24 comments

    As chronicled here, this quarter I went through three sets of estimates. This is a departure from my standard practice of sticking with one forecast made three months in advance. I felt last quarter was filled with materially important developments which deserved updating.

    So how did I do?

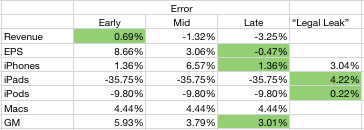
    I wanted to see if the additional information helped or hindered predictability so I put my three predictions side-by-side and measured the errors. I also added the "legal leak" from April 15th (published April 19th) to see whether it was an accurate predictor. The table below shows the error rates with the lowest error highlighted.

    It's clear that my error rate decreased as new information was used. It's also clear that the "legal leak" was very accurate. What follows is a discussion of each line item.

    The iPhone forecast was very accurate both early and late in the quarter. At 1.36% error it was even lower than what was leaked by Apple. I used the information about China and Verizon to boost sell-in and increased the growth rate to 110%. That proved to be the right call. I did not pay any attention to talk of component shortages as I did not consider them to affect Apple whose market share of devices is so low. I would score my "late" estimate as an "A".

    Even though I disclaimed it, my iPad forecast was very inaccurate. In contrast, the leak was very accurate. Although mitigated by the higher sell-through (5.1 million) shipments were constrained by the change in product. Details like the date of shipment, the date of announcement and the ramps made this a particularly difficult transition to predict. At 36% error, I score it as an "F".

    The iPod error was about 10%. That's mediocre. The product dropped in sales by 17% (vs. 10% expected). Again, the mitigating factors, like higher mix of iPod touch and thus increased prices helped to keep the financial performance decent. I score this as a B-.

    The Mac prediction was accurate. The error was less than 5%. I will discuss the Mac business in a separate posting but it suffices to say that the growth was excellent but predictable. I score my prediction as an "A-".

    Revenues were reasonably predictable however pricing seems to have been affected by exchange rate volatility. The iPhone turned out to have a huge average selling price ($660) which made up for the lower revenues from iPad. The error of 3.25% is acceptable. I score it as an "A".

    The Earnings number was very accurate. The error for the late estimate was less than one half of one percent. This bottom line number is a function of all the other numbers so it's the most encompassing. You have to account for factors like interest income, changes in the number of outstanding shares and tax rates. None of these are predictable. However, I was lucky. With an error below 1%, I rate this as an "A+".

    My overall performance as a grade point average would be 3.43 or B.