Asymco

Asymmetric Intelligence

Mac

  1. Revisiting Estimates for Apple’s second quarter earnings (ended March)

    Research · 29 comments

    Estimates for Apple’s second quarter earnings ending March | asymco.

    Since making the original estimates In January,

    • Revenue: $24.5 billion
    • EPS: 5.89
    • iPhone unit sales: 18.4m
    • iPod unit sales: 10m
    • Mac unit sales: 3.6m
    • iPad unit sales: 7.3m
    • Gross margin percentage: 38.8%

    I revised them at the end of March to the following:

    • Revenue: $25 billion
    • EPS: 6.21
    • iPhone unit sales: 17.5m
    • iPod unit sales: 10m
    • Mac unit sales: 3.6m
    • iPad unit sales: 7.3m
    • Gross margin percentage: 39.6%

    In the past I was comfortable keeping untouched estimates made three months in advance. This quarter however there have been several developments during the quarter which were unforeseen and cause me to revisit my estimates.

    1. The Verizon iPhone launch. Observations of the event focused on line lengths and buying activity. However, Apple reports shipments not sell-through. I believe the deal structure was such that Apple obtained a very large order as condition to the relationship. The January and March update analysis did not consider this order size. We have also more data on sales from HTC and RIM and there is no letup in the market's growth. As a result I am revising the growth for the iPhone back up to 110% y/y and 18.4 million units.
    2. Crucially, I'm increasing iPhone ASP to $625 on the basis of this new demand and the likely delay of iPhone 5 launch.
    3. The iPad 2 launch. This product is still too young to see production and sales patterns. However, demand for the second version seems higher than for the first. Distribution is broader too. The unknown is production. I am keeping the unit number at 7.3 million which is the same as the level of CQ4.
    4. China is booming. The Chinese New Year occurred in the quarter and since last year that has meant a sequential increase in device sales for Apple. But it's a double edged-sword. Almost all production activity is shut down during the holiday period. Apple depends on China exclusively for manufacturing so they will certainly be affected. So whereas it's likely that we'll see increased demand from China this year due to even better distribution, macroeconomics and brand value I'm unsure if supply rose to match. Overall, I'm not changing unit growth due to his increased demand but I'm cautioning that there could be downside bias in my estimates.
    5. The tsunami disaster in Japan will affect some demand in Japan and some of the supply chain will be disrupted. However, the effect will be felt more by weaker competitors. It's possible that the event will amplify the shortages that Apple's pre-purchase agreements already created. The consequences are bad news for Apple's competitors but I rate it as neutral for Apple.

    Given these new facts coming to light, I would update my estimates as follows:

    • Revenue: $25.5 billion
    • EPS: 6.43
    • iPhone unit sales: 18.4m
    • iPod unit sales: 10m
    • Mac unit sales: 3.6m
    • iPad unit sales: 7.3m
    • Gross margin percentage: 39.9%

    Resulting EPS growth would thus be 93%.

    For the record, I value my January estimates since they are based on long-term pattern recognition rather than transient events and thus are more useful in forming a market theory.

    However, these transient events cannot be ignored and analysis needs to be informed by both theory and events. I will be watching to see which set of predictions (early, mid or late) will be more accurate.

  2. First quarter PC forecast: Windows down 2%, Mac+iPad up 250%

    Research · 100 comments

    Charles Arthur of The Guardian writes that PC sales "may have passed their peak".  That's a powerful, concise statement. It's backed up by a quote from Gartner's Mikako Kitagawa:

    "This was the third consecutive quarter of mobile PC shipment declines in the US"

    IDC even lays part of the blame to something called "media tablets"[1]:

    "While it's tempting to blame [PC] decline completely on the growth of media tablets we believe other factors [...] played equally significant roles."

    But there are several problems with both IDC and Gartner's analysis of the market. It's hard to make out causality from their data. There is separation by vendor but not by operating system and there is exclusion of devices hired to do the same jobs as PCs.

    For this reason, I need to do my own analysis. I retrieved Gartner's public statements on the overall market and layered actual Mac and iPad units sold. I also added my estimates for the Q1 2011 quarter just ended to complete the picture.

    We can now get an understanding of how the industry behaves with and without various platforms. The chart at the left gives the various growth rates of the market with platforms isolated from each other. I apologize for the shape of the chart but the scale does not permit a concise visual.

    Including the iPad, the total PC growth is shown by the blue line. It shows that the market peaked during the recovery but is now slowing considerably.

    The green line shows the PC industry excluding both the Mac and the iPad. Although it might include Linux or computers sold without an OS, the label "Windows PC" is a fairly close approximation. It shows that the market excluding Apple entered contraction this quarter and is out of sync with overall economic recovery and growth.

    The red line shows the behavior of the Mac franchise. It's well ahead of the overall market with 2x to 3x the growth. This has been a pattern for over 18 quarters.  I had some thoughts on this in a November 2010 hypothesis.

    But the most telling line is the orange line which includes both the Mac and the iPad. In an industry where growth is usually measured in single digits, the iPad business brings growth in three digits.

    This near tripling of unit sales is symptomatic of fundamental change that cannot be ignored. Although some analysts contend that the iPad is not causal to the decline in other PC sales, teasing out platforms data seems to show a divergent view.

    The bottom line is that Windows-only computer units are down 2.0% while OSX-based computer units are up 272% (this excludes both the iPhone and iPod touch).

    Correlation is not causation but tests or surveys where substitution can be proven do exist. For example, a recent survey shows that 77% of users reported that their PC usage decreased after getting a tablet. It also showed that 28% considered their iPad as their primary computer.

    So coupling the sales data with the usage data does point an accusatory finger for the decline on the iPad.

    In addition, some vendors are being hit harder than others which also hints at where substitution is happening. For example, IDC reports that Acer US unit shipments fell 42% in the first quarter and 16% globally (Gartner's numbers are less dramatic but in the same direction). Since Acer is known for its netbook computers it's another telling sign of possible substitution (Acer's own management has indicated as much.)

    So the weight of evidence is beginning to be conclusive: the iPad is the new PC. It should be clear by now that the iPad moves computing into new contexts so it does not yet substitute the PC market but extends it and increases consumption. Substitution is happening in low-end grazing type of usage, a place where the PC was ill-fitting anyway. Incumbent vendors might actually be relieved that the lower margin netbook is finally being supplanted and they can concentrate on the higher end.

    --

    Notes:

    1. Analysts like to call the iPad a "media tablet" but the same AdMob survey shows media consumption to be one of its least popular uses.
  3. The Post PC era as explained by developer events

    Research · 38 comments

    The World-Wide Developer Conference is an event for developers. It is not a trade show and it is not a consumer show or an enterprise show for salespeople. Except for the keynote, all events are subject to Non-disclosure Agreements so it's not even an event whose proceedings can be discussed openly.

    It's also expensive. Registration is at least $1,500. Attendants are there to learn and ask detailed questions about development. It's not for deal making. People not familiar with development would not be well served by the event. Registrations are therefore somewhat limited to about 5000.

    After the iPhone SDK was launched, the WWDC took on a new dimension. It became a mobile development event. As a result, 2008 was the first year when WWDC sold out. Attendance tripled over the Mac-only event the previous year.

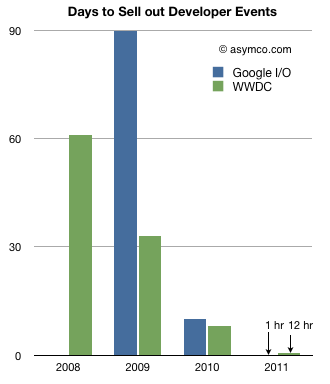
    Every year since, not only has WWDC sold out but it has sold out quicker every time. The following chart shows the days it took to sell out WWDC. I also added Google I/O data for comparison.

    In the era of the iPhone, the limited resource of attendant seats has always been exhausted at accelerated rates: from 60 days in 2008 to 0.5 days in 2011. A similar pattern emerged for the Android event.

    What should be noted is that these events are focused on post-PC development[1][2]. Clearly the increased interest among developers is for the mobile side of the business.

    Developers certainly seem to sense the way the wind is blowing. They are, as humans, prone to over-confidence but they are also often accused of being hard to please. The most common lament among new platform builders is "How do we attract developers?"  The platforms showcased here had no trouble attracting developers in the tens of thousands three years after being launched.

    The Post-PC era is evident in all kinds of data. This set (developer attendance to mobile development) is particularly stark. It's a proxy for investment and IT interest. There is a non-linear nature to this growth and history shows that non-linearity leads to unpredictable or unforeseeable change.

    ---

    Notes:

    1. WWDC still has Mac OS X tracks but that track was there pre-2008 and did not sell out the event.
    2. Microsoft hosts several developer events (PDC, MIX, and Tech·Ed) some of which also sell out, but they have a far wider focus.
  4. Calling the end of innovation in mobile computers

    Research · 72 comments

    People are lining up to call the market for mobile phones. Analysts and amateurs alike are connecting points on charts and predicting with confidence the future of mobile platforms. Consensus is forming that there is no future but a quiescent state. By the acclamation of pundits, the survivors are declared to be iOS and Android. They are also predictably arranged in a way similar to OS X and Windows. End of story.

    Except for one thing.

    3.5 years ago neither of these platforms existed.  In fact, it was only two and a half years ago, in mid 2008, that one of the finalists even became a platform with the launch of an app store. The other "winner" only launched in a handset later that year and had no significant volumes until a year ago. In other words, these suddenly predictable platforms have been in existence for less than the life span of one device that runs them.

    To point out how extraordinary this claim is, if we look back to the history of computing, could we have declared the PC industry future cut and dried in 1978, two years after the founding of Apple? What about 1983, two years after the emergence of the IBM PC? What about 1986, two years after the Mac? Or maybe 1990, after Windows was born? Maybe the writing was on the wall in 1997, two years after Windows 95 caught up with the Mac's UX. That would be 21 years after Apple's founding. Some would argue that even today the story of desktop or portable computing is far from over.

    Sure, times have changed. Things move much faster now. But markets are also much bigger and take a long time to penetrate. Mobile channels are bounded by provincialism and parochialism.

    What's more, it's not like there haven't been platforms before these two upstarts came along. I've seen 9 mobile platforms in 9 years (PalmOS, Windows Mobile, Symbian, Java, WebOS, Windows Phone, iOS, Android, RIM Blackberry). New platforms are still emerging and evolving (e.g. MeeGo, Bada, LiMo, QNX and Tapas).

    So the existential question is this: If you were to draw a time line, would a mark in early 2011 signify the end of mobile platform history? The point in time when unforeseeable change will cease to happen?

    Let me offer a hint as to why not: every major platform battle has been sparked by an innovation built around a new input method. The keyboard integrated into a personal computer in the 1970s, the mouse in the 1980s, the stylus in the 1990s and the fingertip in the 2000s. Each of these input methods created new platforms (DOS/Apple ][, MacOS/Windows, PalmOS/Windows CE, iOS/Android), new ecosystems, new industries, new competitors and new platform battles designed to enrich forecasting pundits. I won't even try to go back to the changed in the half century of computing prior to the PC.

    So here's my challenge to the prognosticators: If you are willing to draw a line in the calendar now and say that no input methods will ever emerge in mobile computing after this point in time I'll buy the thesis that it's over and we can count our chips.

    If you think that out of the hundreds of user experience patents being filed, and hundreds of prototypes being slaved over in labs throughout the world, not a single new product will emerge with a new way of interacting with a computing device, then it's time to move on to something other than what can be declared a commodity market.

    But if you believe that, as happened four years ago, a new input method, previously only in the realm of mockups and movie magic, suddenly was shown, in a working product, on stage, then this business still has a chance of staying interesting.

  5. iPhone and iPad: Fine Young Cannibals?

    Research · 35 comments

    The iPad and iPhone came, saw and conquered new markets. But since the products launched the question on every analyst's mind has been on how much have these products "cannibalized" their brethren the iPod and the Mac.

    This notion of "cannibalization" applies when a product is designed to compete and "eat" the share of another product in a company's portfolio. It has some negative connotations since it implies loss but many times the thinking is that it's better to cannibalize oneself rather than have it done by a competitor.

    But have iPhone and iPad taken share from their competitors?

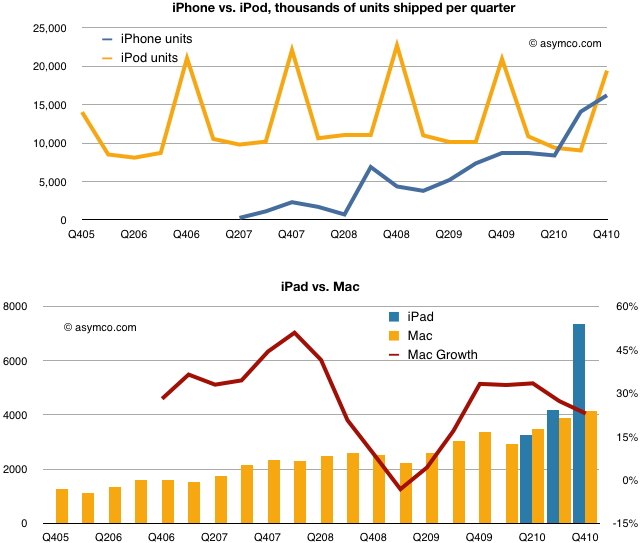
    The following charts compare the total units of iPhones vs. iPods and iPads and iPads vs. Macs.

    The evidence does not show cannibalization.

    Although both iPhone and iPad have crossed over and are selling more units than their internal competitors, the old guard has not faded away.

    Indeed, the Mac shows resilience and the iPod, although not growing in units has maintained sales value. What we don't see is a clear gain for the entrants at the expense of the incumbents.

    We can't be sure how long this happy co-habitation will last, but for now the new products are fine and young but not cannibals.

  6. How does the Mac gain share while increasing its price premium over the Windows PC?

    Research · 54 comments

    Apple set a new record for Mac sales in the fourth quarter. This was not a surprise. The growth was perhaps a bit lower than some expected (including me) but it was still a healthy 23% and 8x the PC growth rate. The Mac has outgrown the PC (and hence has gained share) for 19 quarters straight, nearly five years.

    What's more interesting is where the growth came from. Every region outgrew the market. Asia-Pacific led with a 67% year-over-year increase, almost 10x the market. Japan grew at 56%, which is about 6x the market, and Europe and the United States both grew in double-digits despite both markets contracting overall.

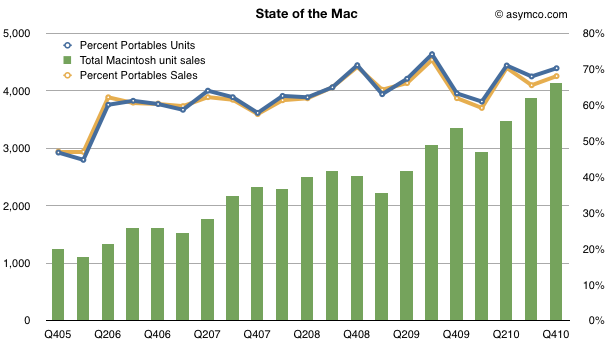
    Looking over a longer time frame, the Mac has nearly quadrupled in volume in five years. In the last quarter of 2005, Apple sold 1.2 million units. In the latest quarter it sold 4.1 million. So the performance has been relatively good.

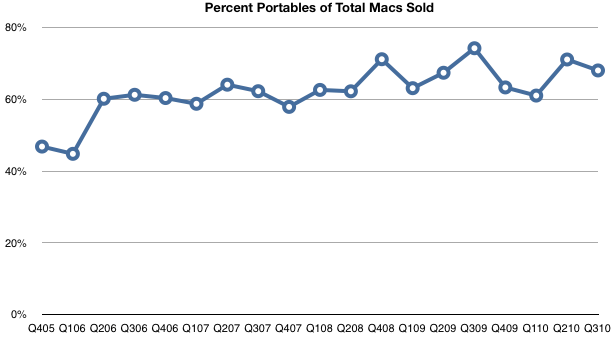
    One significant reason for the growth has been the shift from desktop to portables. The lines show how the percent of portables went from about 50% to 70% of units and sales in four years.

    [hang1column]

    [/hang1column]

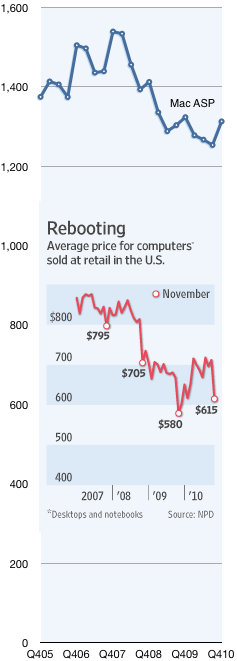
    But what was surprising was that the average selling price increased to $1,313, up from $1,253 and nearly even with last year's $1,324.

    Prices in the PC industry tend to fall. Actually, to be more precise, they tend to collapse. Compare the Mac's price trend with the rest of the industry as seen in the chart to the left[1]. It shows the Mac Average Selling Price which is what Apple books from selling into the channel vs. the retail price of PCs in the US.

    The chart tells a partial story. The PC figures are retail while the Mac figures are wholesale. Furthermore, the PC figures include Mac, so stripping out the Mac would show the PC prices to be even lower. Lastly the Mac figures are global whereas the PC figures are US only.

    But what I want to focus on is not the absolute difference, rather the relative value difference, which is diverging: The average PC went from $795 retail at the end of 2007 to $615 in November 2010. That's a drop of 22%. In the same time frame the Mac went from $1,539 to $1,313 wholesale, a drop of 15%.

    In other words, the Mac price premium at the end of 2007 was at least 93% and it now is at least 114%.

    So here's the real surprise: How does the Mac gain share while increasing its price premium over the PC?

    The only answer I can offer is what I already wrote on the Mac in November:

    ...something changed with PCs when the laptop became “good enough”. With portable computing, the job the PC was hired to do evolved. It was more important that the product be well designed (for aesthetic value, usability and reliability) than just fast and spacious. The microprocessors were plenty fast but what mattered more was low power consumption, a low profile and tighter integration with software.

    In other words, computers became re-integrated. You only need to touch the MacBook Air to understand why.

    ----

    Notes:

    1. The inset chart comes from The Wall Street Journal using data from NPD. The Mac data comes from Apple financial reports.
  7. Measuring iPad enterprise use

    Research · 25 comments

    I've noticed that there is a lot of speculation on the prospects for iPad use "in the enterprise". Business users could sure benefit from the device and anecdotal evidence does point to many cases of use in business.

    But anecdotes are not conclusive evidence. How can one make a better guess? Based on reader input, I thought I'd test this hypothesis directly on my own stats.

    As pointed out a recent posting on my stats, the iPad has been a popular device in accessing this site. 102k out of 1.06m views came from iPad users. A statistically interesting number.

    One way to check enterprise use is to measure the ratio of use of the product during weekends vs. use during weekdays. The logic being that weekend use is almost strictly consumer use and weekday use is mixed. Any normalized significant difference between the two measures should indicate a bias toward consumer use or vice versa.

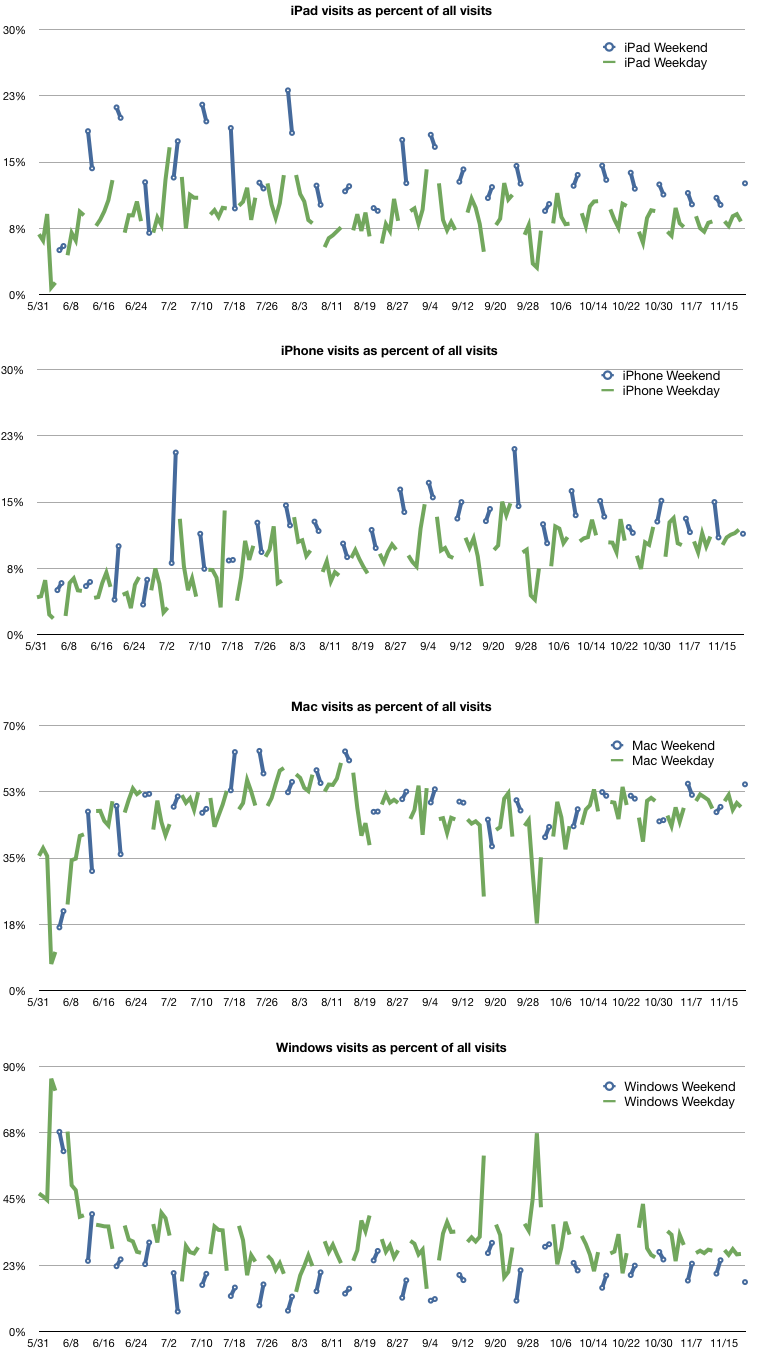
    The following charts show the percent of each platform's use with weekends separated from weekdays.

    The larger the delta the more likely the more the bias one way or the other. To that end I measured the average percent of visits from iPad (as a total of all visits) for weekends and weekdays and measured the delta between the two. On the weekend the iPad was accounting for 13.3% of visits. On weekdays it was 8.8%. A difference of about 4.5% in favor of weekend use.

    To calibrate that figure I did the same for iPhone, Mac and Windows use.

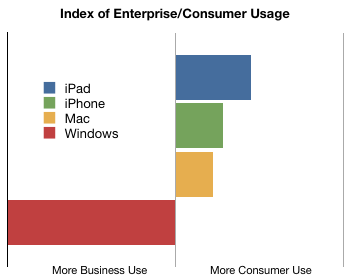
    The following chart shows this ad-hoc index of "enterprise use".

    Essentially the data is inline with assumptions. The iPad is the most likely to be hired by consumers. The iPhone is more than the Mac and they're all far more likely to be consumerized than Windows.

    The average consumption of Asymco.com through Windows was 32% of during weekdays but only 22% during weekends.

    In order to make this measure more meaningful, the evolution over time of these figures should be tracked. If the Blue bar above moves more toward the center then the chances are that iPad will be more adapted by business users, or at least more in use at work.

    Does this seem like a valid method for measuring relative enterprise use?

  8. Why the Mac keeps growing

    Research · 63 comments

    When the iPhone vs. Android rhetorical war heats up, both sides bring up the history of Macs vs. Windows PCs. The commonly held thesis is that Windows triumphed as the PC was commoditized (and modularized). This triumph was at the expense of the over-serving and over-priced Mac.

    This is a largely accurate view of what happened during the 90s. But the problem with this thesis is that (1) the PC's job has been slowly changing in the last decade (2) the Mac keeps growing faster than the PC and (3) Apple keeps capturing a vast portion of the profits in the PC industry.

    These anomalies or contradictions to the thesis imply that something changed. What changed and can these changes turn the tables on the market and create an opportunity for a new computing disruption?

    The PC of the 90s was hired first by companies as a productivity boosting tool and second by consumers as a way to duplicate their work productivity and communications in their personal lives.

    However something changed with PCs when the laptop became "good enough". With portable computing, the job the PC was hired to do evolved. It was more important that the product be well designed (for aesthetic value, usability and reliability) than just fast and spacious. The microprocessors were plenty fast but what mattered more was low power consumption, a low profile and tighter integration with software.

    The product was also purchased in a different way. A desktop could be purchased on specs alone, sight unseen, from a catalog. But a laptop had to be touched, hefted and the screen had to be observed and the whole design contemplated before a purchase decision was made. The product had an integrated keyboard, display, touchpad and storage. It was not easily serviced by end users. It was, in a word, re-integrated.

    You can see how portability changed the job and therefore everything else as well. Consumer tastes became important, retail distribution became necessary and R&D resources had to be applied to solve what was no longer good enough: the whole package.

    Vendors which did not prioritize design, retail and R&D were left flat-footed.

    At the same time, systems software became more commoditized and productivity software became portable. The old measures of performance were being over-shot while the new measures of performance were under-served.

    While this shift was underway on the hardware side, Microsoft continued to improve their product to serve more demanding business productivity jobs. Their software was not getting optimized for this new portable consumer job. They left the new market open to disruption.

    In stepped the MacBook with good enough (and improving) office productivity. With excellent appeal along the dimensions of performance consumers demand most of all. It was priced higher than other laptops but the price points were affordable and, inflation-adjusted, lower than they'd ever been. It should not be a surprise that Apple was one of the first vendors to see its portables line become bigger than its desktop lines. The market evolved to the point where what Apple had was what the buyers needed.

    The shift to portability is a compelling story for Apple as disruptor in the PC market. It may not result in a complete reversal of the PC hegemony but it allows Apple to grow a product line at triple the growth rate of the market. A market that was considered completely dominated by entrenched incumbents with an unbreakable profit formula.

    But with the iPad Apple is clearly also aiming at disrupting the Mac (and, transitively, the PC as a whole.) The iPad can be seen as an evolution toward seamless portability; the mobile computing paradigm shift.

  9. Apple's Growth Scorecard

    Research · 14 comments

    Every quarter I try to score growth by top, bottom and product lines. As unforeseen growth is the only driver creating shareholder value, it's of paramount importance to measuring a company's performance.

    For Apple, the analysis is fairly straight-forward. There are relatively few product lines (seven including the iPad). I measure y/y sales growth and try to form a picture that is easy on the eyes and mind.

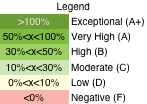
    The method I'm using now is color coding growth for each line according to the legend to the left.

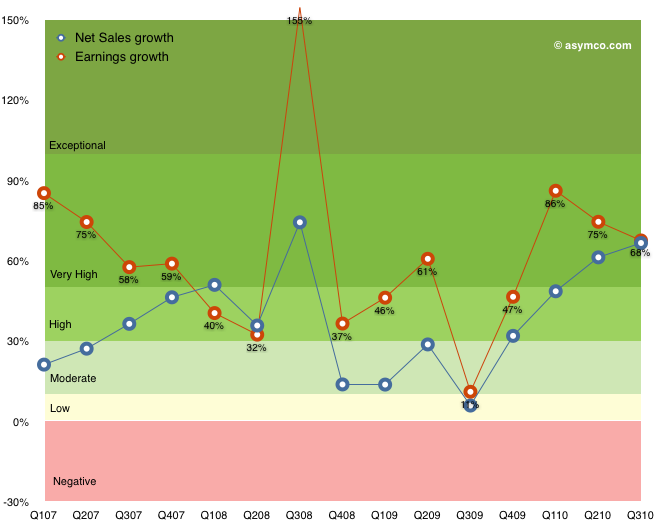
    The table that follows shows each product plus the Net Sales and Earnings lines according to this color coding. I also added an average column for reference.

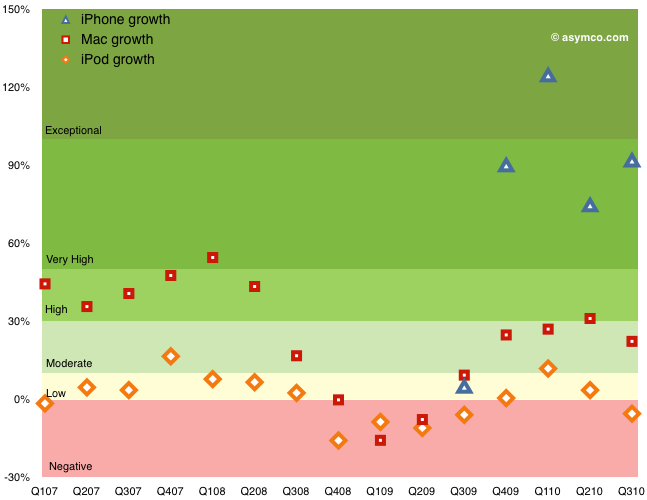
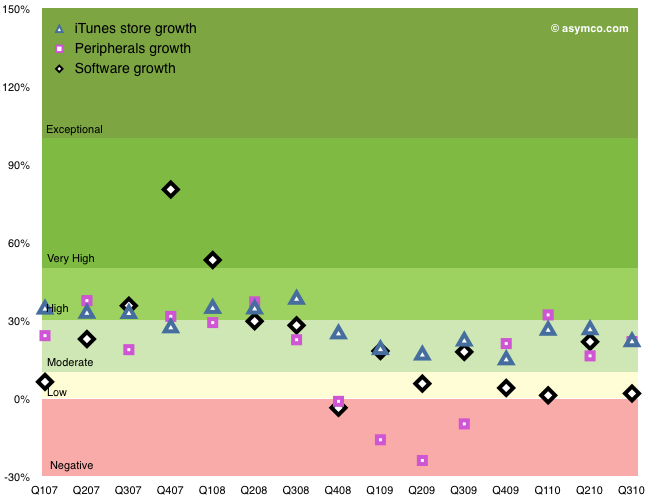
    The following graphs show the same data with color coding for the rates as they change over time. I broke the data into three charts: Top/Bottom lines, Hardware Products, Other Products.

    Discussion

    Hopefully this representation describes the company's growth without requiring too much explanation. Earnings growth, which determines ultimate value created is near all-time highs, well into the "Very High" (A) growth band. Apple have recovered from the Moderate-to-High (B/C) bands during the recession and are near the levels of 2007 when the company was trading at a P/E of 50 (today's P/E for Apple is 20). Sales growth broadly followed earnings growth.

    Within the products, the iPhone again shows exceptional performance. The growth during the first five quarters was (literally) off the scale (above 150%--see table for actuals). The average quarterly y/y growth has been 234%! Last quarter's 92% growth is very near the 100% threshold for exponential growth. This after three years in the market.

    The Mac growth is Moderate (B) and that may be because it was not a launch quarter for portables. The Mac underwent Very High (grade of A) growth for a period of 2008. The iPod shows weakness. The product has been in a Low-to-Negative  (D to F) band of growth since the iPhone launched. Clearly a mature product line but one which has been largely subsumed into the iPhone and iPad. The iPod touch is increasingly a large proportion of the iPod line.

    The non-hardware product lines are Low-to-Moderate growth products. The Peripherals business tracks very closely to the Mac business and dipped negative during the recession.

    Overall, the growth scorecard is in the "Very High" category, or a grade of "A", mostly driven by the iPhone and iPad. Whether this growth will be reflected in the share price is a question reserved for a future discussion.

  10. The Mac App Store: can it change the software business?

    Research · 36 comments

    What is it that makes the iTunes App Store so compelling? Will the value the App store added to the iPhone be added by the Mac App Store to the Mac?

    Here are the characteristics I think make the App Stores valuable:

    1. They redefine software as content. The pricing, marketing, discovery and buying process is identical to that for content like music or video.
    2. They redefine the skill required to create a relationship with customers. They allow a new class of less-skilled and less-capitalized developers participate in selling software directly to the buyer. By "skill" I don't mean engineering skill but marketing skill. A developer can create a product that can reach millions without having to acquire with channels and distribution skills.
    3. From a consumer's point of view, they simplify purchasing and lower the price of software.

    These three characteristics of app stores make them disruptive. The disrupted companies are the traditional software publishers. The response from game publishers to the App store were predictable: they condemned it for destroying value, "cheapening" their product, and creating a race to the bottom. They also predicted that it would all end badly as nobody would make any money.

    The truth is that they were disrupted by different cost structures. The entrants did not need to spend on market development, and focused on innovating on the essential novelty of the user interface.

    So the Mac App Store could be disruptive to traditional software vendors. A large new population of software developers could emerge targeting the Cocoa environment and they may bring new apps that move the jobs that the computer is hired for to appeal to new users.

    However there is a problem. The Mac is a small target market relative to iOS. Apple announced that there are 50 million Mac users. This compares badly to the 130 million (or so) iOS users. It won't be long before 50 million iOS users will be added every three months.

    So the first thing that Apple needs to do is grow the Mac installed base. Perhaps the new Air and following updated to the MacBooks will do just that. But the growth rate needs to be an order of magnitude faster. And I suspect price is an obstacle to this growth.

    Regardless of this obstacle, the Mac App Store has the potential to change the appeal of the Mac. As the first personal computer with an App Store, new uses may emerge and create the same app-platform effect.

  11. Visualizing iPad vs Mac

    Research · 23 comments

    The iPad outsold the Mac after two quarters in the market. It's important to understand the effect the iPad is having on PCs. Data is trickling in that potential notebook buyers are "postponing" purchases due to the iPad. The netbook market has witnessed a significant slowing which has trickled down to the performance of everybody in the value chain, from Microsoft, to PC vendors, Intel, AMD and retailers.

    So naturally we need to ask how it has affected the Mac.

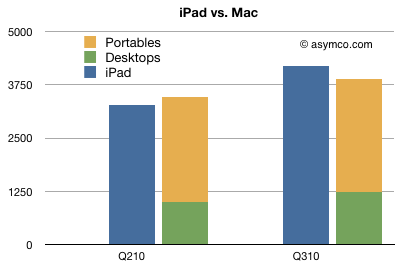
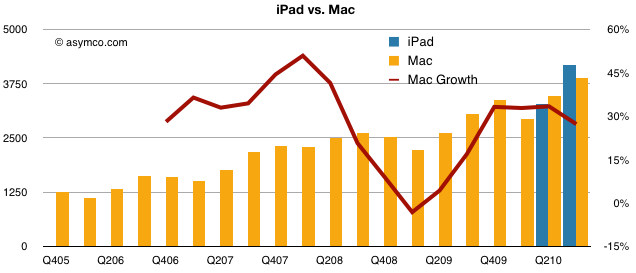
    The following chart shows how the iPad has outsold the Mac the past quarter. The iPad was on the market for six months while the Mac has been for sale for 322 months--a shocking achievement.

    But the Mac has not slowed down. It grew faster than the overall PC market (units grew at 27.3% and revenues grew at 22%) as it has grown for most of the past 18 quarters.

    The performance is also highlighted in the following chart showing the history of the Mac units by quarter over nearly five years. The Mac had a slowdown during the recession but the dip in growth in the last quarter does not seem significant.