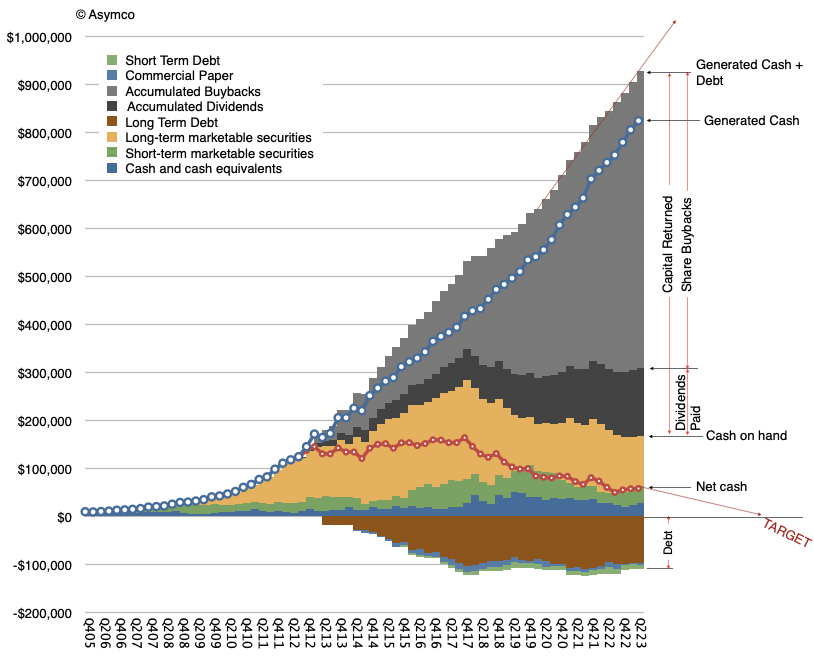
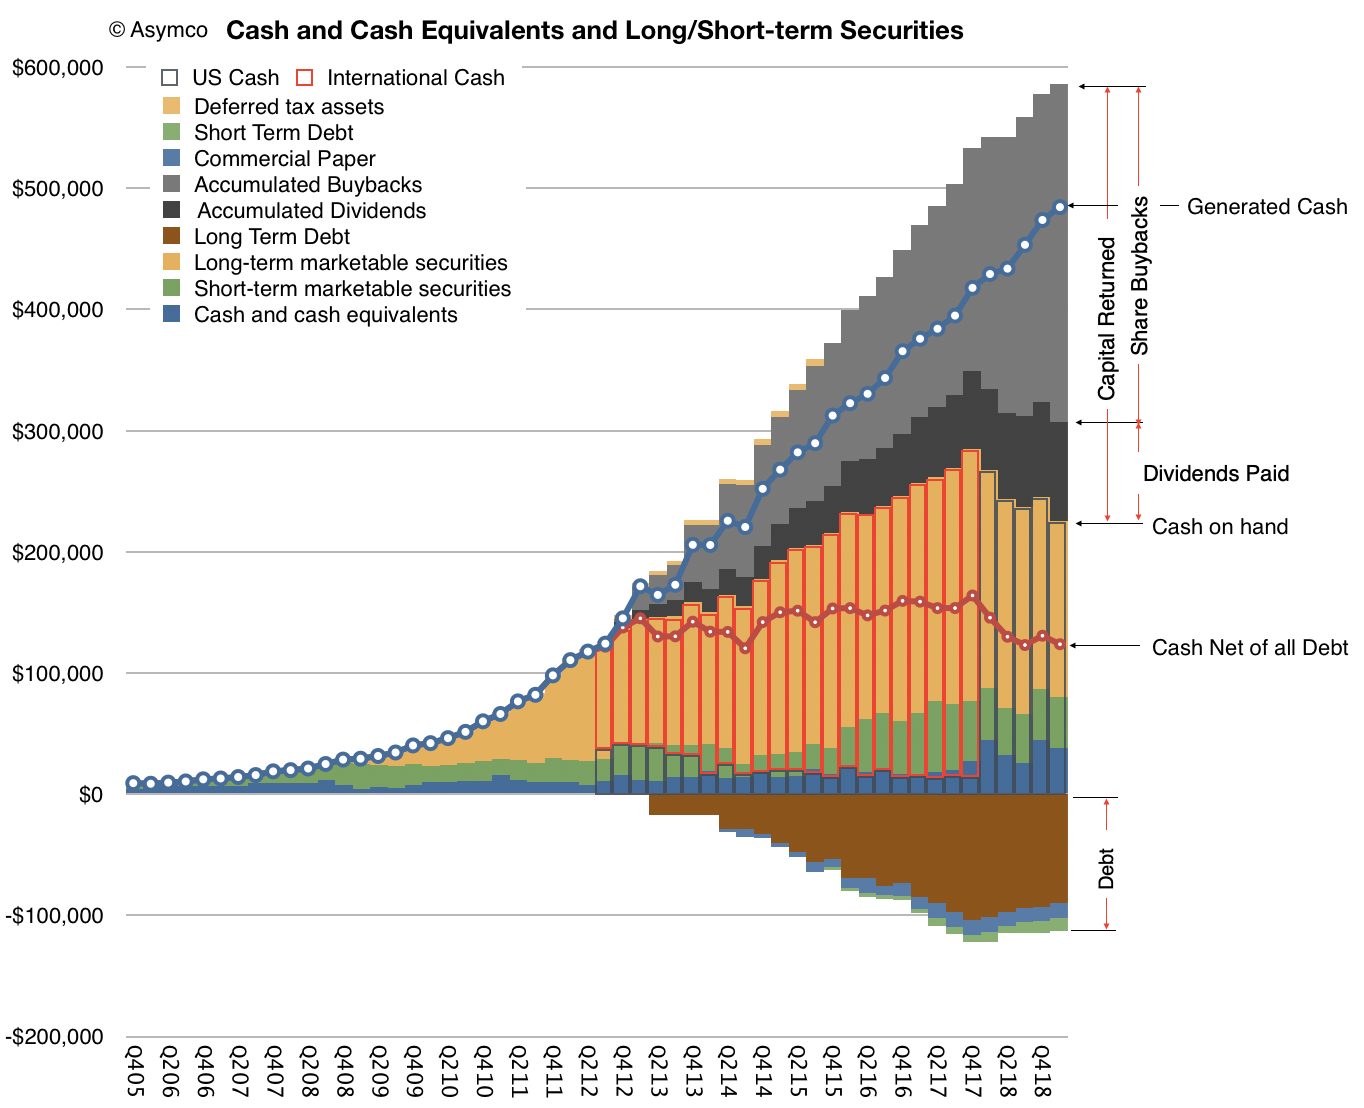
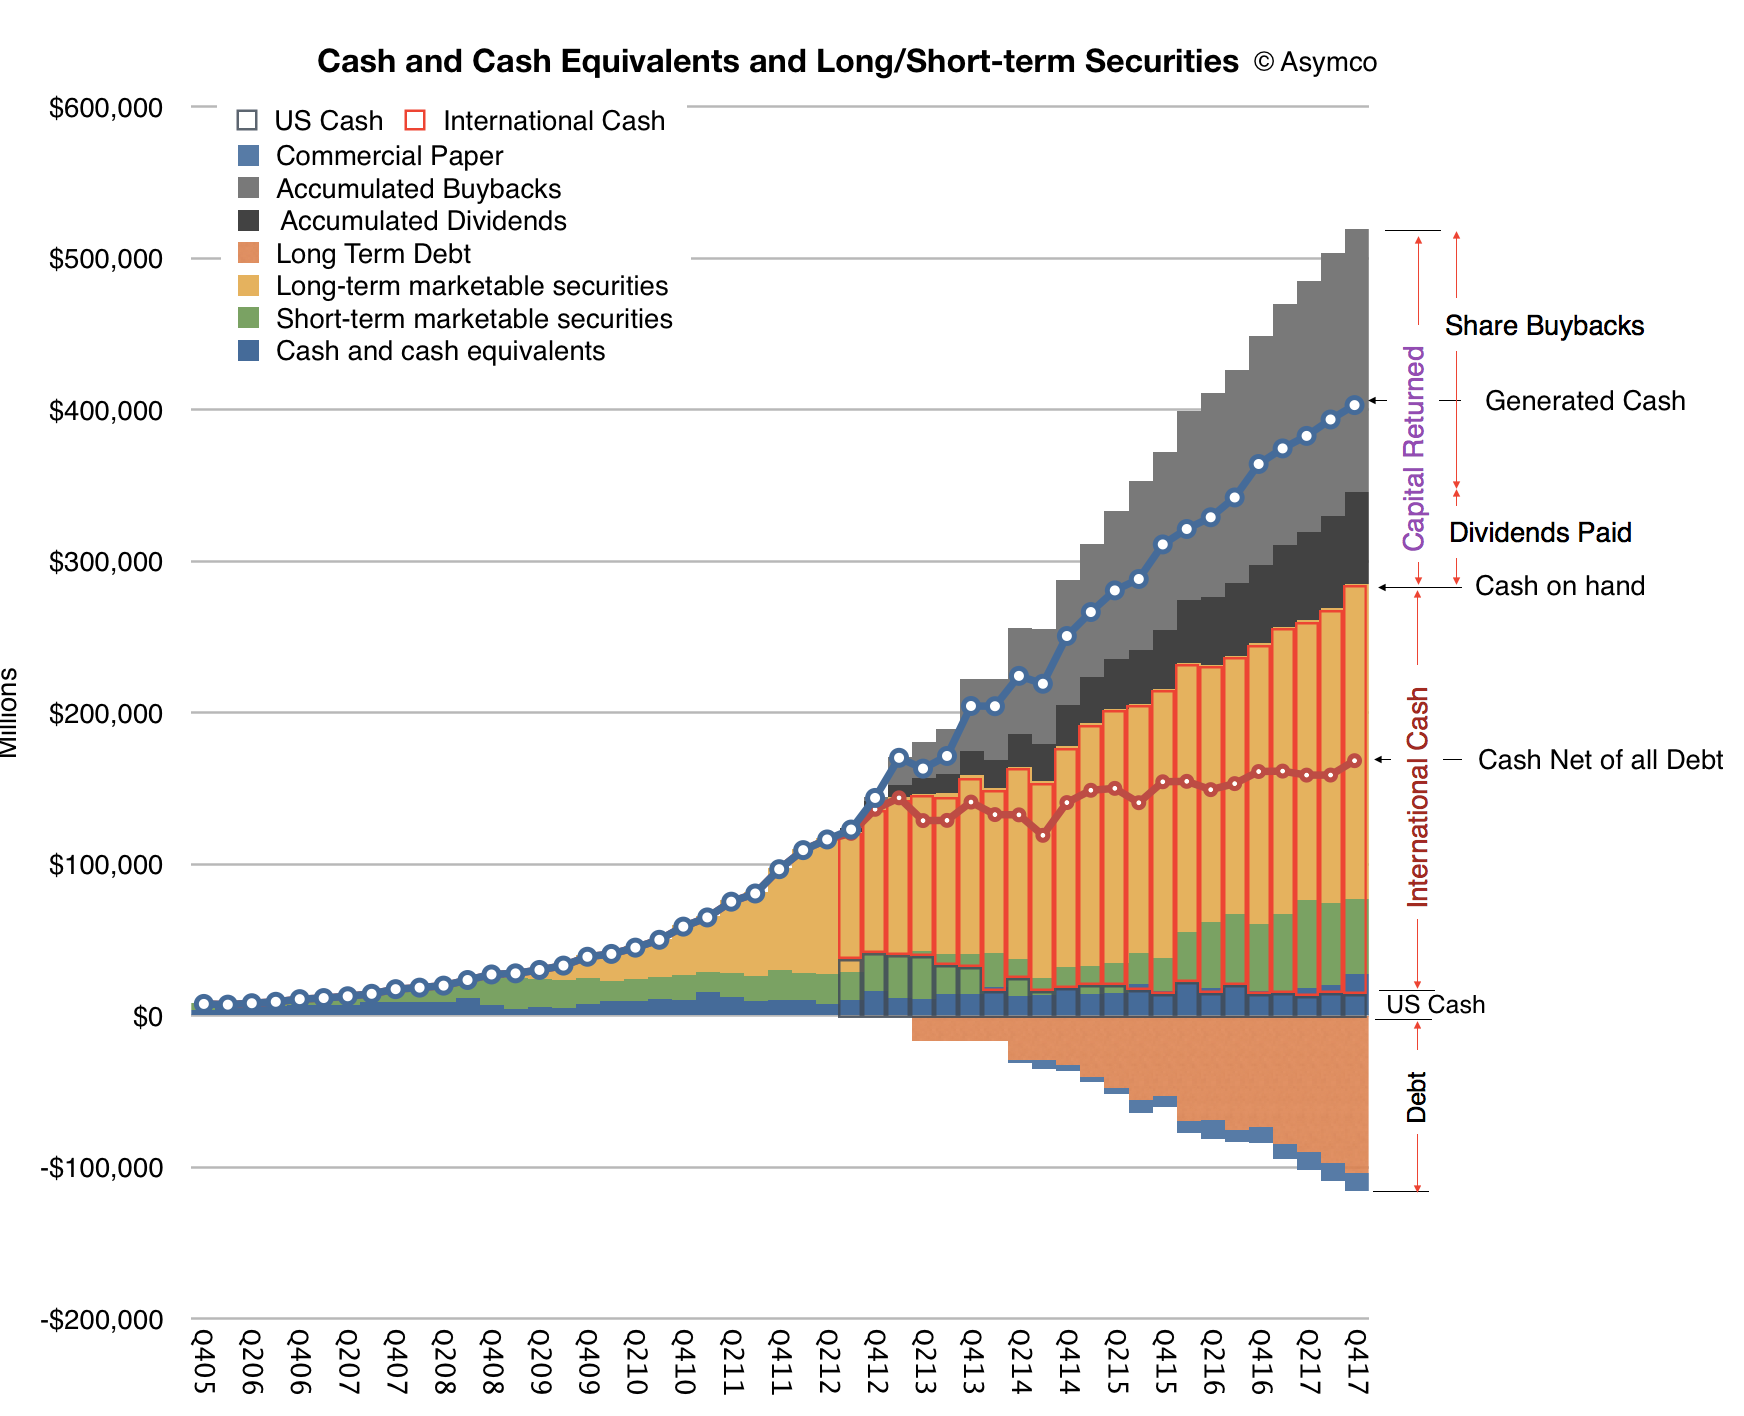
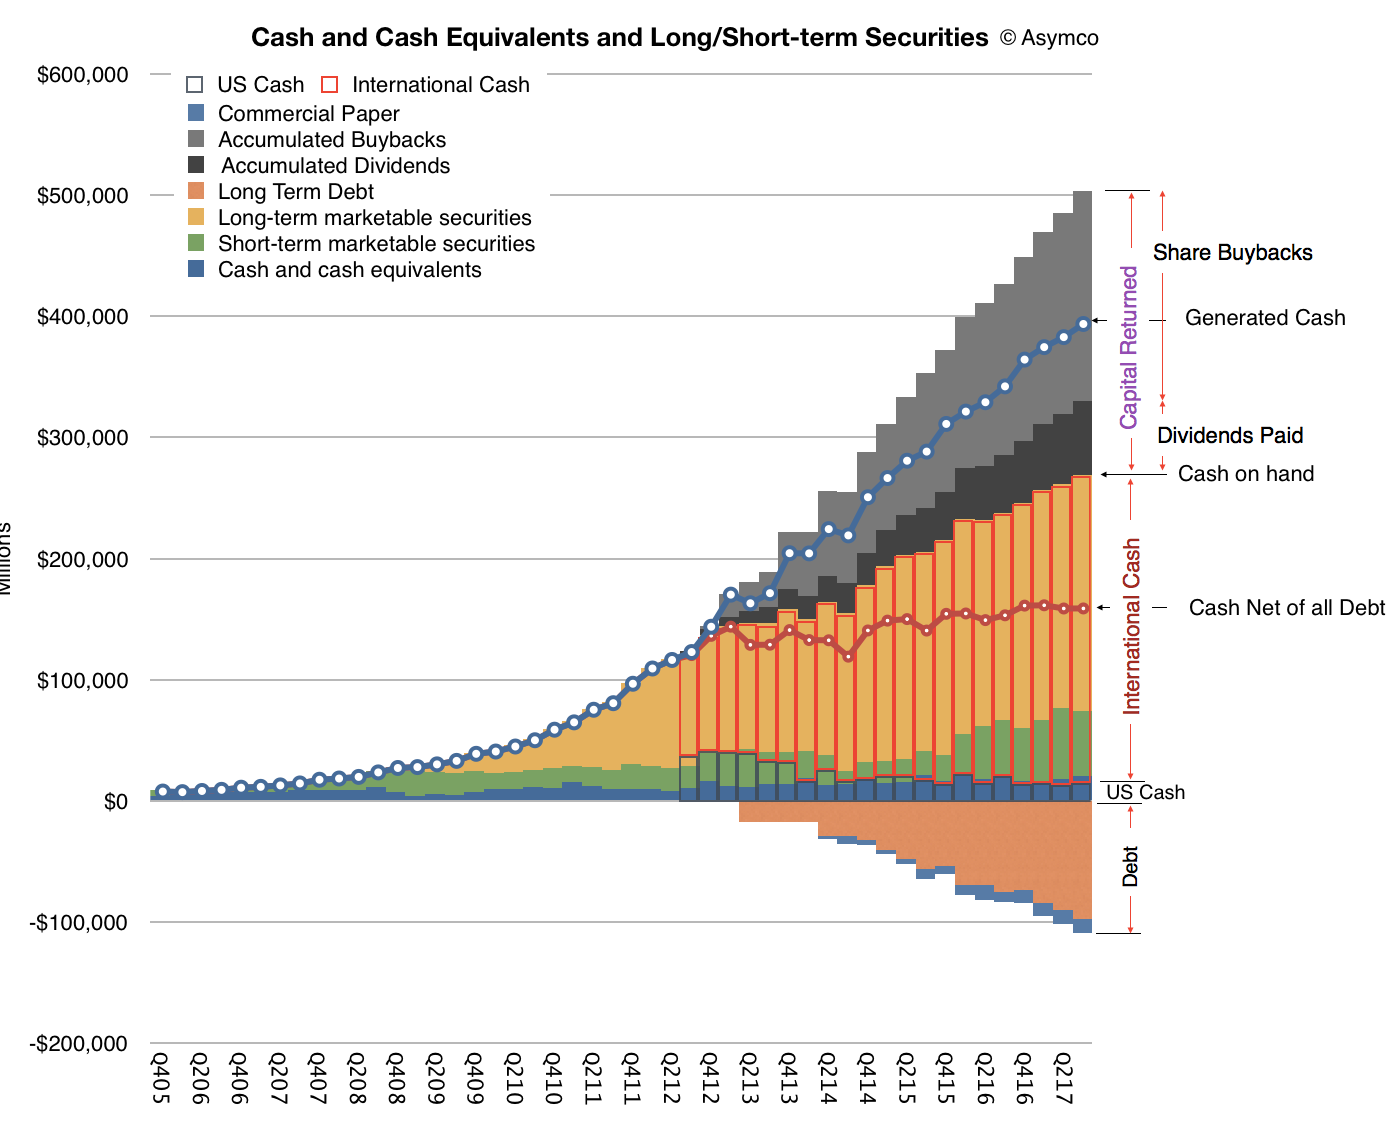
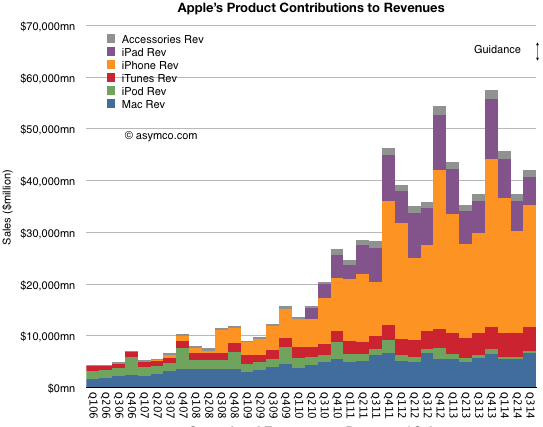
Apple has so far returned $761.5 billion to shareholders. 143.3 billion in accumulated dividends and $618.2 billion in share buybacks. These are the gray areas in the graph above. The question that often comes up is: isn't this capital return program a misallocation? In particular isn't buying back shares and retiring them a waste of money?
By definition, it cannot be. The mechanism of buying shares and retiring them is a process of returning retained capital to shareholders. The other ways this can be done are through dividends (periodic or one-time) or the sale of the company (liquidation). Ignoring the liquidation option which does not make sense for viable companies, the decision between dividends and buybacks comes down to a tax efficiency question.
The result is, however, roughly the same: retained earnings, which are stored by the company as cash typically (net value for Apple today is $57.2 billion), are an asset balanced by a liability to the shareholder called Total Shareholder Equity (valued today as $60.3 billion.) As such, the retained earnings belong to the shareholders. It's why they own the company. It's what their cash share of the value in the company is.
It's also surplus to the company's needs. Had the company needed this cash, it would have spent it on building the products and services it sells or operations that maintain or grow the business. Those expenses appear in cost of sales (COS) or cost of goods sold (COGS) or in operating expenses Sales, General and Administrative (SG&A) or Research and Development (R&D). If it's not spent this way then it drops to the net income line and, crucially, is subject to taxation (about 12% to 15% for Apple). After taxation, once returned, it's taxed again as either capital gains (in the case of buybacks) or dividend income. These rates vary on the jurisdiction of the owner and the current tax policy.
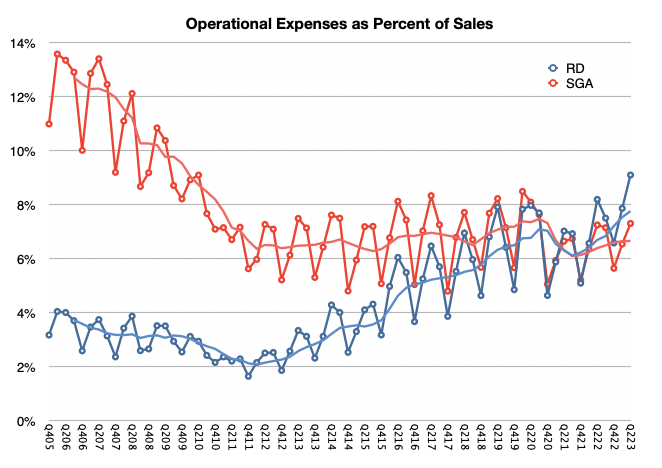
Note that the spending on R&D includes development of future projects which are not directly related to current products. Engineering of current products is expensed against COGS. R&D for Apple ($29.4 billion in last 12 months) is significant, having grown to 9% of sales, as the graph below shows.
For the company to decide to return capital it really does mean that it has no good ideas on how to spend it given what the company knows it can and cannot do. It's a judicious decision and one which honors the relationship between owner and manager with fiduciary responsibility to the owner.
Still, doesn't that mean it's wasted?
No. Giving it to the shareholder means that the company says "It belongs to you, I don't know what to do with it on your behalf, so here, you figure out what to do with it." The shareholder can then make an allocation decision that suits their sense of what is valuable or useful. The return is a deferral of decision to the owner rather than their agent.
To the extent that once returned, the capital is misspent, that is on the spender, not on Apple.
Consider the alternatives. Instead of returning capital, what some managers decide to do is to re-allocate those retained earnings to acquire other companies with the promise of value creation through synergies. However these are often huge wastes of money. The new asset is recorded as "goodwill" on the balance sheet, offsetting the retained shareholder equity. As the synergies fail to materialize, the asset (goodwill) is written off, and shareholder equity decreases accordingly, and so, value evaporates or is transferred to the owners of the acquired company who cash out above market value.
Acquisitions are a process of picking the pocket of shareholders.
The alternative might be to spend heavily on R&D. That is more admirable but the amount involved is enormous and it's very difficult to find enough people and projects worth pursuing without turning R&D into an academic organization. Remember that with R&D at $7.4 billion per quarter, the company is spending 41 times more than it did in 2006.
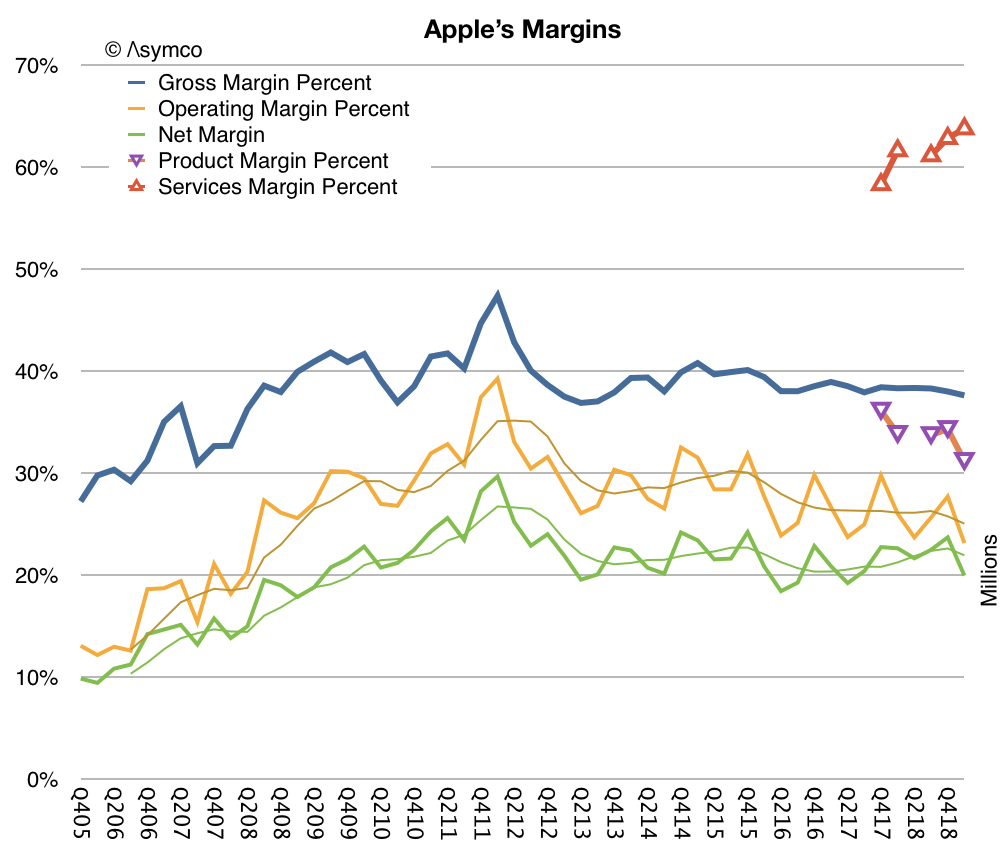
And doubling or tripling R&D, even if possible, would impact margins to such an extent that Apple's profitability would show very poorly indeed. That would collapse share prices and decrease share-based compensation, limiting the possibility of recruiting talented engineers. It would bring quite a lot of negative consequences.
Another exercise to undertake would be to ask what would happen if the mechanism of share buybacks were made illegal. It was not always legal anyway. That is left as an exercise to the reader.
As I remember it, at least 10 years ago, I began to hear anecdotes from developers who built apps for both iOS and Android about their economics. The story is that they tended to have twice as many users using Android but that iPhone App Store revenues were roughly twice those of Google Play Store. From that I devised a rule of thumb that an iPhone user was about 4 times more valuable than an Android user. Half the users, paying 4 times as much means double the income.
Over the years I came across a lot more data about market development (the diffusion of innovations) and market creation (the innovation process) and applied it to transportation. Along the way I also became more aware that figures of consumption and spending are not normally distributed. That it turns out that the governing function of much of human behavior is log-normal. That is, it is skewed rather than balanced or symmetric around an average. Classic examples are income distribution and the distribution of travel distances.
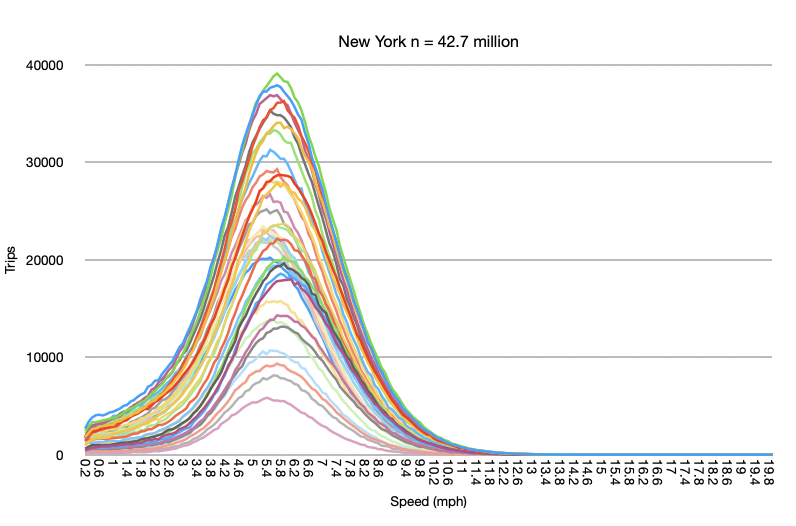
Consider the following diagrams: Trip Distances vs. Trip Speeds for New York Citi Bike travelers (n=42.7 million.)
The different lines represent different time periods spanning the months of the year.
The top graph shows that most trips are short, and the average distance is not the most common distance. The bottom graph shows that the average speed is the most common speed. The top graph is very accurately modeled with the log-normal function. The bottom graph is the classic bell curve of the normal or Gaussian function.
Income is log-normally distributed and so it has to be with services revenues. There must be a definite skew where there is a disproportionate spend by those who have more income. Thus segmenting or, to put it less kindly, discriminating customers properly is super important. Customer quality is just as important, perhaps more so, than quantity.
So let's revisit the question of user quality for online services.
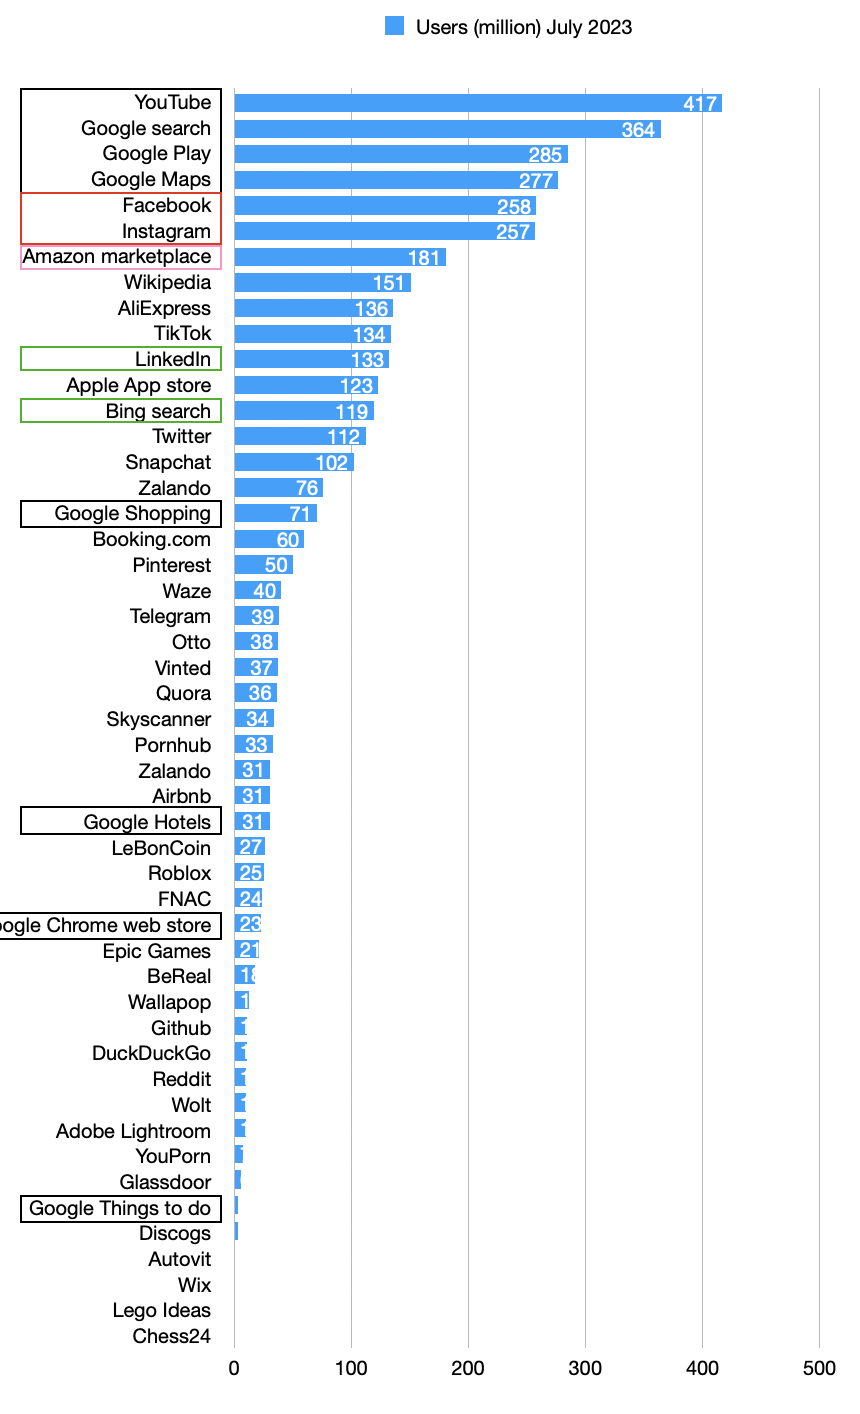
Unlike 10 years ago, there is a lot more data. The EU, for instance requires a report of the number of users on each platform.
The figures I want to focus on are those of Apple App Store and Google Play Store: 123 million and 284.6 million respectively. These are strikingly similar to the ratio of 2x between iOS and Android from my old anecdotes. However, if we look at global data, Apple claims 650 million active App Store users while Google claims 2.5 billion active users. That makes the global ratio closer to 4x Android. However, if we look at the US, the ratio is 167 million iPhone users vs. 144 million Android. In the US, iOS is a majority.
This is explained by income. The wealthier the user base the more iOS seems to be in use.
Now let's look at revenues for the platform stores.
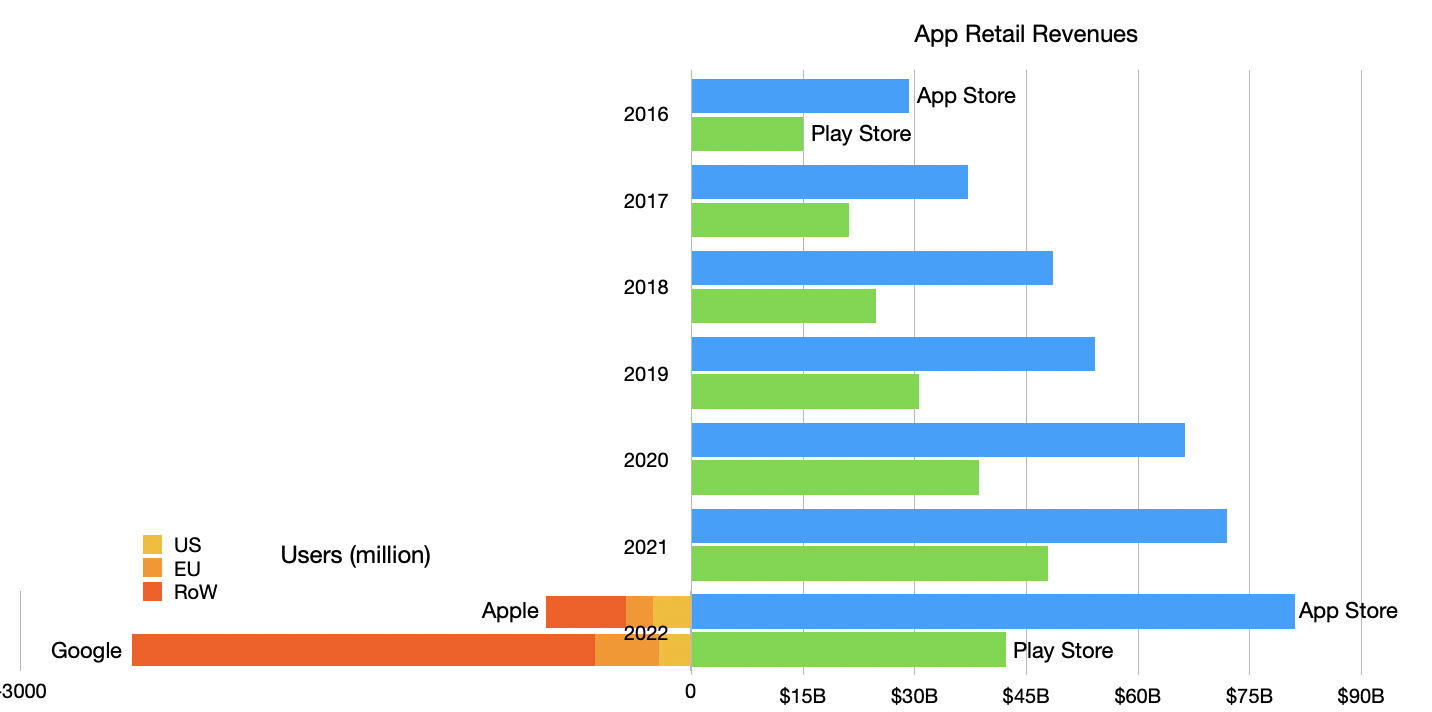
On the right side is the history of retail revenues by year from 2016 to 2022 and split between Apple App Store and Google Play Store. Mirrored on the left is the number of users, also split by store but also by region, but only for 2022. [App Store revenues are my own analysis (with validation against other sources) and include billings not just Apple's own cut. Play Store revenues are from Business of Apps.]
The ratio between revenues has kept remarkably steady, with 2016 revenues at a Apple:Google ratio of 29:15 (1.93) and 2022 at a ratio of 81:42 (1.93).
The global user numbers are, as mentioned, 3.8 to 1.
[Aside: One sanity check on the data is that the 650 million App Store users is about half of my estimate of iPhones in use (1.2 billion). That might be alarming. Why are only 54% of iPhones in use paired with App Store use? However, if we take the sum of both App Store and Play store users (3.15 billion) and compare it with the total number of global smartphone users (6.92 billion), we discover that 45.5% of all smartphone users use some store. Adding Chinese Android stores we can see that the ratio of 54% for iOS is somewhat consistent.]
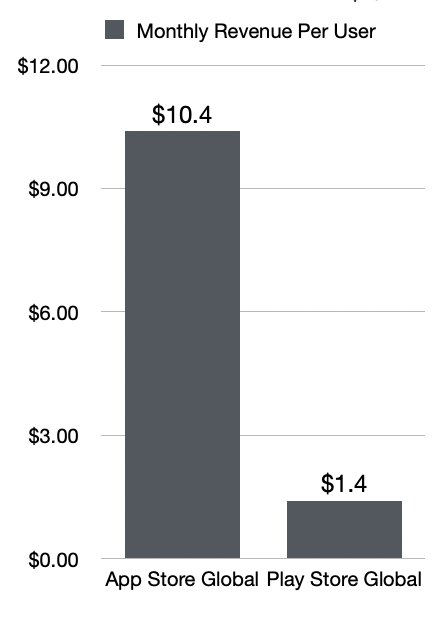
Thus we can compare the app revenue per user of the two platforms by dividing global revenue number by the global user numbers. The results are shown below:
I scaled the spending to a per-month basis.
So the picture becomes clearer. The iPhone customer is 7.4 times more valuable than the Android customer. This is more impressive than the 4x rule I had 10 years ago. The reasons are mainly that my anecdotes were from developers who sold products in the US or EU whereas expansion of smartphones to 7 billion global users has drawn in more lower spending customers.
But Apple's base has also grown to over 1 billion users (650 million store users). This highlights that Apple has effectively grown and discriminated customers effectively. It obtained not just 1 billion customers but the best 1 billion customers.
How to discriminate effectively is the holy grail of marketing. The naïve approach is to keep prices high. But that usually only results in a "luxury" branding and a small base that tends not to grow. The alternative "premium" approach is to offer functionality and multiple tiers and distribution options and financing and merchandising. There is no simple formula.
The bottom line is that Apple's approach is attracting 650 million $10/month app spenders. When we factor in additional subscription services, we get to the juggernaut that is Apple Services. This analysis has shown how difficult it is for anyone to come close to this quality of revenue.
As we look forward to Spatial Computing, the idea of increasing that spend from $10/month for a small glass rectangle in your palm to perhaps $100/month for an immersive 360-degree 3D experience does not sound too crazy.
But only if you can find those customers. I suspect Apple already knows who they are.
If you want to learn more and hear an in-depth discussion on this topic make sure you subscribe to the Asymetric Podcast on Supercast and Apple Podcasts.
The data is finally out. Apple Services and perhaps Apple itself can be quantified and predicted as never before. As we shall see this data changes almost everything we know.
It is even more shocking that this most important data set has been released by Apple itself. (Though it did so in order to comply with regulation, Apple did offer a bit more detail than was required.)
What the data shows is the number of average monthly active recipients in the EU of Apple-provided data services, calculated as an average over the period of the six months to 31 July 2023. This number is 123 million.
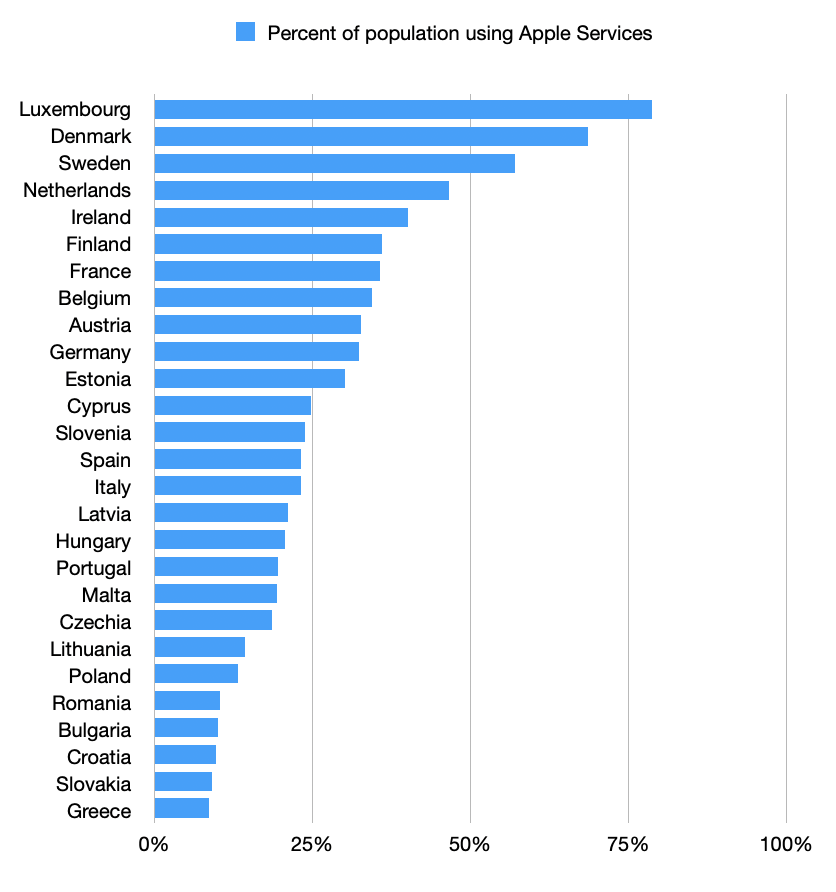
In addition, if you follow the link, you can see the number of recipients broken down by Member States. I summarize this data below.
Note that my summary is not that of the absolute numbers of recipients but the percent of population that these numbers represent. Note further that for some of the states with less than 1 million total recipients, estimates had to be generated. These were done in order to complete a total of 123 million. You'll have to trust me that these estimates make sense.
This release of data might be amusing for the ranking we obtain, showing which countries' citizens are more likely Apple fans than others. Seeing, for example, that the nordic countries show more affinity for Apple than the balkans; whatever that implies.
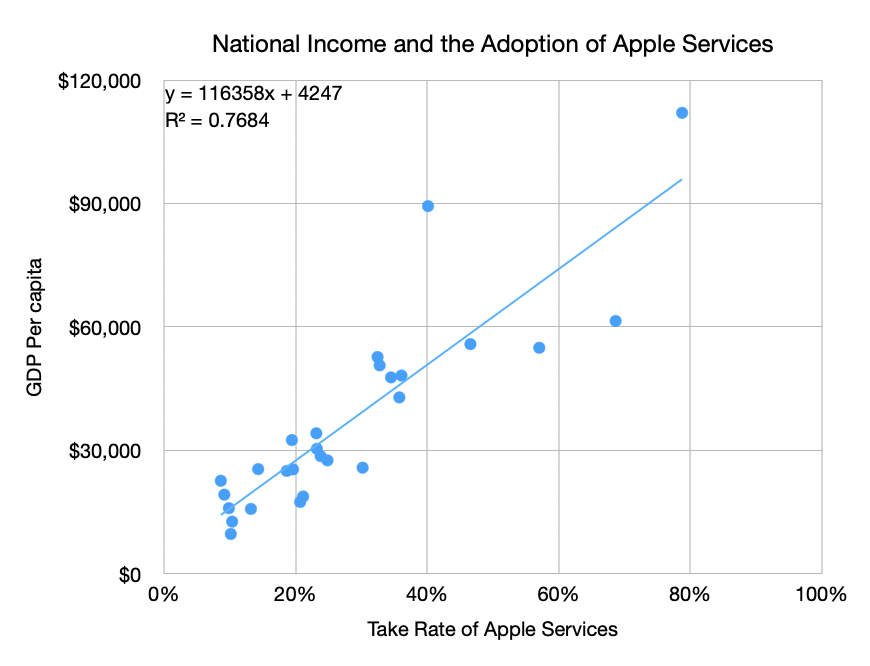
But a geographic categorization is banal. What would be more interesting is to look for a proxy for Apple adoption that is predictive. I know what you're thinking: it's obvious, look at income. More precisely GDP per capita. The data yields the following.
Please keep in mind that some countries might have missing or outdated data, and the values presented here are based on information available up to 2021. Note that there is one outlier. That data point around $90,000 and 40% adoption is Ireland. It's an outlier because the GDP income for Ireland includes the large number of multinational firms based there. That includes Apple, Facebook, Google and LinkedIn, etc. which pull GDP above what would be assumed by GNP.
With Ireland the data fits with the coefficient r-squared of 0.77. Without Ireland it's 0.85. This seems good enough to me to estimate the relationship of Apple Adoption ~= (National Income - 4247)/116,358. The trend line in the graph above shows this relationship.
What are the implications?
First, the ends of the line need to be finessed. 100% Apple Adoption is suggested at income of $116,358/yr/capita. Also, 0% Apple Adoption happens below an income of $4,247/yr/capita. Now both of these are problematic as there are known adopters in countries with income below $4,247/yr (more about this later) and there are countries with income above $116,358 which cannot therefore have more than 100% adoption (or can they? This makes a good trivia question.)
These anomalies should encourage us to look further. What if we apply this formula for countries outside the EU? To answer this, I generated a country set with about 190 entries and applied the pattern seen within the EU country set (n = 27.)
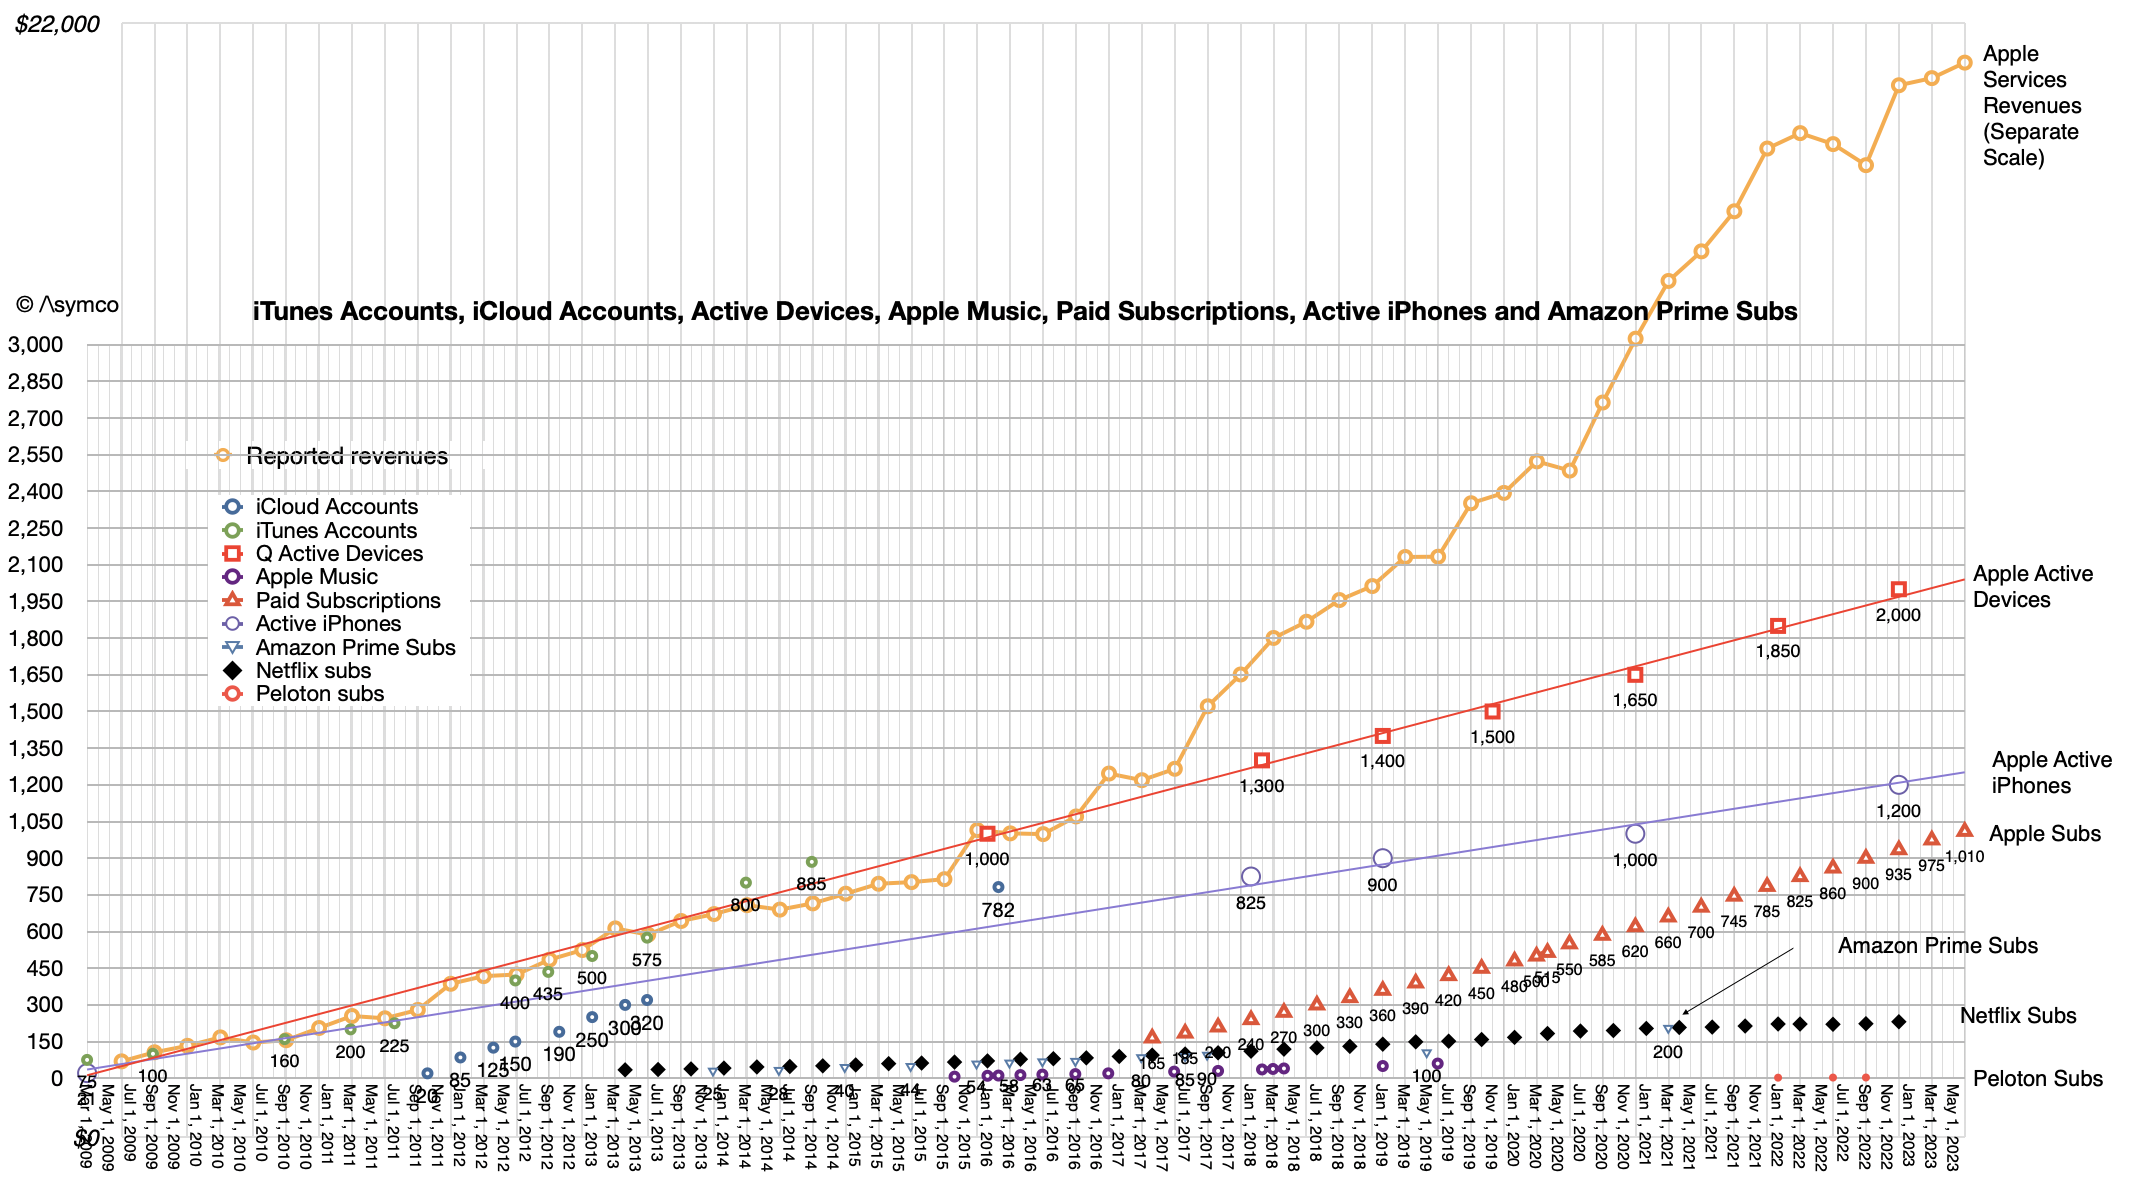
Knowing the GDP per capita for all countries as well as population size, we can estimate the global total of Apple services subscribers to be 560 million individuals. Note that Apple reports 1,010 million total subscriptions but that includes multiple subscriptions per subscriber and subscriptions to services which for Apple only acts as guarantor through the Apple App Store. Overall data on Apple Subscriptions (and other details) is provided below:
Note that we know the total active devices to be over 2 billion and the active iPhones to be about 1.2 billion. This implies that about half of iPhone users have an Apple-owned subscription and that over half of the subscriptions Apple manages are for its own services.
What's more, we can obtain a detailed list of expected Apple Services users for each country. An example would be 5.8 million users in Mexico or 1.7 million in New Zealand. [I could furnish this on a country-level in a newsletter, if anybody is interested please let me know.]
It also allows us to understand the potential for countries which currently are below the model's threshold of income. That list consists of 88 countries with a combined population of over 4 billion. They will join the Apple ecosystem, it's only a matter of time. Can we predict this? I believe so. Stay tuned.
The story of Apple Services is only getting more important but also more detailed in terms of data and analysis. Readers of this blog have been well prepared for what happened and Apple has followed through with gross margin data and now with some limited country-level data.
As we move into the era of spatial computing, services will only matter more and it's imperative that observers of the company stay on top of the data with solid modeling.
The last quarter of 2020 was a remarkable quarter for Apple. Every line in the income statement increased by double digits. Net sales up 21%, iPhone sales up 17%, Mac sales up 21%, iPad up 41%, Services up 24% and Earnings Per Share up 30%. This had not happened in over 10 years. The last time being the first quarter of 2010.
Take a look at the table below which color-codes each line based on the rate of growth. The darker the green the faster the growth (blue being above 100%).
A shockingly good performance is made all the more remarkable by its happening in a time of uncertainty. The company has refused (rightly) to issue guidance as long as a pandemic is raging world-wide. The disruptions in supply chains, demand and changes in behaviors due to new limitations on mobility and interactions between people are unprecedented and consequences are still to be estimated.
The growth surely, you say, is precisely because of this disruption. The "work and study from home" and lockdowns have forced people to buy more technology. Phones, Laptops, tablets are not just tools but lifelines for a society denied other forms of contact.
But this was not at all obvious at the beginning of the crisis. The months leading to pandemic caused the share prices of most equities to fall, and tech was not immune. Apple's shares fell in March 2020 to $57/share. I heard comments suggesting that Apple would collapse as a business with unemployment reaching 25% and nobody willing to pay for luxuries like iPhones.
The crisis has proven that technology is not a luxury but a necessity, and technology that works better is far more valuable than technology that works barely. Spending on better machines has increased.
Some of that is of course helped by stimulus programs but growth was not only in countries which gave out cash. The growth for Apple was in all regions of the world, breaking new records even in poorer countries.
Far more likely, the economic fuel for Apple's growth came from disposable income being unspent on other high-ticket items like dining, vacations and entertainment. Much cash sloshing around the economy surely ended up in an Apple cash register.
But this is all old news. The question into 2021 is what will this year look like. The first quarter already ended and the data is dribbling in: Apple has 1 billion customers, 88% of US teens have an iPhone, 70% have AirPods, China is growing at crazy rates, Foxconn reporting 40% growth, production of next generation iPhone chips starting early (May), etc.
There does not seem to be a let-up in growth, despite some component shortages postponing some non-iPhone product introductions. Apple's cautious comments 3 months ago are probably moot now.
We are providing some directional insights assuming that COVID-related impacts of our business do not worsen from our current assumptions for the quarter. For total company revenue, we believe growth will accelerate on a year-over-year basis and in aggregate, follow typical seasonality on a sequential basis.
At the product category level, keep in mind two items: First, during the March quarter last year, we saw elevated activity in our digital services as lockdowns occurred around the world, so our services business faces a tougher year-over-year comparison; second, we believe the year-over-year growth in the Wearables, Home and Accessories category will decelerate compared to Q1.
As you know, we were chasing demand on AirPods last year as we expanded channel inventory from Q1 to Q2. This year, we plan to decrease AirPods channel inventory as is typical after the holiday quarter. We expect gross margin to be similar to the December quarter.
We expect opex to be between $10.7 billion and $10.9 billion. We expect OI&E to be up around $50 million and our tax rate to be around 17%.
Luca Maestri
Given this, I am tentatively projecting top line growth of 15% (vs. 1% a year ago and 21% last quarter) and EPS growth of 11% (vs. 3.8% year ago and 25.6% last quarter.) A goldilocks quarter.
The iPhone is the most successful product of all time.
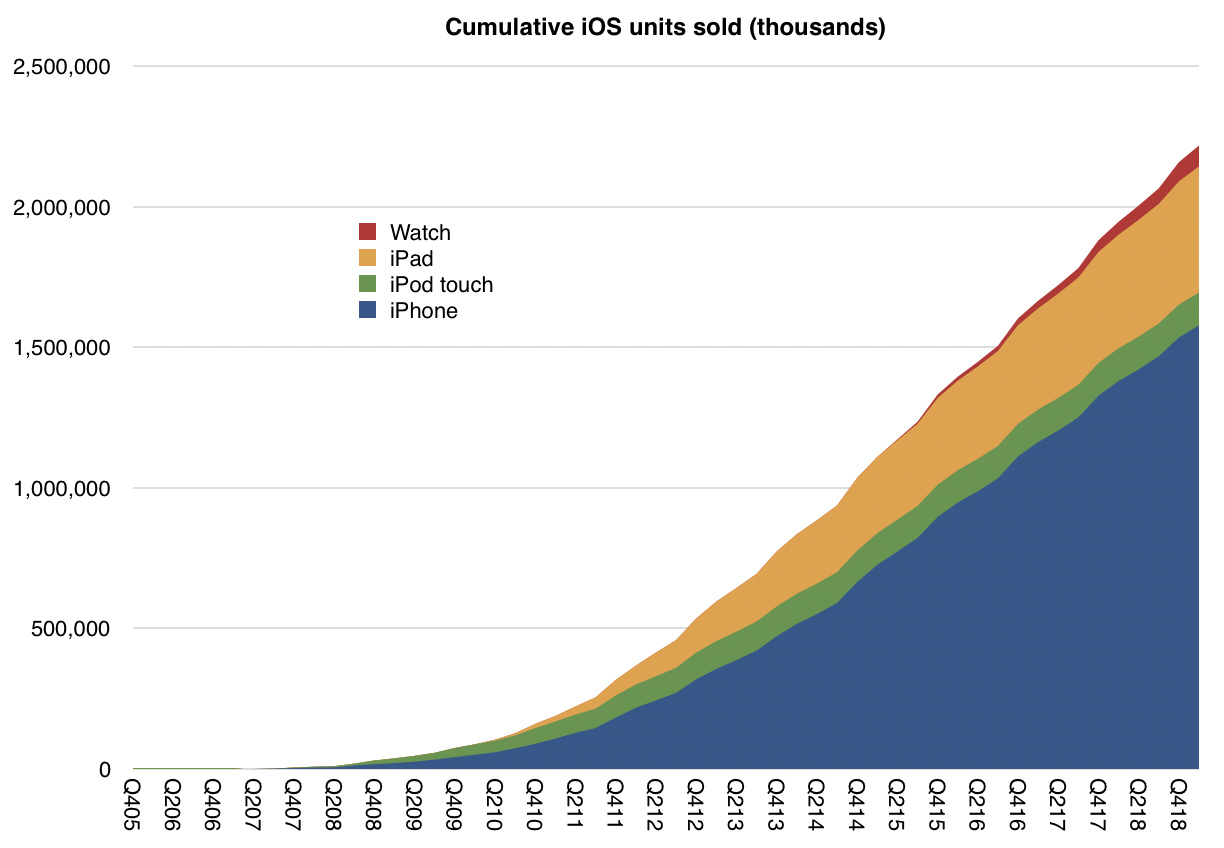
Over 1.6 billion have been sold. Including the iOS products it spun off, the total is over 2.2 billion. Of those 2.2 billion sold, 1.5 billion are still in use.
There are about 1 billion iPhone users.
Economically speaking, iPhone sales have reached one trillion dollars. ((The milestone of $1 trillion iPhone revenues was reached in the fourth quarter 2018 during which time the stock price of Apple fell by 40%.))
Since the iPhone launched, Apple's sales have totaled $1.918 trillion. Of those trillions about one half a trillion was accumulated in the form of income.
Of that half trillion in income, $360 billion was paid out to shareholders ((As a result, the number of outstanding shares has decreased by 29%)). and $131 billion was paid in taxes.
This sounds like a good business, but no business is good if it is static. What makes a business great is dynamism. The idea is to constantly maneuver for a new or enhanced way of doing business as technologies enable entrepreneurs to fundamentally change how value is captured or allocated.
The iPhone story isn't static, the "pivots" or change in direction are several:
The App Store, a platform for collaborative innovation where millions of developers are offered the chance to improve the product.
Accessories, a licensing model for third-party hardware that works with the iPhone
Distribution through multiple channels
Integration with other Apple Products
The marketing of older products alongside new ones at reduced prices
An expanded product portfolio with a broader range of prices
Trade-in and financing options
Each of these initiatives contributed to the iPhone growth story but the biggest change in business model was the addition of services. Apple Services grew out of the iTunes business that pre-dates the iPhone and was established to provide content for the iPod.
In 2006, the year before the iPhone launched, Apple customers spent $3.3 billion on iTunes, Software and Services. By 2018 the spending rate was $80.5 billion/yr. It's very possible that this year's spending rate will reach $100 billion/yr. This new division is simply called Services today and consists mainly of third-party apps and third-party content sales as well as licensing.
Recently Apple launched a set of new services that it will offer itself. This includes television, films, financial services and news. Apple already has a music service of its own and file storage (iCloud) both of which are offered as subscriptions.
Apps are also allowed to offer paid subscriptions, and that total has reached 390 million, growing at 30 million a quarter with an expected total of 500 million by 2020. That amounts to one subscription for every other iPhone in use.
Some would argue that even with a $43 billion revenue rate, ($80 billion billing rate) ((The difference is in the way Apple accounts for App Store revenues: declaring only the 30% portion of sales that it keeps as revenues, and not including the 70% that is paid out to developers. The "billing rate" is what consumers spend, the "revenue rate" is what Apple reports.)) Apple's business is still a hardware business and that comes with low margins, potential for disruption, non-recurring revenues and cyclicality.
This is not the case. Apples's business has high margins (64% gross margin for services, 34% for products), has been resilient over 12 years while attracting hundreds of imitators at lower price points, and has loyalty and satisfaction which results in more than 90% re-purchase rates. Cyclicality is driven by seasonality and product lifespans, not competition.
This common misconception of Apple is why it continues to be valued at a deep discount to not only peer companies who are services oriented (Google, Facebook, Microsoft and Amazon) but also at a discount to the overall market (the S&P 500).
Apple, since its inception, has always been oriented around its customers, not its products. The questions asked by management are "what can the company do to deliver experiences and satisfaction" rather than "what products can the company build".
Every company is bound by its capabilities but the best companies re-shape these bounds because they are defined by priorities.
A priorities-driven company habitually re-designs its processes and its resources. A resources- or process-driven company re-designs its priorities as its capabilities change.
Moving as it does between computers, devices, software, services, retail, logistics and manufacturing means that it's not classifiable as an "x" company where "x" is an industry sector. Rather, the company should be classified by the set of problems it seeks to solve (e.g. communications, community, productivity, creativity, wellbeing).
This disconnect between what people think Apple sells and what Apple builds is as perplexing as the cognitive disconnect between what companies sell and what customers buy.
Companies sell objects or activities that they can make or engage in but customers buy solutions to problems. It's easy to be fooled that these are interchangeable. ((They are only correlated. Purchase decisions are not *caused* by a product's existence. The real cause is a combination of need and supply and time and circumstance of purchase.))
Conversely Apple offers solutions to problems that are viewed, classified, weighed and measured as objects or activities by external observers. Again, it's easy to be fooled that these are the same.
This analysis is, of course, applicable to any company. Here I'm using Apple as a lens. This is because it's just so much easier to tell this story with the narratives and anti-narratives that are so widely disseminated.
The following is a transcript of the comments from Tim Cook (CEO) and Luca Maestri (CFO) at Apple's Q1 2018 Earnings Conference Call February 1, 2018. I color coded my interpretation of the comments into four categories:
Grey: Background and promotional commentary
Red: Strategy and signals of what management considers important and may include data beyond the regularly reported numbers.
Green: Financial data
Black: Commentary.
Blue: My commentary, in brackets.
For a quick read of Apple's strategy, read the Red text. These comments are not repeated in financial reports. Highly recommended.
For a quick read of Apple's financial performance, read the green text (which are replicated in financial reports). Read this if you don't want to wade through the financial reports.
For marketing or product material, read the grey text.This is sometimes unique but also repeats product launch information.
---- Tim Cook: Thanks, Nancy and thanks everyone on the call, and welcome to everyone today. Before we dive into the quarter, I'd like to take a moment to talk about a significant milestone we recently crossed.
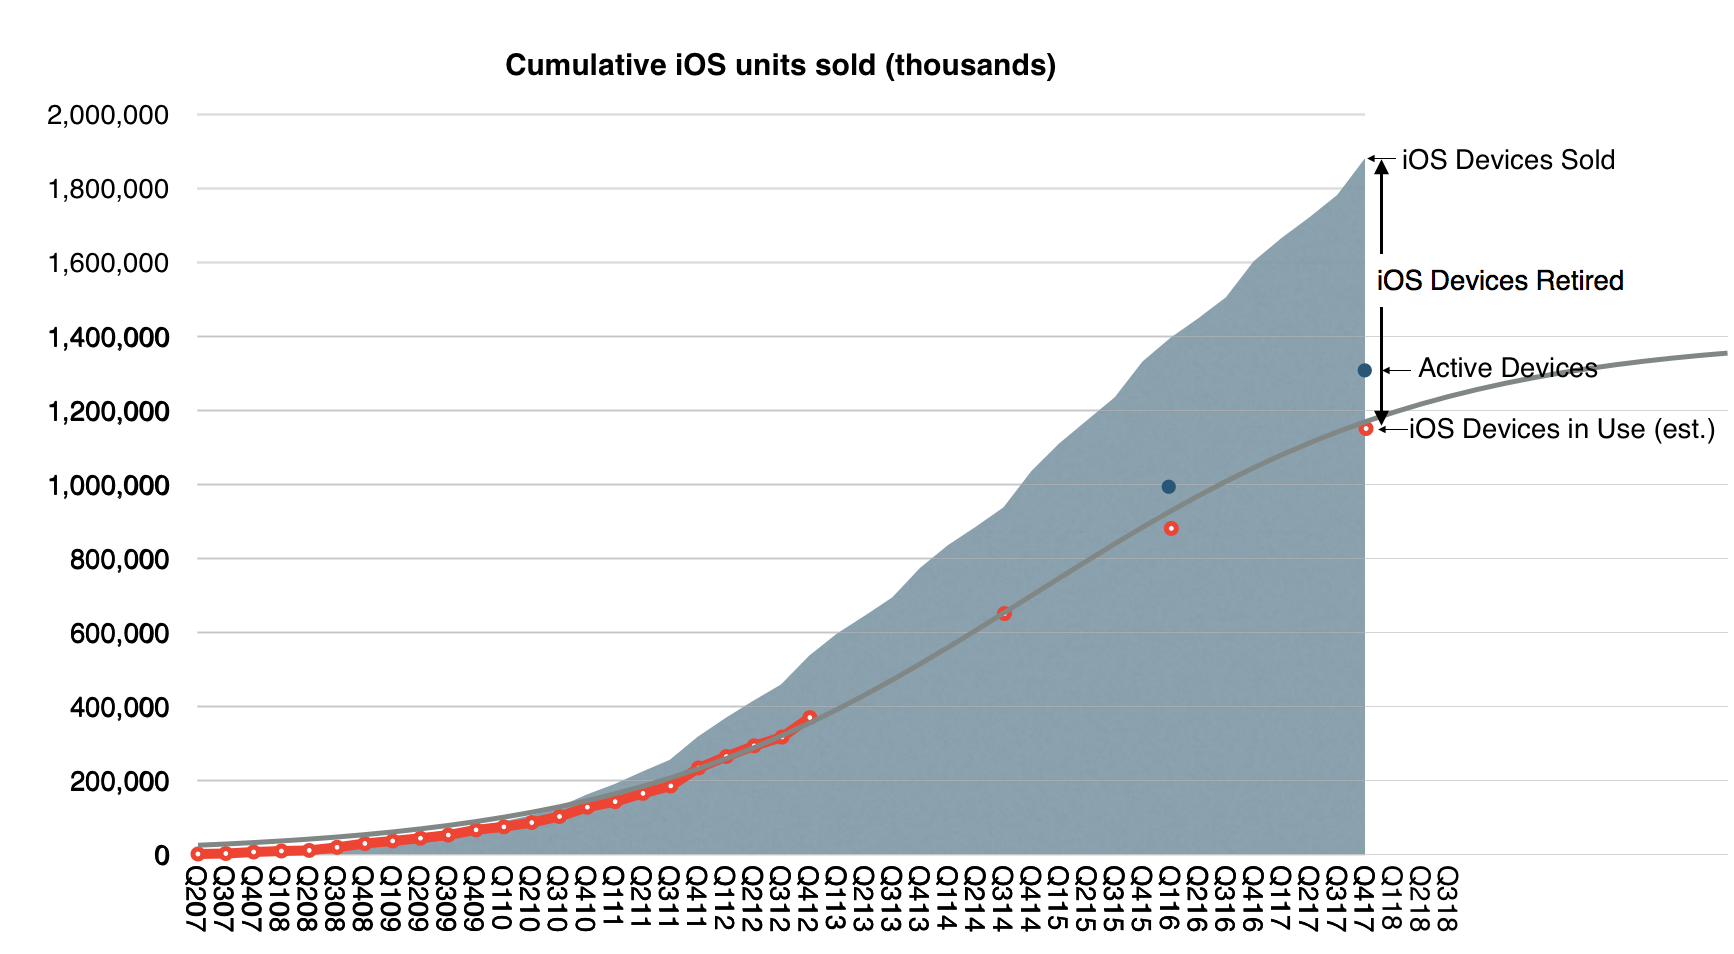
Apple's active installed base reached 1.3 billion devices in January and is at an all-time high for all of our major products. 1.3 billion devices represents an astonishing 30% growth in just two years. It speaks to the strength and reliability of our products and our ecosystem, as well as the loyalty, satisfaction and engagement of our customers. It's also fueling tremendous growth in our services business, which I’ll talk about a little later in the call. [This is probably Apple's most important number. For at least the next 20 years this is the key performance metric and it can be used to derive company's valuation. A summary of the history of active devices vs. units sold is shown in the graph below:]
Turning to the December quarter. We're thrilled to report Apple's biggest quarter ever, which set new all-time records in both revenue and earnings. We generated revenue of $88.3 billion, which is above the high-end of our guidance range, and it is up almost $10 billion or 13% over the previous all-time record we set a year ago.
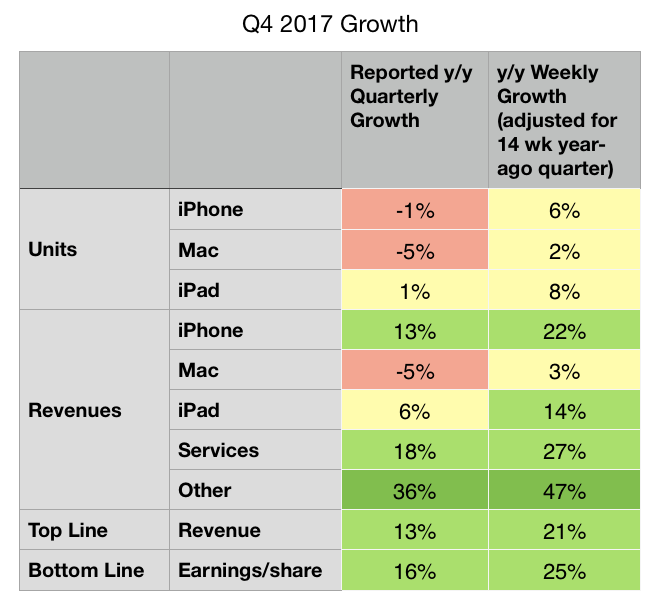
It's also our fifth consecutive quarter of accelerating revenue growth with double digit growth in each of our geographic segments around the world. What makes us even more remarkable is that the quarter we're reporting today was 13-weeks long, while the year ago quarter was 14-weeks. When we look at the average revenue per week in the December quarter this year compared to last year, our growth was a stunning 21%. [The 13-week vs. 14-week year-on-year comparison is repeated several times. The summary differences are shown in the table below:]
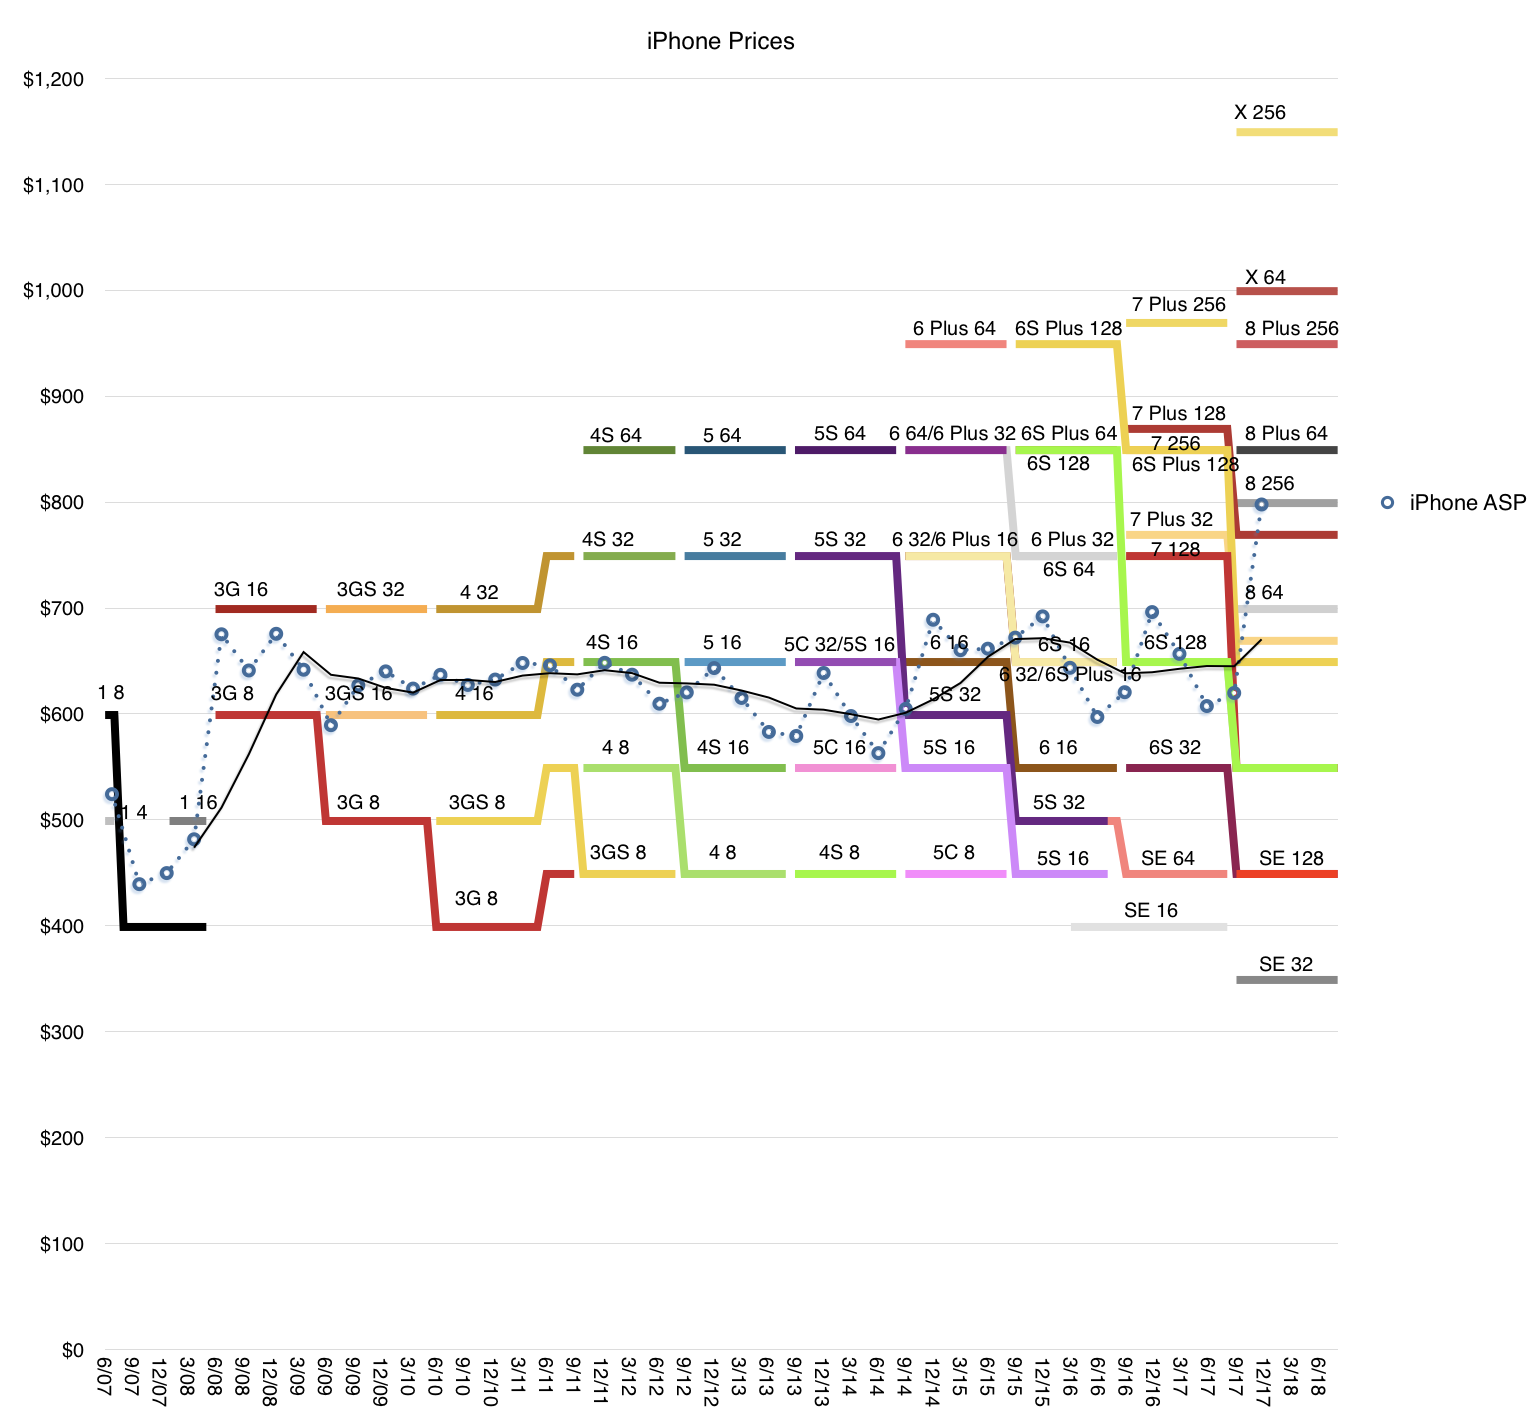
Our growth was broad-based and a key driver was iPhone, which generated its highest revenue ever. iPhone X was the best-selling smartphone in the world in the December quarter according to Canalys, and it has been our top selling phone every week since it launched. iPhone 8 and iPhone 8 Plus rounded out the top three iPhones in the quarter. In fact, revenue for our newly launched iPhones was the highest of any lineup in our history, driving total Apple revenue above our guidance range. [The iPhone X is a huge hit. It drove the average selling price $100 higher y/y. This is not only unprecedented for Apple but for the entire Industry. The average smartphone sells for less than $300 while iPhones sold for $800. The gap is widening. The following graph shows the product mix and the average resulting price.]
I want to take a moment to recognize the tremendous amount of work that went into creating iPhone 10. Our teams carried out an extremely complex launch from both an engineering and operations perspective, executing an outstanding product ramp that required years of research and development; one that introduced innovative features like an edge-to-edge Super Retina Display and the TrueDepth Camera, which enables face ID. Our customers love these new features and the new gestures like simply swiping up from the bottom, which make using iPhone even more intuitive and enjoyable.
Our team has put the technology of tomorrow in our customers’ hands today, set a standard for the next decade of smartphones and we are very proud of their achievements.
It was another very strong quarter for services with revenue of $8.5 billion, up 18% over last year, and we’re on pace to achieve our goal of doubling our 2016 services revenue by 2020. The number of paid subscriptions across our services offerings passed 240 million by the end of the December quarter, that’s an increase of 30 million in the last 90 days alone, which is the largest quarterly growth ever. [Services has been growing relentlessly for over a decade. This steadiness of growth makes is a juggernaut. Apple is increasingly speaking about subscriptions as the key metric and 240 million is reaching record territory. The rise of Services is shown below (both revenues and consumer spending.)]
We had an all-time record quarter for the App Store with our best holiday season ever. We’re seeing great excitement around augmented reality with customers now enjoying over 2,000 ARKit enabled app, spanning every category in the App Store. In December, when Pokémon GO released its new augmented reality features built with ARKit, it jumped the top of the App Store charts. Last week, on a stop in Toronto, I met developers who are hard at work on creative applications using ARKit from art appreciation to ecommerce, and I was very impressed with what I saw.
Just for months after ARKit launched to the public, we’ve already released ARKit 1.5 in beta to developers around the world, and the response has been tremendous. Augmented reality is going to revolutionize many of the experiences we have with mobile devices. And with ARKit, we’re giving developers the most advanced tools on the market to create apps for the most advanced operating system running on the most advanced hardware. This is something only Apple can do.
In addition to the App Store, several other services had their biggest quarter ever, including Apple Music, iCloud and Apple Pay, all of which saw growth in both active users and revenue.
Apple Pay has reached an important milestone in the U.S. As a result of 50% year-over-year growth in merchant adoption, it’s now accepted at more than half of all American retail locations, which includes more than two-thirds of the country’s top 100 retailers. Now available in 20 markets, global Apple Pay purchase volume more than tripled year-over-year and we’re delighted to be expanding to Brazil in the coming months. [There are no absolute data points on Apple Pay but we do have some scattered growth data. The US data is cited here but in my experience it's more popular in select countries like UK where users are using it habitually]
Today, you can use Apple Pay to take the subway in Guangzhou, China, see a concert at London’s Wembley Stadium or buy a souvenir in Yosemite National Park. In the U.S., we launched Apple Pay Cash in December, and it’s off to a terrific start. Millions of people are already using it to send and receive money with friends and family quickly, easily and securely; to split a bill, pay someone back, or send last minute gift right from the messages app.
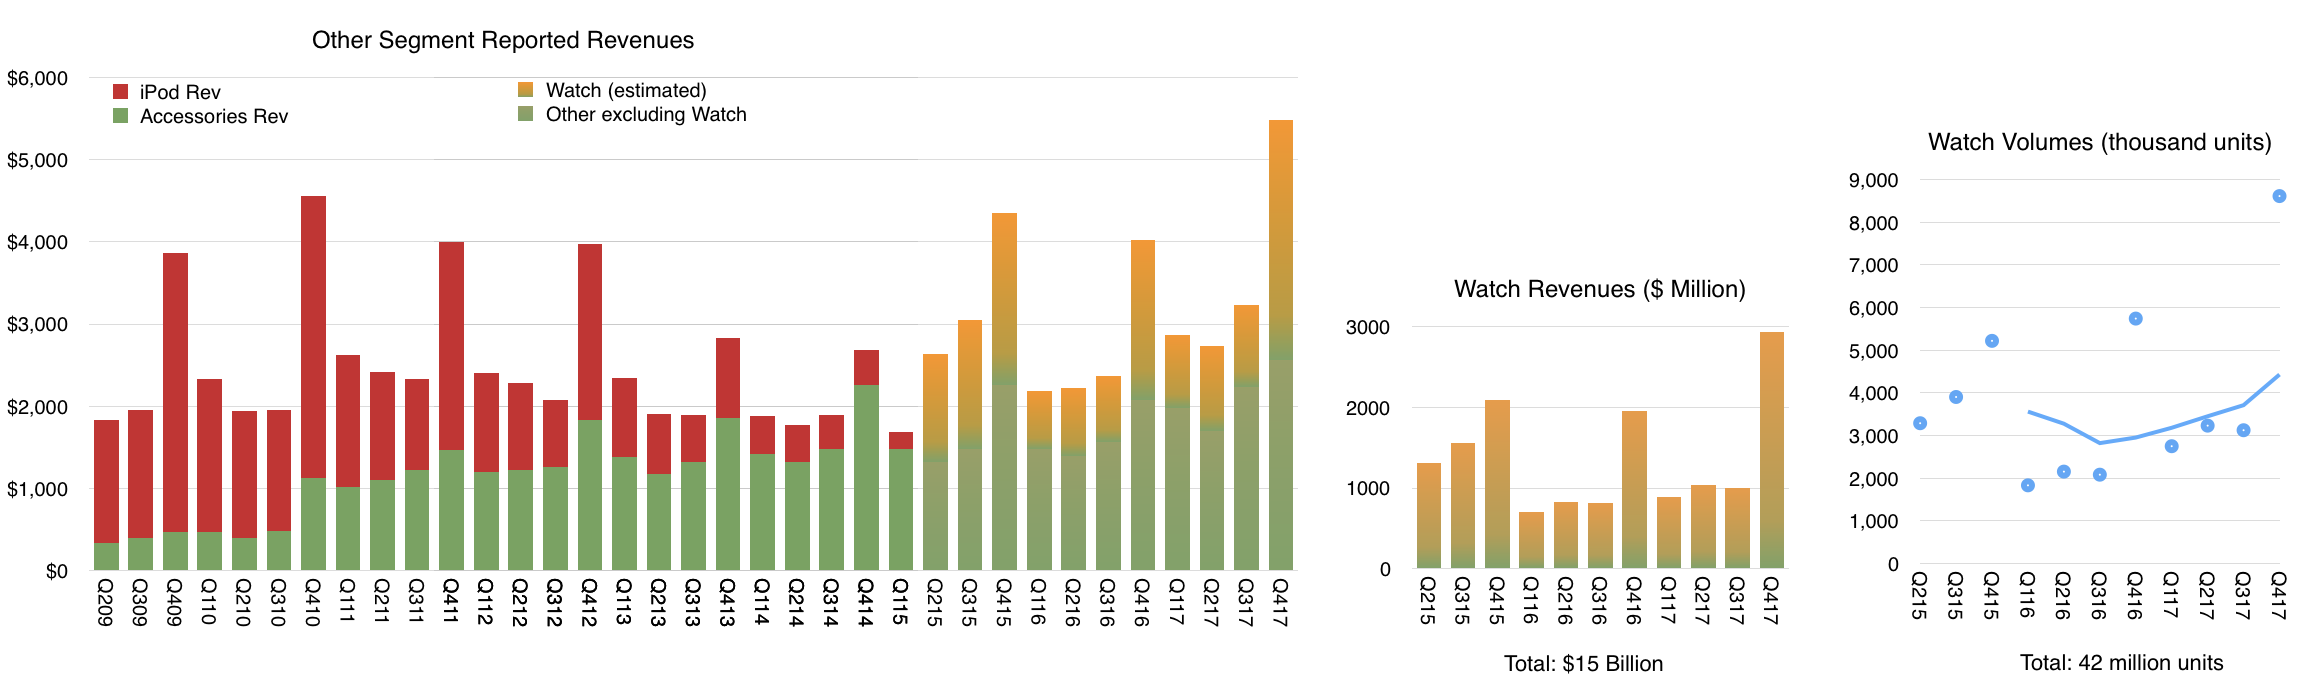
It was our best quarter ever for the Apple Watch with over 50% growth in revenue and units for the fourth quarter in a row and strong double-digit growth in every geographic segment. Sales of Apple Watch Series 3 models were also more than twice the volume of Series 2 a year ago. Apple Watch is the most popular, smart watch in the world and gained market share during the quarter based on the latest estimates from IDC. [Apple Watch is growing consistently. The following graph shows my estimates of volume (total 42 million to date) and revenues (total $15 billion) based on all available data and commentary from management.]
It was the third consecutive quarter of growth for iPad revenue, thanks to the strength of both iPad and iPad Pro. Based on the latest data from IDC, we gained share in nearly every market we track with strong outperformance in emerging markets.
Worldwide, almost half of our iPad sales were the first-time tablet buyers are those switching to Apple, and that’s true in some of our most developed markets, including Japan and France. In China, new and switching users made up over 70% of all iPad sales.
For Mac, we launched the all new, iMac Pro in mid-December. It’s an entirely new product line designed for our Pro users who love the all-in-one design of iMac and require workstation class performance. It's the fastest, most powerful Mac ever, delivering incredible computational power, for simulation and real time 3D rendering, immersive VR and complex photography audio and video projects. Worldwide, 60% of our Mac sales were the first time buyers and switchers and in China, that number was almost 90%.
We're looking forward to getting HomePod in customers’ hands beginning next week. HomePod is an innovative wireless speaker, which delivers stunning audio quality wherever its placed in the home, thanks to the advanced Apple engineered hardware and software.
Together with Apple Music, HomePod gives you instant access to one of the world's largest music catalogs. And with the intelligence of Siri, it’s a powerful assistant you control through natural voice interaction. We're very happy with the initial response from reviewers who've experienced HomePod ahead of its launch, and we think our customers are going to love this new product.
We believe one of the key issues of the 21st century is education. And because of that, we've strengthened our commitment and investment into initiatives like everyone can code. To find the innovators of the future, we need to nurture the students of today. Our App Development with Swift curriculum, which is available free on iBooks, has been downloaded more than 1.2 million times worldwide with almost half of those coming from here in the United States. It’s also being taught in dozens of community colleges across the country, putting practical skills in the hands of today’s jobs seekers.
I was in London two weeks ago as we announced that the program was expanding to more than 70 colleges and universities in Europe. Millions of students around the world will have the opportunity to add Swift to their coding vocabulary and gain skills that are essential for today’s economy.
This is an exciting time at Apple and with the best lineup of products and services we've ever had and a set of initiatives that show how business can be a force for good in the world. We could not be more excited about our future.
Now, for more details on the December quarter results, I'd like to turn over the call to Luca.
Luca Maestri: Thank you, Tim. Good afternoon, everyone. Our business and financial performance in the December quarter were exceptional, as we set new all-time records for revenue, operating income, net income and earnings per share.
Starting with revenue, we’re reporting an all-time record, $88.3 billion, up nearly $10 billion or 13% over the prior record set last year. It is our fifth consecutive quarter of accelerating revenue growth. As you know, the December quarter a year ago spanned 14-weeks compared to 13-weeks this year, which is important to consider as we have set the underlying performance of our business this year. When we look at average revenue per week, our growth rate was even higher at 21% with growth across all product categories for the third consecutive quarter.
Our results were terrific all around the world with double digit revenue growth in all our geographic segments, an all-time quarterly record in the vast majority of markets we track, including the U.S., Western Europe, Japan, Canada, Australia and Korea, as well as Mainland China, Latin America, The Middle East, Central and Eastern Europe, and India.
In Greater China, we were very happy to generate double digit revenue growth for the second quarter in a row and in emerging markets outside of Greater China, we saw 25% year-over-year growth.
Gross margin was 38.4% at the high end of our guidance range. Operating margin was 29.8% of revenue. Our net income was $20.1 billion an all-time record, and up $2.2 billion over the last year. Diluted earnings per share were $3.89 also an all-time record and cash flow from operations was very strong at $28.3 billion.
During the quarter, we sold 77.3 million iPhones, the highest number ever for a 13-week quarter. Average weekly iPhone sales were up 6% compared to December quarter last year with growth in every region of the world despite the staggered launch of iPhone 10. We established all-time iPhone revenue record in nearly every market we track with double-digit growth in all of our geographic segments. iPhone ASP increased to $796 from $695 a year ago, driven primarily by the launch of iPhone 10 and the success of iPhone 8 and 8 Plus.
We exited the December quarter towards the lower end of our target range of five to seven weeks of iPhone channel inventory with less than 1 million more iPhones in the channel compared to the December quarter a year ago, in line with our growth in average weekly unit sales. Customer interest and satisfaction with iPhone are very, very strong for both consumers and business users.
The latest data from 451 Research indicates U.S. customer satisfaction ratings of 96% or higher across iPhone models. In fact, combining iPhone 8, iPhone 8 Plus and iPhone 10, consumers reported an amazing 99% satisfaction rating. And among business customers planning to purchase smartphones in the next quarter, 77% planned to purchase iPhone. Our customers are also incredibly loyal with Kantar's latest U.S. research, reflecting a 96% iPhone loyalty rate, the highest ever measured. [Customer satisfaction is the second most important figure after active user base. Combining these two figures yields the recurring revenue value of the company. Remember what Deming said: the most important measurements for a company's value are the multipliers of a satisfied customer and a dissatisfied customer--these numbers never appear on any financial report but they are applied to all the numbers on every report].
Turning to services. We had a terrific quarter with revenue of $8.5 billion, up 18% year-over-year and up 27% in terms of average revenue per week; that is an acceleration to the 24% services growth run rate that we experienced in the September quarter.
The App Store set a new all-time revenue record. The Store’s all-new design is off to a fantastic start with quarterly store visitors, transacting accounts and paying accounts, reaching new all-time highs. During the week beginning December 24th, a record number of customers made purchases or downloaded Apps from the App Store, spending over $890 million in that seven-day period, followed by $300 million in purchases on New Year’s day alone.
And according to App Annie’s latest report, the App Store continues to be the preferred destination for customer purchases by a very wide margin, generating nearly twice the revenue of Google Play. Across all our services offerings, paid subscriptions reached $240 million with growth of 58% over last year and they were a major contributor to the overall strong growth in services revenue. [Apple has half the user base of Google Android. This is based on Google's May 2017 report of 2 billion active devices vs. the 1.3 billion that we just got from Apple. And yet these users collectively spend twice as much on apps. This ratio of "half the users, twice the spending" has been cropping up in individual developer anecdotes and can also be seen in other metrics of engagement and consumption. This should not be surprising as it conforms to the Pareto distribution of economic value.]
As Tim mentioned, it was our best quarter ever for Apple Watch. And when we add to this us from Beats and AirPods, our total revenue from wearables was up almost 70% year-over-year. In fact, wearables were the second largest contributor to revenue growth after iPhone, which is impressive for a business that started only three years ago. In total, our other products category set a new all-time record with quarterly revenue exceeding $5 billion for the first time. [Wearables now includes more than watches but watches are likely still the dominant product.]
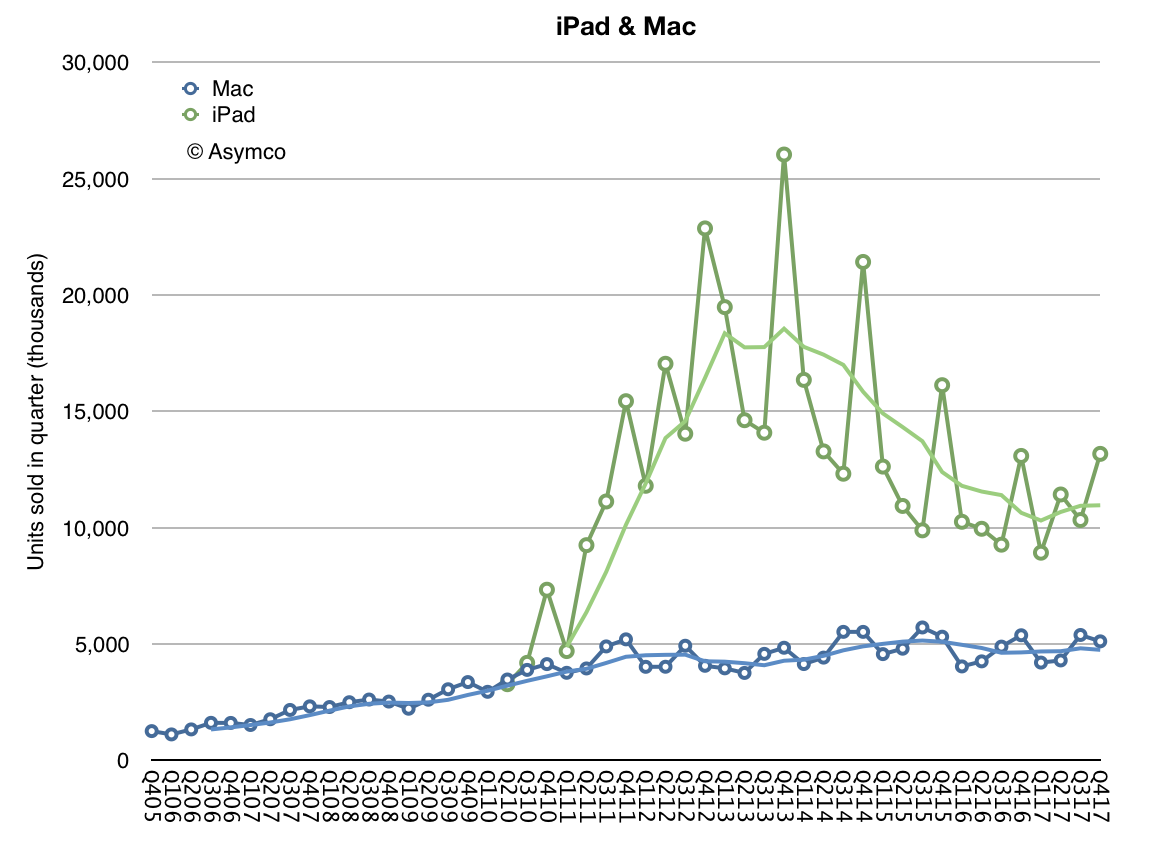
Next, I’d like to talk about the Mac. We sold 5.1 million Macs during the December quarter, which translates to a 2% year-over-year increase in average sales per week. Mac performance was particularly strong in emerging markets with unit sales up 13% year-over-year and with all-time records in Latin America, in India, Turkey and Central and Eastern Europe. On a worldwide basis, the active install base of Macs was up double-digits year-over-year to a new record.
It was also another growth quarter for iPad. We sold 13.2 million units with average iPad sales per week up 8% over last year’s December quarter. iPad sales grew strong double-digits in many emerging markets, including Latin America, the Middle East, Central and Eastern Europe and India, as well as developed markets, including Japan, Australia and Korea. The active install base of iPad has grown every quarter since its launch in 2010, and it reached a new all-time high in December, thanks to extremely high customer loyalty and large numbers of first-time iPad users. [iPad is clearly recovering from a long decline. ASPs are rising as it's being positioned as a PC alternative. Its low end functions are being absorbed by large screen iPhones.]
NPD indicates that iPad had 46% share of the U.S. tablet market in the December quarter, up from 36% share a year ago. And the most recent surveys from 451 Research found that among customers planning to purchase tablets within 90 days, 72% of consumers and 68% of business users planned to purchase iPads. Customer satisfaction is also very high with businesses reporting a 99% satisfaction rating for iPad.
We are seeing great traction in enterprise as businesses across industries and around the world standardize on iOS. For example, Intesa Sanpaolo, one of Europe’s leading banks, has chosen iOS as the mobile standard for its entire 70,000 employee base in Italy; choosing iOS for its security, user interface, accessibility and reliability, Intesa Sanpaolo will deploy native apps to improve employee productivity in customer support, human resources, and marketing across the company.
And LensCrafters, one of the largest optical retail brands in North America, will be using over 7,000 iPad Pros to enable digital eye exams and digital optical measurements in a personalized and interactive experience. We’re also rolling out a new initiative, called Apple AtWork to help businesses implement employee choice programs more easily and offer Apple products company-wide.
Resources from both Apple and our channel partners will enable enterprise IT and procurement teams to buy or lease Apple products more efficiently, streamline the setup of iPhone, iPad, and Mac, and deliver a seamless onboarding experience for employees. We launched the program with CDW in the U.S. last week, and we would be expanding to more channels and regions later this year.
The December quarter was extremely busy for our retail and online stores, which welcomed 538 million visitors. Traffic was particularly strong during the four-weeks following the launch of iPhone 10, up 46% over last year. And across the quarter, our stores conducted over 200,000 today at Apple sessions, covering topics including photography, music, gaming, and app development, and art and design. Just last weekend, we opened our first store in Seoul, Korea and we’re looking forward to opening our first store in Austria in a few weeks. These newest openings will mark the expansion of our retail store presence to 21 countries.
Let me now turn to our cash position. We ended the quarter with $285.1 billion in cash plus marketable securities, a sequential increase of $16.2 billion. $269 billion of this cash, or 94% of the total, was outside the United States. We issued $7 billion in debt during the quarter, bringing us to $110 billion in term-debt and $12 billion in commercial paper outstanding, for a total net cash position of $163 billion at the end of the quarter. We also returned $14.5 billion to investors during the quarter. We paid $3.3 billion in dividends and equivalents, and spent $5.1 billion on repurchases of 30.2 million Apple shares through open market transactions.
We launched a new $5 billion ASR program, resulting in initial delivery and retirement of 23.6 million shares and we retired 3.8 million shares upon the completion of our 12th ASR during the quarter. We’ve now completed over $248 billion of our $300 billion capital return program, including $176 billion in share repurchases against our announced $210 billion buyback program with $34 billion remaining under our current authorization. [An updated look at Apple's cash is shown below]
Turning to taxes. Due to the recently enacted legislation in the U.S., we estimate making a corporate income tax payment of approximately $38 billion to the U.S. government on our cumulative past foreign earnings. This amount is very similar to what we had been accruing on those earnings in our financial results through fiscal year 2017, including the $38 billion payment. We will have paid over $110 billion of corporate income tax on our total domestic and foreign earnings during the last 10 years for a cash tax rate of about 26%. [Apple has paid more tax than any company in history, and is about the make the largest single payment to the US Treasury.]
Our tax rate of 25.8% for the December quarter was close to our guidance of 25.5% as the lower U.S. statutory rate from the new legislation was effective offset by the remeasurement of deferred tax balances.
As we move ahead into the March quarter, I'd like to review our outlook, which includes the types of forward looking information that Nancy referred to at the beginning of the call; we expect revenue to be between $60 billion and $62 billion; we expect gross margin to be between 38% and 38.5%; we expect OpEx to be between $7.6 billion and $7.7 billion; we expect OI&E to be about $300 million; and we expect the tax rate to be about 15%.
Tax reform will allow us to pursue a more optimal capital structure for our company. Our current net cash position is $163 billion. And given the increased financial and operational flexibility from the access to our foreign cash, we are targeting to become approximately net cash neutral overtime. We will provide an update to our specific capital allocation plans when we report results for our second fiscal quarter, consistent with the timing of updates that we have provided in the past.
Finally, today our Board of Directors has declared a cash dividend of $0.63 per share of common stock, payable on February 15, 2018, to shareholders of record as of February 12, 2018.
To the nearest million, as of the end of September 2017, Apple's cash and investments totaled $268,895,000,000. Note that this includes investments in the form of short- and long-term marketable securities. Long-term marketable securities are not always accounted as "cash" because strictly cash is considered a liquid asset and some securities may not be sufficiently so. Nevertheless, most analysts would agree that Apple's securities are sufficiently liquid to qualify as cash. Note that for archaic reasons this cash is separated into US and non-US holdings with $17 billion located in the US.
Most businesses keep very little cash on their books. Why does Apple have so much cash?
Indeed Apple's cash is extraordinary. It amounts to about 30% of its market capitalization. One reason is that Apple has taken many loans, totaling about $100 billion.
Whoa! Why would Apple need to take out loans? Does it have problems with cash flow? ((Companies often borrow because they need to plug gaps in profitability, best measured as "free cash flow".))
Quite the contrary, Apple's operating cash flow is eye-watering. In the 2017 fiscal year (ending September) Apple generated $63,598,000,000 from operations. The loans are not needed to operate. They are used to pay shareholders.
Why does Apple need to pay shareholders?
Because it's their money.
Wait, I thought you said this was Apple's cash.
Apple is holding it for them but if it has more than it needs it's obligated to return it. You see, If you were to look for "cash" in financial statements you find it on the balance sheet as an asset. Since it is growing and since a balance sheet has to balance, there has to be a liability that grows in proportion to offset the cash asset. That liability is called Shareholder's Equity. This is a "debt" the company has to shareholders. If it pays out cash to shareholders then it zeros out an asset and a corresponding liability. The net is zero as far as Apple is concerned but shareholders get something in return for giving Apple money in the first place.
So hold on, it takes out loans to pay shareholders because it "owes them money" while it has too much money? This makes no sense.
Yes, welcome to tax laws. Although it generates more money than it can use, and that money should thus be returned to shareholders, some of the money is collected outside the US. US (and US only as far as I know) tax laws have a "repatriation tax" that is levied on money coming into the country. This has nothing to do with corporate taxes which are levied on earnings. So after paying shareholders with the cash it had in the US, Apple had to borrow money to pay shareholders money they had outside the US.
Why not just pay the repatriation tax?
Because then shareholders would get less than 70% of their money. They would probably complain and blame the managers for being incompetent. Such blame usually comes with a lawsuit attached.
What about the new tax law that lowered the repatriation tax rate?
Now Apple has no option but to pay the tax and repatriate the cash. It's still a tax. The amount will be about $38 billion or about 15%. Previous repatriation "holiday" levies were around 10%.
How exactly does the company give money to shareholders?
The payments are called "dividends" and shareholders must treat them as income--a form of double taxation because these funds are after the company paid earnings tax and possibly repatriation tax. Apple does pay dividends regularly but because of tax inefficiency (i.e. because government policy discourages dividends) the company mainly buys its own shares and retires them.
Huh?
Yes, it makes little sense but the math is simple. If the company buys its own shares and makes them disappear then existing shareholders will end up owning more of the company, making their shares more valuable. They can realize the gain if/when they sell the shares (and pay capital gains tax instead of dividend income tax on the already (double) taxed profits.)
Does that mean that it is going private?
No. The owners of the company remain the same: whoever owns shares owns the company and they can be traded in public exchanges. In theory they could reduce the share count to a single share and there would presumably be a single shareholder who would own the company, making it "closely held" but the company's managers are still required to report and act as if it was public. Going private usually means a set of shareholders agree not to allow the shares to float on the open market and thus to also keep the affairs of the company out of public eye. It reduces liquidity and is generally harder for shareholders to exit their investment. This has nothing to do with reducing the number of shares in circulation--which is what Apple is doing.
But buying shares does not seem to affect the share price so the shareholders are not benefiting from the repurchasing. Isn't this a waste of cash? Aren't the shareholders being robbed?
The share price is an argument between shareholders and potential shareholders on the value of the company. It should reflect reality but many times it doesn't. Over time however the math catches up with sentiment. In other words realization that there are fewer and fewer shares available compels people to not sell them, increasing the price. Short term investors tend not to pay attention to this but they are not the shareholders who Apple wishes to pay back anyway.
Why doesn't the company spend the money on other things? You said they return what they can't use. Why can't they use it?
Simply, because it's more than can be spent wisely. The company considers its mission to be very narrow: add value in specific areas where they can create tremendous value uniquely and under conditions (technologies and business models) they can control. Many such projects don't require capital. Manufacturing, data centers and Apple stores require capital but R&D and sales not so much. Creating products is very cash efficient. For example, the iPhone--the most successful product of all time--cost almost nothing to develop; certainly nothing that required Apple to dip into its cash. Funding for the type of product development Apple does comes from existing cash flows and mostly consists of salaries for their employees.
What about acquisitions? Why not buy other companies?
It buys companies but usually small ones which are essentially acquisitions of teams and their intellectual property. Apple does not buy "business models" or customers or cash flows which is what large companies are valued for. Operationally, it's also because Apple has a strong culture and it wishes to preserve it. Acquisitions dilute culture which is why integrations often fail. Statistically, large acquisitions are value destructive and the larger they are, the more likely they are to fail. Incidentally, when a company is acquired with cash that hole in the balance sheet is filled with something called "goodwill" which reflects some intangible value of the new asset. If and when the acquisition is deemed to have failed the goodwill is written off and so is shareholder equity. That's how shareholders are robbed.
What about keeping it? Doesn't having lots of cash make Apple more powerful?
As individuals we think that having lots of cash makes us rich. For companies it's the opposite. Cash is a liability. If you come across a company that is cash rich and has nothing else, its enterprise value will be zero. Companies are valued on their future cash flows, meaning their ability to generate cash, not how much they managed to keep. In other words, cash is a measure of past success and investors are interested only in future value. That future value comes from the intelligent allocation of resources toward a valuable goal. A company rich in cash but poor in vision is likely to be taken private or broken up and shut down. Cash is an IOU to shareholders with a thank-you note for the support through the years.
How Apple is managed is one of its enduring mysteries. The idea that a company with $235 billion in sales is managed with a single P/L ((Profit and Loss statement is an income statement usually applied for a subset of a larger company which allows subdivisions to be managed individually.)) is fascinating in many ways. Not least of which is how it allocates resources. The fundamental question of which great idea gets to be funded and which great idea gets to be ignored is the core of every manager's dilemma. The Apple problem is at scale when each decision's consequences are so momentous. In the case of Apple there are so few projects that reach the market and their impact is so great that one wonders how they can be sure they are doing the right thing.
Conventionally, product development is filtered through a sieve of metrics, market sizing and impact on top/bottom income lines. These "financial" measures of success are considered prudent and optimized for return on equity (also known as the maximization of shareholder returns).
But this can be a toxic formula. The financial optimization algorithm always prioritizes the known over the unknown since the known can be measured and is assigned a quantum of value while the unknown is "discounted" with a steep hurdle rate, and assigned a near zero net present value. Thus the financial algorithm leads to promoting efficiency at the expense of creation. Efficiency may be the right priority when times are difficult and resources are scarce but creativity is the right priority in a time of plenty. And abundance is what being big is all about.
To allow for some creation large firms create divisions. Some divisions are tasked with "core products" which are measured by a set of firm metrics and some are tasked with "emerging products" which are given a set of loose metrics. This leads to obvious resentment and war between divisions when resources need allocating.
Ominously, the core divisions tend to always win. At the root of divisional power struggles are measurements--the roots of financial metrics. Managers fight with data. "You can't manage what you can't measure" they're taught. But if you have something that can be easily measured and something that is difficult to measure, won't the easily-measured be managed and the hard-to-measure be ignored?
There is a general principle at work here: Managing by measurement is fraught with the pitfall of measuring the wrong thing. Making sure that you're measuring the right thing becomes the value-adding role of the manager. A role that is increasingly being neglected.
The mass phenomenon of measuring the wrong thing because it's the easiest to measure is called "financialization". Financialization is the process by which finance and finances (rather than creation) determine company, individual and society's priorities. It comes about from an abundance of data that leads to fixation on what is observable to the detriment of awareness of hazards or obstacles or alternatives. This phenomenon is more likely when the speed of change increases and decision cycles shorten.
Financialization is creeping into all aspects of society and the extent to which it infects companies is the extent to which they suffer from early mortality.
So is Apple avoiding financialization? How can anyone avoid the tyranny of mis-optimization?
The unified P/L might be a clue. It obviates the need for divisional rivalry and power-based or financial politics. Without divisional P/L, management can be organized functionally with the obvious benefit of de-politicization. The singular P/L does create another problem however: the absence of an alternative resource allocation algorithm centralizes the decision. By centralizing decisions at the highest level, few decisions can be taken and that means each decision has to be right more often. We swap a distributed but financialized process for a central but capricious one.
So how is the central decision process made fair? What guides the allocation process?
I believe that Apple does not avoid quantified decision making. I believe the logic of their decisions is based on a nuanced quantification of the company's customer base. Opting to think about how many customers they have rather than how many things they can sell could offer the Apple manager a better decision tool, avoiding financialization and mis-optimization.
The guiding principle is putting the customer rather than the firm at the center of the decision process. The idea of this change of orientation extends to a re-definition of the purpose of the firm. Apple calls it its "North Star" and it places "making the best product" at that location.
The challenge is how to measure "goodness" of product. It's easy to overshoot "best" and become too good. What regulates greatness is another measurement: absorption of what you create. The true orientation (which Apple won't confess to) is absorbable greatness.
Absorbable greatness is measured through other proxies: customer creation, customer satisfaction, and customer retention. By adding and preserving great customers you can be sure that what you create is indeed the "best". Setting the goal, and indeed the purpose of the firm, as the creation and preservation of customers seems to be the unwritten constitution of Apple.
The idea that the purpose of the firm is to create and maintain customers is not new ((Customer creation is in contrast to the notion that the purpose of the firm is to maximize shareholder returns. The notion of customer creation as primary purpose was popularized by Peter Drucker. The notion of optimization through shareholder value creation was popularized by Jack Welch.)) but it is relatively rarely practiced. The reason is that the data is harder to obtain. The data that comes from sales is crisp and concrete. The data about customers is muddy and soft. In a world where spreadsheets are used as weapons, the crisper the data, the better the ammunition.
Clarity wins arguments but it may not be where salvation or truth can be found. Good judgement in a cloudy reality is a better compass than a clear road map to a fantasy world.
Optimizing around customer acquisition rather than equity returns leads to a new set of metrics. What would these metrics look like for Apple?
The company publicly offers three separate sets of quantity of customers and quality of customers.
In terms of quantity we have:
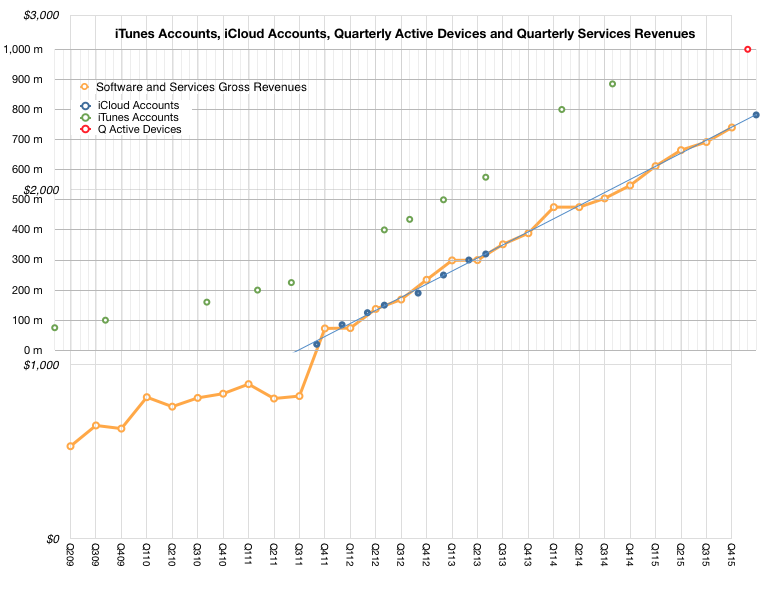
Number of iTunes accounts
Number of iCloud accounts
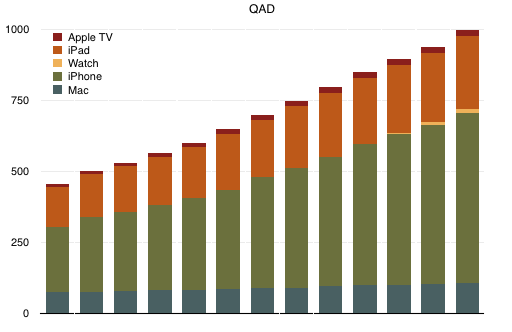
Number of active devices
In terms of quality of customers we have:
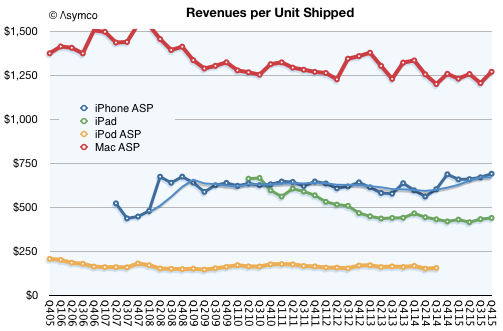
Average selling prices for devices (as a proxy for willingness to pay)
Customer satisfaction (as a proxy for loyalty )
Services and accessory revenues (post-sales and recurring value)
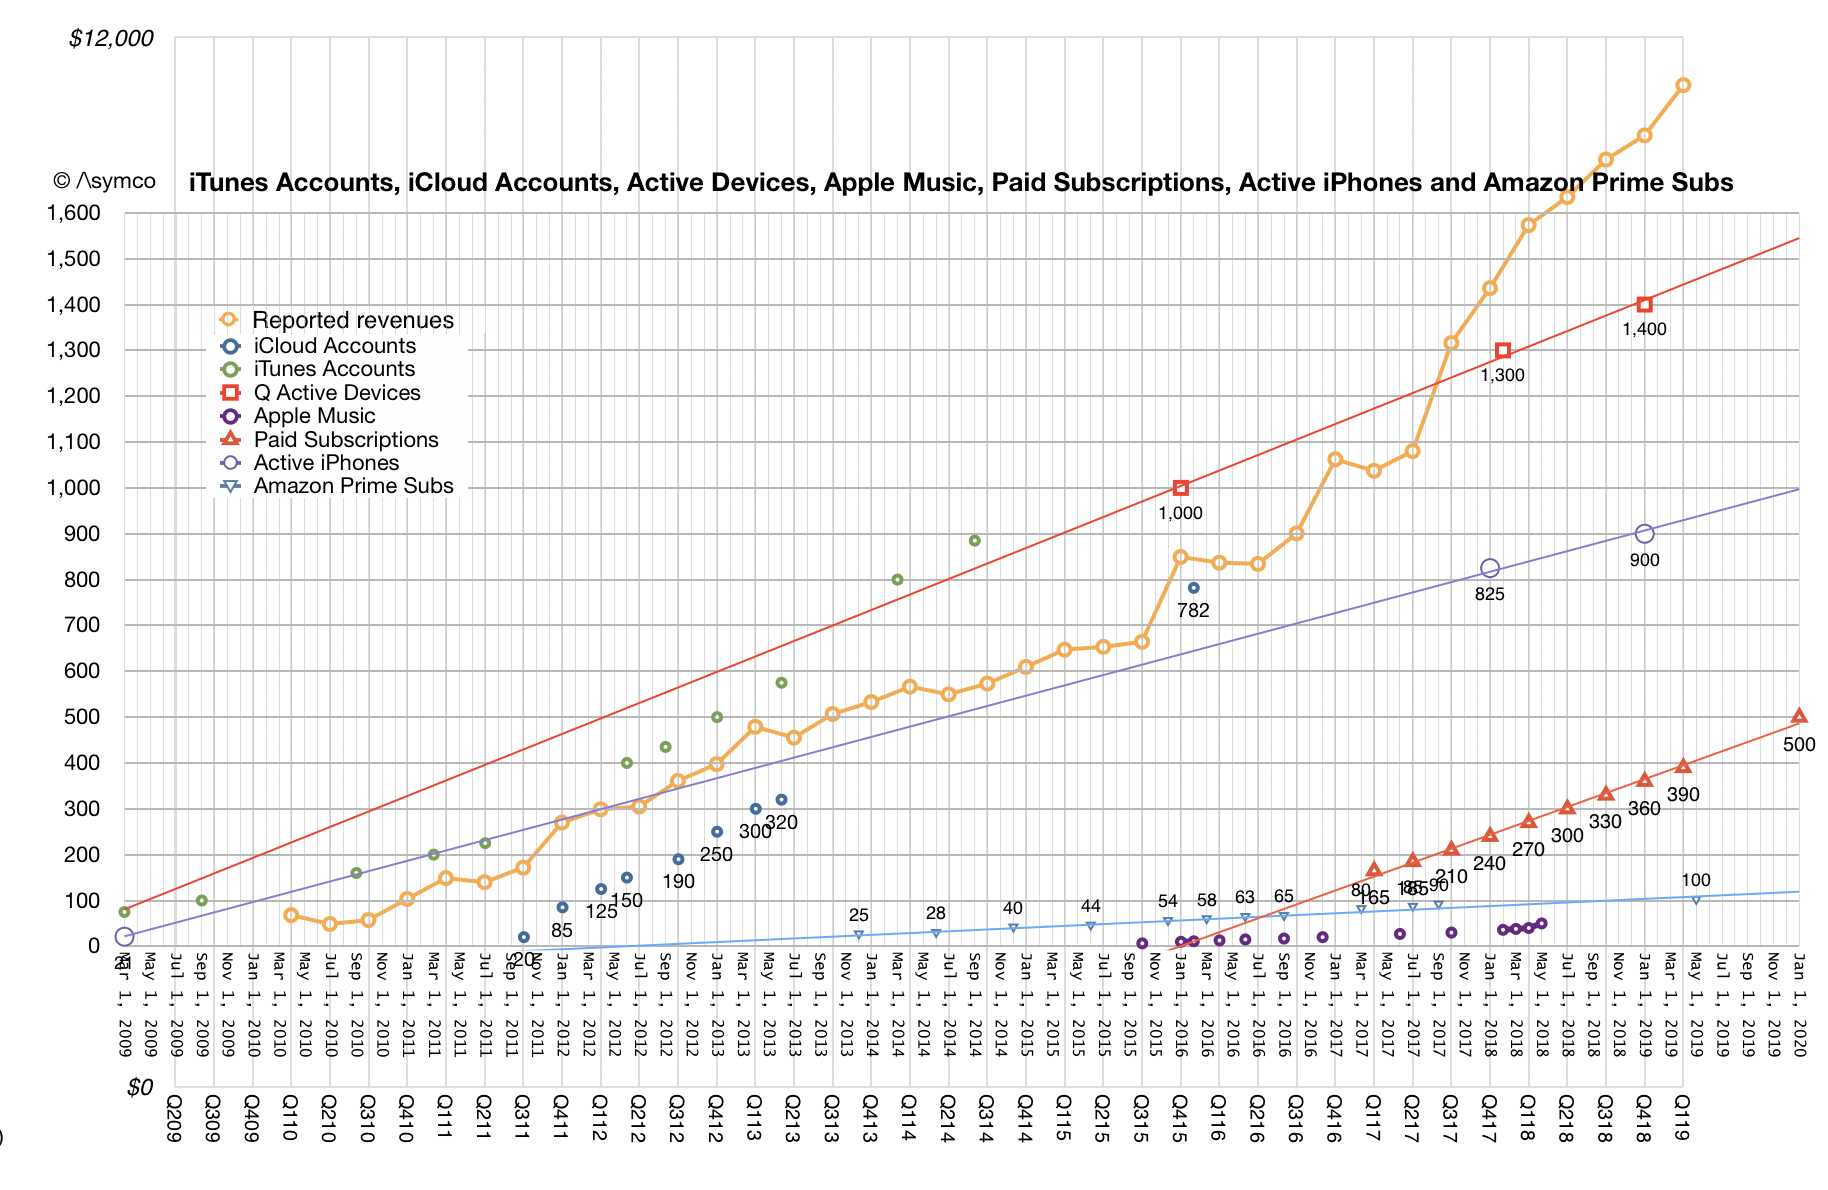
The following graph shows the historic data for service accounts and corresponding services revenues.
The following graph shows the average price per hardware product indicative of loyalty through stability in the face of growing competition.
The following graph shows an estimate of growth in active devices as a proxy of customer base.
Unlike product shipments and revenue data which follow rises and falls in individual products due to the cyclicality of technology and adoption, these graphs show a smoothness and predictability of customer base behavior.
Looking at Apple this way gives the impression that the company has a large number (nearly a billion) of repeat (subscribed to service) customers. These customers can be seen to spend a predictable recurring amount (average selling price) on Apple's brand. The repetition of these metrics in public commentary suggests that customer acquisition and retention are among Apple's goals.
The key question is whether this is Apple's primary goal.
Seen this way each centralized resource allocation question can be assumed to be prefaced with "In order to create/preserve customers should we...?"
This leads to answers quite different from questions that start with "In order to sell/profit more should we...?"
For instance, offering education products, retail store experiences, healthcare products, green energy initiatives, accessories, content and services make sense even if they may have poor financial "returns". These initiatives score highly on customer retention and satisfaction. They may lead to engagement and repeat sales. Managers working on these initiatives would gain the respect of their peers, leading to more esteem and higher quality output. Finally, and most importantly, these efforts would be preserved regardless of cyclical downturns.
The assessment of analysts should therefore be couched in similar terms: "What is the impact of a new initiative in customer creation and preservation?" rather than "What is the impact of a new initiative in driving revenues and profitability".
We can see immediately why the second question is popular while the first isn't: it's easier to assess an answer to the second because we have the data that allows for its calculation.
This is why asking the wrong questions is popular.
Apple is categorized as a vendor of consumer electronics. More specifically, a member of the "Electronic Equipment" industry in the "Consumer Goods" sector. If indeed this is what it's thought to be selling, there is a problem because it isn't what its customers are buying.
Apple's customers buy a mix of hardware, software and services under a brand that assures a certain quality of experience. This bundling and integration of otherwise disparate things is why the brand is such a success.
This anomaly between what Apple is thought to sell and what buyers actually buy can leave the casual observer confused. As a result the company's categorization as vendor of hardware deeply discounts its shares. It is, in other words a less valuable business. This is because a seller of consumer electronics does not benefit from "system valuation" since there is minimal loyalty to the product after the sale.
The consumer electronics vendor has no network to leverage, no ecosystem adding value after the sale, no platform and works through multiple levels of distribution to reach the customer. In contrast, a system vendor can expect benefits from network effects, ecosystems, and a coveted relationship with the end user.
The result is that the valuation of a consumer electronics vendor is based on the momentum of individual products. Apple has always been valued this way. Each hit product is considered to be a stroke of luck/genius and the chances of recurring are discounted to about zero. Regardless of the fact that it has a track record of "home runs", Apple's hit rate is not considered sustainable. ((The P/E ratio is the primary indicator in this analysis)). Certainly Apple is not valued as being able to generate reliably recurring revenues.
But what if we were to value Apple on the basis of what people are buying rather than what it's thought to be selling?
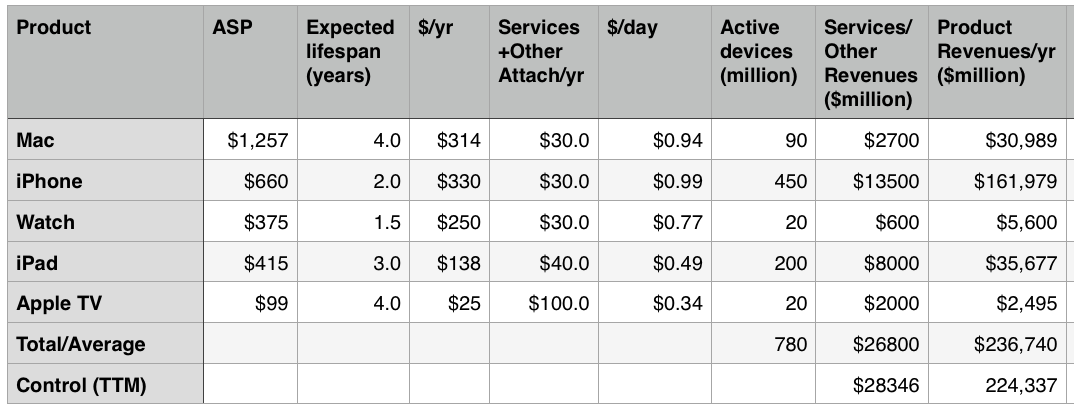
The model is simple enough: determine the number of users, estimate the lifespan of the products, and figure out the services attached to the products; then, given the price, obtain a price per product per day. You then can get a recurring revenue figure.
I did just that and the results are in the following table:
The first column is the product, the second is the Average Selling Price (ASP), the third is the expected lifespan of the product, and the fourth column is a calculation of the end user’s “spending per year” on the product.
The fifth column is an estimate of the revenues from Apple's Services and "Other" groups from post-sale revenues attached to the product. This Services revenue includes AppleCare, iCloud, Music, App Store, other stores, Beats, accessories, iAd, and Made for i (MFI) licensing. It also includes Google traffic acquisition revenues and other licensing.
The sixth column is an estimate of the consumer "spend per day" on Apple's product lines taking into consideration Services.
The seventh column is an estimate of the number of active devices in the hands of users. Note that these are expected to change over time.
The eighth column is a calculation of Services/Other income on a per-product allocation. This is a test of the Services+Other estimate and is meant to sum to nearly what Apple currently reports as Services+Other revenues.
The ninth column is a test of overall revenues on a per-product allocation. This should add up to total revenues (estimated for next year.) ((Naturally, the active devices estimate is the most sensitive but it should be tweaked to create a reasonable forecast for next year.))
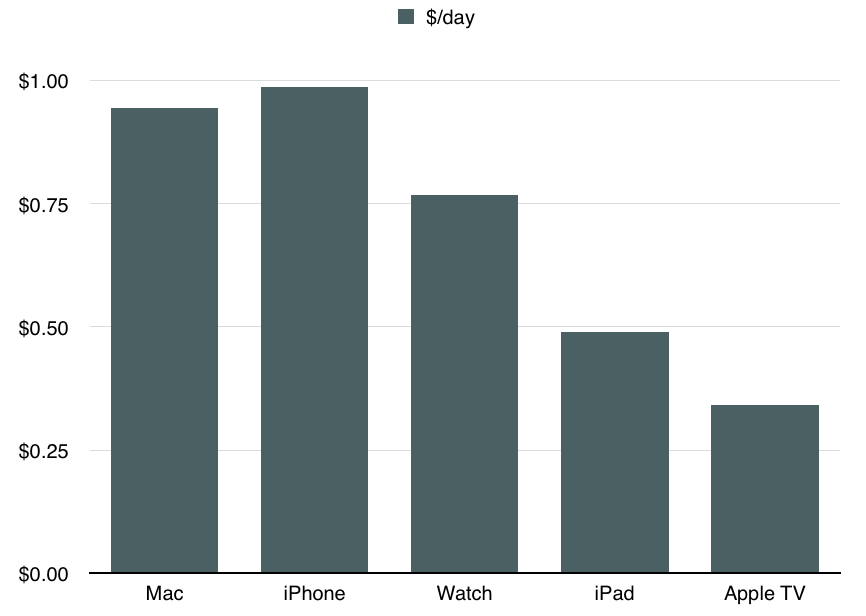
The bottom line is the following graph which shows the revenue per device per day inclusive of Services and Other income (The sixth column).
This is, in my opinion, a reasonable way to approach valuation of Apple as a business. It's also a way to inspect its strategy.
As a valuation we can easily obtain the net present value. The model gives us sales and by estimating a net margin (which is remarkably steady around 22%) we can get the free cash flow.Iterate into perpetuity with a discount rate, and you can get the net present value of the company. With a modest growth rate leading to a billion active devices in use and a normalized revenue per device of $0.92 you can easily see cash flows equivalent to $1 trillion in present value.
But much more interesting than this value is the notion that Apple is in business to deliver a product/service mix to loyal customers and to preserve their loyalty through constant improvement and innovation. You can see strategic intent in increasing the attach rate of services per device. You can see a strategic intent in building loyalty and the right customer base which is likely to be loyal. You can see strategic intent in the iteration of the product in a way that extends loyalty and expands the solid base but also increases the $/day rate. This analysis correctly informs almost all decisions the company makes.
What we just saw in the launch of a new Apple TV and a new iPad is consistent with this strategy. Apple TV will have a higher service attach rate with apps while keeping pricing well below consoles thus expanding the user base. The iPad is increasing in price and getting more accessories. The developers are encouraged to build richer and more valuable apps that are uniquely enabled by the new device.
The fact that Apple has just launched a subscription service for the iPhone makes what was clearly their strategy all along plain to see however it has been a strategy in effect for decades.
It isn't a difficult idea to embrace. It always surprises me that it's not more commonly held. The reason may be that Apple is mis-categorized.
Or perhaps the entire categorization of industries and sectors is obsolete in what is a new post-industrial age. Some have figured this out already. Others will take longer.
Apple paid $10 billion to developers in calendar 2014. Additional statistics for the App store are:
$500 million spent on iOS apps in first week of January 2015
Billings for apps increased 50% in 2014
Cumulative developer revenues were $25 billion (making 2014 revenues 40% of all app sales since store opened in 2008)
627,000 jobs created in the US
1.4 million iOS apps catalog is sold in 155 countries
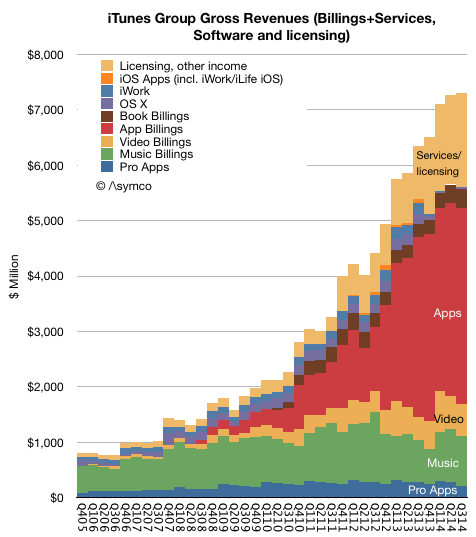
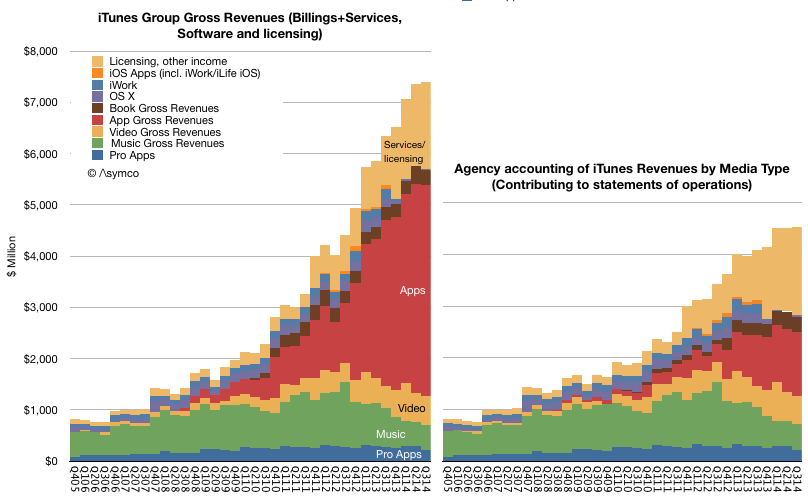
Putting these data points together with others from previous releases results in a fairly clear picture of the iTunes/Software/Services ((soon to be renamed Services and encompass everything under the heading of iTunes software and services today including content, apps, licensing and other services and beginning Q4 2014 it will also include Apple Pay.))
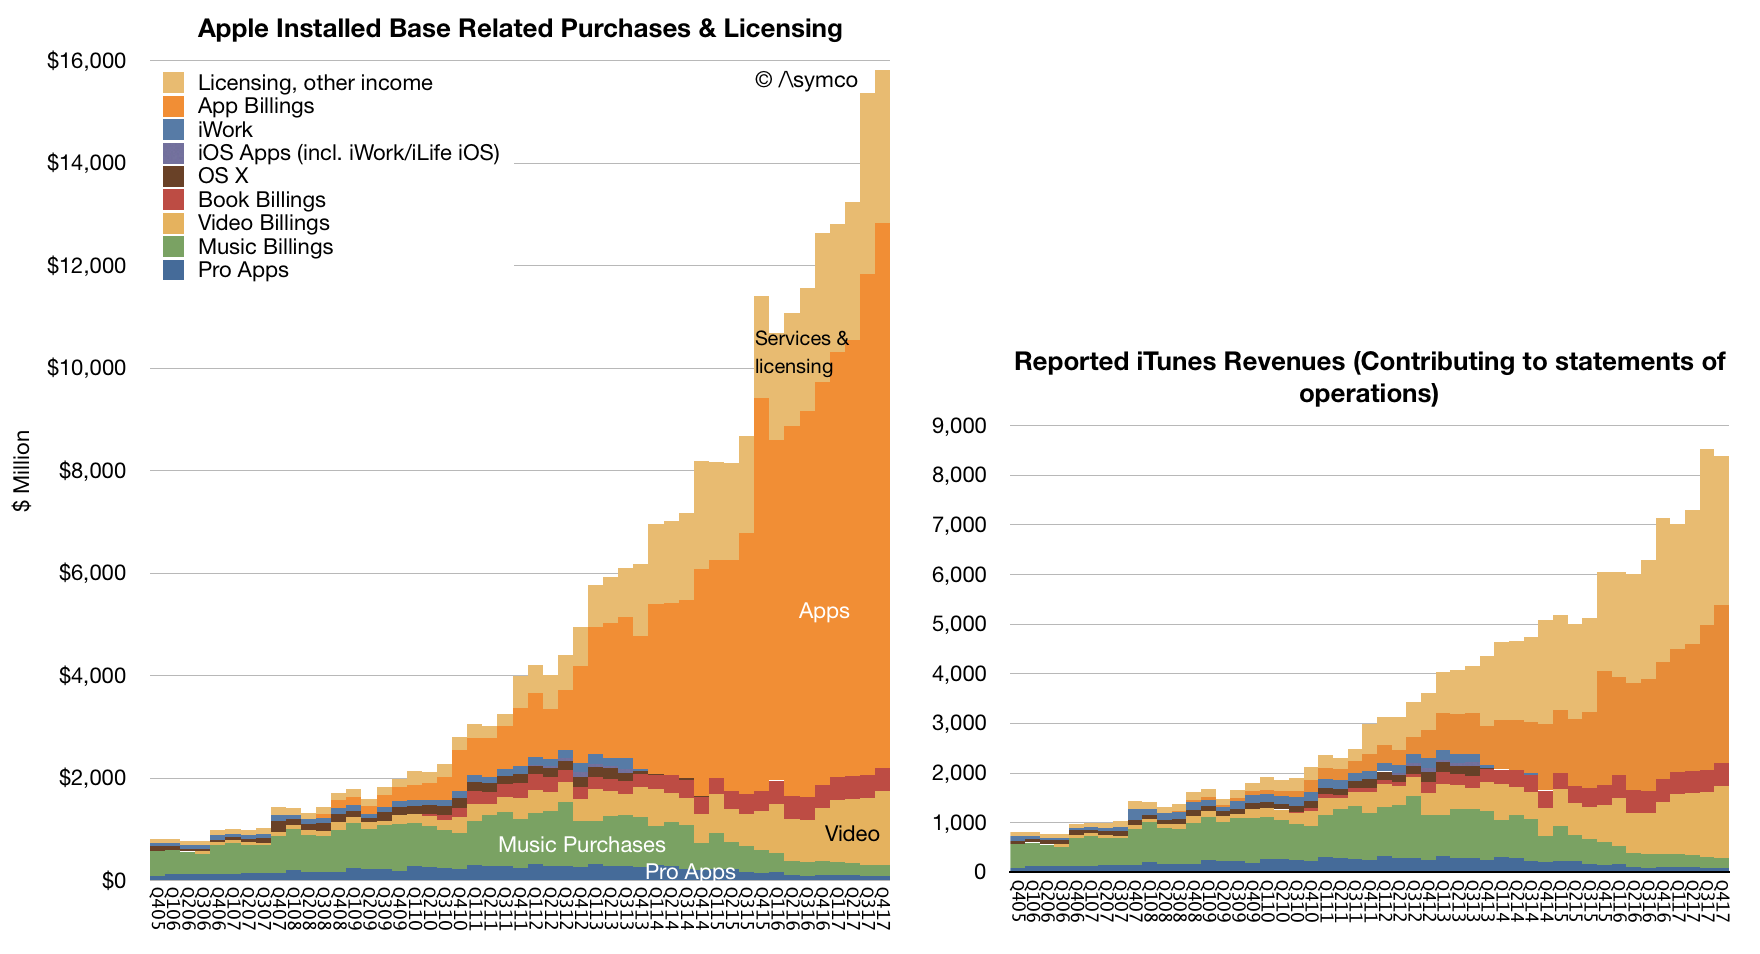
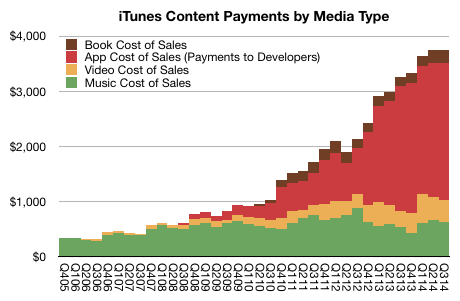
The App ecosystem billings (what consumers actually pay) is shown in the red area above. 70% of those payments are transferred directly to developers and Apple reports the 30% remaining as part of its revenues. This view of the iTunes ecosystem shows the impact of Apps relative to the other media types. When we measure the payments to the content owners we can see that Apps also dominate:
The red area above adds up to the approximately $25 billion total paid to developers. This view of the payments to ecosystem contributors shows how apps are now a bigger digital content business than music (( Music payments due to iTunes Radio streams are not shown as part of Music cost of sales. Streaming revenues are included in the services/licensing income and payments come out that cost structure.)) and TV programs and Movie rentals and purchases put together.
This is quite a story.
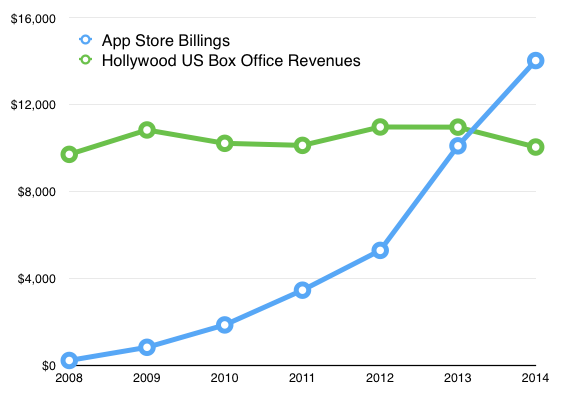
Put another way, in 2014 iOS app developers earned more than Hollywood did from box office in the US.
Although the totals for Domestic (US) Box Office are not the complete Hollywood revenues picture, Apple's App Store billings is not the complete App revenue picture either. The Apps economy includes Android and ads and service businesses and custom development. Including all revenues, apps are still likely to be bigger than Hollywood.
But there's more to the story. It's also likely that the App industry is healthier. On an individual level, some App developers earn more than Hollywood stars ((so do YouTube stars, but that's another story.)) and I would guess that the median income of app developers is higher than the median income of actors. ((A large majority of actors earn less than $1,000 a year from acting jobs)) The app economy sustains more jobs (627,000 iOS jobs in the US vs. 374,000 in Hollywood) and is easier to enter and has wider reach. As the graph below shows It's also growing far more rapidly.
The curious thing is that even though the medium of apps is swamping other forms of entertainment in all measurable ways, comprehension of the phenomenon is lagging.
Apple has declared that what used to be "Other Music Related Products and Services" ((Includes revenue from sales from the iTunes Store, App Store and iBookstore in addition to sales of iPod services and Apple-branded and third-party iPod accessories.)) plus "Software, Service and Other Sales" ((Includes revenue from sales of Apple-branded and third-party Mac software, and services.)) which was formerly known as "iTunes/Software/Services" ((Includes revenue from sales on the iTunes Store, the App Store, the Mac App Store, and the iBooks Store, and revenue from sales of AppleCare, licensing and other services)) is about to become "Services".
"We'll also have a category that we refer to as services and this will encompass everything we report under the heading of iTunes software and services today including content, apps, licensing and other services and beginning this month it will also include Apple Pay."
"Services" will therefore encompass a massive amount of revenue. The reported revenues for the fiscal 2014 were $18 billion. Including all billings, the turnover in sales is over $28 billion. For next year, assuming that Apple Pay, which is just getting started, is unlikely to contribute greatly to revenues, Services turnover will top over $35 billion. That figure would make Apple Services alone one of the top 90 companies in the Fortune 500.
Regardless, as a component of overall sales, the group formerly known as iTunes/Software/Services (shown in red above) was a modest 7% of total sales in the last quarter. Using all available information regarding downloads, payouts and reported financials, an estimate can be obtained on how this 7% is itself divisible into nine sub-segments:
Pro Apps
Music
Video
Apps
Books
OS X
iWork
iOS Apps
Licensing and other income
These are shown above as either contributing to statement of operations (i.e. as reported, on right) or using billings (or the actual "cash register takings", on left). ((The primary distinction is in Apps billings where the 70% paid to developers is not shown as revenue.))
What would be ideal in understanding this Services segment would be to break the "Licensing and other income" into its component parts. Namely:
Licensing revenues including Google's payments for traffic acquisition (TAC)
AppleCare
iTunes Match
iTunes Radio
iAd
iCloud
(and soon, Apple Pay)
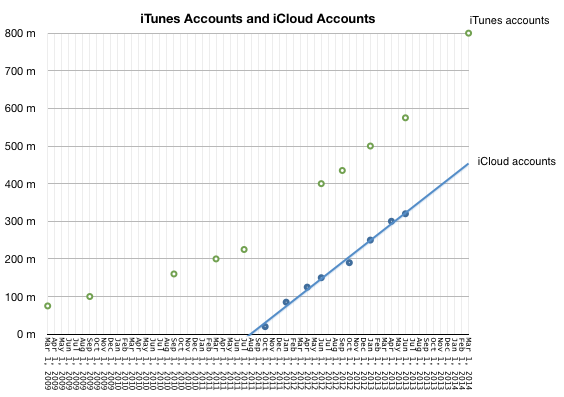
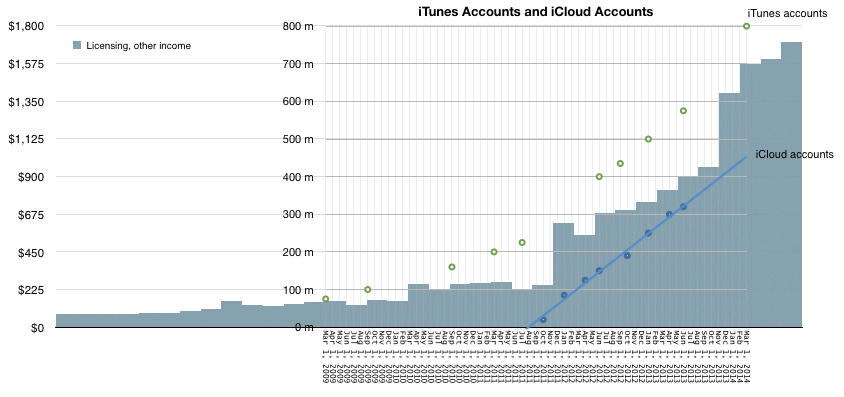
In particular, it would be very interesting to know exactly how much revenue could be coming from iCloud. We have not heard from Apple on iCloud user numbers since mid-2013 and this was the data at the time:
Couple that to "Licensing and Other Income" as deduced from Services accounting yields the following picture:
It would appear that iCloud accounts are growing in proportion to "Licensing and Other Income". Note that at the point that iCloud accounts were zero, revenues from Licensing were about $225 million/quarter and growing slowly. The real growth kicked in when iCloud accounts started ramping up. Since revenues from iCloud has to be in the "other income" and since no then it is, I believe, reasonable to assume that the iCloud user base growth is a principal driver of growth ((Of course, AppleCare could also be a driver but AppleCare should follow overall device sales patterns and this is not clearly evident in the Licensing/Other curve))
Also, bursts in the Licensing and other income line occurred after several iCloud-specific marketing events:
Mobile Me migration started in October 2011 and on September 30, 2013 the complimentary iCloud storage plans expired and were automatically adjusted to the free 5 GB plan (with an offer to upgrade to a paid plan). Correspondingly, Q1 2012 and Q1 2014 showed the largest increases in Licensing and Other Income.
This is a multiplication of many assumptions, but there is some intuitive logic. The only place iCloud can be found seems to be growing in proportion to iCloud users and plan marketing.
So how much does iCloud contribute to Apple's sales? My guess would be about $1 billion per quarter. That would be spread over 500 million iCloud accounts and therefore an average revenue per account of $2/user/quarter or $8/user/yr.
The lowest non-free iCloud pricing is about $12/yr (5GB plan is free). This would imply that two thirds of iCloud users are paying users (and one third are opting for the 5G plan).
I realize that this attach rate to a paid service is astronomical. Anything over 10% is unheard of. I would say the error in my estimates could be 20% but that still leaves a huge gap to what seems reasonable.
[Put another way, if the attach rate were only 10% then iCloud revenues would have to be in the $600 million range and thus only about 10% of what Licensing and Other income seems to be. This would force the question of what could be generating the remaining $5.6 billion/yr.]