Asymco

Asymmetric Intelligence

net income

  1. On the future of Google. Part 2

    Research · 72 comments

    In Part 1 of a look at Google's future I showed that Google's revenues have been highly correlated with the population of Internet users in the markets it serves. If there were a causal relationship between population of users and revenue growth then the company would face a growth inflection point when that population becomes half penetrated.

    In Significant Digits Episode 1 (Part 1) I showed data which suggests that the inflection point will come in 2016. Essentially the argument is that Google's growth is ultimately limited by the population of users and that itself is a predictable number. I also used the example of the PC and smartphone penetration curves to show how the perception of the fortunes of companies whose revenues are based on those technologies were affected by inflections in their respective adoptions.

    However, correlation is not causation. These users we count are not the customers who pay for Google's services. Users (or usage) is therefore only a proxy. It may be a good proxy and intuitively it makes sense that it's a driver of growth but fundamentally the company lives on a stream of revenues paid by advertisers ((This is true to date and certainly it could change but hints of how that might change are still not visible to me)). In order to really evaluate the opportunity we need to "follow the money" and track down where it comes from.

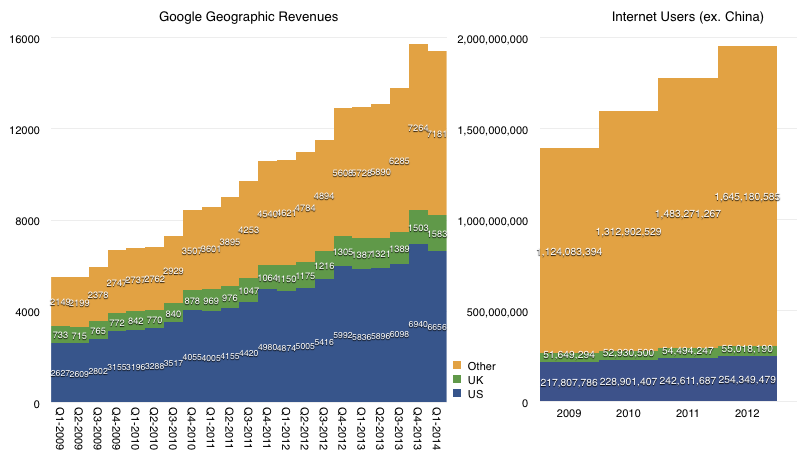
    We don't have visibility into the exact sources of these revenues but we have a top-level geographic segmentation (shown below.)
    Screen Shot 2014-04-17 at 11.15.09 AM

    The data shows that in the most recent quarter 53% of Google's revenues came from the US and UK. Five years ago the proportion was 61%.  Clearly then about 10% of the mix shifted to non US/UK.

    If we exclude China, US and UK, in 2009 there were 1.07 billion Internet consumers. By 2012 there were 1.59 billion users in those same territories. The growth is therefore almost 50%, and this excludes 2013. The corresponding growth in the US/UK was 15%. We should also note that in the same time frame, there were almost a billion Android activations but the number of new users in the US ((as measured in comScore)) was only about 70 million (or 7%).

    It's therefore clear that whereas the population of Internet users and the ways they might access Google exploded in the last five years, Google revenues have come disproportionately from US/UK consumers. Or, at least from US/UK advertisers, which we are assuming are primarily targeting local users.

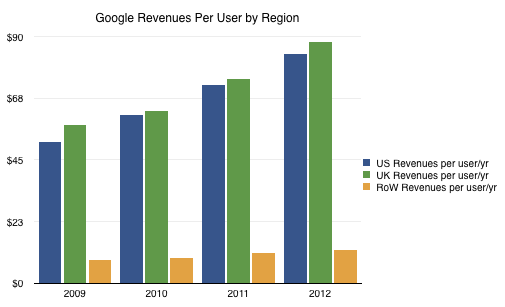
    The result is the following revenue per user per year based on where the users reside:
    Screen Shot 2014-04-18 at 8.28.15 AM

    The disproportionate weight of US/UK income and the low growth of income from rest-of-world vs. the far faster growth of usage outside the US/UK means that the toughest nut for Google to crack is not penetration but emerging market monetization.

    The disparity is enormous. US/UK revenue is on average $86/user/yr (2012) and rising. The rest of the world only manages $12/user/yr. That Rest Of World includes many wealthy countries such as all of Europe and Japan. So the problem for Google is that it has an order of magnitude less income per user in the part of the internet which remains unpenetrated and the trends show that they are not narrowing the gap. ((The ratio between average US/UK and RoW revenue per user/yr was 6 in 2009, 7 in 2010, 7 in 2011 and 7 in 2012))

    Google's R&D efforts seem to be oriented around creating consumption (Making it Rain) but the problem is that the quality of that consumption and the indigenous sources of income are unaddressed. These problems are structural and based on social constructs which don't change at the pace of technology adoption.
     

  2. Samsung Electronics Segment Revenues and Operating Income in Context

    Research · 42 comments

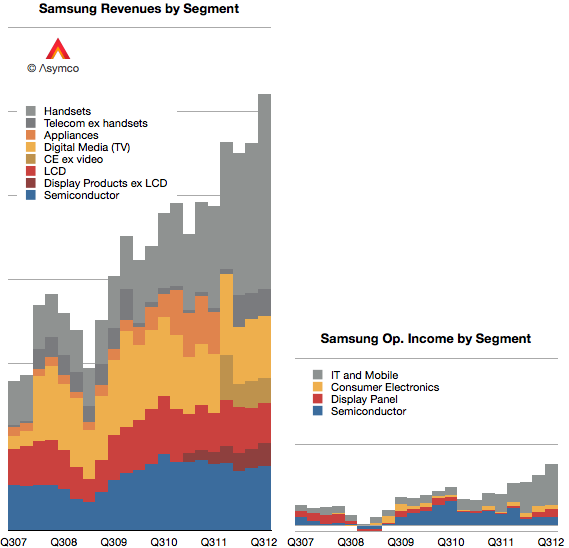
    As first introduced last week, Samsung's revenues have grown primarily due to the expanding volumes of smartphones. In today's post I convert the revenues and operating incomes to US Dollars and compare them to a set of companies.

    First, I should note that Samsung has changed both the designation of its divisions and the way it reports revenue. Broadly speaking, Samsung Electronics has four major divisions:

    1. Semiconductors. This includes memory products as well as systems such as CPUs.
    2. Display products. This used to be called "LCD" but has been re-named Display Products.
    3. Telecom. This is mainly mobile phones but includes additional products and services for telecom operators and PCs. The division has recently been re-named IM (IT and Mobile communications).
    4. Consumer Electronics. This group has changed names from Digital Media and Appliances to CE. The majority of sales value comes from televisions but also includes consumer electronics and appliances.

    The company further combines Semiconductors and Display Products into a group called DS (Device Solutions) and Consumer Electronics and IM into DMC (Digital Media & Communications).

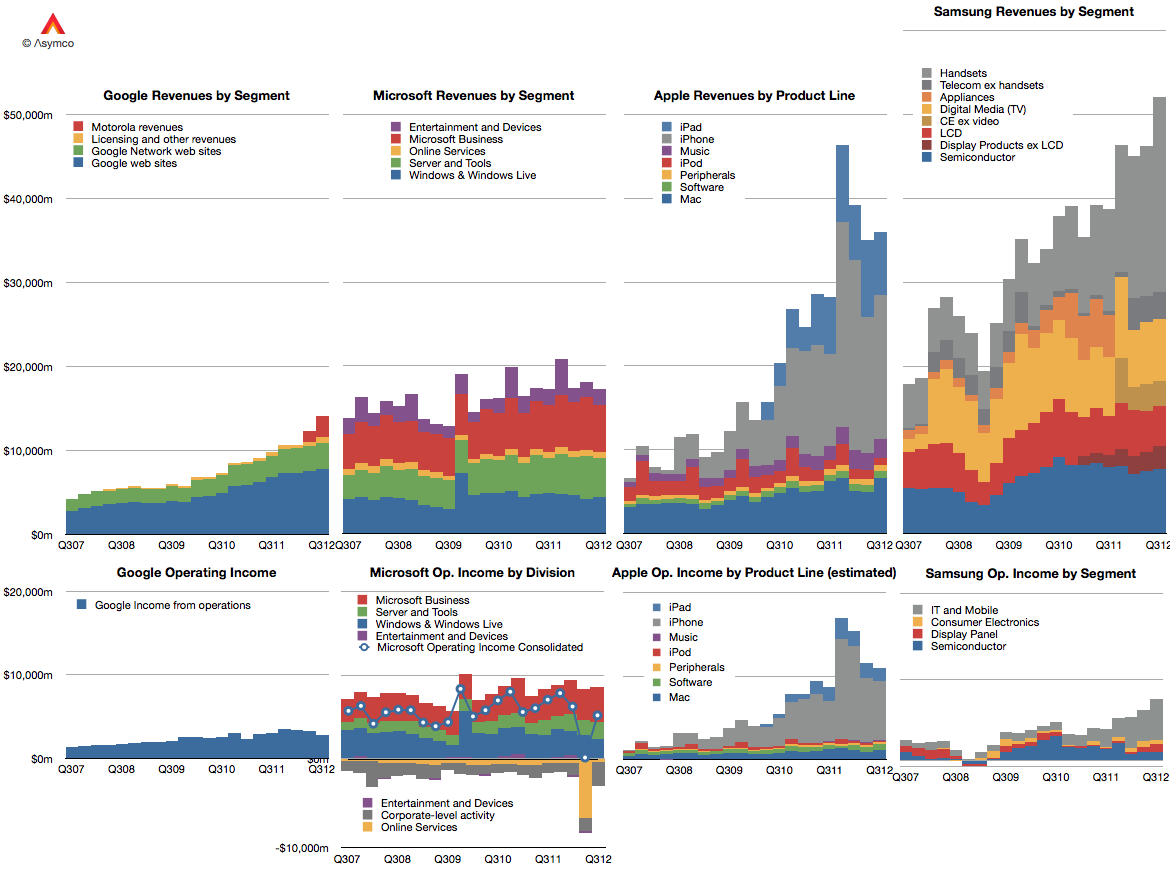
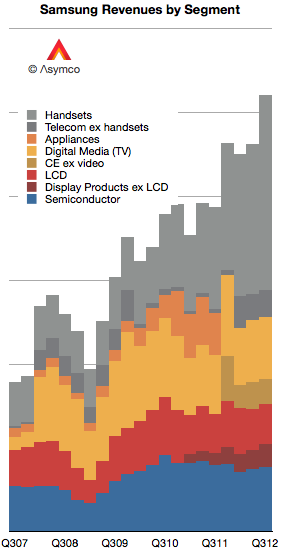
    I tried to reconcile these various nomenclatures with color coding in the following graph. Semiconductors are blue, Display components are red, Consumer Electronics are Yellow and Mobile are grey.

    Each gridline represents $10 billion.

    One more point to note about revenue recognition: Relatively recently the company has switched from reporting consolidated revenues to gross revenues. This means that current sales include inter-segment sales. So, as much as it is possible, the data above shows sales from division to division as well to external customers.

    When it comes to reporting operating income, the company offers four segment values: Consumer Electronics (Appliances, TV, "Digital Media"), IT and Mobile (including mobile phones), Display Panel (formerly LCD), and Semiconductor.

    I used the same color coding to show the income values in the same scale as the graph showing income:

    It's now possible to compare Samsung Electronics with Google, Microsoft and Apple in terms of divisional (as a proxy for product-line) revenue and profitability over a five year period.

    At this time, a portion (majority?) of Samsung's grey area in the operating income graph represents the vast majority of profits obtained from Android across the entire ecosystem.

  3. Who will be Microsoft's Tim Cook?

    Research · 88 comments

    As previously noted, Apple has overtaken Microsoft (and Google) in operating margin percentage. This is an astonishing statistic as Apple is still largely perceived to be a "hardware company" while Microsoft is a "software company" and Google is a "services company."

    To suggest that "hardware" could be more operationally profitable than either software or services is akin to heresy in technology analysis. This reversal is newsworthy indeed. However, even the most casual observer would note that Apple does not derive its market power from hardware alone. It is, in fact, an integrated hardware, software and services company (with a few more roles besides.)

    So the emergent successful business architecture in this technologically transitional period is of integration and completeness of solutions.

    This shift explains at least at a conceptual level Microsoft's tectonic Surface shift.

    But what about another point of view? What does integration mean for Microsoft's income, cost and profit structure? Is integration self-disruptive to Microsoft?

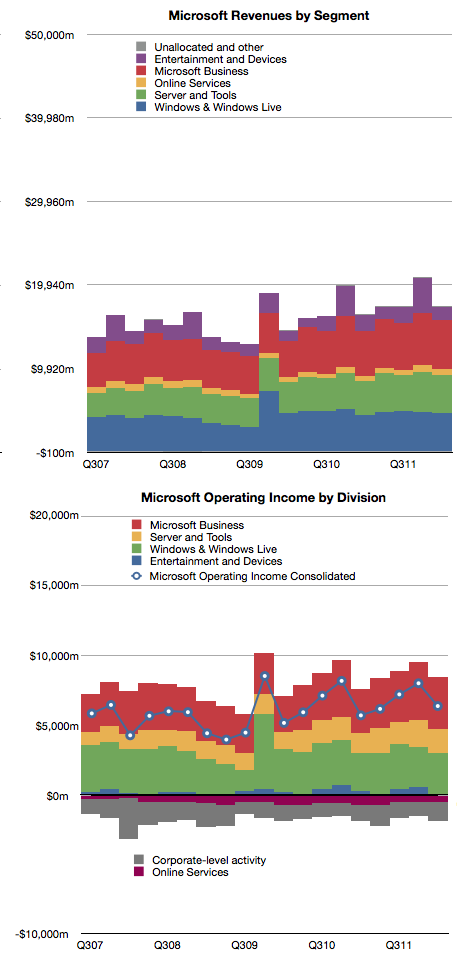
    Here's a reminder of Microsoft's revenues and operating income by division:

    The challenge of devices for Microsoft is that the licensing of software for devices is very difficult to sell.

    In 2011 Microsoft received about $18.7 billion in Windows revenues and $23 billion in Office revenues. The chart shows that this is a fairly steady growth business. According to Gartner, in 2011 there were about 336 million Windows PCs sold and that this too is a fairly stable and mature business.

    If we simply divide revenues by PCs sold we get about $55 Windows revenues per PC and $68 of Office revenues per PC sold [1]. The total income for Microsoft per PC sold is therefore about $123. If we divide operating income by PCs as well we get $35 per Windows license and $43 per Office license. That's a total of $78 of operating profit per PC.

    Now let's think about a post-PC future exemplified by the iPad. Apple sells the iPad with a nearly 33% margin but at a higher average price than Microsoft's software bundle. Apple gives away the software (and apps are very cheap) but it still gains $195 in operating profit per iPad sold.

    Fine, you say, but Microsoft make up for it in volume. Well, that's a problem. The tablet volumes are expanding very quickly and are on track to overtake traditional PCs while traditional PCs are likely to be disrupted and decline.

    So Microsoft faces a dilemma. Their business model of expensive software on cheap hardware is not sustainable. The future is nearly free software integrated into moderately priced hardware.

    For Microsoft to maintain their profitability, they have to find a way of obtaining $80 of profit per device. Under the current structure, device makers will not pay $55 per Windows license per device and users will not spend $68 per Office bundle per tablet. Price competition with Android tablets which have no software licensing costs and with iPad which has very cheap software means that a $300 tablet with a $68 software bill will not be competitive or profitable.

    However, if Microsoft can sell a $400 (on average) device bundled with its software, and is able to get 20% margins then Microsoft is back to its $80 profit per device sold. This, I believe, is a large part of the practical motivation behind the Surface product.

    The challenge for Microsoft therefore becomes to build hundreds of millions of these devices. Every year. Sounds like they need a Tim Cook to run it.

    ---

    Notes:

    1. Microsoft accounts for revenues using deferrals due to Software Assurance pre-payment models for many corporate customers so this figure is not a precise value for each license sold.


  4. The iOS App market sales run rate is $4 billion per year

    Research · 54 comments

    At the 2012 WWDC, Apple released new data concerning its App ecosystem. Namely:

    1. 30 billion apps downloaded to date (excluding updates)
    2. $5 billion paid to app developers
    3. 400 million iTunes accounts

    These three data points allow us to update our picture of the app economy. First, the app download rate.

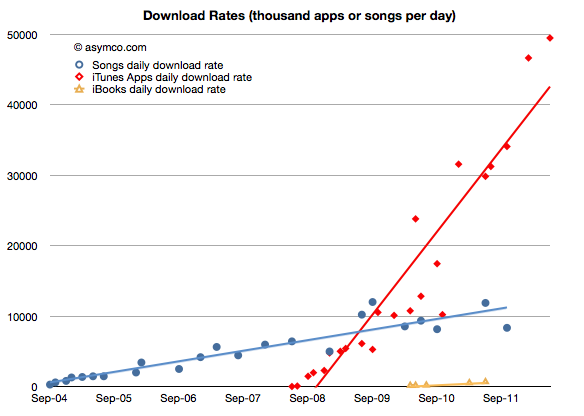
    As would be expected from an expanding user base, the app download rate has been increasing. It is now at about 49.5 million apps downloaded every day. The history of this rate is shown in the chart below:

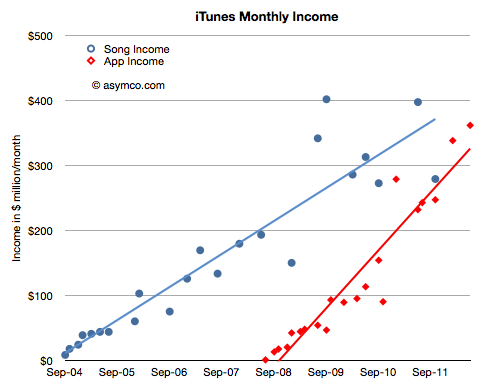
    I added the same data for iTunes songs and book downloads for comparison. Note that although music and books are available to the same user base (actually higher due to Macs and iPods which do not run apps,) apps are being downloaded at a far faster rate--at least four times faster.

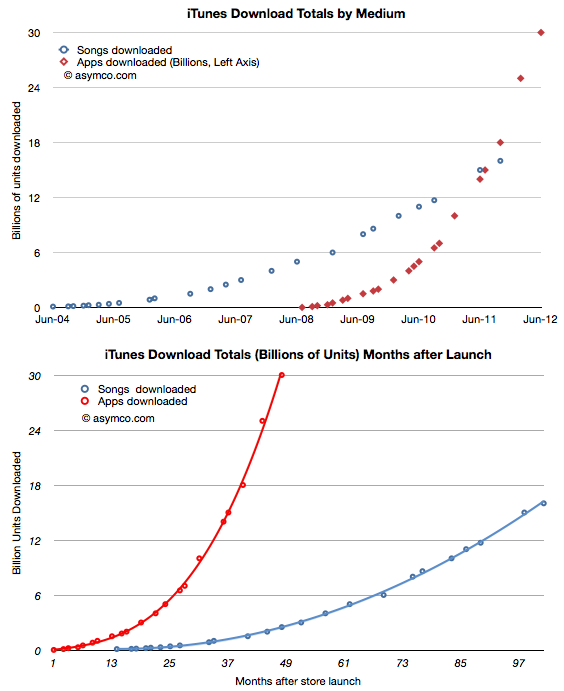
    In terms of total, cumulative downloads, the comparison is even more stark:

    It won't be long before total app downloads will be double total song downloads. Put another way, in the time it took the App store to reach 30 billion, the song store sold only 3 billion.

    On average, songs are more expensive than apps ($1.29 vs. $0.24). What is the difference in value, not just units?

    The data shows that apps have very likely overtaken songs as "gross" income. Apple does not book all app income, only the 30% share they keep, but in terms of transaction value, clearly apps are now a bigger business.

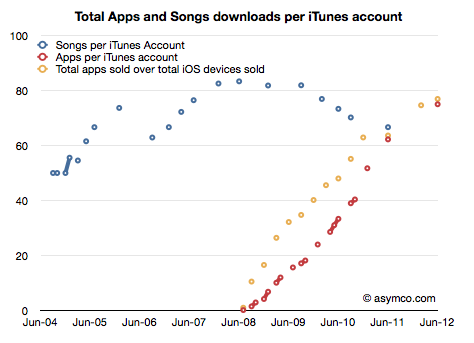
    What about consumption? Are individual iTunes account holders buying a constant or variable number of songs or apps?

    Here again apps show a distinctive pattern of out-performing songs. As far as digital media is concerned, apps are taking the download business by storm.

    What about pricing? Is the expansion of the user base into the hundreds of millions leading to a collapse in app pricing?

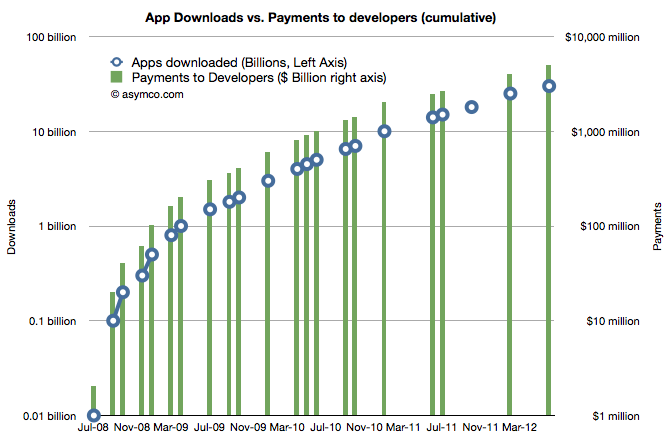
    No. You can see the price as the ratio between the downloads and the revenue to developers. If downloads scale more rapidly than payments then pricing is decreasing. As it turns out the average price of an app has held steady since approximately 1 billion downloads were recorded. That price is now about 24 cents per app (including free).

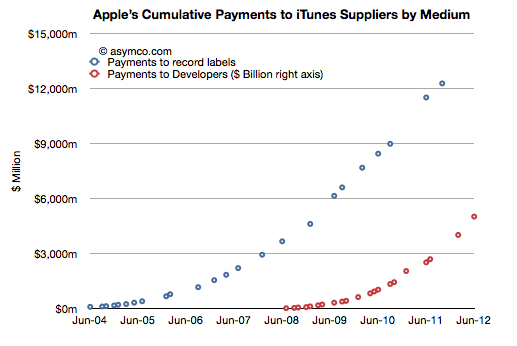
    Finally, how about the content owners? Are payments to the owners of the media beginning to favor developers over music publishers/promoters?

    Developers still have a long way to go. We can't be sure about how revenues are shared with music labels, but it's probable that they are still receiving bigger checks than developers. However, under some scenarios this will change quite soon.

    The bigger story here is that the iOS app economy has reached a run rate of $4.3 billion per year from a standing start four years ago.

    How big will the TV app economy be four years from the launch of an Apple smart TV?

  5. Shipped and sold: A brief introduction

    Research · 42 comments

    Markets are difficult to measure. Mainly because the information is not easy to obtain and that which is obtained is not made public. Collecting, analyzing and filling in the gaps is big business with many firms involved in selling it.

    However, with all the analysts and companies selling and promoting their "numbers" it's important to understand the difference between the methods used. There are for instance at least the following measurements:

    1. Units sold to end users. For example NPD or GfK data of retail transactions. Also Gartner's estimates for phone units sold.
    2. Units sold to the channel. For example units recognized on income statements usually reported by companies. Also IDC's estimates for phone units sold.
    3. Units in use. For example comScore and Nielsen survey data.
    4. Units "activated". The measurement Google uses to describe Android performance.
    5. Intent to buy. For example ChangeWave surveys of early adopters.
    6. Utilization rate. For example browser statistics.

    Each measurement tells a different story about the market but the best story is told when all data is analyzed in a combined integrated market review.

    Before diving into that it's important to understand the difference between the first and second measurements or the difference between shipped and sold.

    What does "Sold" mean?

    Let’s say that you sell a phone to another party. What constitutes a sale? The sales agreement? That you shipped it? That he wanted it? That you were paid for it?

    What if he changes his mind and returns it? Is it still a sale? What if a manager's bonus depends on these sales? What if the company’s share price depends on these sales? Is there a way to rig the accounting?

    As it turns out, yes there are; many ways. Unethical and fraudulent practices happen surprisingly often. A classic instance would be: A customer is shipped ten phones, though he only wants one, and he gets paid to ship the other nine back, after the close of the year.

    The sales manager records ten times the sales he actually made, making ten times the commission and the company’s stock price rises. To compound the offense, the manager could also tip his friends to short the stock at the end of the year, leaving investors “holding the bag” when the inevitable correction follows.

    There have been so many cases of this kind of accounting fraud that the FASB (GAAP), SEC, and IFRS have placed a very stringent definition on “revenue recognition”. This means that although you can sell all you want, the company can only recognize the proceeds and profit in the financial statements according to strict rules.

    In the case of hardware (Sales of Goods), the customer must receive it (“delivery has occurred”), and like it enough to not return it (“amount to be refunded”), and be able to pay for it (“collection is probable”). If some are projected to be returned or unpaid, that percent is subtracted from total revenue. In the case of software (Sales of Services), it is generally accounted for over a time period. And because it is customary to send the customer upgrades, the revenue must be spread out over the time the service is provided. (“upgrade rights … 24 to 48 months.”)

    It gets complicated when a piece of hardware has upgradeable software. The rules used to stipulate that the hardware, in its entirety, must be accounted for as a service and have subscription accounting. This is how Apple had to report sales during the first few years of the iPhone. It still defers some revenues for its hardware, mainly on account of iCloud, but the vast bulk of hardware revenue (96%) is now accounted upfront, recognized upon the product's acceptance by customers. 4% is for software upgrades and is accounted for over a specific lifetime of the product (24 months in the case of the iPhone).

    What does "Shipped" mean?

    The discussion so far implies that if a product that is accounted for as "Sold" on an income statement does not mean that it's in the hands of an end user. These "revenue recognized" products are sold to a distributor, typically for a phone that's an operator.

    These sales satisfy the requirements for financial reporting as revenues booked. But they are not in the hands of users. Nor are they "activated" and they don't generate page views that are measured by web analytics companies. Most analysts and companies now use the phrase "Shipped" to describe these revenue-recognized units though it's also common to hear "sold".

    When a product sells to end users it's sometimes called "sell-through". It's counterpart is "sell-in" which is sales to the channel distributors.

    A big gap between sell-in and sell-through might imply large amounts of in-channel inventory. This is product that is sitting either in stores or in warehouses or on trucks in transit. If sales are steady, the inventory is measured in time as in "weeks of inventory". This means that the excess is expected to be sold within a fixed time frame if shipments were to end. The smaller this amount, the better or "tighter" the operations are. Inventory, as Tim Cooks says, is fundamentally evil. It eats capital and erodes profitability.

    Sometimes miscalculation of sell-through could result in vast amounts of inventory that has to be returned by distributors. That inventory is either written off or sold at fire sale prices resulting in a "write-down". This happened recently with both the HP TouchPad and with the RIM PlayBook. This special charge against income is a one-time (usually) incident but it can also affect a firm's reputation with channel partners for a long time. This type of failure is very costly.

    Therefore what matters most is to keep the difference between Sell-in and Sell-through as small as possible. However, it can't be too small. Sometimes if Sell-through is too fast, you get stock-outs which means that there is more demand than supply and sales opportunities are missed. This has happened many times with iPhones and iPads. This is also an unwanted situation (unless there was too much inventory in the channel during the previous period and thus it was being drained in the current period.)

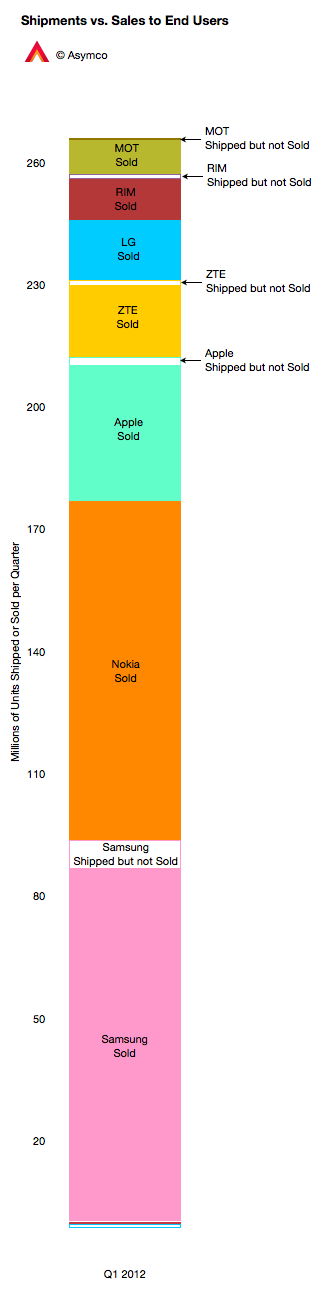
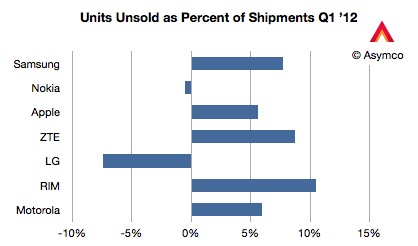
    The chart to the left shows how the phone market looked for various vendors last quarter. I compiled the data based on Gartner's "sales to end users" and IDC's "shipments" data. Two vendors had higher sell-through than sell-in (Nokia and LG) probably because they were draining excess inventory. The others had channel inventory of between 5% and 10% of units shipped.

    This ratio is shown below in a chart comparing the largest phone vendors.

    Management is often rated for performance on this metric, as they should be, since it's a measure of operational skill. However, there are many factors that affect overall performance.

    New product launches, windows of opportunity related to seasonal buying patterns, anticipating macroeconomic slowdowns, even natural disasters and legal challenges can affect this metric.

    Understanding the overall market requires an appreciation of this distinction but also an understanding of all the other metrics listed above and what stories they tell.

    ---

    Notes: My thanks to Michael Dediu for input on this discussion.

  6. An interview with Chris Brennan for MacUser magazine UK

    Research · 30 comments

    Chris Brennan asked a few important questions regarding potential saturation of the iPhone market.

    Is the iPhone anywhere near saturation? Can Apple continue to shift iPhones in ever increasing numbers or is a sales plateau realistically on the horizon?

    The market for mobile phones is approximately 5.5 billion connections, perhaps 5 billion users. The iPhone has approximately 300 million installed base. I consider a base of 1 billion users to be a minimum for continuing participation in this market long term. Licensed platforms will reach this in no more than two years. I don't know what Apple's ambitions are but if they don't triple their base I don't see a strong future for the company in mobile phones. In order to triple the base the company will need to sell substantially more than an additional 700 million iPhones. The retirement rate can be as high as 50% of installed base. Apple will need to sell at least 1 billion iPhones in the next few years. Seen another way, Apple has a market share of about 9% on a quarterly basis. This needs a lot of improvement. Chinese vendors are not standing still.

    Can the Mac also continue to outperform the rest of the PC market for long?

    The PC market is in decline. It will continue to decline as its disruption continues. The PC market will still exist 10 years from now but, similar to the mainframe market, it will be hard to notice. Apple is doing a fine job carving out a large portion of that market for itself but overall it's an increasing portion of a decreasing pie. It would be better to track the share of profits captured or even share of value rather than units. The reason units were important 20 years ago was because platform dynamics determined whether a marginal platform could survive. Would a 5% share be enough to attract developers? That is no longer an interesting discussion. Applications for PCs are not an area of investment for any significant pool of capital. Development has moved almost entirely into mobile or web. Therefore, as the PC is now a commodity product, the best performers are those who can capture a larger margin. Those margins should be subsequently be invested in new platforms. PC vendors who neither capture margin, nor invest in new platforms are strategically insolvent.

    Finally, this exponential growth of Apple products has to end some time soon doesn't it? How many high-income buyers for expensive products can there be left for Apple to target?

    Trying to calculate the limits to growth is futile. There are limits but they are not calculable and inaccurate estimates don't offer any useful information.

    In 1939 a total of 921 military aircraft were built in the United States. Five years later, in 1944, annual production was 96,318. A question could have been asked by an aviation analyst in 1939 about whether the American aircraft industry could grow. Aircraft, especially multi-engined ones used by the military were _extremely_ expensive. The reason an industry grew exponentially making extraordinarily expensive products was not because of organic demand but because the primary buyers engaged in a cataclysmic global war. In other words, there was a will to buy and hence there came a way to build. Therefore the answer to the question of sustainable growth comes not from an analysis of demand but from an analysis of the consequences of not growing. Not growing would have meant the end of many nation states.

    Your question was framed by an implied market categorization: that buyers are either high-income or, presumably, low-income. This is a false dichotomy. Buyers are either needful of a job to be done or not. If the job is important enough, money will be found to hire a product. Sellers of products will also find ways to meet the demand through lower prices and increased capacity. Every product Apple makes used to be out of the reach of all consumers. Whether computers (portable or not), music players and professional grade software, voice recognizing personal assistant cellular phones and tablets are all luxuries or necessities is only a question of timing.

  7. Android's contribution to Google

    Research · 42 comments

    Yesterday I presented the estimated Android income statement vis-à-vis Apple's income statement. In this post I'll compare Android as a part of Google's overall business.

    Recall that Google has already been compared in terms of overall revenue, growth and profitability to Apple and Microsoft here.  The argument can be made that mobility has not yet had a measurable impact on Google (certainly not noteworthy enough to be reported by management).

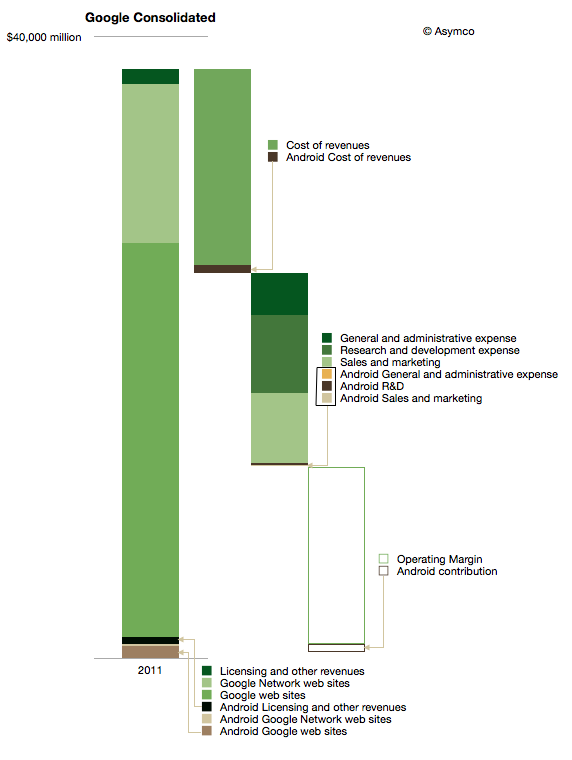
    The impact on Google of Android can be shown in the following diagram:

    I used color coding to identify non-Android (Green) and Android (Brown) segments of the business. Overall, Android could amount to about 3.5% of total Google revenues and about 5% of operating earnings.

    It's important to note that this is not all the revenue that Google obtains from mobility. This diagram represents Android only and there are revenues also coming from alternative platforms and operator deals.

    iOS contributes between 3 and 5 times more ad revenue to Google than Android.[1] The contribution to earnings is even more difficult to assess. We don't know the terms between Google and Apple for search revenue sharing and placement. One analyst suggests that the cost of sales (TAC) for mobile Safari search could be as high as 60%, far above what Android traffic costs.

    The other observation is that Android cost structure is quite small (see third bar from the left above.) My estimate is that Android R&D is only about 3% of total Google R&D. I'm projecting $200 million for 2012. That implies between 700 and 900 headcount. It's interesting to compare that total to the 20,000 or more that came with the Motorola acquisition.

    Having these estimates allows one to calculate many ratios and potential valuations. I'll refrain from putting a value on Android using multiples or sales or earnings, but would come out well below what was paid for Motorola's $12.5 billion.

    Which again compels one to ask what is the strategy at work here.

    ---

    Notes:

    1. There are various reports of the ratio including congressional testimony and reports to courts. BlackBerry, Docomo and KDDI were listed as significant other sources of ad revenue by Google in 2010.
  8. Android Revenues in Perspective

    Research · 90 comments

    Data is useful only when put in perspective. Yesterday's post on the Android Income Statement showed how sales and revenues are captured and how costs are paid for that revenue. The data was shown for the entire calendar year 2011 and the maximum value in the vertical axis was $1.5 billion.

    Google has also reported that their revenue "run rate" is now in excess of $2.5 billion so there is significant growth, as would be expected from an exponentially increasing user base.

    However, it's important to place this growth in perspective, both in absolute and in relative terms.

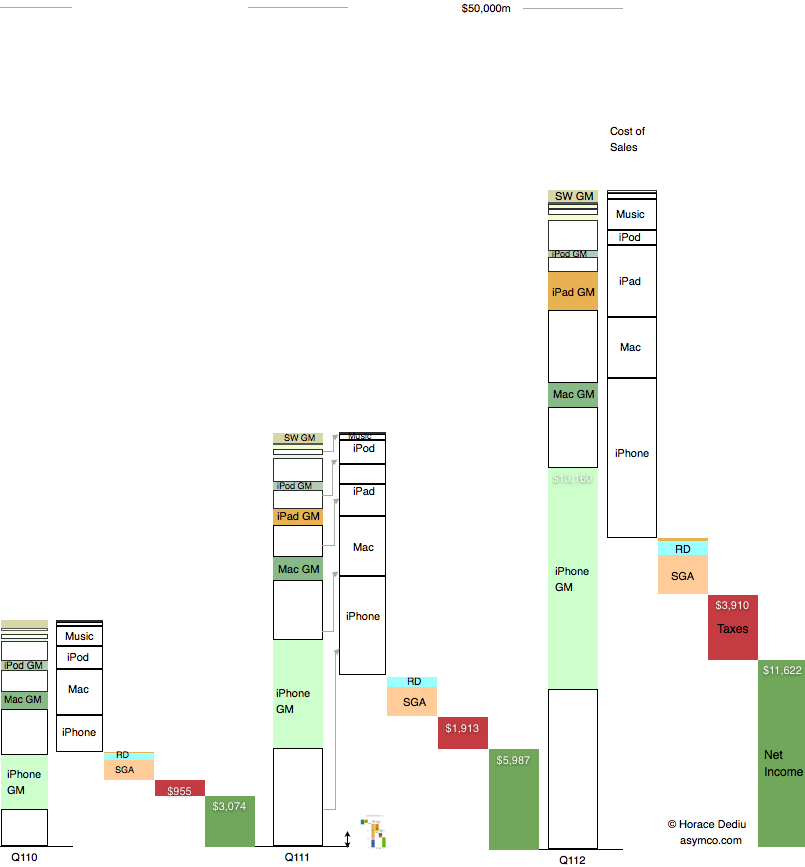
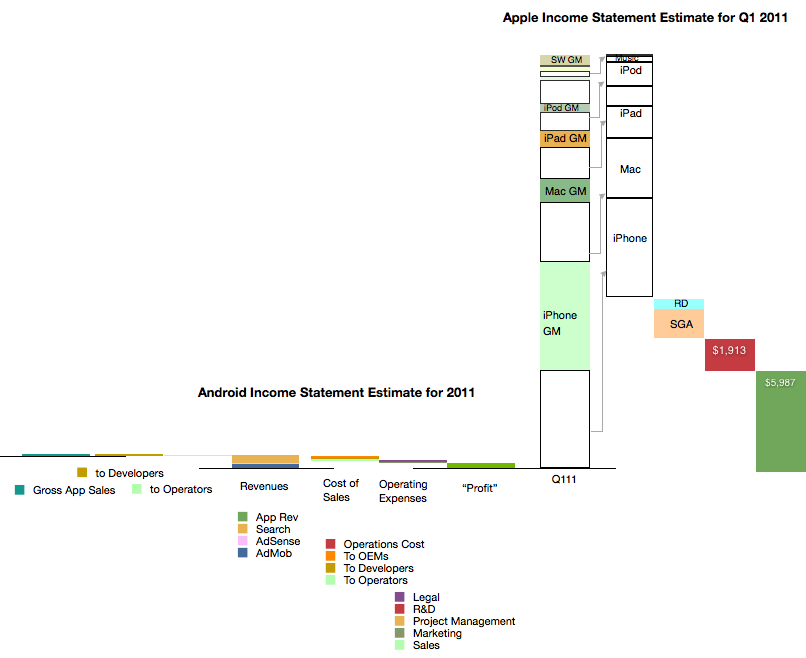
    Below is a diagram showing Apple's revenues for the first calendar quarters of 2010, 2011 and 2012. Each product group (iPhone, Mac, iPad and iPod) is shown separately with estimated gross margins (GM). Operational costs, taxes and net income are also shown.

    Consistent with previous versions of this data are the color schemes where white areas represent costs of goods sold.

    I also placed a scaled version of the Android Income statement next to the first quarter 2011 revenue bar for Apple. The scale is maintained where $1 billion is represented by the double-ended arrow line.[1]

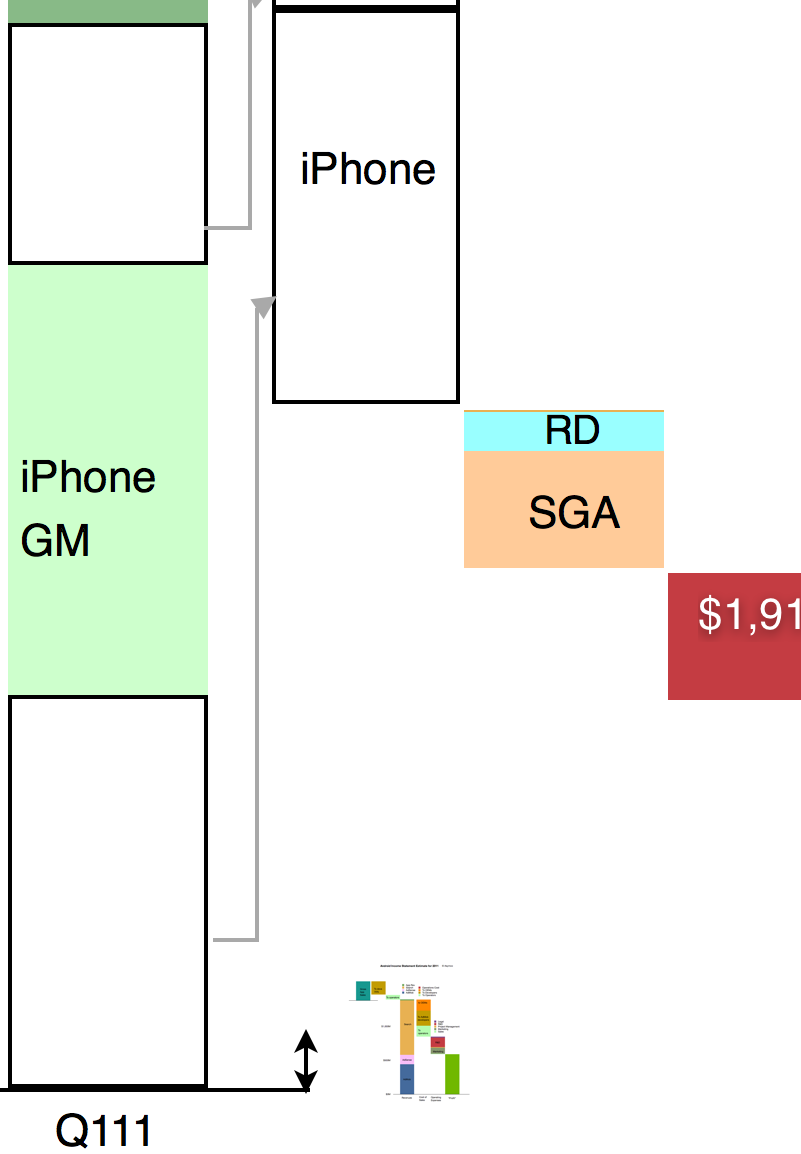
    It might be hard to see the Android section of the chart so I expanded it below at 400% the original:

    It is still difficult to resolve the data at this resolution but the picture should become clear nevertheless. Keep in mind that the iPhone data is for one quarter while the Android data is for one year. Comparing revenue "run rates", on a yearly basis Android is 2.5% of iPhone or 1.6% of iOS.

    As various members of the Android ecosystem are rewarded from the 40% revenue share of Android, it would be important to consider the scales involved in these illustrations when considering the influence Google exerts. It could be argued that Google's spreading of wealth from search creates strong incentives for participation in its ecosystem.

    However, there is little wealth created. 40% of a little is a lot less.

    ---

    Note:

    1. The scaling of the image in both X and Y dimensions can be deceptive. I provide the following view where only the vertical dimension (value) is reduced for Android
    1. :


  9. The Android Income Statement

    Research · 39 comments

    This is a continuation of the "Android Economics" series of posts. It deals with how revenues and costs are categorized for Android.

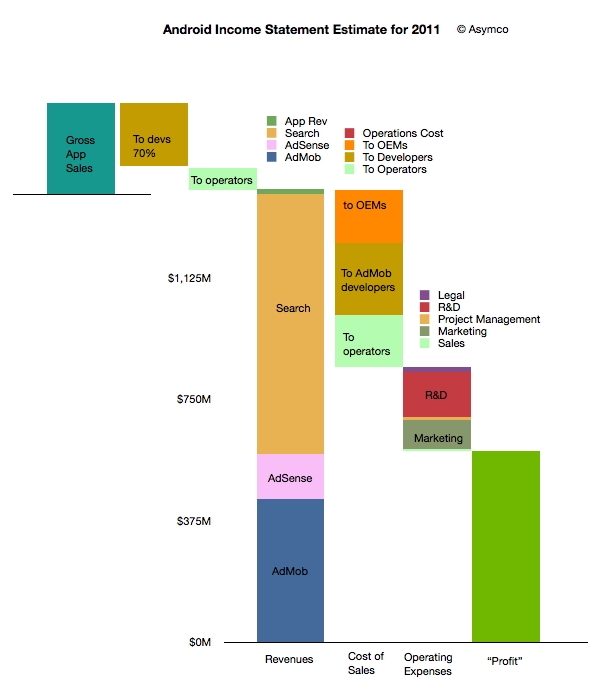
    The following diagram shows an approximate representation of what Android's "Income Statement"[1] would look like.


    I'll discuss the assumptions that are built into the model as I go along. I'll begin at the upper left and move toward the lower right in the discussion.

    The first thing to note is that sales from Google's (formerly known as Android Marketplace) Play are not registered as revenues. This is because Google, like Apple, treats itself as an agent. Agency means that the revenues don't "belong" to the agent but get passed on through to the primary beneficiaries. In the case of Play, Google passes 70% to developers (or content owners) and then distributes on average 25% to network operators (or carriers).

    I emphasize on average because there are many cases where Play transactions are not handled by or don't pass through operator billing systems. In those cases where operators are involved, it's possible that they capture more than 25%. It's not uncommon for operator billing to capture 45% of a transaction's value. The reason for this is that there is significant collection risk on billing--far more risk than on credit cards. It would also imply that on some transactions Google may be paying out more than it receives.

    This means that on average about 5% of Play content sales to be booked as revenues for Android.

    This 5% ends up a quite a small amount if overall app sales are small. We don't know the exact amount but anecdotal evidence from developers seems to indicate that they receive far more revenues from ad sales than from direct app income. Hence the size of the Android app sales is overall, modest. My estimate is that in 2011 there were about $330 million in gross app sales through the Android market. (Google estimated its sales to be 76 million for 2010 half way through that year.)

    The bulk of revenues are therefore from other sources: Search, AdSense and AdMob. I'm modeling that overall revenues are based on a "revenue per device in use" multiplied by the number of devices in use. Google has publicly stated that they are targeting $10/device/yr. in revenues. This is probably ambitious as the amount was nearly that much in early 2010 but the number of devices bought by emerging market consumers exploded. As they are not actively targeted by Google's primary customers (especially in China), the average revenue per phone is likely to be much lower. I estimated $6.5 on average for 2011.

    However, even if we use $6.5 per phone per year, the total revenues are quite strong since there were likely more than 215 million users at year end[2]. That results in a total revenue base of $1.4 billion for 2011. Removing the app revenues results in about $1.38 billion from Search and AdSense and AdMob.

    How to allocate revenues to these three businesses is mostly guesswork. I used a split of about one third to AdMob, 10% to AdSense and the rest to Search. If we assume this split then the next step is to consider how to allocate costs to these sources of revenue.

    As discussed in the introduction to this series, the primary costs of sales for Search and AdSense are network operators and OEMs or phone vendors. They are the primary "channel" which ensure the flow of search terms to Google. As Google also explains, the channel receives revenue share--so-called traffic acquisition costs (TAC).

    I used an overall allocation of 39% for TAC. Crucially, this includes the payments to developers for AdMob traffic. The rule of thumb I used was:

    • Network operators get 20% of Search
    • Developers get 50% of AdMob
    • OEMs get the rest (of the TAC)

    The resulting split is shown in the column above with the "Cost of Sales" at the bottom. There are also additional operations costs which are negligible.

    After this 39% TAC (revenue sharing), Google needs to pay its operating expenses. This includes R&D, Marketing, Sales and Legal costs for the Android division (including AdMob). You can see the approximate values in the column labeled "Operating Expenses". This operating cost amounts to about 27% of sales, with R&D at 14% and Marketing at 9%. These rather high fixed costs make sense as there is a significant development work underway for Android.

    Finally, after these costs are allocated, the remainder is the contribution of the division. This comes to about 34% of revenues which is called the operating margin. Google has to attach depreciation from data centers and other costs as well as taxes before placing this into earnings.

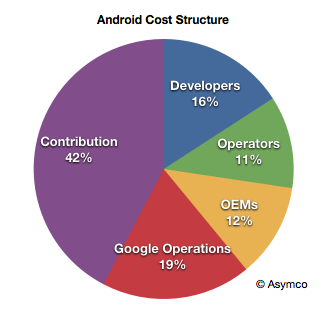
    Considering the agency structure, the overall cost structure of Android looks like this:

    When playing with the assumptions, it becomes clear that the model is most sensitive to the revenue per device and total devices in use. The profitability is entirely dependent on those figures as variable costs are a percent of sales and fixed costs are limited by talent constraints.

    For example, if revenues per device drop to $4.5/yr then the operating margin drops to 38%.

    Now we can calculate some of the more interesting figures. For example:

    • Android OEMs receive $0.76 on average per device per year
    • Android Operators receive $1.07 on average per device per year (including Play)
    • Android Developers, as a group, receive $1.94 per device per year (including Play and AdMob)
    • Google receives a contribution of $2.75 per device per year from Android

    Again, these figures are very sensitive to the revenue per device (currently assumed to be $6.5).

    Because of the number of devices involved, these cash flows are an important part of the value network of mobile computing. The next step will be to assess how they affect the incentives, alignments and competitive stance of various platforms vying for a seat at the table of the future of information.

    --

    Notes:

    1. An income statement shows the sources of revenues and the costs associated with those revenues. It also shows the fixed costs (or costs which are independent of revenues so they don't go up or down if revenues change). Finally it shows the operating income which is called contribution if it's a division within a company. This contribution is still subject to taxes and depreciation before it's recorded as earnings.
    2. I'm using Android installed base estimated based on daily activation rates as published by Google. I've discussed these estimates here. I'm using year-end estimates but subtracting retirements based on a two year device life.


  10. Google and Microsoft speak volumes with silence

    Research · 23 comments

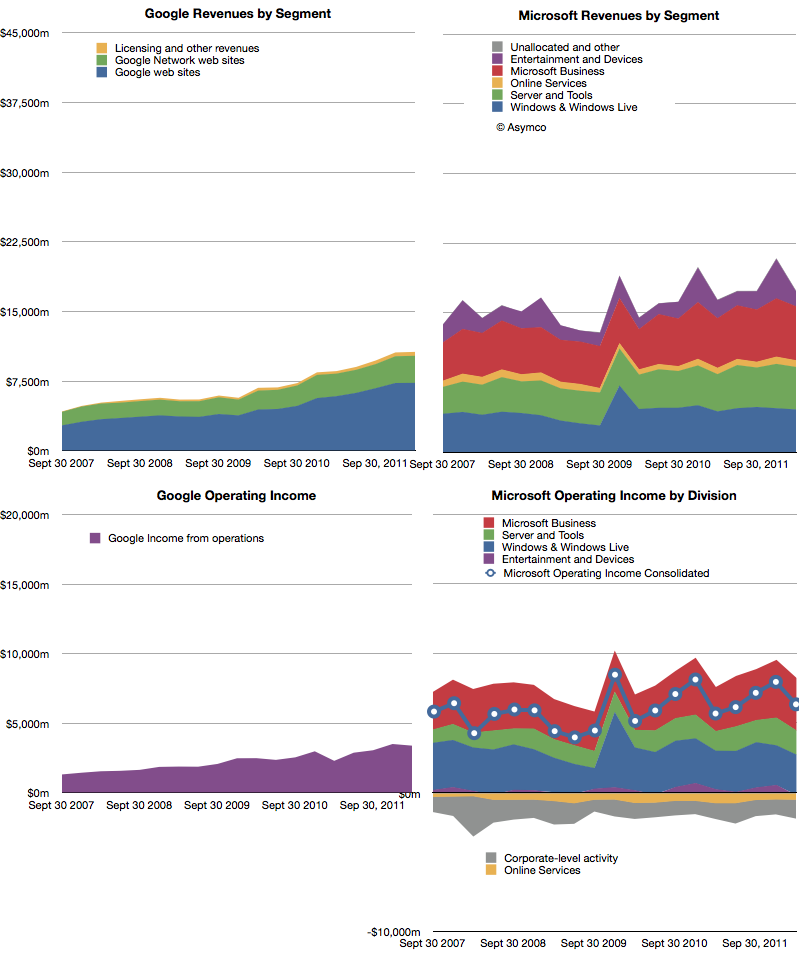
    The following charts show Google and Microsoft revenues and operating income:

    Both companies showed healthy growth. Revenues: Microsoft 6%, Google 24%. Operating Income: Microsoft 12%, Google 48%. Google had a particularly weak margin Q1 2011 so its income growth appears very strong.

    The surprise in Microsoft's performance was the 4.8% increase in Windows revenue at a time when PC sales were expected to be declining or flat. Final PC numbers are not yet out so we'll have to check back on this figure to see whether Microsoft has been able to get higher pricing for Windows or whether the market did expand. (Average revenues per PC sold have been quite steady for years). Overall, Microsoft's business shows consistency. Of course, that should not be cause for comfort. Nokia had remarkable consistency until it jumped from a burning platform and RIM grew more rapidly until its platform imploded.

    As Google still obtains 96% of its income from advertising, it's quite remarkable that it is now at 61% of Microsoft's revenues. Google is also growing more rapidly than Microsoft so the possibility exists that the top ad service will overtake the top software company in revenue, establishing a new benchmark for how software can be monetized.

    The curious thing about both of these companies' financial performance is that mobility does not appear to have had any impact on either top or bottom lines[1].  There is no business division or income statement line that can be attached to mobile revenues. Microsoft placed Windows Phone under Entertainment and Devices but that division is dominated by Xbox and accessories. Google bundles everything under Advertising and has never broken out mobile, much less Android-derived income.

    The surge in valuation for mobile-focused startups seems to leave investors in both these companies unaffected. The damnation for both companies lies in mobility being non-core businesses whose strategies center on reaction and defense.

    ---

    Notes:

    1. Google does not answer specific questions about the impact of mobile on their business but they do acknowledge that there are traffic acquisition costs (TAC) associated with OEMs and Carriers who deploy Android. This means that there are costs of mobile sales (i.e. Search) but not to any measure of specific value.
  11. Android Economics

    Research · 88 comments

    Charles Arthur, writing for The Guardian, has noted that court filings seem to be revealing Google's Android revenues. If this is the case, we have a significant breakthrough in understanding the economics of Android and the overall mobile platform strategy of Google.

    The new data is a reference to a settlement offer Google made to Oracle of $2.8 million and 0.515% of Android revenues on an ongoing basis. The key assumption to make this data useful is that the $2.8 million offer represents 0.515% of revenues to date.

    In other words, that revenues from 2008 to end of 2011 multiplied by 0.00515 results in $2.8 million. That implies that revenues from 2008 to 2011 were $544 million.

    I think that's a fair assumption. I don't see why Google would offer a higher or lower royalty rate for years 2008 through 2011 than for years after 2011. The offer would seem to be 0.0515% in the future as well as retroactively in the past.

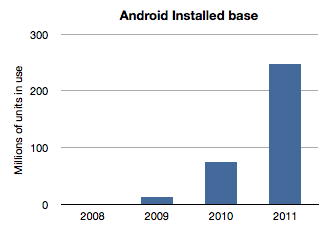
    If we work with this assumption then the next question is how to distribute this $544 million over the four years 2008 through 2011? The installed base of Android has grown exponentially and it would seem logical to assume that revenues have followed in a similar pattern. Here is a chart of installed base given activation data supplied by Google.

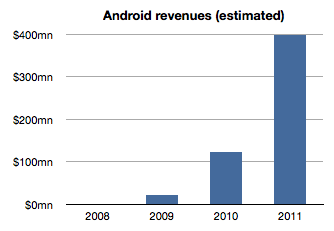
    If we assume revenues were distributed the same way we would get something like this:

    The sum of the bars in this chart equals $544 million and the ramp is approximately the same as the installed base. The relationship between the first graph and the second is a multiple equivalent to the revenue per device.

    Therefore a second assumption is that revenue per device remained fairly constant. In this model the revenue comes out to be about $1.70 per device per year. It's possible that rev/dev/yr. is increasing as Google services are discovered by users. It's also possible that the rev/dev/yr. is decreasing as later adopters are less likely to engage as early users. I just don't know how to adjust this value so by leaving it at the average, I can avoid introducing more assumptions.

    Now we can stop and look at this figure and do a test. Does $1.70 make sense as a device revenue for Android? Google had spoken about targeting $10/device/yr. but we have no indication that they are nearly at that level. If they did achieve that level, with an installed base of 300 million, Google could be collecting $3 billion a year in Android income. Are they getting it?

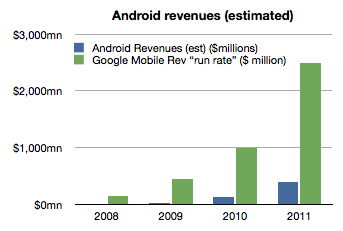
    As of October, Google mentioned that it had a $2.5 billion "mobile run rate". But we know that this figure is not only from Android. Mobile includes all mobile devices and services including those running inside iOS, Symbian, BlackBerry, Windows Phone, etc.  They could be counting ads on all mobile browsers as well as ads running inside all apps on all platforms. Furthermore, Google also testified that iOS accounts for two thirds of their mobile search revenues[1].

    Adding run rate to the Android revenue chart results in the following:

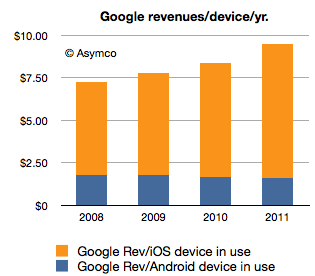
    So the step is to take the "run rate" figure of $2.5 billion and assume, as Charles Arthur did, that iOS income is what is left after taking out the Android part[2]. I also noted that Google previously mentioned a run rate of $1 billion and I will assign that run rate to 2010 and $2.5b to all of 2011. Since we know the number of iOS devices in use for years 2010 and 2011 we can calculate Google's revenues per iOS device in use.

    If we thus combine all the data we know (revenues derived from settlement offer, units in use, run rate and iOS installed base) we get the following revenue profile:

    This shows a positive trend for Google: revenues per smartphone per year is increasing. However, the growth is coming from non-Android devices which means mostly iOS. Revenues per device for Android is probably declining.

    The story for iOS revenues however is not all rosy for Google. Google has to pay for that revenue. The mechanism is a payment that Google makes to Apple for the prominent and default placement of Google search on Safari.

    We don't know the terms of the arrangement but if we assume $2/device Google needs to shave $2 from the top of the chart above with that money going to Apple (attached as iPhone/iPad service revenues.)[3]

    That still leaves a healthy $8.33 in 2011 as operating income from mobile with $1.70 or so coming from Android.

    However, to make this operating income into bottom line profit, we have to extract the R&D and SG&A associated with mobile at Google. This would be, therefore, Andy Rubin's yearly budget.

    Andy Rubin has stated in the past that Android is profitable. That is certainly believable. The budget would have to be about $400 million/year in 2011.

    Charles Arthur concluded that Google obtains four times more revenue from iOS than from Android. My estimates indicate that in 2011 the revenue ratio was closer to 5 but if we subtract the cost of those sales in the form of payments to Apple then the ratio could well be four to one.

    Many of these figures begin to "hang together" as we balance assumptions about costs, revenues and statements made in public. There is a consistency within a comfortable margin of error. If that is the case, then the economics of Android begins to take shape.

    My take is that it's not a bad business. But it's also not a great one. As long as there is exponential growth in units, Android will improve its position inside Google relative to iOS. But from Google's perspective, iOS is today a bigger business. And iOS is not standing still. It's growing not only in terms of units but in revenue per unit.

    Strategically, and historically Android was never one thing. P&L considerations were not the only (or even at all) factors in investment for Google. Having a hedge against hegemony of potential rivals, having a means to learn and develop new business and having a role in defining the post-PC computing paradigm are all probably bigger considerations than profitability.

    So in terms of returns, Android is sustainable. However, in relative terms the value created leaves much to be desired. Whereas Android generates $1.70/device/year and thus an Android device with a two year life generates about $3.5 to Google over its life, Apple obtained $576.3 for each iOS device it sold in 2011[4]. The economics of Android are nothing like the economics of iOS.

    ---

    Notes:

    1. This figure is also not conclusive as search is not the only form of revenue on a mobile device but it does imply that Android is not the majority of Google's mobile revenues.
    2. Clearly this is overstating iOS as the non-Android income is broken up between several platforms. We can only say that iOS is the vast majority of non-Android income.
    3. Assuming a $2/device payment model means Google paid $312 million to Apple in 2011 and $171 million in 2010. This would go toward boosting Apple's revenue per iOS device. Naturally, if this distribution cost is higher or would be subject to re-negotiation then it could vary widely.
    4. The iOS figure includes accessories and licensing of trademarks but excludes income from App Store, iTunes music, movies, TV shows, iBooks, greeting cards or textbooks.